title: project leader: project personnel:...
TRANSCRIPT

NARC On-Station
1
TITLE: Winter Wheat, Spring Wheat, Spring Barley and Safflower Variety Performance Evaluations Under Chemical Fallow Conditions On-Station at Northern Agricultural Research Center, Havre, Montana. 2006-2015.
PROJECT LEADER: Peggy F. Lamb, Research Scientist, Havre PROJECT PERSONNEL: Angela E. Sebelius, Research Associate, Havre
Phil L. Bruckner, Winter Wheat Breeder/Geneticist, Bozeman Luther E. Talbert, Spring Wheat Breeder/Geneticist, Bozeman Jamie D. Sherman, Spring Barley Breeder/Geneticist, Bozeman Joyce L. Eckhoff, Durum Breeder/Agronomist, Sidney Jerald W. Bergman, Safflower Breeder/Agronomist, Williston, ND Jim E. Berg, Research Associate, Winter Wheat, Bozeman Hwa-Young Heo, Research Associate, Spring Wheat, Bozeman Liz Elmore, Research Associate, Barley, Bozeman Debbie Kunda, Research Assistant III, Durum, Sidney Content: This report is intended to serve as a popularized 2015 summary of “primary” on-going cereal and oilseed crop variety investigations traditionally conducted on-station by Agronomy at Northern Agricultural Research Center. These data represent approximately 20 percent of NARC-Agronomy’s total research project effort on-station at Havre. The remaining 80 percent of the research not reported here includes cultivar and product evaluations associated with larger nurseries featuring early generation or other unnamed experimental materials not of general interest to the public; and/or experimental seed treatment, fertility, fungicide and insecticide evaluations. Long-term data summaries reported here are limited to the most recent ten years. This is largely due to need for report brevity and the fact that most varieties have approximately a 10-year life span before they are replaced in common use with newer materials having superior production characteristics. Variety performance data has been continuously collected and maintained at the Havre station for 100 years beginning in 1916. Collection of sawfly stem cutting data was added beginning in 2003. Detailed data pertaining to multiple performance characters, along with associated climatic and management inputs are presented for 2015. Abridged, multi-year summaries for each cereal trial are limited to three crop characters (yield, test weight and sawfly rating) while the safflower summary is limited to two crop characters (yield and oil content). Individuals desiring detailed data for other than the current year may contact the research center or refer to previous editions of this report for the year(s) of interest. 2015 Data: It should be noted that 2015 data tables in this report represent varietal performance for a single crop year at a single location only, and thus cannot be considered representative of performance expected when differing conditions due to location, year and management are imposed. Therefore, by itself, 2015 data shall not constitute in any form a recommendation for or against any entry or practice included. Please note that cereal research trial yield results recorded under wheat stem sawfly pressure are likely much higher than a producer should expect. Small plot variety trials are managed to assess maximum yield potential and are harvested in such a way that all stems and heads are picked up by the combine, regardless of lodging or cutting due to sawfly. Pickup guards coupled with an extremely slow ground speed and exceptionally low cutting height help researchers collect all heads in order to assess seed yield potential. If you are a producer in a wheat stem sawfly environment, although hollow stemmed varieties may be high yielding in research trials in your area, we recommend against growing those hollow stemmed varieties. Please be aware that if you seed hollow stemmed varieties with sawfly present, you are only creating a breeding ground for future generations of sawfly in your area and not helping combat the pest population. Multi-Year Summary Data: Use of a “Comparable Average” provides a mechanism for “estimating” the performance of varieties over a period of time longer than that for which actual data is available for them. This is accomplished by comparing the performance of a “variety of interest” for the years it was actually tested with that of a designated long-term “check”

NARC On-Station
2
or reference variety grown in the same trial in the same years. The performance of the variety of interest is then expressed as a percent of the check variety’s performance. This actual percentage or index is then applied to the actual long-term performance of the check to estimate the performance of the variety of interest had it been grown over the same long term. The reliability of comparable average figures improves with increasing years of actual evaluation, so no entries with less than three years of actual data have been included in long-term summaries. Other References: It is intended that this report be used as a supplement to variety performance summaries prepared by MSU’s Plant Science and Plant Pathology Department on statewide evaluations by the Montana Agricultural Experiment Station: Winter Wheat Varieties, Extension Service 2B 1098 (Revised February-March annually) Spring Wheat Varieties, Extension Service 2B 1093 (Revised February-March annually) Barley Varieties, Extension Service 2B 1094 (Revised February-March annually) These summaries include performance data, descriptions, quality assessments, disease and insect considerations, cropping district recommendations, cultural practices, and general crop production management information. These publications are available from MSU-Extension Service offices and can further be accessed via the Internet at http://plantsciences.montana.edu/cqlab/crops/index.html. Recognition: This research would not have been possible without the assistance of the following summertime hourly employees: Nathan Chapman, Kasee Clark, Rocky Kuhr, Derek Matosich, Kyla McNamara, Dakota Parsons & Kathy Wesley.
LIST OF TABLES
Table Page GENERAL CLIMATIC SUMMARY 3 COMPLETE LIST OF 2015 AGRONOMY CROP RESEARCH 4 WINTER WHEAT: Dryland Intrastate Winter Wheat Variety Evaluation Nursery (3502) 2015 Detailed Performance & Management Report .................................................... 1 9 2006-2015 Abridged 9-Yr Yield Summary .................................................................... 2 11 2006-2015 Abridged 9-Yr Test Weight Summary ........................................................ 3 12 2006-2015 Abridged 10-Yr Sawfly Summary ............................................................... 4 13 SPRING WHEAT: Dryland Advanced Spring Wheat Variety Evaluation Nursery (3102) 2015 Detailed Performance & Management Report .................................................... 5 14 2006-2015 Abridged 10-Yr Yield Summary .................................................................. 6 16 2006-2015 Abridged 10-Yr Test Weight Summary ...................................................... 7 17 2006-2015 Abridged 10-Yr Sawfly Summary ............................................................... 8 18 SPRING DURUM: Dryland Montana Spring Durum Variety Evaluation Nursery (9802) 2015 Detailed Performance & Management Report .................................................... 9 19 2006-2015 Abridged 10-Yr Yield Summary ................................................................ 10 20 2006-2015 Abridged 10-Yr Test Weight Summary .................................................... 11 21 2006-2015 Abridged 10-Yr Sawfly Summary ............................................................. 12 22 SPRING BARLEY: Dryland Intrastate Spring Barley Variety Evaluation Nursery (2102) 2015 Detailed Performance & Management Report .................................................. 13 23 2006-2015 Abridged 10-Yr Yield Summary ................................................................ 14 25 2006-2015 Abridged 10-Yr Test Weight Summary .................................................... 15 26 SAFFLOWER: Dryland Montana Safflower Variety Evaluation Nursery (7702) 2015 Detailed Performance & Management Report .................................................. 16 27 2006-2015 Abridged 10-Yr Yield Summary ................................................................ 17 28 2006-2015 Abridged 10-Yr Oil Percent Summary ...................................................... 18 29

NARC On-Station
3
Month Sep Oct Nov Dec Jan Feb Mar Apr May Jun Jul Aug Crop Year
Year 2014 2014 2014 2014 2015 2015 2015 2015 2015 2015 2015 2015
Precipitation (inches) Total
Current Year 0.83 1.08 0.38 0.30 0.66 0.41 0.34 0.34 2.53 0.79 3.86 0.53 12.05
Average (1916-2015) 1.14 0.65 0.44 0.45 0.44 0.32 0.54 0.99 1.84 2.56 1.45 1.20 12.02
Difference -0.31 0.43 -0.06 -0.15 0.22 0.09 -0.20 -0.65 0.69 -1.77 2.41 -0.67 0.03
Mean Temperature (oF) Average
Current Year 56.7 49.6 24.8 23.6 20.8 23.3 39.4 45.3 51.4 65.5 68.8 67.9 44.7
Average (1916-2015) 56.3 45.7 30.1 19.5 15.6 19.9 30.1 43.6 54.0 61.8 69.2 67.4 42.8
Difference 0.3 3.9 -5.3 4.1 5.1 3.4 9.3 1.7 -2.5 3.7 -0.5 0.5 2.0
Last killing frost in spring*
2015 May 20th (32˚)
Ave. 1916-2015 May 13th
First killing frost in fall*
2015 September 27th (31˚)
Ave. 1916-2015 September 20th
Frost free period
2015 131 days
Ave. 1916-2015 130 days
Growing degree days (base 50)
May 1-Oct 31, 2015 2464.5
Ave. 1951-2015 2370.5
Maximum summer temperature 98˚ F on June 29th and August 14, 2015
Minimum winter temperature -19˚ F on November 14, 2014 and February 4 and 5th, 2015
*In this summary 32o is considered a killing frost.
Summary of climatic data by months for the 2014-2015 crop year (September to August) and averages for the period 1916-2015 at the
Northern Agricultural Research Center. Havre, Montana.

NARC On-Station
4
15EXPER#Leg.xls Last Updated: 12/18/15
Experiment No. * Description Crop Ents Reps Plots Loc-Field Legal Desc Leader Sponsor Cooperator
ON-STATION
15-3502-WW Intrastate Cultivar Nursery WW 49 3 147 A-6-4 33 32N 15E Bruckner MAES-MWBC Lamb
15-1402-WW Advanced Cultivar Nursery WW 36 3 108 A-6-4 33 32N 15E Bruckner MAES-MWBC Lamb
15-5802-WW Sawfly Line Evaluation Nursery WW 49 2 98 A-6-4 33 32N 15E Bruckner MAES-MWBC Lamb
15-WQDS-WW Winter Wheat Quality Drill Strips WW 6 1 6 A-6-4 33 32N 15E Bruckner MAES-MWBC Lamb
15-WWMU-WW v Historical Winter Wheat Demo WW 60 1 60 A-6-4 33 32N 15E Lamb MAES-MWBC Sebelius
Sub-Totals: 5 200 419 8.30% of Total Plot Inventory
OFF-STATION
15-3851-WW Off-Station Cultivar Eval Nursery WW 25 3 75 Turner 13 36N 25E Lamb MWBC-MAES Cederberg Farm
15-3853-WW Off-Station Cultivar Eval Nursery WW 25 3 75 Loma 29 27N 10E Lamb MWBC-MAES McKeever Farm
15-5853-WW h Sawfly Line Evaluation Nursery WW 49 2 98 Gilford 05 30N 11E Lamb MWBC-MAES Wolery Farm
15-SR01-WW v Single-Row Yield Eval Nursery WW 312 1 312 Gilford 05 30N 11E Bruckner MAES-MWBC Wolery Farm
15-SR02-WW v Single-Row Line Eval Nursery WW 1000 1 1000 Gilford 05 30N 11E Bruckner MAES-MWBC Wolery Farm
15-3RSP-WW 3-Row Segregating Populations WW 114 1 114 Gilford 05 30N 11E Bruckner MAES-MWBC Wolery Farm
Sub-Totals: 6 1525 1674 33.15% of Total Plot Inventory
ON-STATION
15-3102-SW Advanced Yield Nursery SW 64 3 192 A-6-2 33 32N 15E Talbert MAES-MWBC Lamb
15-9802-DUR Montana Durum Cultivar Nursery DUR 14 3 42 A-6-2 33 32N 15E Eckhoff MAES-MWBC Lamb
15-3302-SW Preliminary Yield Nursery SW 81 3 243 A-6-2 33 32N 15E Talbert MAES-MWBC Lamb
15-SWMU-SW v Historical Spring Wheat Demo SW 60 1 60 A-6-2 33 32N 15E Lamb MAES-MWBC Sebelius
15-DQDS-DUR Durum Quality Drill Strips DUR 3 1 3 A-6-2 33 32N 15E Eckhoff Nippon Mills Lamb
Sub-Totals: 5 222 540 10.69% of Total Plot Inventory
OFF-STATION
15-9951-SW Off-Station Cultivar Eval Nursery SW 20 3 60 Turner 13 36N 25E Lamb MWBC-MAES Cederberg Farm
15-9953-SW Off-Station Cultivar Eval Nursery SW 20 3 60 Chester 13 31N 05E Lamb MWBC-MAES Kammerzell Farm
15-9955-SW Off-Station Cultivar Eval Nursery SW 20 3 60 Loring 24 35N 29E Lamb MWBC-MAES Flansaas/Lumsden
15-9957-SW Off-Station Cultivar Eval Nursery SW 20 3 60 Loma 29 27N 10E Lamb MWBC-MAES McKeever Farm
15-9851-DUR Off-Station Cultivar Eval Nursery DUR 14 3 42 Turner 13 36N 25E Lamb MWBC-MAES Cederberg Farm
15-9853-DUR Off-Station Cultivar Eval Nursery DUR 14 3 42 Chester 13 31N 05E Lamb MWBC-MAES Kammerzell Farm
15-9855-DUR Off-Station Cultivar Eval Nursery DUR 14 3 42 Loring 24 35N 29E Lamb MWBC-MAES Flansaas/Lumsden
Sub-Totals: 7 122 366 7.25% of Total Plot Inventory
SPRING WHEAT & DURUM (SW & DUR) INVESTIGATIONS
2015 Variety Testing
INDIVIDUAL CROP EXPERIMENT IDENTIFICATION & DESCRIPTION RECORD
Northern Agricultural Research Center
Havre, Montana
WINTER WHEAT (WW) INVESTIGATIONS
NARC On-Station
5
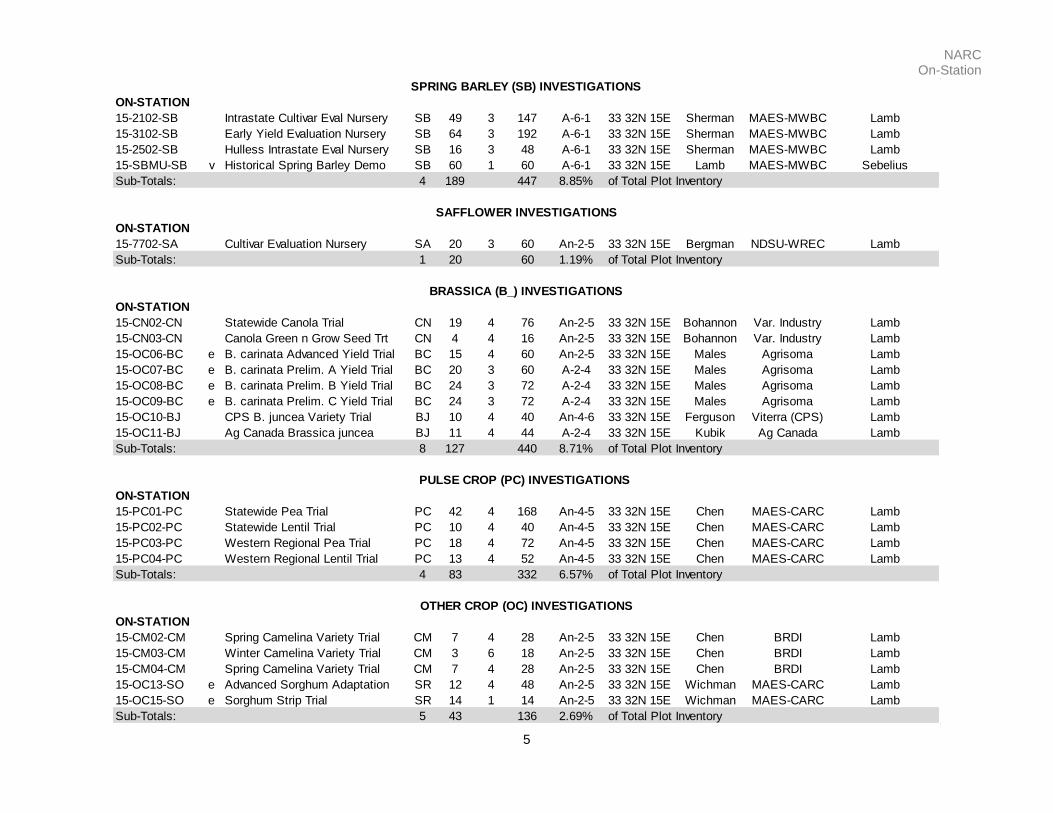
ON-STATION
15-2102-SB Intrastate Cultivar Eval Nursery SB 49 3 147 A-6-1 33 32N 15E Sherman MAES-MWBC Lamb
15-3102-SB Early Yield Evaluation Nursery SB 64 3 192 A-6-1 33 32N 15E Sherman MAES-MWBC Lamb
15-2502-SB Hulless Intrastate Eval Nursery SB 16 3 48 A-6-1 33 32N 15E Sherman MAES-MWBC Lamb
15-SBMU-SB v Historical Spring Barley Demo SB 60 1 60 A-6-1 33 32N 15E Lamb MAES-MWBC Sebelius
Sub-Totals: 4 189 447 8.85% of Total Plot Inventory
ON-STATION
15-7702-SA Cultivar Evaluation Nursery SA 20 3 60 An-2-5 33 32N 15E Bergman NDSU-WREC Lamb
Sub-Totals: 1 20 60 1.19% of Total Plot Inventory
ON-STATION
15-CN02-CN Statewide Canola Trial CN 19 4 76 An-2-5 33 32N 15E Bohannon Var. Industry Lamb
15-CN03-CN Canola Green n Grow Seed Trt CN 4 4 16 An-2-5 33 32N 15E Bohannon Var. Industry Lamb
15-OC06-BC e B. carinata Advanced Yield Trial BC 15 4 60 An-2-5 33 32N 15E Males Agrisoma Lamb
15-OC07-BC e B. carinata Prelim. A Yield Trial BC 20 3 60 A-2-4 33 32N 15E Males Agrisoma Lamb
15-OC08-BC e B. carinata Prelim. B Yield Trial BC 24 3 72 A-2-4 33 32N 15E Males Agrisoma Lamb
15-OC09-BC e B. carinata Prelim. C Yield Trial BC 24 3 72 A-2-4 33 32N 15E Males Agrisoma Lamb
15-OC10-BJ CPS B. juncea Variety Trial BJ 10 4 40 An-4-6 33 32N 15E Ferguson Viterra (CPS) Lamb
15-OC11-BJ Ag Canada Brassica juncea BJ 11 4 44 A-2-4 33 32N 15E Kubik Ag Canada Lamb
Sub-Totals: 8 127 440 8.71% of Total Plot Inventory
ON-STATION
15-PC01-PC Statewide Pea Trial PC 42 4 168 An-4-5 33 32N 15E Chen MAES-CARC Lamb
15-PC02-PC Statewide Lentil Trial PC 10 4 40 An-4-5 33 32N 15E Chen MAES-CARC Lamb
15-PC03-PC Western Regional Pea Trial PC 18 4 72 An-4-5 33 32N 15E Chen MAES-CARC Lamb
15-PC04-PC Western Regional Lentil Trial PC 13 4 52 An-4-5 33 32N 15E Chen MAES-CARC Lamb
Sub-Totals: 4 83 332 6.57% of Total Plot Inventory
ON-STATION
15-CM02-CM Spring Camelina Variety Trial CM 7 4 28 An-2-5 33 32N 15E Chen BRDI Lamb
15-CM03-CM Winter Camelina Variety Trial CM 3 6 18 An-2-5 33 32N 15E Chen BRDI Lamb
15-CM04-CM Spring Camelina Variety Trial CM 7 4 28 An-2-5 33 32N 15E Chen BRDI Lamb
15-OC13-SO e Advanced Sorghum Adaptation SR 12 4 48 An-2-5 33 32N 15E Wichman MAES-CARC Lamb
15-OC15-SO e Sorghum Strip Trial SR 14 1 14 An-2-5 33 32N 15E Wichman MAES-CARC Lamb
Sub-Totals: 5 43 136 2.69% of Total Plot Inventory
SPRING BARLEY (SB) INVESTIGATIONS
SAFFLOWER INVESTIGATIONS
BRASSICA (B_) INVESTIGATIONS
PULSE CROP (PC) INVESTIGATIONS
OTHER CROP (OC) INVESTIGATIONS

NARC On-Station
6
ON-STATION
15-FR02-FR Winter Cereal Forage Trial FR 16 3 48 A-6-4 33 32N 15E Wichman MAES-CARC Lamb/Boss
15-FR03-FR Spring Cereal Forage Trial FR 10 3 30 A-6-1 33 32N 15E Wichman MAES-CARC Lamb/Boss
Sub-Totals: 2 26 78 1.54% of Total Plot Inventory
ON-STATION
15-NM02-GC Dryland Grain Corn Fertility Trial GC 16 4 64 A-2-4 33 32N 15E Lamb FertAdvisory Boss
15-NM04-WW WW Sensor-Based Algorithm WW 36 4 144 A-6-3 33 32N 15E Desta MAES-WTARC Lamb
Sub-Totals: 2 52 208 4.12% of Total Plot Inventory
ON-STATION
15-SP19-CAP Crop-Crop-Fallow CAP Rotation MC 10 3 30 B-9-3 32 32N 15E Chen BRDI Lamb/Sebelius
15-SP19-OP Crop-Crop-Fallow Rotation MC 20 3 60 B-9-3 32 32N 15E Lamb MAES-NARC Sebelius
15-SP20-OP Crop-Fallow Rotation MC 24 3 72 B-9-1 32 32N 15E Lamb MAES-NARC Sebelius
15-SP28-OP QFR World Collection WW WW 33 2 66 An-2-6 33 32N 15E Lamb Quinn Sebelius
15-SP29-OP QFR Populations 3-Row WW 14 3 42 An-2-6 33 32N 15E Lamb Quinn Sebelius
Sub-Totals: 5 101 270 5.35% of Total Plot Inventory
OFF-STATION
15-PM42-SW h Thimet Insectide on Reeder SW SW 12 4 48 Gilford 05 30N 11E Weaver AmVac Wolery Farm
15-PM43-SW h Thimet on Yellow stone & Warhorse WW WW 8 4 32 Gilford 05 30N 11E Weaver AmVac Wolery Farm
15-PM60-PM h Hill Plots WW Gilford 21 27N 10E Talbert/Weaver Var. Industry Wolery Farm
Sub-Totals: 3 20 80 1.58% of Total Plot Inventory
FORAGE RESEARCH (FR) INVESTIGATIONS
NUTRIENT RESEARCH (NR) INVESTIGATIONS
SPECIAL PROJECT (SP) INVESTIGATIONS
PEST MANAGEMENT (PM) INVESTIGATIONS
NARC On-Station
7
15EXPER#Leg.xls Last Updated: 12/18/15
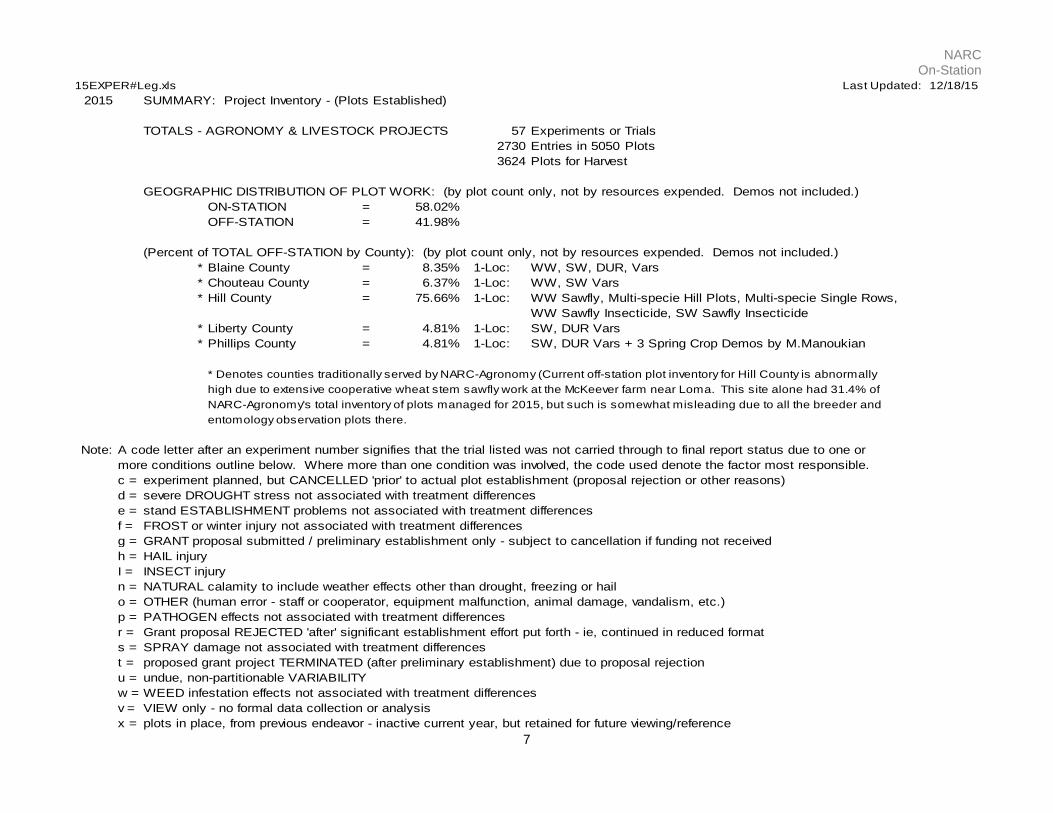
2015 SUMMARY: Project Inventory - (Plots Established)
TOTALS - AGRONOMY & LIVESTOCK PROJECTS 57 Experiments or Trials
2730 Entries in 5050 Plots
3624 Plots for Harvest
GEOGRAPHIC DISTRIBUTION OF PLOT WORK: (by plot count only, not by resources expended. Demos not included.)
ON-STATION = 58.02%
OFF-STATION = 41.98%
(Percent of TOTAL OFF-STATION by County): (by plot count only, not by resources expended. Demos not included.)
* Blaine County = 8.35% 1-Loc: WW, SW, DUR, Vars
* Chouteau County = 6.37% 1-Loc: WW, SW Vars
* Hill County = 75.66% 1-Loc: WW Sawfly, Multi-specie Hill Plots, Multi-specie Single Rows,
WW Sawfly Insecticide, SW Sawfly Insecticide
* Liberty County = 4.81% 1-Loc: SW, DUR Vars
* Phillips County = 4.81% 1-Loc: SW, DUR Vars + 3 Spring Crop Demos by M.Manoukian
* Denotes counties traditionally served by NARC-Agronomy (Current off-station plot inventory for Hill County is abnormally
high due to extensive cooperative wheat stem sawfly work at the McKeever farm near Loma. This site alone had 31.4% of
NARC-Agronomy's total inventory of plots managed for 2015, but such is somewhat misleading due to all the breeder and
entomology observation plots there.
Note: A code letter after an experiment number signifies that the trial listed was not carried through to final report status due to one or
more conditions outline below. Where more than one condition was involved, the code used denote the factor most responsible.
c = experiment planned, but CANCELLED 'prior' to actual plot establishment (proposal rejection or other reasons)
d = severe DROUGHT stress not associated with treatment differences
e = stand ESTABLISHMENT problems not associated with treatment differences
f = FROST or winter injury not associated with treatment differences
g = GRANT proposal submitted / preliminary establishment only - subject to cancellation if funding not received
h = HAIL injury
I = INSECT injury
n = NATURAL calamity to include weather effects other than drought, freezing or hail
o = OTHER (human error - staff or cooperator, equipment malfunction, animal damage, vandalism, etc.)
p = PATHOGEN effects not associated with treatment differences
r = Grant proposal REJECTED 'after' significant establishment effort put forth - ie, continued in reduced format
s = SPRAY damage not associated with treatment differences
t = proposed grant project TERMINATED (after preliminary establishment) due to proposal rejection
u = undue, non-partitionable VARIABILITY
w = WEED infestation effects not associated with treatment differences
v = VIEW only - no formal data collection or analysis
x = plots in place, from previous endeavor - inactive current year, but retained for future viewing/reference
NARC On-Station
8
15EXPER#Leg.xlsx
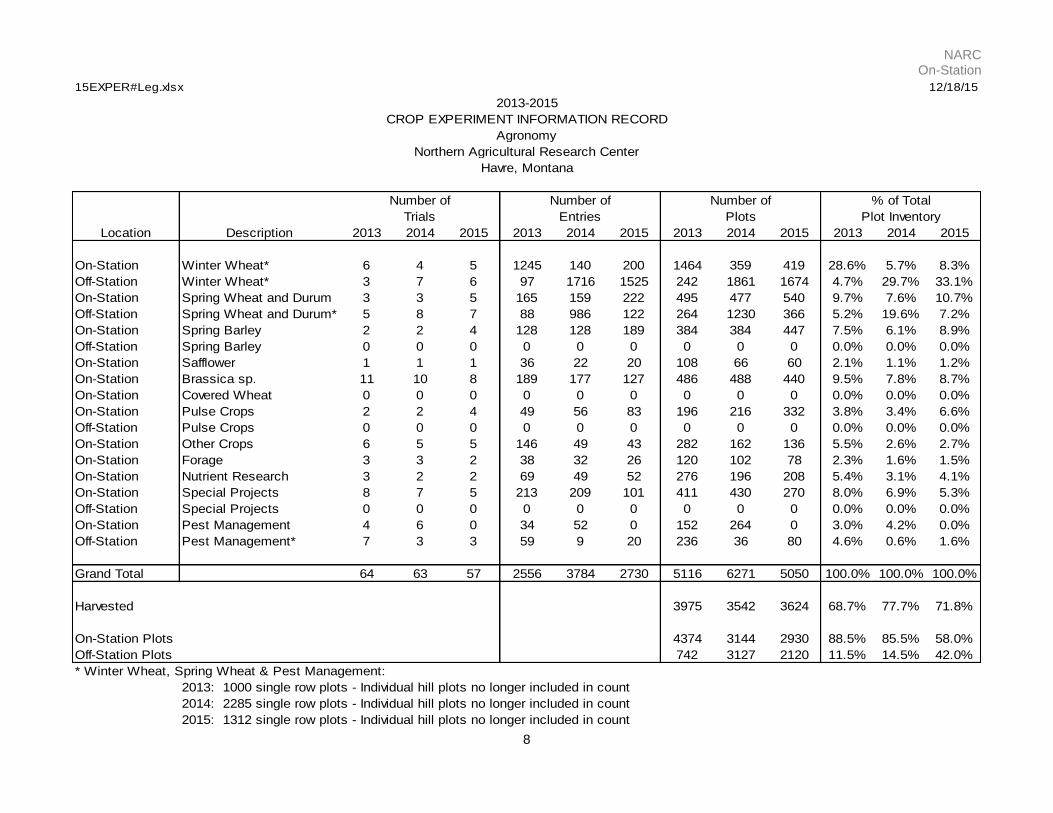
Location Description 2013 2014 2015 2013 2014 2015 2013 2014 2015 2013 2014 2015
On-Station Winter Wheat* 6 4 5 1245 140 200 1464 359 419 28.6% 5.7% 8.3%
Off-Station Winter Wheat* 3 7 6 97 1716 1525 242 1861 1674 4.7% 29.7% 33.1%
On-Station Spring Wheat and Durum 3 3 5 165 159 222 495 477 540 9.7% 7.6% 10.7%
Off-Station Spring Wheat and Durum* 5 8 7 88 986 122 264 1230 366 5.2% 19.6% 7.2%
On-Station Spring Barley 2 2 4 128 128 189 384 384 447 7.5% 6.1% 8.9%
Off-Station Spring Barley 0 0 0 0 0 0 0 0 0 0.0% 0.0% 0.0%
On-Station Safflower 1 1 1 36 22 20 108 66 60 2.1% 1.1% 1.2%
On-Station Brassica sp. 11 10 8 189 177 127 486 488 440 9.5% 7.8% 8.7%
On-Station Covered Wheat 0 0 0 0 0 0 0 0 0 0.0% 0.0% 0.0%
On-Station Pulse Crops 2 2 4 49 56 83 196 216 332 3.8% 3.4% 6.6%
Off-Station Pulse Crops 0 0 0 0 0 0 0 0 0 0.0% 0.0% 0.0%
On-Station Other Crops 6 5 5 146 49 43 282 162 136 5.5% 2.6% 2.7%
On-Station Forage 3 3 2 38 32 26 120 102 78 2.3% 1.6% 1.5%
On-Station Nutrient Research 3 2 2 69 49 52 276 196 208 5.4% 3.1% 4.1%
On-Station Special Projects 8 7 5 213 209 101 411 430 270 8.0% 6.9% 5.3%
Off-Station Special Projects 0 0 0 0 0 0 0 0 0 0.0% 0.0% 0.0%
On-Station Pest Management 4 6 0 34 52 0 152 264 0 3.0% 4.2% 0.0%
Off-Station Pest Management* 7 3 3 59 9 20 236 36 80 4.6% 0.6% 1.6%
Grand Total 64 63 57 2556 3784 2730 5116 6271 5050 100.0% 100.0% 100.0%
Harvested 3975 3542 3624 68.7% 77.7% 71.8%
On-Station Plots 4374 3144 2930 88.5% 85.5% 58.0%
Off-Station Plots 742 3127 2120 11.5% 14.5% 42.0%
* Winter Wheat, Spring Wheat & Pest Management:
2013: 1000 single row plots - Individual hill plots no longer included in count
2014: 2285 single row plots - Individual hill plots no longer included in count
2015: 1312 single row plots - Individual hill plots no longer included in count
Number of
Trials
2013-2015
CROP EXPERIMENT INFORMATION RECORD
Agronomy
Northern Agricultural Research Center
Havre, Montana
12/18/15
Number of
Entries
% of Total
Plot Inventory
Number of
Plots

NARC On-Station
9
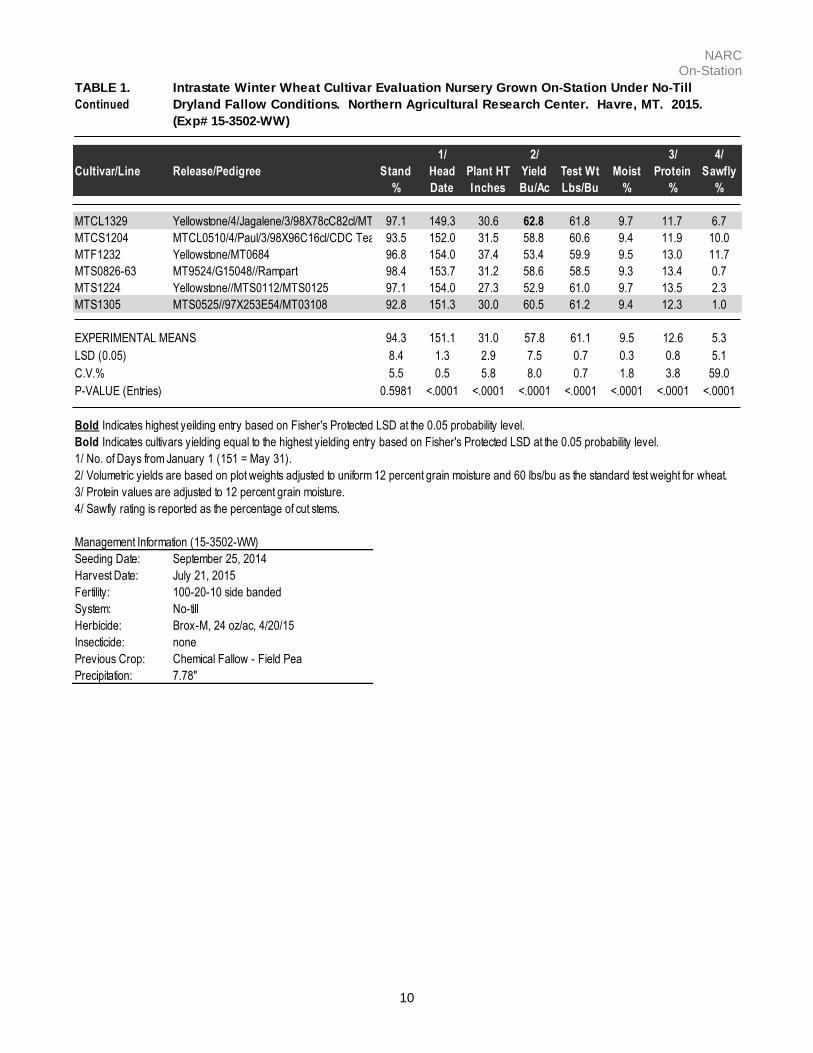
TABLE 1.
(Exp# 15-3502-WW)
1/ 2/ 3/ 4/
Cultivar/Line Release/Pedigree Stand Head Plant HT Yield Test Wt Moist Protein Sawfly
% Date Inches Bu/Ac Lbs/Bu % % %
Bearpaw Montana, 2011 98.4 151.0 27.9 60.4 60.6 9.5 12.8 2.3
Brawl CL Plus Colorado, 2011 (CO Wheat Res. Fdn.) 93.8 145.7 31.5 47.2 62.1 9.5 13.9 1.0
Broadview Alberta, 2009 (Meridian Seeds) 94.8 152.0 31.9 66.9 60.0 9.1 12.3 2.3
Byrd Colorado, 2011 (CO Wheat Res. Fdn.) 96.1 147.7 29.7 68.1 62.2 9.5 11.6 2.3
CDC Chase Saskatchewan, 2013 88.0 152.3 32.8 56.1 60.8 9.5 12.8 3.7
CDC Falcon Sask/WestBred, 1999 95.1 151.0 29.1 64.4 60.2 9.1 12.1 6.7
Colter Montana, 2013 94.8 153.0 32.3 60.9 60.9 9.7 12.8 8.3
Cowboy Wyoming/Colorado, 2012 91.8 149.3 33.0 67.5 61.8 9.3 11.0 3.7
Decade Montana/North Dakota, 2010 96.4 151.3 29.2 53.3 61.6 9.6 13.5 13.3
Denali Colorado, 2011 (CO Wheat Res. Fdn.) 89.8 150.3 31.4 65.6 62.7 9.2 11.0 2.3
Freeman Nebraska, 2013 87.6 145.7 29.0 52.0 60.1 9.2 12.5 5.3
Genou Montana, 2004 95.8 150.3 33.1 56.4 60.8 9.3 13.0 1.0
Jerry North Dakota, 2001 91.2 152.0 34.1 51.6 60.2 9.5 12.7 3.7
Judee Montana, 2011 92.5 150.7 30.6 56.9 61.8 9.4 12.6 0.7
Keldin WestBred, 2011 95.5 152.7 30.3 54.8 61.7 9.6 12.6 15.0
LCS Mint Limagrain Cereals, 2012 98.1 146.3 30.7 55.2 63.0 9.3 11.9 11.7
Ledger WestBred, 2004 98.4 152.0 30.2 61.0 61.7 9.4 12.3 7.0
Northern Montana, 2015 89.6 152.3 31.7 56.9 60.2 9.6 12.7 2.3
Rampart Montana, 1996 94.1 151.7 31.8 56.8 59.6 9.3 13.3 1.0
SY Clearstone 2CL Montana/Syngenta, 2012 95.8 152.3 34.1 53.5 60.9 9.6 12.8 11.7
SY Monument Syngenta (AgriPro), 2014 93.8 150.0 30.9 61.0 60.9 9.4 11.2 3.7
SY Sunrise Syngenta (AgriPro), 2015 88.6 149.0 26.7 55.5 62.2 9.5 13.0 3.7
SY Wolf Syngenta (AgriPro), 2010 96.1 149.7 29.3 56.5 62.2 9.6 12.2 8.3
T158 Trio Research/Limagrain Cereals, 2009 93.5 145.3 28.2 50.3 62.0 9.3 12.7 5.0
Warhorse Montana, 2013 97.4 152.7 29.6 57.7 60.6 9.5 12.8 2.0
WB3768 Montana/WestBred, 2013 97.1 154.7 33.3 61.1 60.5 9.5 12.6 13.3
WB4059CLP WestBred, 2013 94.5 146.3 26.5 47.4 61.6 9.5 13.2 1.0
WB4614 WestBred, 2013 93.2 152.3 30.1 55.9 61.4 9.4 12.5 3.7
WB4623CLP WestBred, 2014 96.1 152.7 26.2 52.9 60.9 9.4 13.5 10.0
WB-Quake WestBred, 2011 90.5 153.3 30.0 55.8 60.7 9.2 12.6 0.7
Yellowstone Montana 2005 96.1 152.3 33.3 62.4 60.9 9.8 12.6 2.3
LCH 10-13 Limagrain Cereals experimental 97.1 145.3 30.6 52.0 62.0 9.4 13.8 2.3
MT1078 MT02113*4/MTS0359 98.1 152.7 31.6 63.6 60.1 9.4 11.6 5.3
MT1117 Yellowstone*3/KS96WGRC40 96.7 152.7 34.4 58.8 60.9 9.6 12.9 5.3
MT1138 W99-194/2*Yellowstone 95.8 151.3 32.7 62.7 61.0 9.8 12.1 6.7
MT1257 Yellowstone/Krichauff 96.1 151.7 32.2 63.2 60.4 9.8 11.9 7.0
MT1265 Yellowstone*4/KS96WGRC40 (Lr41, wcm) 94.1 152.7 33.7 54.3 60.8 9.6 12.8 6.7
MT1286 Yellowstone*2/NE99445 93.5 151.3 31.3 54.2 61.1 9.7 12.5 10.0
MT1332 Yellowstone/00X52E99//Yellowstone(340,233)90.9 152.0 33.4 62.4 61.0 9.6 12.5 5.0
MT1348 PI572290/BigSky 93.8 151.0 30.2 63.7 61.6 9.5 12.6 1.0
MT1354 MT08184//MT08188/MT08175 93.2 152.7 32.6 59.5 61.6 9.6 12.6 8.3
MT1361 MT08189//MT08188/MT0419-1 (Sr2+36) 88.6 154.0 30.1 57.4 60.7 9.4 13.1 2.3
MTCL1131 Yellowstone*4/3/MTCL01158/CDC Teal 11A//Jagalene94.5 153.0 31.3 52.9 61.7 9.8 12.5 10.0
Intrastate Winter Wheat Cultivar Evaluation Nursery Grown On-Station Under No-Till
Dryland Fallow Conditions. Northern Agricultural Research Center. Havre, MT. 2015.
NARC On-Station
10
TABLE 1.
Continued
(Exp# 15-3502-WW)
1/ 2/ 3/ 4/
Cultivar/Line Release/Pedigree Stand Head Plant HT Yield Test Wt Moist Protein Sawfly
% Date Inches Bu/Ac Lbs/Bu % % %
MTCL1329 Yellowstone/4/Jagalene/3/98X78cC82cl/MT0097//Jerry/CDC Teal11A97.1 149.3 30.6 62.8 61.8 9.7 11.7 6.7
MTCS1204 MTCL0510/4/Paul/3/98X96C16cl/CDC Teal 11A//MTCL0322/5/MTS053193.5 152.0 31.5 58.8 60.6 9.4 11.9 10.0
MTF1232 Yellowstone/MT0684 96.8 154.0 37.4 53.4 59.9 9.5 13.0 11.7
MTS0826-63 MT9524/G15048//Rampart 98.4 153.7 31.2 58.6 58.5 9.3 13.4 0.7
MTS1224 Yellowstone//MTS0112/MTS0125 97.1 154.0 27.3 52.9 61.0 9.7 13.5 2.3
MTS1305 MTS0525//97X253E54/MT03108 92.8 151.3 30.0 60.5 61.2 9.4 12.3 1.0
EXPERIMENTAL MEANS 94.3 151.1 31.0 57.8 61.1 9.5 12.6 5.3
LSD (0.05) 8.4 1.3 2.9 7.5 0.7 0.3 0.8 5.1
C.V.% 5.5 0.5 5.8 8.0 0.7 1.8 3.8 59.0
P-VALUE (Entries) 0.5981 <.0001 <.0001 <.0001 <.0001 <.0001 <.0001 <.0001
Bold Indicates highest yeilding entry based on Fisher's Protected LSD at the 0.05 probability level.
Bold Indicates cultivars yielding equal to the highest yielding entry based on Fisher's Protected LSD at the 0.05 probability level.
1/ No. of Days from January 1 (151 = May 31).
2/ Volumetric yields are based on plot weights adjusted to uniform 12 percent grain moisture and 60 lbs/bu as the standard test weight for wheat.
3/ Protein values are adjusted to 12 percent grain moisture.
4/ Sawfly rating is reported as the percentage of cut stems.
Management Information (15-3502-WW)
Seeding Date: September 25, 2014
Harvest Date: July 21, 2015
Fertility: 100-20-10 side banded
System: No-till
Herbicide: Brox-M, 24 oz/ac, 4/20/15
Insecticide: none
Previous Crop: Chemical Fallow - Field Pea
Precipitation: 7.78"
Intrastate Winter Wheat Cultivar Evaluation Nursery Grown On-Station Under No-Till
Dryland Fallow Conditions. Northern Agricultural Research Center. Havre, MT. 2015.
NARC On-Station
11
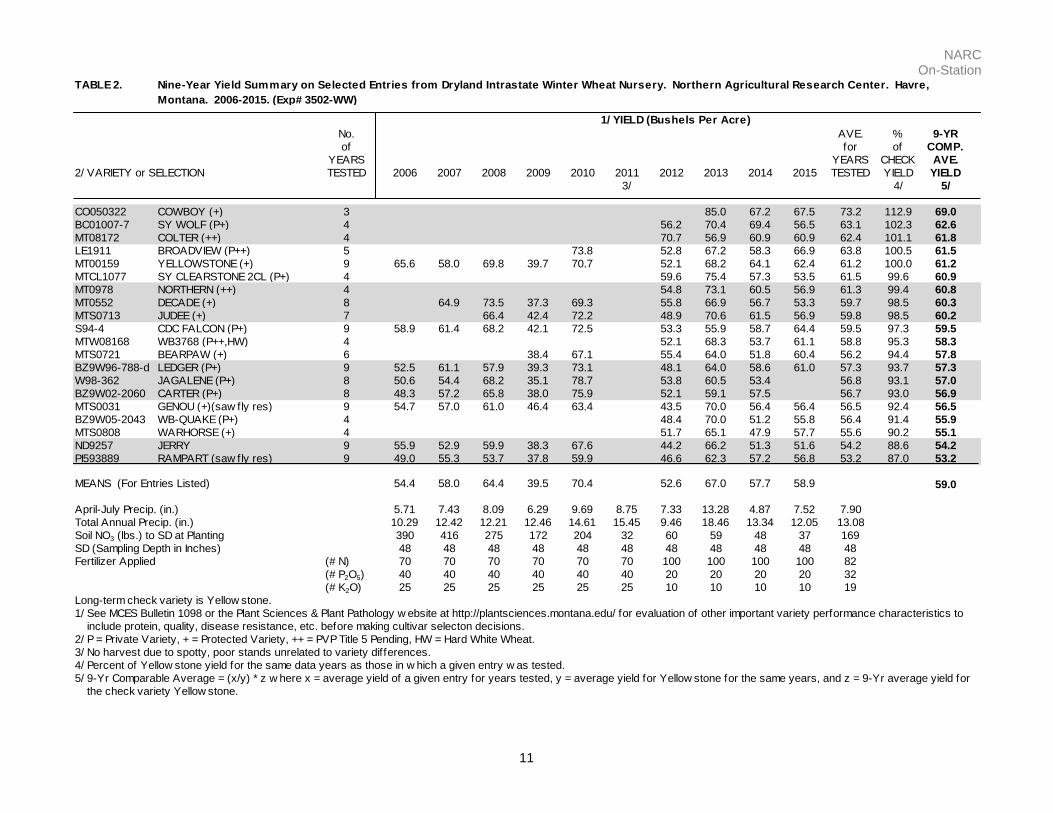
TABLE 2.
No. AVE. % 9-YR
of for of COMP.
YEARS YEARS CHECK AVE.
2/ VARIETY or SELECTION TESTED 2006 2007 2008 2009 2010 2011 2012 2013 2014 2015 TESTED YIELD YIELD
3/ 4/ 5/
CO050322 COWBOY (+) 3 85.0 67.2 67.5 73.2 112.9 69.0
BC01007-7 SY WOLF (P+) 4 56.2 70.4 69.4 56.5 63.1 102.3 62.6
MT08172 COLTER (++) 4 70.7 56.9 60.9 60.9 62.4 101.1 61.8
LE1911 BROADVIEW (P++) 5 73.8 52.8 67.2 58.3 66.9 63.8 100.5 61.5
MT00159 YELLOWSTONE (+) 9 65.6 58.0 69.8 39.7 70.7 52.1 68.2 64.1 62.4 61.2 100.0 61.2
MTCL1077 SY CLEARSTONE 2CL (P+) 4 59.6 75.4 57.3 53.5 61.5 99.6 60.9
MT0978 NORTHERN (++) 4 54.8 73.1 60.5 56.9 61.3 99.4 60.8
MT0552 DECADE (+) 8 64.9 73.5 37.3 69.3 55.8 66.9 56.7 53.3 59.7 98.5 60.3
MTS0713 JUDEE (+) 7 66.4 42.4 72.2 48.9 70.6 61.5 56.9 59.8 98.5 60.2
S94-4 CDC FALCON (P+) 9 58.9 61.4 68.2 42.1 72.5 53.3 55.9 58.7 64.4 59.5 97.3 59.5
MTW08168 WB3768 (P++,HW) 4 52.1 68.3 53.7 61.1 58.8 95.3 58.3
MTS0721 BEARPAW (+) 6 38.4 67.1 55.4 64.0 51.8 60.4 56.2 94.4 57.8
BZ9W96-788-d LEDGER (P+) 9 52.5 61.1 57.9 39.3 73.1 48.1 64.0 58.6 61.0 57.3 93.7 57.3
W98-362 JAGALENE (P+) 8 50.6 54.4 68.2 35.1 78.7 53.8 60.5 53.4 56.8 93.1 57.0
BZ9W02-2060 CARTER (P+) 8 48.3 57.2 65.8 38.0 75.9 52.1 59.1 57.5 56.7 93.0 56.9
MTS0031 GENOU (+)(saw fly res) 9 54.7 57.0 61.0 46.4 63.4 43.5 70.0 56.4 56.4 56.5 92.4 56.5
BZ9W05-2043 WB-QUAKE (P+) 4 48.4 70.0 51.2 55.8 56.4 91.4 55.9
MTS0808 WARHORSE (+) 4 51.7 65.1 47.9 57.7 55.6 90.2 55.1
ND9257 JERRY 9 55.9 52.9 59.9 38.3 67.6 44.2 66.2 51.3 51.6 54.2 88.6 54.2
PI593889 RAMPART (saw fly res) 9 49.0 55.3 53.7 37.8 59.9 46.6 62.3 57.2 56.8 53.2 87.0 53.2
54.4 58.0 64.4 39.5 70.4 52.6 67.0 57.7 58.9 59.0
April-July Precip. (in.) 5.71 7.43 8.09 6.29 9.69 8.75 7.33 13.28 4.87 7.52 7.90
Total Annual Precip. (in.) 10.29 12.42 12.21 12.46 14.61 15.45 9.46 18.46 13.34 12.05 13.08
Soil NO3 (lbs.) to SD at Planting 390 416 275 172 204 32 60 59 48 37 169
SD (Sampling Depth in Inches) 48 48 48 48 48 48 48 48 48 48 48
Fertilizer Applied (# N) 70 70 70 70 70 70 100 100 100 100 82
(# P2O5) 40 40 40 40 40 40 20 20 20 20 32
(# K2O) 25 25 25 25 25 25 10 10 10 10 19
Long-term check variety is Yellow stone.
1/ See MCES Bulletin 1098 or the Plant Sciences & Plant Pathology w ebsite at http://plantsciences.montana.edu/ for evaluation of other important variety performance characteristics to
include protein, quality, disease resistance, etc. before making cultivar selecton decisions.
2/ P = Private Variety, + = Protected Variety, ++ = PVP Title 5 Pending, HW = Hard White Wheat.
3/ No harvest due to spotty, poor stands unrelated to variety differences.
4/ Percent of Yellow stone yield for the same data years as those in w hich a given entry w as tested.
5/ 9-Yr Comparable Average = (x/y) * z w here x = average yield of a given entry for years tested, y = average yield for Yellow stone for the same years, and z = 9-Yr average yield for
the check variety Yellow stone.
Nine-Year Yield Summary on Selected Entries from Dryland Intrastate Winter Wheat Nursery. Northern Agricultural Research Center. Havre,
Montana. 2006-2015. (Exp# 3502-WW)
1/ YIELD (Bushels Per Acre)
MEANS (For Entries Listed)

NARC On-Station
12
TABLE 3.
No. AVE. % 9-YR
of for of COMP.
YEARS YEARS CHECK AVE.
2/ VARIETY or SELECTION TESTED 2006 2007 2008 2009 2010 2011 2012 2013 2014 2015 TESTED TEST WTTEST WT
3/ 4/ 5/
W98-362 JAGALENE (P+) 8 64.2 61.7 62.7 63.0 64.4 61.6 60.0 63.0 62.6 104.5 62.7
BC01007-7 SY WOLF (P+) 4 60.7 58.4 62.2 62.2 60.9 101.9 61.1
MT0552 DECADE (+) 8 60.3 60.5 61.5 62.3 59.7 58.6 61.0 61.6 60.7 101.6 61.0
BZ96-788 LEDGER (P+) 9 63.2 60.6 60.1 60.4 61.9 60.0 58.7 61.8 61.7 60.9 101.6 60.9
CO050322 COWBOY (+) 3 59.4 61.6 61.8 60.9 101.0 60.6
MTW08168 WB3768 (P++,HW) 4 59.0 60.2 61.5 60.5 60.3 100.9 60.5
S94-4 CDC FALCON (P+) 9 63.1 59.0 60.2 61.8 61.5 59.3 58.7 60.8 60.2 60.5 100.9 60.5
MTS0031 GENOU (+)(saw fly res) 9 62.5 59.7 58.7 62.0 60.7 58.1 59.2 61.6 60.8 60.4 100.6 60.4
BZ022060 CARTER (P+) 8 62.0 59.1 59.4 60.4 62.9 58.8 58.1 61.1 60.2 100.6 60.3
MT08172 COLTER (++) 4 58.7 59.4 61.3 60.9 60.1 100.5 60.3
MTS0713 JUDEE (+) 7 57.5 62.2 61.0 56.9 60.2 61.8 61.8 60.2 100.5 60.3
MT0978 NORTHERN (++) 4 58.5 59.6 61.0 60.2 59.8 100.1 60.1
MT00159 YELLOWSTONE (+) 9 62.2 58.3 57.5 61.7 61.2 58.1 59.3 60.7 60.9 60.0 100.0 60.0
PI593889 RAMPART (saw fly res) 9 62.5 58.6 59.1 61.3 60.4 58.7 57.9 61.0 59.6 59.9 99.8 59.9
MTS0808 WARHORSE (+) 4 57.6 59.0 61.1 60.6 59.6 99.7 59.8
BZ9W05-2043 WB-QUAKE (P+) 4 58.8 58.0 60.7 60.7 59.5 99.7 59.8
LE1911 BROADVIEW (P++) 5 61.0 58.2 57.7 60.3 60.0 59.5 99.5 59.7
MTS0721 BEARPAW (+) 6 61.1 61.4 58.8 57.6 60.6 60.6 60.0 99.5 59.7
MTCL1077 SY CLEARSTONE 2CL (P+) 4 57.1 58.2 60.8 60.9 59.2 99.2 59.5
ND9257 JERRY 9 62.1 58.0 56.7 60.5 61.1 57.7 57.5 60.1 60.2 59.3 98.9 59.3
62.7 59.5 59.2 61.5 61.7 58.7 58.8 61.2 60.8 60.3
April-July Precip. (in.) 5.71 7.43 8.09 6.29 9.69 8.75 7.33 13.28 4.87 7.52 7.90
Total Annual Precip. (in.) 10.29 12.42 12.21 12.46 14.61 15.45 9.46 18.46 13.34 12.05 13.08
Soil NO3 (lbs.) to SD at Planting 390 416 275 172 204 32 60 59 48 37 169
SD (Sampling Depth in Inches) 48 48 48 48 48 48 48 48 48 48 48
Fertilizer Applied (# N) 70 70 70 70 70 70 100 100 100 100 82
(# P2O5) 40 40 40 40 40 40 20 20 20 20 32
(# K2O) 25 25 25 25 25 25 10 10 10 10 19
Long-term check variety is Yellow stone.
1/ See MCES Bulletin 1098 or the Plant Sciences & Plant Pathology w ebsite at http://plantsciences.montana.edu/ for evaluation of other important variety performance characteristics to
include protein, quality, disease resistance, etc. before making cultivar selecton decisions.
2/ P = Private Variety, + = Protected Variety, ++ = PVP Title 5 Pending, HW = Hard White Wheat.
3/ No harvest due to spotty, poor stands unrelated to variety differences.
4/ Percent of Yellow stone test w eight for the same data years as those in w hich a given entry w as tested.
5/ 9-Yr Comparable Average = (x/y) * z w here x = average test w eight of a given entry for years tested, y = average test w eight for Yellow stone for the same years, and z = 9-Yr
average test w eight for the check variety Yellow stone.
Nine-Year Test Weight Summary on Selected Entries from Dryland Intrastate Winter Wheat Nursery. Northern Agricultural Research Center. Havre,
Montana. 2006-2015. (Exp# 3502-WW)
1/ TEST WEIGHT (Pounds Per Bushel)
MEANS (For Entries Listed)

NARC On-Station
13
TABLE 4.
No. AVE. % 10-YR
of for of COMP.
YEARS YEARS CHECK AVE.
2/ VARIETY or SELECTION TESTED 2006 2007 2008 2009 2010 2011 2012 2013 2014 2015 TESTED SAWFLY SAWFLY
3/ 4/
PI593889 RAMPART (saw fly res) 10 2.3 2.3 13.3 1.0 3.7 1.0 0.0 3.7 1.0 1.0 2.9 100.0 2.9
MTS0713 JUDEE (+) 8 8.3 4.0 4.0 4.0 2.1 5.3 1.0 0.7 3.7 119.4 3.5
MTS0808 WARHORSE (+) 5 1.0 2.3 2.3 1.0 2.0 1.7 129.2 3.8
MTS0721 BEARPAW (+) 7 4.0 2.3 1.0 2.5 5.3 1.0 2.3 2.6 162.8 4.8
MTS0031 GENOU (+)(saw fly res) 10 6.7 5.0 11.7 1.0 15.0 1.0 6.3 6.7 1.0 1.0 5.5 188.4 5.5
BZ022060 CARTER (P+) 9 15.0 10.0 10.0 11.7 5.3 3.7 1.0 10.0 1.0 7.5 238.9 7.0
BZ9W05-2043 WB-QUAKE (P+) 5 2.3 4.3 3.7 5.0 0.7 3.2 238.5 7.0
CO050322 COWBOY (+) 3 11.7 2.0 3.7 5.8 305.9 9.0
MT0978 NORTHERN (++) 5 2.3 9.3 6.7 2.3 2.3 4.6 343.8 10.1
LE1911 BROADVIEW (P++) 6 8.7 3.7 9.1 10.0 2.3 2.3 6.0 349.5 10.2
MT0552 DECADE (+) 9 18.3 35.0 16.7 3.7 6.7 9.5 8.3 1.0 13.3 12.5 416.7 12.2
S94-4 CDC FALCON (P+) 10 25.0 26.7 36.7 13.3 7.0 1.0 6.9 5.0 1.0 6.7 12.9 440.6 12.9
BC01007-7 SY WOLF (P+) 5 6.7 4.7 8.3 2.3 8.3 6.1 456.0 13.4
MT00159 YELLOWSTONE (+) 10 18.3 40.0 18.3 23.3 11.7 5.3 8.9 10.0 2.3 2.3 14.1 479.1 14.1
BZ9W96-788-d LEDGER (P+) 10 36.7 13.3 46.7 11.7 15.0 1.0 4.9 8.3 5.0 7.0 15.0 509.8 15.0
W98-362 JAGALENE (P+) 9 23.3 23.3 38.3 23.3 12.0 10.0 9.0 13.3 1.0 17.1 542.6 15.9
MT08172 COLTER (++) 5 6.7 10.7 13.3 1.0 8.3 8.0 601.8 17.6
ND9257 JERRY 10 18.3 45.0 21.7 40.0 28.3 5.3 14.2 10.0 2.3 3.7 18.9 643.8 18.9
MTCL1077 SY CLEARSTONE 2CL (P+) 4 11.0 13.3 2.3 11.7 9.6 675.6 19.8
MTW08168 WB3768 (P++,HW) 5 5.3 18.0 15.0 3.7 13.3 11.1 830.3 24.4
18.2 20.4 24.0 13.6 9.7 3.8 7.1 8.5 2.0 5.0 11.4
April-July Precip. (in.) 5.71 7.43 8.09 6.29 9.69 8.75 7.33 13.28 4.87 7.52 7.90
Total Annual Precip. (in.) 10.29 12.42 12.21 12.46 14.61 15.45 9.46 18.46 13.34 12.05 13.08
Soil NO3 (lbs.) to SD at Planting 390 416 275 172 204 32 60 59 48 37 169
SD (Sampling Depth in Inches) 48 48 48 48 48 48 48 48 48 48 48
Fertilizer Applied (# N) 70 70 70 70 70 70 100 100 100 100 82
(# P2O5) 40 40 40 40 40 40 20 20 20 20 32
(# K2O) 25 25 25 25 25 25 10 10 10 10 19
Long-term check variety is Rampart.
1/ See MCES Bulletin 1098 or the Plant Sciences & Plant Pathology w ebsite at http://plantsciences.montana.edu/ for evaluation of other important variety performance characteristics to
include protein, quality, disease resistance, etc. before making cultivar selecton decisions.
2/ P = Private Variety, + = Protected Variety, ++ = PVP Title 5 Pending, HW = Hard White Wheat.
3/ Percent of Rampart saw fly rating for the same data years as those in w hich a given entry w as tested.
4/ 10-Yr Comparable Average = (x/y) * z w here x = average saw fly rating of a given entry for years tested, y = average saw fly rating for Rampart for the same years, and z = 10-Yr
average saw fly rating for the check variety Rampart.
Ten-Year Sawfly Summary on Selected Entries from Dryland Intrastate Winter Wheat Nursery. Northern Agricultural Research Center. Havre,
Montana. 2006-2015. (Exp# 3502-WW)
1/ SAWFLY RATING (% Cut and Lodged)
MEANS (For Entries Listed)

NARC On-Station
14
TABLE 5.
(Exp# 15-3102-SW)
1/ 2/ 3/ 4/ 5/
ID Cultiver or Selection Stand Head Plant HT Yield Test Wt Moist Protein FN Sawfly
% Date Inches Bu/Ac Lbs/Bu % % seconds %
0150042-10 BRENNAN 87.0 161.3 26.4 46.3 56.6 10.0 16.6 340.9 2.3
MT9929 CHOTEAU 94.1 163.7 27.2 39.5 52.8 10.1 16.7 317.9 0.7
BZ 996-434 CORBIN 94.8 161.7 29.8 42.3 53.3 10.1 17.3 329.0 0.7
MT0832 DUCLAIR 97.4 161.7 29.1 43.2 52.5 10.0 17.0 332.3 1.0
CAP400-1 EGAN 94.1 164.3 27.1 38.9 53.5 9.9 18.2 358.7 1.0
CI 13596 FORTUNA 95.1 163.7 32.9 34.2 54.6 10.1 16.2 340.0 1.0
MN02072-7 LCS BREAKAWAY 92.8 162.0 27.9 34.6 54.5 10.1 16.5 316.4 0.7
LNR10-0493 LCS PRO 97.1 162.7 33.8 43.4 51.7 10.1 16.7 317.8 5.0
PI574642 MCNEAL 98.0 164.0 30.5 43.4 54.5 10.0 17.0 359.6 5.0
ND 695 REEDER 94.4 163.7 29.4 42.3 54.4 10.1 17.2 335.5 2.3
04S0258-12 SY INGMAR 92.5 163.7 28.6 43.7 54.0 10.1 17.0 306.4 1.0
03S0253-7 SY ROWYN 85.6 162.3 28.6 36.3 53.7 10.1 16.3 315.4 0.3
01S0263-28 SY SOREN 90.3 163.0 26.4 44.3 53.1 10.0 17.3 350.2 0.7
04S0515-2-2 SY TYRA 94.4 163.7 26.9 41.7 53.5 10.1 16.4 322.1 0.0
06S0385-5 SY VALDA 90.9 164.0 26.7 42.5 54.9 9.9 17.5 348.0 0.3
CI 10003 THATCHER 97.1 166.7 34.5 29.2 50.1 10.1 18.2 342.8 2.3
MT0245 VIDA 96.0 164.3 29.6 45.9 53.8 10.1 16.6 327.5 3.7
BZ903-472 WB 9377 89.9 164.0 24.1 36.9 54.3 10.0 16.9 355.7 1.0
CA909-936 WB 9507 89.2 164.0 29.4 37.5 49.7 10.1 16.9 307.7 1.0
BZ908-552 WB 9668 92.8 161.7 24.6 42.1 55.1 10.0 17.7 329.7 0.7
IMICHT-79 WB 9879CLP 93.1 163.7 28.6 38.0 53.8 10.2 16.7 330.0 1.0
BZ902-413R WB-GUNNISON 86.2 163.0 27.2 39.7 56.1 9.9 16.6 352.3 0.0
LNR0311 LIMAGR142 91.5 162.7 28.3 36.8 55.0 10.1 15.9 345.6 1.0
LNR-0757 LIMAGR152 92.5 165.0 30.3 39.5 53.5 10.1 17.8 311.9 1.0
MT 1219 MT0643/MTHW0771 90.2 162.7 25.2 38.5 53.0 10.0 16.6 340.6 1.0
MT 1316 GLENN/MT0747 91.1 162.7 27.6 44.3 53.0 10.2 16.6 321.7 2.3
MT 1319 MT0415/MT0747 94.5 161.0 28.6 42.9 54.6 10.1 16.3 309.8 5.3
MT 1320 MT0415/MT0747 96.7 162.0 30.9 50.0 56.7 10.1 16.6 346.4 1.0
MT 1331 MT0747/MT0823 92.8 162.3 27.0 45.8 50.1 9.9 16.4 321.2 2.3
MT 1337 MT0830/MT0858 93.1 161.0 28.4 44.9 54.4 10.0 17.0 318.7 1.0
MT 1338 MT0830/MT0858 96.3 161.7 29.9 43.2 57.4 10.1 16.8 332.6 0.7
MT 1348 MT0852/MT0858 96.0 161.7 29.4 51.1 55.6 10.1 16.9 326.6 2.3
MT 1349 MT0852/MT0858 96.4 162.3 28.1 39.7 51.2 9.8 17.2 343.6 2.0
MT 1401 VIDA/MT0827 96.7 161.3 29.9 47.9 56.9 10.1 16.2 326.2 3.7
MT 1404 VIDA/MT0827 94.4 165.3 31.7 45.4 55.1 10.2 16.8 314.8 2.3
MT 1406 VIDA/MT0827 93.7 162.0 28.9 41.7 53.5 10.1 17.2 302.9 2.0
MT 1408 VIDA/MT0832 82.7 163.3 28.7 41.2 55.5 10.1 16.2 321.1 1.0
MT 1412 VIDA/MT0832 95.7 163.0 28.1 47.8 55.7 10.1 16.2 334.2 1.0
MT 1413 VIDA/MT0832 93.2 162.0 31.3 44.6 53.4 10.1 16.7 316.5 2.3
MT 1414 VIDA/MT0861 96.0 164.0 29.6 40.6 50.3 10.1 16.0 326.5 1.0
MT 1415 VIDA/MT0909 93.5 164.7 30.4 48.0 58.5 10.1 16.9 346.5 0.7
MT 1417 VIDA/MT0921 97.4 163.0 30.2 39.9 53.5 10.1 16.8 318.0 2.3
MT 1418 VIDA/MT0921 90.8 163.7 26.8 38.2 50.7 10.1 16.3 326.6 1.0
Advanced Yield Spring Wheat Cultivar Evaluation Nursery Grown On-Station Under No-Till
Dryland Fallow Conditions. Northern Agricultural Research Center. Havre, MT. 2015.
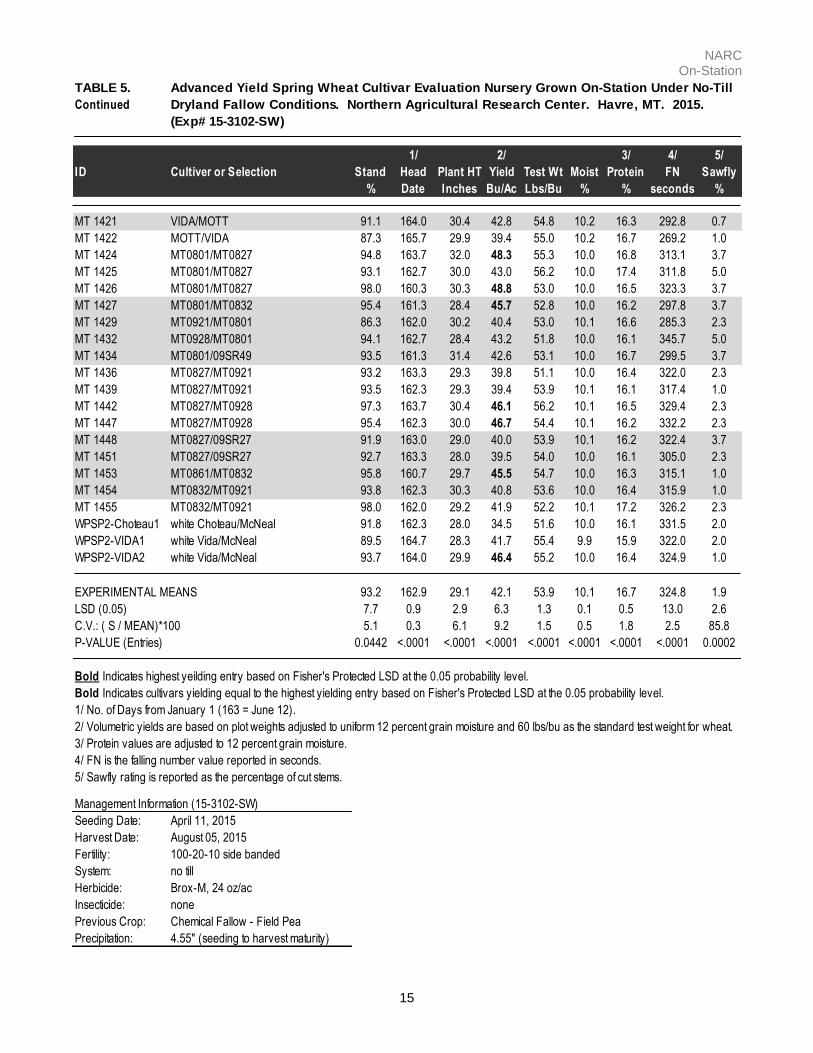
NARC On-Station
15
TABLE 5.
Continued
(Exp# 15-3102-SW)
1/ 2/ 3/ 4/ 5/
ID Cultiver or Selection Stand Head Plant HT Yield Test Wt Moist Protein FN Sawfly
% Date Inches Bu/Ac Lbs/Bu % % seconds %
MT 1421 VIDA/MOTT 91.1 164.0 30.4 42.8 54.8 10.2 16.3 292.8 0.7
MT 1422 MOTT/VIDA 87.3 165.7 29.9 39.4 55.0 10.2 16.7 269.2 1.0
MT 1424 MT0801/MT0827 94.8 163.7 32.0 48.3 55.3 10.0 16.8 313.1 3.7
MT 1425 MT0801/MT0827 93.1 162.7 30.0 43.0 56.2 10.0 17.4 311.8 5.0
MT 1426 MT0801/MT0827 98.0 160.3 30.3 48.8 53.0 10.0 16.5 323.3 3.7
MT 1427 MT0801/MT0832 95.4 161.3 28.4 45.7 52.8 10.0 16.2 297.8 3.7
MT 1429 MT0921/MT0801 86.3 162.0 30.2 40.4 53.0 10.1 16.6 285.3 2.3
MT 1432 MT0928/MT0801 94.1 162.7 28.4 43.2 51.8 10.0 16.1 345.7 5.0
MT 1434 MT0801/09SR49 93.5 161.3 31.4 42.6 53.1 10.0 16.7 299.5 3.7
MT 1436 MT0827/MT0921 93.2 163.3 29.3 39.8 51.1 10.0 16.4 322.0 2.3
MT 1439 MT0827/MT0921 93.5 162.3 29.3 39.4 53.9 10.1 16.1 317.4 1.0
MT 1442 MT0827/MT0928 97.3 163.7 30.4 46.1 56.2 10.1 16.5 329.4 2.3
MT 1447 MT0827/MT0928 95.4 162.3 30.0 46.7 54.4 10.1 16.2 332.2 2.3
MT 1448 MT0827/09SR27 91.9 163.0 29.0 40.0 53.9 10.1 16.2 322.4 3.7
MT 1451 MT0827/09SR27 92.7 163.3 28.0 39.5 54.0 10.0 16.1 305.0 2.3
MT 1453 MT0861/MT0832 95.8 160.7 29.7 45.5 54.7 10.0 16.3 315.1 1.0
MT 1454 MT0832/MT0921 93.8 162.3 30.3 40.8 53.6 10.0 16.4 315.9 1.0
MT 1455 MT0832/MT0921 98.0 162.0 29.2 41.9 52.2 10.1 17.2 326.2 2.3
WPSP2-Choteau1 white Choteau/McNeal 91.8 162.3 28.0 34.5 51.6 10.0 16.1 331.5 2.0
WPSP2-VIDA1 white Vida/McNeal 89.5 164.7 28.3 41.7 55.4 9.9 15.9 322.0 2.0
WPSP2-VIDA2 white Vida/McNeal 93.7 164.0 29.9 46.4 55.2 10.0 16.4 324.9 1.0
93.2 162.9 29.1 42.1 53.9 10.1 16.7 324.8 1.9
LSD (0.05) 7.7 0.9 2.9 6.3 1.3 0.1 0.5 13.0 2.6
C.V.: ( S / MEAN)*100 5.1 0.3 6.1 9.2 1.5 0.5 1.8 2.5 85.8
P-VALUE (Entries) 0.0442 <.0001 <.0001 <.0001 <.0001 <.0001 <.0001 <.0001 0.0002
Bold Indicates highest yeilding entry based on Fisher's Protected LSD at the 0.05 probability level.
Bold Indicates cultivars yielding equal to the highest yielding entry based on Fisher's Protected LSD at the 0.05 probability level.
1/ No. of Days from January 1 (163 = June 12).
2/ Volumetric yields are based on plot weights adjusted to uniform 12 percent grain moisture and 60 lbs/bu as the standard test weight for wheat.
3/ Protein values are adjusted to 12 percent grain moisture.
4/ FN is the falling number value reported in seconds.
5/ Sawfly rating is reported as the percentage of cut stems.
Management Information (15-3102-SW)
Seeding Date: April 11, 2015
Harvest Date: August 05, 2015
Fertility: 100-20-10 side banded
System: no till
Herbicide: Brox-M, 24 oz/ac
Insecticide: none
Previous Crop: Chemical Fallow - Field Pea
Precipitation: 4.55" (seeding to harvest maturity)
Advanced Yield Spring Wheat Cultivar Evaluation Nursery Grown On-Station Under No-Till
Dryland Fallow Conditions. Northern Agricultural Research Center. Havre, MT. 2015.
EXPERIMENTAL MEANS
NARC On-Station
16
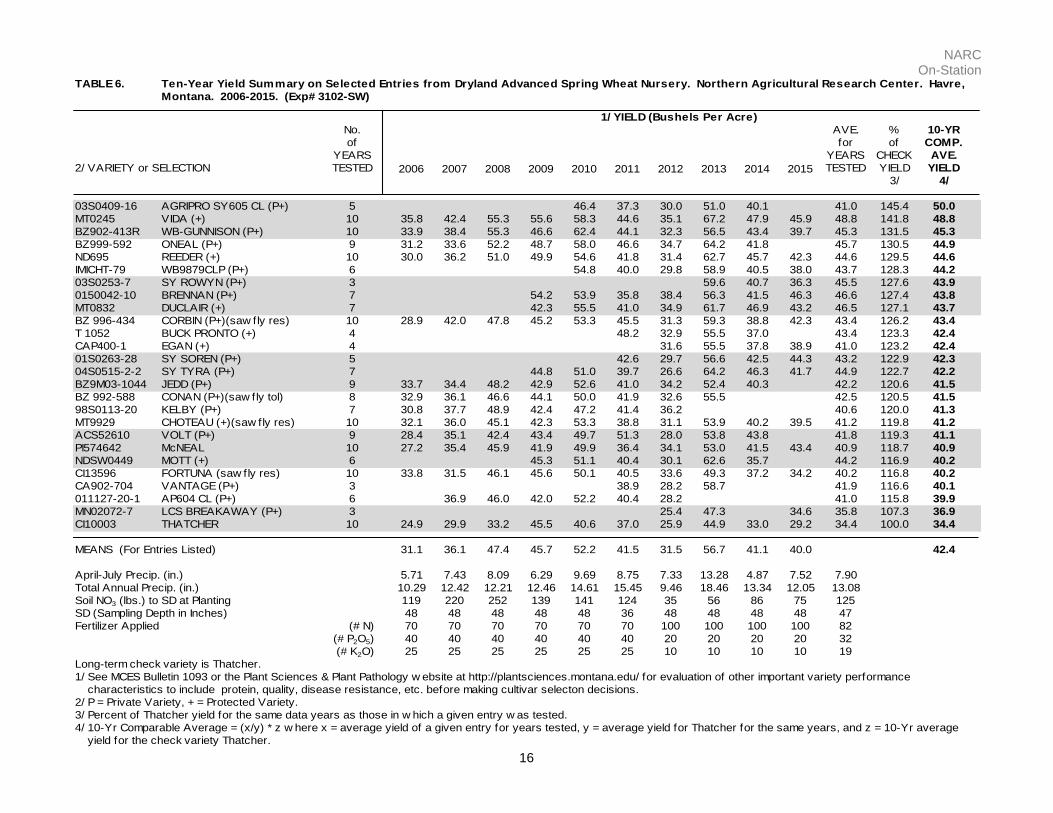
TABLE 6.
Montana. 2006-2015. (Exp# 3102-SW)
No. AVE. % 10-YR
of for of COMP.
YEARS YEARS CHECK AVE.
2/ VARIETY or SELECTION TESTED 2006 2007 2008 2009 2010 2011 2012 2013 2014 2015 TESTED YIELD YIELD
3/ 4/
03S0409-16 AGRIPRO SY605 CL (P+) 5 46.4 37.3 30.0 51.0 40.1 41.0 145.4 50.0
MT0245 VIDA (+) 10 35.8 42.4 55.3 55.6 58.3 44.6 35.1 67.2 47.9 45.9 48.8 141.8 48.8
BZ902-413R WB-GUNNISON (P+) 10 33.9 38.4 55.3 46.6 62.4 44.1 32.3 56.5 43.4 39.7 45.3 131.5 45.3
BZ999-592 ONEAL (P+) 9 31.2 33.6 52.2 48.7 58.0 46.6 34.7 64.2 41.8 45.7 130.5 44.9
ND695 REEDER (+) 10 30.0 36.2 51.0 49.9 54.6 41.8 31.4 62.7 45.7 42.3 44.6 129.5 44.6
IMICHT-79 WB9879CLP (P+) 6 54.8 40.0 29.8 58.9 40.5 38.0 43.7 128.3 44.2
03S0253-7 SY ROWYN (P+) 3 59.6 40.7 36.3 45.5 127.6 43.9
0150042-10 BRENNAN (P+) 7 54.2 53.9 35.8 38.4 56.3 41.5 46.3 46.6 127.4 43.8
MT0832 DUCLAIR (+) 7 42.3 55.5 41.0 34.9 61.7 46.9 43.2 46.5 127.1 43.7
BZ 996-434 CORBIN (P+)(saw fly res) 10 28.9 42.0 47.8 45.2 53.3 45.5 31.3 59.3 38.8 42.3 43.4 126.2 43.4
T 1052 BUCK PRONTO (+) 4 48.2 32.9 55.5 37.0 43.4 123.3 42.4
CAP400-1 EGAN (+) 4 31.6 55.5 37.8 38.9 41.0 123.2 42.4
01S0263-28 SY SOREN (P+) 5 42.6 29.7 56.6 42.5 44.3 43.2 122.9 42.3
04S0515-2-2 SY TYRA (P+) 7 44.8 51.0 39.7 26.6 64.2 46.3 41.7 44.9 122.7 42.2
BZ9M03-1044 JEDD (P+) 9 33.7 34.4 48.2 42.9 52.6 41.0 34.2 52.4 40.3 42.2 120.6 41.5
BZ 992-588 CONAN (P+)(saw fly tol) 8 32.9 36.1 46.6 44.1 50.0 41.9 32.6 55.5 42.5 120.5 41.5
98S0113-20 KELBY (P+) 7 30.8 37.7 48.9 42.4 47.2 41.4 36.2 40.6 120.0 41.3
MT9929 CHOTEAU (+)(saw fly res) 10 32.1 36.0 45.1 42.3 53.3 38.8 31.1 53.9 40.2 39.5 41.2 119.8 41.2
ACS52610 VOLT (P+) 9 28.4 35.1 42.4 43.4 49.7 51.3 28.0 53.8 43.8 41.8 119.3 41.1
PI574642 McNEAL 10 27.2 35.4 45.9 41.9 49.9 36.4 34.1 53.0 41.5 43.4 40.9 118.7 40.9
NDSW0449 MOTT (+) 6 45.3 51.1 40.4 30.1 62.6 35.7 44.2 116.9 40.2
CI13596 FORTUNA (saw fly res) 10 33.8 31.5 46.1 45.6 50.1 40.5 33.6 49.3 37.2 34.2 40.2 116.8 40.2
CA902-704 VANTAGE (P+) 3 38.9 28.2 58.7 41.9 116.6 40.1
011127-20-1 AP604 CL (P+) 6 36.9 46.0 42.0 52.2 40.4 28.2 41.0 115.8 39.9
MN02072-7 LCS BREAKAWAY (P+) 3 25.4 47.3 34.6 35.8 107.3 36.9
CI10003 THATCHER 10 24.9 29.9 33.2 45.5 40.6 37.0 25.9 44.9 33.0 29.2 34.4 100.0 34.4
31.1 36.1 47.4 45.7 52.2 41.5 31.5 56.7 41.1 40.0 42.4
April-July Precip. (in.) 5.71 7.43 8.09 6.29 9.69 8.75 7.33 13.28 4.87 7.52 7.90
Total Annual Precip. (in.) 10.29 12.42 12.21 12.46 14.61 15.45 9.46 18.46 13.34 12.05 13.08
Soil NO3 (lbs.) to SD at Planting 119 220 252 139 141 124 35 56 86 75 125
SD (Sampling Depth in Inches) 48 48 48 48 48 36 48 48 48 48 47
Fertilizer Applied (# N) 70 70 70 70 70 70 100 100 100 100 82
(# P2O5) 40 40 40 40 40 40 20 20 20 20 32
(# K2O) 25 25 25 25 25 25 10 10 10 10 19
Long-term check variety is Thatcher.
1/ See MCES Bulletin 1093 or the Plant Sciences & Plant Pathology w ebsite at http://plantsciences.montana.edu/ for evaluation of other important variety performance
characteristics to include protein, quality, disease resistance, etc. before making cultivar selecton decisions.
2/ P = Private Variety, + = Protected Variety.
3/ Percent of Thatcher yield for the same data years as those in w hich a given entry w as tested.
4/ 10-Yr Comparable Average = (x/y) * z w here x = average yield of a given entry for years tested, y = average yield for Thatcher for the same years, and z = 10-Yr average
yield for the check variety Thatcher.
Ten-Year Yield Summary on Selected Entries from Dryland Advanced Spring Wheat Nursery. Northern Agricultural Research Center. Havre,
1/ YIELD (Bushels Per Acre)
MEANS (For Entries Listed)

NARC On-Station
17
TABLE 7.
No. AVE. % 10-YR
of for of COMP.
YEARS YEARS CHECK AVE.
2/ VARIETY or SELECTION TESTED 2006 2007 2008 2009 2010 2011 2012 2013 2014 2015 TESTED TEST WTTEST WT
3/ 4/
98S0113-20 KELBY (P+) 7 57.2 59.2 59.6 59.5 58.2 62.3 56.3 58.9 107.6 59.1
0150042-10 BRENNAN (P+) 7 59.3 58.4 62.4 56.5 63.3 61.5 56.6 59.7 107.0 58.8
BZ902-413R VOLT (P+) 9 56.4 57.5 59.1 59.8 58.0 63.2 53.7 63.8 60.1 59.1 106.5 58.5
BZ9M03-1044 JEDD (P+) 9 55.5 58.1 57.9 59.7 57.4 61.5 55.3 63.0 60.8 58.8 106.0 58.2
CA902-704 VANTAGE (P+) 3 63.0 56.1 62.6 60.5 106.0 58.2
03S0409-16 AGRIPRO SY605 CL (P+) 5 59.5 60.9 54.5 62.9 60.5 59.6 105.9 58.2
BZ902-413R WB-GUNNISON (P+) 10 54.3 57.4 59.0 60.2 59.5 60.2 52.9 62.6 58.2 56.1 58.0 105.6 58.0
MN02072-7 LCS BREAKAWAY (P+) 3 53.0 63.4 54.5 57.0 105.6 58.0
CI13596 FORTUNA (saw fly res) 10 56.0 56.8 58.8 59.4 57.7 60.7 54.6 61.9 58.7 54.6 57.9 105.4 57.9
BZ 992-588 CONAN (P+)(saw fly tol) 8 54.6 57.5 58.6 59.8 58.5 61.2 56.1 62.1 58.6 105.4 57.9
03S0253-7 SY ROWYN (P+) 3 62.2 58.8 53.7 58.3 105.1 57.7
ND695 REEDER (+) 10 53.6 56.8 58.2 60.0 57.8 61.3 52.9 62.8 58.5 54.4 57.6 104.9 57.6
BZ999-592 ONEAL (P+) 9 54.1 56.0 57.8 60.6 58.9 61.1 53.4 62.8 58.3 58.1 104.8 57.6
011127-20-1 AP604 CL (P+) 6 57.9 58.6 59.9 57.6 60.8 52.6 57.9 104.6 57.5
BZ 996-434 CORBIN (P+)(saw fly res) 10 54.7 57.6 57.0 59.9 57.2 61.2 51.3 62.7 59.5 53.3 57.4 104.5 57.4
01S0263-28 SY SOREN (P+) 5 61.3 51.5 63.0 59.5 53.1 57.7 104.4 57.4
T 1052 BUCK PRONTO (+) 4 60.7 53.6 62.3 59.3 59.0 104.3 57.3
04S0515-2-2 SY TYRA (P+) 7 59.4 56.7 59.9 52.8 63.9 61.5 53.5 58.2 104.3 57.3
CAP400-1 EGAN (+) 4 54.1 60.8 56.9 53.5 56.3 104.0 57.2
MT0245 VIDA (+) 10 52.0 55.8 58.6 58.8 57.7 60.8 50.8 62.4 58.6 53.8 56.9 103.6 56.9
IMICHT-79 WB9879CLP (P+) 6 56.9 60.2 51.9 61.7 58.6 53.8 57.2 103.4 56.8
PI574642 McNEAL 10 52.7 54.5 56.0 58.5 57.4 59.1 52.3 61.8 56.8 54.5 56.4 102.6 56.4
MT9929 CHOTEAU (+)(saw fly res) 10 52.8 55.7 56.3 57.9 56.5 59.6 52.0 61.5 58.3 52.8 56.4 102.6 56.4
NDSW0449 MOTT (+) 6 58.0 56.4 60.7 51.4 62.8 58.1 57.9 102.0 56.0
MT0832 DUCLAIR (+) 7 57.8 57.3 59.1 51.6 61.2 58.1 52.5 56.8 101.8 55.9
CI10003 THATCHER 10 51.1 52.5 55.1 58.9 55.5 59.8 50.2 61.5 54.7 50.1 54.9 100.0 54.9
MEANS (For Entries Listed) 54.2 56.7 57.9 59.3 57.7 60.9 53.2 62.5 58.8 53.8 57.4
April-July Precip. (in.) 5.71 7.43 8.09 6.29 9.69 8.75 7.33 13.28 4.87 7.52 7.90
Total Annual Precip. (in.) 10.29 12.42 12.21 12.46 14.61 15.45 9.46 18.46 13.34 12.05 13.08
Soil NO3 (lbs.) to SD at Planting 119 220 252 139 141 124 35 56 86 75 125
SD (Sampling Depth in Inches) 48 48 48 48 48 36 48 48 48 48 47
Fertilizer Applied (# N) 70 70 70 70 70 70 100 100 100 100 82
(# P2O5) 40 40 40 40 40 40 20 20 20 20 32
(# K2O) 25 25 25 25 25 25 10 10 10 10 19
Long-term check variety is Thatcher.
1/ See MCES Bulletin 1093 or the Plant Sciences & Plant Pathology w ebsite at http://plantsciences.montana.edu/ for evaluation of other important variety performance
characteristics to include protein, quality, disease resistance, etc. before making cultivar selecton decisions.
2/ P = Private Variety, + = Protected Variety.
3/ Percent of Thatcher test w eight for the same data years as those in w hich a given entry w as tested.
4/ 10-Yr Comparable Average = (x/y) * z w here x = average test w eight of a given entry for years tested, y = average test w eight for Thatcher for the same years, and
z = 10-Yr average test w eight for the check variety Thatcher.
Ten-Year Test Weight Summary on Selected Entries from Dryland Advanced Spring Wheat Nursery. Northern Agricultural Research Center.
Havre, Montana. 2006-2015. (Exp# 3102-SW)
1/ TEST WEIGHT (Pounds Per Bushel)
NARC On-Station
18
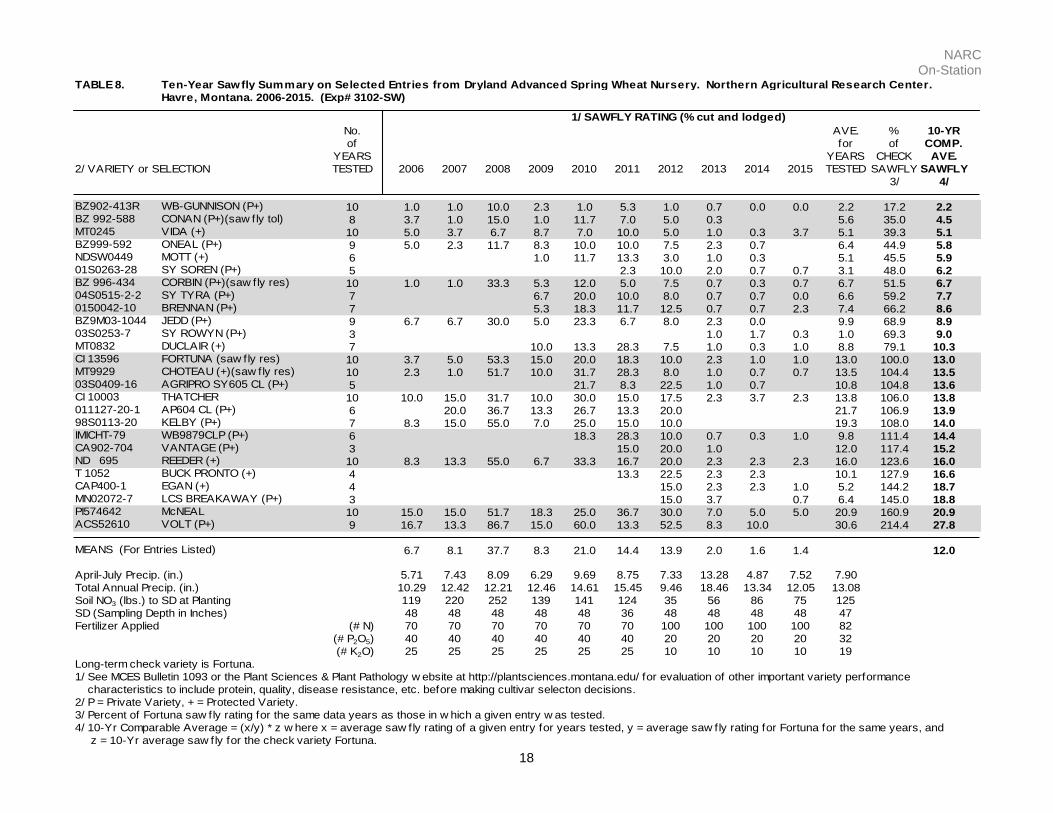
TABLE 8.
Havre, Montana. 2006-2015. (Exp# 3102-SW)
No. AVE. % 10-YR
of for of COMP.
YEARS YEARS CHECK AVE.
2/ VARIETY or SELECTION TESTED 2006 2007 2008 2009 2010 2011 2012 2013 2014 2015 TESTED SAWFLY SAWFLY
3/ 4/
BZ902-413R WB-GUNNISON (P+) 10 1.0 1.0 10.0 2.3 1.0 5.3 1.0 0.7 0.0 0.0 2.2 17.2 2.2BZ 992-588 CONAN (P+)(saw fly tol) 8 3.7 1.0 15.0 1.0 11.7 7.0 5.0 0.3 5.6 35.0 4.5MT0245 VIDA (+) 10 5.0 3.7 6.7 8.7 7.0 10.0 5.0 1.0 0.3 3.7 5.1 39.3 5.1BZ999-592 ONEAL (P+) 9 5.0 2.3 11.7 8.3 10.0 10.0 7.5 2.3 0.7 6.4 44.9 5.8NDSW0449 MOTT (+) 6 1.0 11.7 13.3 3.0 1.0 0.3 5.1 45.5 5.901S0263-28 SY SOREN (P+) 5 2.3 10.0 2.0 0.7 0.7 3.1 48.0 6.2BZ 996-434 CORBIN (P+)(saw fly res) 10 1.0 1.0 33.3 5.3 12.0 5.0 7.5 0.7 0.3 0.7 6.7 51.5 6.704S0515-2-2 SY TYRA (P+) 7 6.7 20.0 10.0 8.0 0.7 0.7 0.0 6.6 59.2 7.70150042-10 BRENNAN (P+) 7 5.3 18.3 11.7 12.5 0.7 0.7 2.3 7.4 66.2 8.6BZ9M03-1044 JEDD (P+) 9 6.7 6.7 30.0 5.0 23.3 6.7 8.0 2.3 0.0 9.9 68.9 8.903S0253-7 SY ROWYN (P+) 3 1.0 1.7 0.3 1.0 69.3 9.0MT0832 DUCLAIR (+) 7 10.0 13.3 28.3 7.5 1.0 0.3 1.0 8.8 79.1 10.3CI 13596 FORTUNA (saw fly res) 10 3.7 5.0 53.3 15.0 20.0 18.3 10.0 2.3 1.0 1.0 13.0 100.0 13.0MT9929 CHOTEAU (+)(saw fly res) 10 2.3 1.0 51.7 10.0 31.7 28.3 8.0 1.0 0.7 0.7 13.5 104.4 13.503S0409-16 AGRIPRO SY605 CL (P+) 5 21.7 8.3 22.5 1.0 0.7 10.8 104.8 13.6CI 10003 THATCHER 10 10.0 15.0 31.7 10.0 30.0 15.0 17.5 2.3 3.7 2.3 13.8 106.0 13.8011127-20-1 AP604 CL (P+) 6 20.0 36.7 13.3 26.7 13.3 20.0 21.7 106.9 13.998S0113-20 KELBY (P+) 7 8.3 15.0 55.0 7.0 25.0 15.0 10.0 19.3 108.0 14.0IMICHT-79 WB9879CLP (P+) 6 18.3 28.3 10.0 0.7 0.3 1.0 9.8 111.4 14.4CA902-704 VANTAGE (P+) 3 15.0 20.0 1.0 12.0 117.4 15.2ND 695 REEDER (+) 10 8.3 13.3 55.0 6.7 33.3 16.7 20.0 2.3 2.3 2.3 16.0 123.6 16.0T 1052 BUCK PRONTO (+) 4 13.3 22.5 2.3 2.3 10.1 127.9 16.6CAP400-1 EGAN (+) 4 15.0 2.3 2.3 1.0 5.2 144.2 18.7MN02072-7 LCS BREAKAWAY (P+) 3 15.0 3.7 0.7 6.4 145.0 18.8PI574642 McNEAL 10 15.0 15.0 51.7 18.3 25.0 36.7 30.0 7.0 5.0 5.0 20.9 160.9 20.9ACS52610 VOLT (P+) 9 16.7 13.3 86.7 15.0 60.0 13.3 52.5 8.3 10.0 30.6 214.4 27.8
6.7 8.1 37.7 8.3 21.0 14.4 13.9 2.0 1.6 1.4 12.0
April-July Precip. (in.) 5.71 7.43 8.09 6.29 9.69 8.75 7.33 13.28 4.87 7.52 7.90
Total Annual Precip. (in.) 10.29 12.42 12.21 12.46 14.61 15.45 9.46 18.46 13.34 12.05 13.08
Soil NO3 (lbs.) to SD at Planting 119 220 252 139 141 124 35 56 86 75 125
SD (Sampling Depth in Inches) 48 48 48 48 48 36 48 48 48 48 47
Fertilizer Applied (# N) 70 70 70 70 70 70 100 100 100 100 82
(# P2O5) 40 40 40 40 40 40 20 20 20 20 32
(# K2O) 25 25 25 25 25 25 10 10 10 10 19
Long-term check variety is Fortuna.
1/ See MCES Bulletin 1093 or the Plant Sciences & Plant Pathology w ebsite at http://plantsciences.montana.edu/ for evaluation of other important variety performance
characteristics to include protein, quality, disease resistance, etc. before making cultivar selecton decisions.
2/ P = Private Variety, + = Protected Variety.
3/ Percent of Fortuna saw fly rating for the same data years as those in w hich a given entry w as tested.
4/ 10-Yr Comparable Average = (x/y) * z w here x = average saw fly rating of a given entry for years tested, y = average saw fly rating for Fortuna for the same years, and
z = 10-Yr average saw fly for the check variety Fortuna.
Ten-Year Sawfly Summary on Selected Entries from Dryland Advanced Spring Wheat Nursery. Northern Agricultural Research Center.
1/ SAWFLY RATING (% cut and lodged)
MEANS (For Entries Listed)

NARC On-Station
19
Table 9.
(Exp# 15-9802-SW)
1/ 2/ 3/ 4/ 5/
Entry Culitvar or Stand Head Plant HT Yield Test Wt Moisture Protein FN Sawfly
Selection % Date Inches Bu/Ac Lbs/Bu % % seconds %
ALKABO D96604 88.1 167.0 30.8 35.0 56.7 8.7 16.5 320.9 0.7
CARPIO D03028 86.4 169.0 32.2 34.6 56.2 8.8 17.0 358.5 1.0
DIVIDE D9715-11 91.4 168.3 31.7 34.9 55.4 8.5 17.2 341.9 0.3
GRENORA D97780 80.7 167.3 31.3 31.3 55.8 8.4 16.2 309.1 0.3
JOPPA D04581 91.6 166.7 31.4 34.8 55.8 8.7 16.6 335.5 2.0
MOUNTRAIL D901313 91.9 168.7 31.0 38.8 55.9 8.6 16.5 346.3 0.0
SILVER MT03012 96.7 162.3 25.5 35.2 54.2 8.4 16.7 302.1 1.0
TIOGA D00095 92.9 167.7 33.6 34.4 55.7 8.4 17.3 310.3 2.3
MT101694 CC4 97.4 167.0 34.9 32.5 55.6 8.2 16.9 336.2 5.0
MT101717 CC4 93.5 166.0 26.8 34.4 58.5 8.9 16.1 357.7 0.7
MT112219 MT06541 x Syrian 7 97.1 163.0 28.8 42.0 57.3 8.8 15.8 364.5 0.3
MT112434 Alzada x Cimmyt 5 94.8 163.7 24.8 38.7 55.8 8.6 15.7 341.9 0.3
MT112444 Alzada x Cimmyt 5 94.8 163.7 26.7 36.9 54.4 8.3 15.8 365.1 1.0
MT112463 Alzada x Cimmyt 8 95.8 164.7 27.7 37.7 55.2 8.4 15.5 352.9 0.3
EXPERIMENTAL MEANS 92.4 166.1 29.8 35.8 55.9 8.6 16.4 338.8 1.1
LSD (0.05) 8.0 1.2 3.1 3.5 0.9 0.2 0.5 10.5 1.7
C.V.: ( S / MEAN)*100 5.2 0.4 6.3 5.9 1.0 1.7 1.6 1.8 91.1
P-VALUE (Entries) 0.0116 <.0001 <.0001 0.0002 <.0001 <.0001 <.0001 <.0001 0.0002
1/ No. of Days from January 1 (166 = June 15).
2/ Volumetric yields are based on plot weights adjusted to uniform 12 percent grain moisture and 60 lbs/bu as the standard test weight for durum.
3/ Protein values are adjusted to 12 percent grain moisture.
4/ FN is the falling number value reported in seconds.
5/ Sawfly rating is reported as the percentage of cut stems.
Bold indicates highest value within a column.
Bold indicates varieties with values equal to highest variety within a column based on Fisher's protected LSD (p=0.05).
Management Information (15-9802-DUR)
Seeding Date: April 13, 2015
Harvest Date: August 3, 2015
Fertility: 100-20-10 side banded
System: no till
Herbicide: Brox-M, 24 oz/ac
Insecticide: none
Previous Crop: Chemical Fallow-Field Pea
Precipitation: 7.46" (planting to harvest)
Montana Spring Durum Cultivar Evaluation Nursery Grown On-Station Under No-Till Dryland
Fallow Conditions. Northern Agricultural Research Center. Havre, Montana. 2015.
NARC On-Station
20
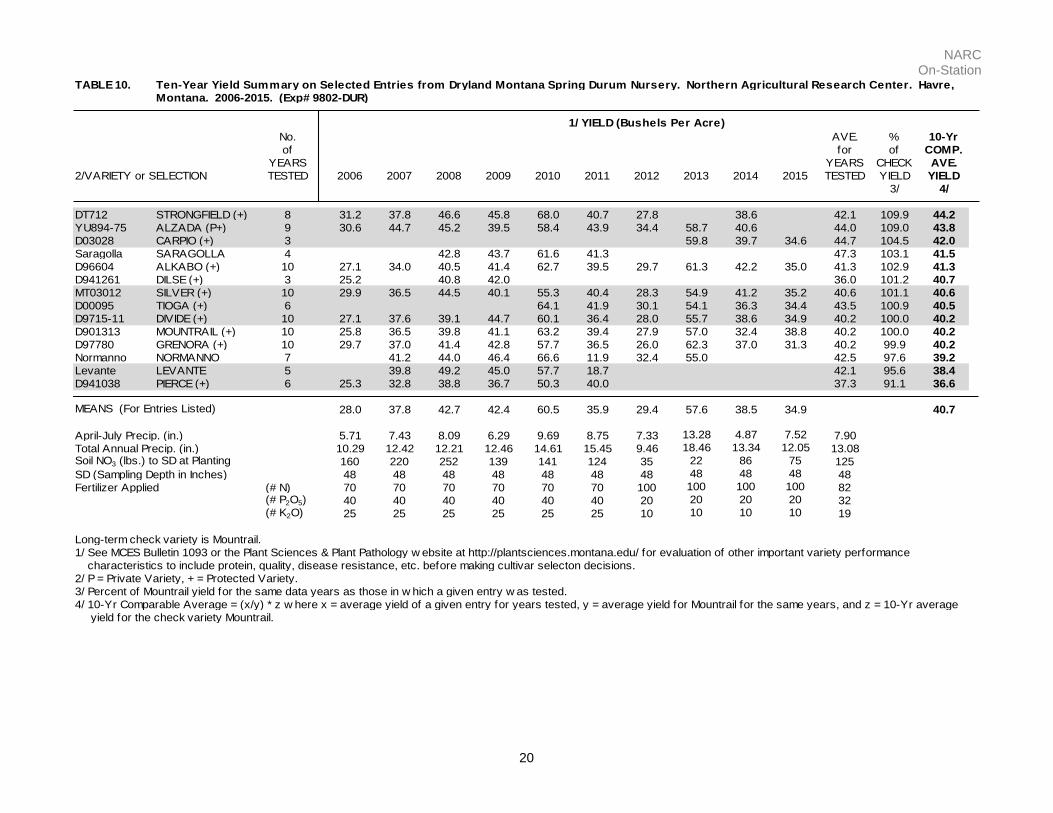
TABLE 10.
Montana. 2006-2015. (Exp# 9802-DUR)
No. AVE. % 10-Yr
of for of COMP.
YEARS YEARS CHECK AVE.
2/VARIETY or SELECTION TESTED 2006 2007 2008 2009 2010 2011 2012 2013 2014 2015 TESTED YIELD YIELD
3/ 4/
DT712 STRONGFIELD (+) 8 31.2 37.8 46.6 45.8 68.0 40.7 27.8 38.6 42.1 109.9 44.2
YU894-75 ALZADA (P+) 9 30.6 44.7 45.2 39.5 58.4 43.9 34.4 58.7 40.6 44.0 109.0 43.8
D03028 CARPIO (+) 3 59.8 39.7 34.6 44.7 104.5 42.0
Saragolla SARAGOLLA 4 42.8 43.7 61.6 41.3 47.3 103.1 41.5
D96604 ALKABO (+) 10 27.1 34.0 40.5 41.4 62.7 39.5 29.7 61.3 42.2 35.0 41.3 102.9 41.3
D941261 DILSE (+) 3 25.2 40.8 42.0 36.0 101.2 40.7
MT03012 SILVER (+) 10 29.9 36.5 44.5 40.1 55.3 40.4 28.3 54.9 41.2 35.2 40.6 101.1 40.6
D00095 TIOGA (+) 6 64.1 41.9 30.1 54.1 36.3 34.4 43.5 100.9 40.5
D9715-11 DIVIDE (+) 10 27.1 37.6 39.1 44.7 60.1 36.4 28.0 55.7 38.6 34.9 40.2 100.0 40.2
D901313 MOUNTRAIL (+) 10 25.8 36.5 39.8 41.1 63.2 39.4 27.9 57.0 32.4 38.8 40.2 100.0 40.2
D97780 GRENORA (+) 10 29.7 37.0 41.4 42.8 57.7 36.5 26.0 62.3 37.0 31.3 40.2 99.9 40.2
Normanno NORMANNO 7 41.2 44.0 46.4 66.6 11.9 32.4 55.0 42.5 97.6 39.2
Levante LEVANTE 5 39.8 49.2 45.0 57.7 18.7 42.1 95.6 38.4
D941038 PIERCE (+) 6 25.3 32.8 38.8 36.7 50.3 40.0 37.3 91.1 36.6
28.0 37.8 42.7 42.4 60.5 35.9 29.4 57.6 38.5 34.9 40.7
April-July Precip. (in.) 5.71 7.43 8.09 6.29 9.69 8.75 7.33 13.28 4.87 7.52 7.90
Total Annual Precip. (in.) 10.29 12.42 12.21 12.46 14.61 15.45 9.46 18.46 13.34 12.05 13.08Soil NO3 (lbs.) to SD at Planting 160 220 252 139 141 124 35 22 86 75 125
SD (Sampling Depth in Inches) 48 48 48 48 48 48 48 48 48 48 48
Fertilizer Applied (# N) 70 70 70 70 70 70 100 100 100 100 82(# P2O5) 40 40 40 40 40 40 20 20 20 20 32(# K2O) 25 25 25 25 25 25 10 10 10 10 19
Long-term check variety is Mountrail.
1/ See MCES Bulletin 1093 or the Plant Sciences & Plant Pathology w ebsite at http://plantsciences.montana.edu/ for evaluation of other important variety performance
characteristics to include protein, quality, disease resistance, etc. before making cultivar selecton decisions.
2/ P = Private Variety, + = Protected Variety.
3/ Percent of Mountrail yield for the same data years as those in w hich a given entry w as tested.
4/ 10-Yr Comparable Average = (x/y) * z w here x = average yield of a given entry for years tested, y = average yield for Mountrail for the same years, and z = 10-Yr average
yield for the check variety Mountrail.
Ten-Year Yield Summary on Selected Entries from Dryland Montana Spring Durum Nursery. Northern Agricultural Research Center. Havre,
1/ YIELD (Bushels Per Acre)
MEANS (For Entries Listed)

NARC On-Station
21
TABLE 11.
Havre, Montana. 2006-2015. (Exp# 9802-DUR)
No. AVE. % 10-Yr
of for of COMP.
YEARS YEARS CHECK AVE.
VARIETY or SELECTION TESTED 2006 2007 2008 2009 2010 2011 2012 2013 2014 2015 TESTED TEST WTTEST WT
2/ 3/
D96604 ALKABO (+) 10 54.6 58.9 58.3 58.6 58.7 60.9 57.7 63.6 57.8 56.7 58.6 101.8 58.6
D941261 DILSE (+) 3 55.4 58.2 58.5 57.4 101.8 58.6
D941038 PIERCE (+) 6 54.6 59.2 58.6 58.9 58.3 60.7 58.4 101.4 58.3
Levante LEVANTE 5 58.4 58.4 59.1 58.1 60.3 58.9 101.4 58.3
D9715-11 DIVIDE (+) 10 55.5 58.7 57.8 58.4 58.2 60.0 56.6 63.6 57.6 55.4 58.2 101.2 58.2
DT712 STRONGFIELD (+) 8 57.3 57.6 57.2 58.8 58.7 59.9 54.3 56.6 57.6 101.0 58.1
D00095 TIOGA (+) 6 58.0 60.7 55.7 64.0 56.9 55.7 58.5 100.8 58.0
D97780 GRENORA (+) 10 55.7 57.9 57.4 57.5 58.0 60.6 55.2 63.3 56.9 55.8 57.8 100.5 57.8
D03028 CARPIO (+) 3 63.4 56.7 56.2 58.7 100.4 57.7
MT03012 SILVER (+) 10 55.4 57.9 55.6 58.2 56.6 60.4 57.2 62.9 58.8 54.2 57.7 100.3 57.7
YU894-75 ALZADA (P+) 9 53.8 57.5 55.7 58.9 58.2 59.9 55.8 62.8 58.1 57.9 100.3 57.7
D901313 MOUNTRAIL (+) 10 55.0 58.1 55.7 58.4 58.4 59.9 54.2 63.4 56.3 55.9 57.5 100.0 57.5
Normanno NORMANNO 7 57.1 55.7 58.2 57.9 58.9 56.5 62.9 58.2 99.8 57.4
Saragolla SARAGOLLA 4 55.3 58.1 56.3 59.0 57.2 98.4 56.6
55.3 58.1 57.0 58.5 57.9 60.1 55.9 63.3 57.3 55.7 57.9
April-July Precip. (in.) 5.71 7.43 8.09 6.29 9.69 8.75 7.33 13.28 4.87 7.52 7.90
Total Annual Precip. (in.) 10.29 12.42 12.21 12.46 14.61 15.45 9.46 18.46 13.34 12.05 13.08Soil NO3 (lbs.) to SD at Planting 160 220 252 139 141 124 35 22 86 75 125
SD (Sampling Depth in Inches) 48 48 48 48 48 48 48 48 48 48 48
Fertilizer Applied (# N) 70 70 70 70 70 70 100 100 100 100 82(# P2O5) 40 40 40 40 40 40 20 20 20 20 32(# K2O) 25 25 25 25 25 25 10 10 10 10 19
Long-term check variety is Mountrail.
1/ See MCES Bulletin 1093 or the Plant Sciences & Plant Pathology w ebsite at http://plantsciences.montana.edu/ for evaluation of other important variety performance
characteristics to include protein, quality, disease resistance, etc. before making cultivar selecton decisions.
2/ P = Private Variety, + = Protected Variety.
3/ Percent of Mountrail test w eight for the same data years as those in w hich a given entry w as tested.
4/ 10-Yr Comparable Average = (x/y) * z w here x = average test w eight of a given entry for years tested, y = average test w eight for Mountrail for the same years, and z = 10-Yr
average test w eight for the check variety Mountrail.
Ten-Year Test Weight Summary on Selected Entries from Dryland Montana Spring Durum Nursery. Northern Agricultural Research Center.
1/ TEST WEIGHT (Pounds Per Bushel)
MEANS (For Entries Listed)
NARC On-Station
22
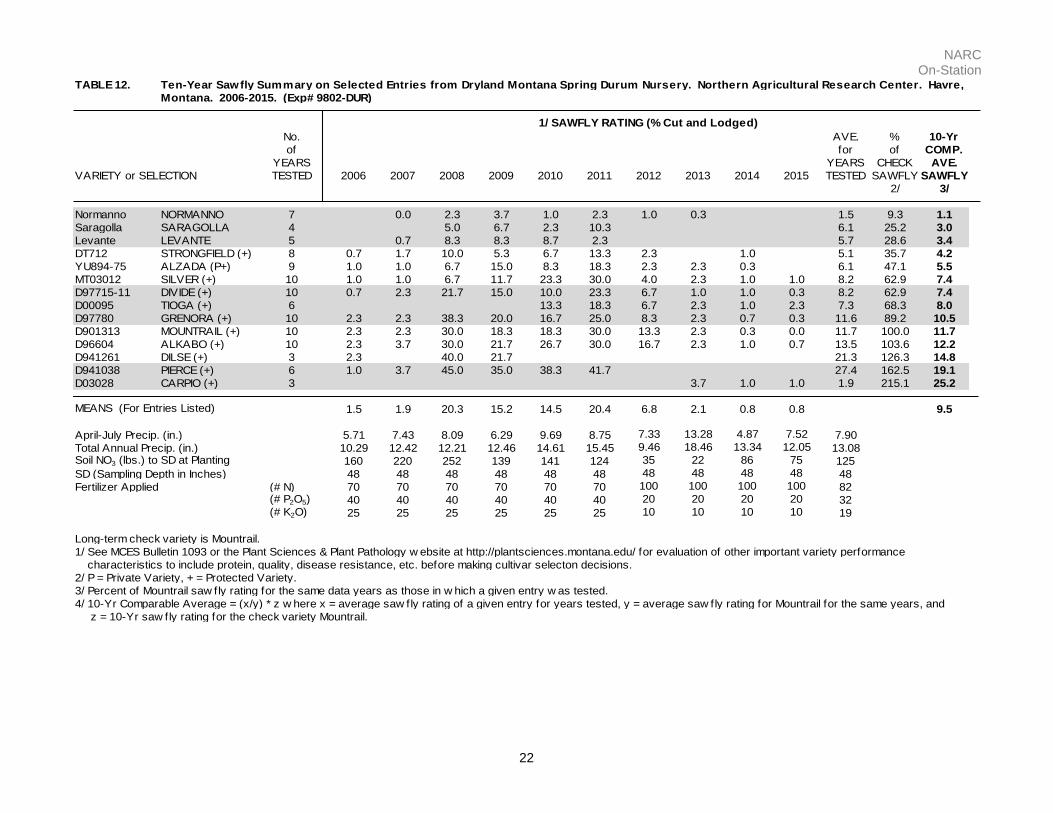
TABLE 12. Ten-Year Sawfly Summary on Selected Entries from Dryland Montana Spring Durum Nursery. Northern Agricultural Research Center. Havre,
Montana. 2006-2015. (Exp# 9802-DUR)
No. AVE. % 10-Yr
of for of COMP.
YEARS YEARS CHECK AVE.
VARIETY or SELECTION TESTED 2006 2007 2008 2009 2010 2011 2012 2013 2014 2015 TESTED SAWFLY SAWFLY
2/ 3/
Normanno NORMANNO 7 0.0 2.3 3.7 1.0 2.3 1.0 0.3 1.5 9.3 1.1
Saragolla SARAGOLLA 4 5.0 6.7 2.3 10.3 6.1 25.2 3.0
Levante LEVANTE 5 0.7 8.3 8.3 8.7 2.3 5.7 28.6 3.4
DT712 STRONGFIELD (+) 8 0.7 1.7 10.0 5.3 6.7 13.3 2.3 1.0 5.1 35.7 4.2
YU894-75 ALZADA (P+) 9 1.0 1.0 6.7 15.0 8.3 18.3 2.3 2.3 0.3 6.1 47.1 5.5
MT03012 SILVER (+) 10 1.0 1.0 6.7 11.7 23.3 30.0 4.0 2.3 1.0 1.0 8.2 62.9 7.4
D97715-11 DIVIDE (+) 10 0.7 2.3 21.7 15.0 10.0 23.3 6.7 1.0 1.0 0.3 8.2 62.9 7.4
D00095 TIOGA (+) 6 13.3 18.3 6.7 2.3 1.0 2.3 7.3 68.3 8.0
D97780 GRENORA (+) 10 2.3 2.3 38.3 20.0 16.7 25.0 8.3 2.3 0.7 0.3 11.6 89.2 10.5
D901313 MOUNTRAIL (+) 10 2.3 2.3 30.0 18.3 18.3 30.0 13.3 2.3 0.3 0.0 11.7 100.0 11.7
D96604 ALKABO (+) 10 2.3 3.7 30.0 21.7 26.7 30.0 16.7 2.3 1.0 0.7 13.5 103.6 12.2
D941261 DILSE (+) 3 2.3 40.0 21.7 21.3 126.3 14.8
D941038 PIERCE (+) 6 1.0 3.7 45.0 35.0 38.3 41.7 27.4 162.5 19.1
D03028 CARPIO (+) 3 3.7 1.0 1.0 1.9 215.1 25.2
1.5 1.9 20.3 15.2 14.5 20.4 6.8 2.1 0.8 0.8 9.5
April-July Precip. (in.) 5.71 7.43 8.09 6.29 9.69 8.75 7.33 13.28 4.87 7.52 7.90
Total Annual Precip. (in.) 10.29 12.42 12.21 12.46 14.61 15.45 9.46 18.46 13.34 12.05 13.08Soil NO3 (lbs.) to SD at Planting 160 220 252 139 141 124 35 22 86 75 125
SD (Sampling Depth in Inches) 48 48 48 48 48 48 48 48 48 48 48
Fertilizer Applied (# N) 70 70 70 70 70 70 100 100 100 100 82(# P2O5) 40 40 40 40 40 40 20 20 20 20 32(# K2O) 25 25 25 25 25 25 10 10 10 10 19
Long-term check variety is Mountrail.
1/ See MCES Bulletin 1093 or the Plant Sciences & Plant Pathology w ebsite at http://plantsciences.montana.edu/ for evaluation of other important variety performance
characteristics to include protein, quality, disease resistance, etc. before making cultivar selecton decisions.
2/ P = Private Variety, + = Protected Variety.
3/ Percent of Mountrail saw fly rating for the same data years as those in w hich a given entry w as tested.
4/ 10-Yr Comparable Average = (x/y) * z w here x = average saw fly rating of a given entry for years tested, y = average saw fly rating for Mountrail for the same years, and
z = 10-Yr saw fly rating for the check variety Mountrail.
1/ SAWFLY RATING (% Cut and Lodged)
MEANS (For Entries Listed)

NARC On-Station
23
TABLE 13.
(Exp# 15-2102-SB)
1/ 2/ 3/
ID Cultivar or Selection Stand Head Plant Ht Yield Test Wt Moisture Plump Thin Protein
% Date Inches Bu/Ac Lbs/Bu % % % %
AC Metcalfe 91.8 165.7 26.6 59.1 48.4 9.7 54.3 19.8 18.1
Champion 93.4 163.3 27.0 78.5 51.4 10.1 55.2 14.9 15.6
Conrad 94.7 168.7 22.4 65.3 48.9 9.8 52.3 22.0 17.6
Craft 97.0 162.3 29.3 70.2 51.4 10.0 64.6 15.6 16.3
Harrington 91.1 165.3 23.2 61.0 49.4 9.8 60.0 18.1 16.9
Haxby 96.1 162.7 25.7 79.4 51.9 10.0 51.1 19.9 16.0
Haybet 96.7 163.7 27.8 49.6 47.5 9.7 10.4 49.4 17.6
Hockett 90.1 161.3 24.6 76.1 50.7 9.9 68.9 13.1 15.6
Lavina 93.8 164.0 27.7 56.2 47.4 9.9 23.4 32.5 17.3
Merit 94.4 167.3 26.1 63.1 47.8 9.7 44.5 27.8 18.5
Moravian 115 92.8 166.3 21.6 66.6 46.8 9.5 67.3 12.3 16.9
Stockford 94.4 166.0 27.8 58.6 46.6 9.6 68.7 9.6 15.5
ME1 92.4 166.0 23.1 69.8 49.7 9.7 54.6 16.1 17.1
ME2 93.1 163.3 22.5 69.0 49.0 9.8 40.0 31.2 16.2
ME3 90.5 162.3 24.2 67.7 50.5 10.0 75.9 7.6 16.3
ME4 94.7 164.0 26.0 78.0 49.4 9.8 66.3 13.1 15.8
ME5 94.1 167.7 25.3 73.5 48.2 9.7 80.2 6.9 17.1
MT124001 91.1 165.0 26.4 61.9 50.6 10.0 72.3 11.7 15.6
MT124007 89.2 164.7 26.0 63.3 49.2 9.8 64.1 15.6 16.4
MT124008 89.5 165.0 26.7 65.1 49.6 10.0 67.4 13.9 15.9
MT124015 93.4 166.3 25.9 65.5 48.7 9.9 65.9 14.4 16.2
MT124016 91.5 166.3 23.1 66.1 47.4 9.6 65.1 16.2 15.8
MT124018 93.8 162.0 23.3 69.3 49.3 9.8 75.3 10.2 16.5
MT124025 95.4 167.3 24.0 63.3 48.5 9.8 62.4 17.0 16.2
MT124026 93.4 164.7 25.8 66.3 48.9 9.9 66.2 14.0 16.0
MT124027 93.8 164.7 24.6 67.2 47.5 9.8 63.5 14.9 16.2
MT124069 96.7 165.3 25.6 65.9 47.1 9.7 56.0 21.0 16.5
MT124071 93.1 161.3 28.2 67.9 50.2 10.1 73.2 10.7 15.4
MT124073 95.7 165.3 26.4 68.5 48.7 9.9 62.3 17.9 16.2
MT124112 88.8 161.0 25.7 73.2 51.3 10.2 80.9 6.8 14.6
MT124113 90.8 158.7 26.0 70.8 53.2 10.4 90.0 3.3 13.7
MT124118 86.5 161.0 26.9 74.4 51.9 10.0 75.6 8.4 15.3
MT124127 91.5 160.7 25.5 67.0 52.1 10.2 73.1 8.4 15.7
MT124128 88.5 158.0 24.5 48.8 52.9 10.3 88.0 4.4 14.2
MT124134 96.1 157.0 25.2 54.1 53.0 10.3 88.8 4.3 13.9
MT124148 96.7 166.0 24.1 78.2 49.2 9.6 37.7 29.1 17.1
MT124361 91.5 162.3 25.8 68.6 51.2 9.8 65.7 12.4 16.5
MT124370 95.1 166.7 25.3 72.4 50.3 9.9 66.4 15.1 15.5
MT124380 90.1 166.0 25.1 65.0 49.7 9.9 69.6 14.3 15.8
MT124454 91.4 162.7 26.2 70.9 51.8 9.9 83.4 6.1 16.4
MT124457 93.1 163.0 26.4 70.8 51.7 9.9 80.7 6.9 16.0
MT124555 96.7 165.0 25.8 70.8 50.8 10.0 72.9 10.9 16.2
MT124601 95.7 165.0 24.6 72.2 48.7 10.0 54.4 23.9 16.1
Intrastate Spring Barley Cultivar Evaluation Nursery Grown On-Station Under No-Till Dryland
Fallow Conditions at Northern Agricultural Research Center. Havre, MT. 2015.
NARC On-Station
24
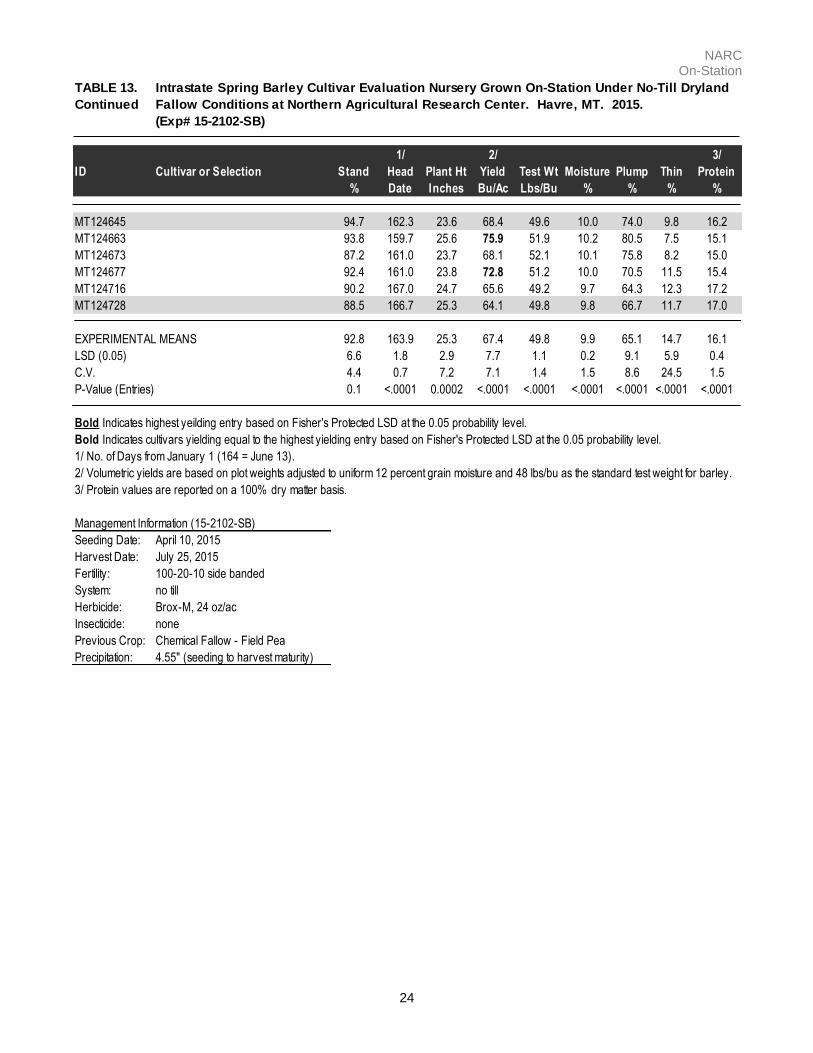
TABLE 13.
Continued
(Exp# 15-2102-SB)
1/ 2/ 3/
ID Cultivar or Selection Stand Head Plant Ht Yield Test Wt Moisture Plump Thin Protein
% Date Inches Bu/Ac Lbs/Bu % % % %
MT124645 94.7 162.3 23.6 68.4 49.6 10.0 74.0 9.8 16.2
MT124663 93.8 159.7 25.6 75.9 51.9 10.2 80.5 7.5 15.1
MT124673 87.2 161.0 23.7 68.1 52.1 10.1 75.8 8.2 15.0
MT124677 92.4 161.0 23.8 72.8 51.2 10.0 70.5 11.5 15.4
MT124716 90.2 167.0 24.7 65.6 49.2 9.7 64.3 12.3 17.2
MT124728 88.5 166.7 25.3 64.1 49.8 9.8 66.7 11.7 17.0
EXPERIMENTAL MEANS 92.8 163.9 25.3 67.4 49.8 9.9 65.1 14.7 16.1
LSD (0.05) 6.6 1.8 2.9 7.7 1.1 0.2 9.1 5.9 0.4
C.V. 4.4 0.7 7.2 7.1 1.4 1.5 8.6 24.5 1.5
P-Value (Entries) 0.1 <.0001 0.0002 <.0001 <.0001 <.0001 <.0001 <.0001 <.0001
Bold Indicates highest yeilding entry based on Fisher's Protected LSD at the 0.05 probability level.
Bold Indicates cultivars yielding equal to the highest yielding entry based on Fisher's Protected LSD at the 0.05 probability level.
1/ No. of Days from January 1 (164 = June 13).
2/ Volumetric yields are based on plot weights adjusted to uniform 12 percent grain moisture and 48 lbs/bu as the standard test weight for barley.
3/ Protein values are reported on a 100% dry matter basis.
Management Information (15-2102-SB)
Seeding Date: April 10, 2015
Harvest Date: July 25, 2015
Fertility: 100-20-10 side banded
System: no till
Herbicide: Brox-M, 24 oz/ac
Insecticide: none
Previous Crop: Chemical Fallow - Field Pea
Precipitation: 4.55" (seeding to harvest maturity)
Intrastate Spring Barley Cultivar Evaluation Nursery Grown On-Station Under No-Till Dryland
Fallow Conditions at Northern Agricultural Research Center. Havre, MT. 2015.

NARC On-Station
25
TABLE 14.
Montana. 2006-2015. (EXP# 2102-SB)
No. AVE. % 10-YR
of for of COMP.
YEARS YEARS CHECK AVE.
2/ VARIETY or SELECTION TESTED 2006 2007 2008 2009 2010 2011 2012 2013 2014 2015 TESTED YIELD YIELD
4/ 5/
BZ596117 BOULDER (P+) 3 61.8 70.6 76.1 69.5 111.4 78.1
PI568246 BARONESSE (P+) 6 49.7 66.8 80.5 72.8 89.5 85.0 74.0 107.9 75.7
YU501-385 CHAMPION (P+) 9 60.7 64.4 85.5 80.5 95.9 47.0 69.7 86.3 78.5 74.3 107.2 75.2
MT960228 ESLICK 6 65.5 68.8 69.2 30.9 89.5 88.5 68.7 102.8 72.1
Scarlett SCARLETT 4 83.2 83.9 41.2 72.3 70.2 100.5 70.5
MT910189 HOCKETT (+) 10 51.7 61.7 73.8 70.4 77.7 76.3 54.4 70.7 88.6 76.1 70.2 100.0 70.2
MT960101 GERALDINE 7 53.9 58.9 68.4 70.8 93.2 81.1 33.8 65.7 98.7 69.3
SK76333 HARRINGTON 9 63.6 64.6 71.0 82.4 76.5 37.7 71.3 82.5 61.0 67.9 97.3 68.3
2B965057 CONRAD (+) 10 54.7 57.6 67.4 70.3 82.4 76.9 43.8 78.5 76.4 65.3 67.3 96.0 67.3
MT010158 AMSTERDAM 7 63.2 62.7 75.0 67.2 78.3 64.4 16.1 61.0 91.6 64.3
TR232 METCALFE 8 51.4 53.5 68.7 77.9 70.9 39.5 76.3 59.1 62.2 90.6 63.6
MT950186 HAXBY 10 57.3 69.9 75.8 48.2 51.5 82.6 25.1 67.3 78.1 79.4 63.5 90.5 63.5
6B952482 TRADITION (P+) 9 66.7 71.5 73.0 50.5 7.3 68.5 47.3 78.2 79.8 60.3 86.8 60.9
PI643354 PINNACLE (+) 5 76.1 75.4 24.6 61.8 69.4 61.5 83.5 58.6
MT970116 CRAFT 10 61.2 64.3 67.0 37.2 37.3 80.8 31.4 60.2 74.9 70.2 58.5 83.3 58.5
58.6 64.3 73.8 64.3 69.7 78.3 36.4 72.0 80.1 69.9 67.7
April-July Precip. (in.) 5.71 7.43 8.09 6.29 9.69 8.75 7.33 13.28 4.87 7.52 7.90
Total Annual Precip. (in.) 10.29 12.42 12.21 12.46 14.61 15.45 9.46 18.46 13.34 12.05 13.08
Soil NO3 (lbs.) to SD at Planting 352 271 157 88 204 374 60 415 57 123 210
SD (Sampling Depth in Inches) 48 48 48 48 48 48 48 48 48 48 48
Fertilizer Applied (# N) 70 70 70 70 70 70 100 100 100 100 82
(# P2O5) 40 40 40 40 40 40 20 20 20 20 32
(# K2O) 25 25 25 25 25 25 10 10 10 10 19
Long-term check variety is Hockett.
1/ See MCES Bulletin 1094 or the Plant Sciences & Plant Pathology w ebsite at http://plantsciences.montana.edu/ for evaluation of other important variety performance
characteristics to include malting potential, disease resistance, etc. before making cultivar selecton decisions.
2/ P = Private Variety, + = Protected Variety.
3/ Percent of Hockett yield for the same data years as those in w hich a given entry w as tested.
4/ 10-Yr Comparable Average = (x/y) * z w here x = average yield of a given entry for years tested, y = average yield for Hockett for the same years, and z = 10-Yr average
yield for the check variety Hockett.
Ten-Year Yield Summary on Selected Entries from Dryland Intrastate Spring Barley Nursery. Northern Agricultural Research Center. Havre,
1/ YIELD (Bushels Per Acre)
MEANS (For Entries Listed)
NARC On-Station
26
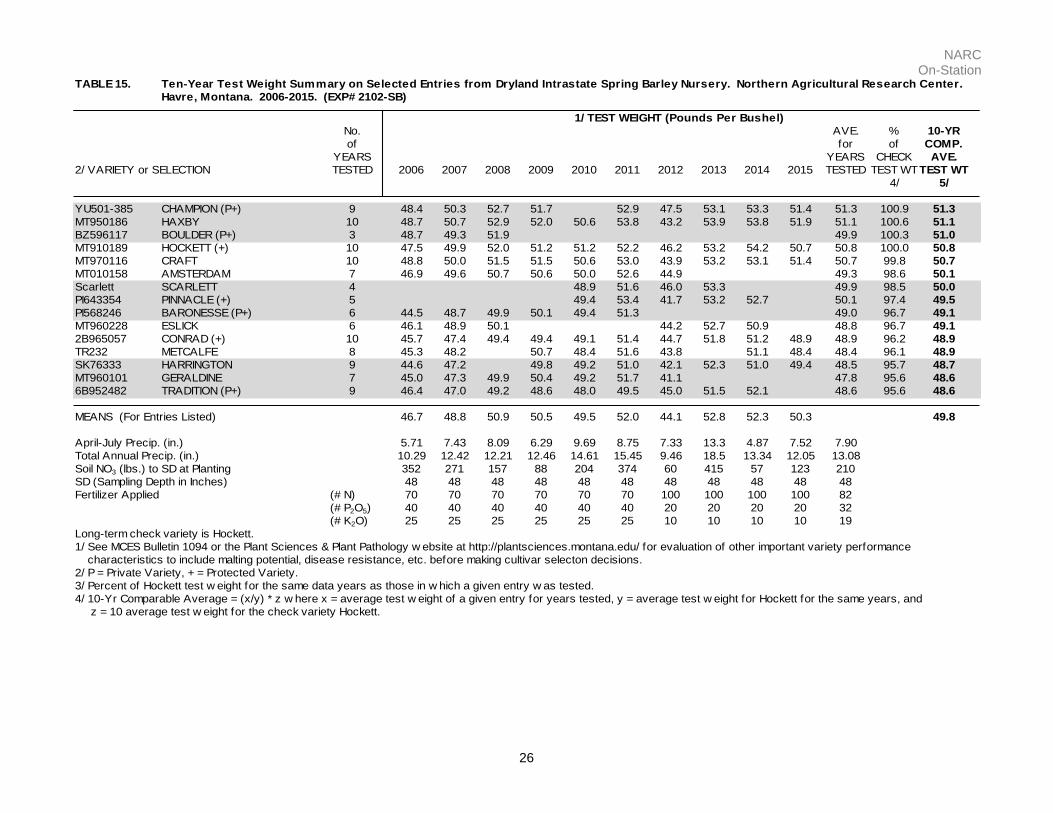
TABLE 15.
No. AVE. % 10-YR
of for of COMP.
YEARS YEARS CHECK AVE.
2/ VARIETY or SELECTION TESTED 2006 2007 2008 2009 2010 2011 2012 2013 2014 2015 TESTED TEST WTTEST WT
4/ 5/
YU501-385 CHAMPION (P+) 9 48.4 50.3 52.7 51.7 52.9 47.5 53.1 53.3 51.4 51.3 100.9 51.3
MT950186 HAXBY 10 48.7 50.7 52.9 52.0 50.6 53.8 43.2 53.9 53.8 51.9 51.1 100.6 51.1
BZ596117 BOULDER (P+) 3 48.7 49.3 51.9 49.9 100.3 51.0
MT910189 HOCKETT (+) 10 47.5 49.9 52.0 51.2 51.2 52.2 46.2 53.2 54.2 50.7 50.8 100.0 50.8
MT970116 CRAFT 10 48.8 50.0 51.5 51.5 50.6 53.0 43.9 53.2 53.1 51.4 50.7 99.8 50.7
MT010158 AMSTERDAM 7 46.9 49.6 50.7 50.6 50.0 52.6 44.9 49.3 98.6 50.1
Scarlett SCARLETT 4 48.9 51.6 46.0 53.3 49.9 98.5 50.0
PI643354 PINNACLE (+) 5 49.4 53.4 41.7 53.2 52.7 50.1 97.4 49.5
PI568246 BARONESSE (P+) 6 44.5 48.7 49.9 50.1 49.4 51.3 49.0 96.7 49.1
MT960228 ESLICK 6 46.1 48.9 50.1 44.2 52.7 50.9 48.8 96.7 49.1
2B965057 CONRAD (+) 10 45.7 47.4 49.4 49.4 49.1 51.4 44.7 51.8 51.2 48.9 48.9 96.2 48.9
TR232 METCALFE 8 45.3 48.2 50.7 48.4 51.6 43.8 51.1 48.4 48.4 96.1 48.9
SK76333 HARRINGTON 9 44.6 47.2 49.8 49.2 51.0 42.1 52.3 51.0 49.4 48.5 95.7 48.7
MT960101 GERALDINE 7 45.0 47.3 49.9 50.4 49.2 51.7 41.1 47.8 95.6 48.6
6B952482 TRADITION (P+) 9 46.4 47.0 49.2 48.6 48.0 49.5 45.0 51.5 52.1 48.6 95.6 48.6
46.7 48.8 50.9 50.5 49.5 52.0 44.1 52.8 52.3 50.3 49.8
April-July Precip. (in.) 5.71 7.43 8.09 6.29 9.69 8.75 7.33 13.3 4.87 7.52 7.90
Total Annual Precip. (in.) 10.29 12.42 12.21 12.46 14.61 15.45 9.46 18.5 13.34 12.05 13.08
Soil NO3 (lbs.) to SD at Planting 352 271 157 88 204 374 60 415 57 123 210
SD (Sampling Depth in Inches) 48 48 48 48 48 48 48 48 48 48 48
Fertilizer Applied (# N) 70 70 70 70 70 70 100 100 100 100 82
(# P2O5) 40 40 40 40 40 40 20 20 20 20 32
(# K2O) 25 25 25 25 25 25 10 10 10 10 19
Long-term check variety is Hockett.
1/ See MCES Bulletin 1094 or the Plant Sciences & Plant Pathology w ebsite at http://plantsciences.montana.edu/ for evaluation of other important variety performance
characteristics to include malting potential, disease resistance, etc. before making cultivar selecton decisions.
2/ P = Private Variety, + = Protected Variety.
3/ Percent of Hockett test w eight for the same data years as those in w hich a given entry w as tested.
4/ 10-Yr Comparable Average = (x/y) * z w here x = average test w eight of a given entry for years tested, y = average test w eight for Hockett for the same years, and
z = 10 average test w eight for the check variety Hockett.
MEANS (For Entries Listed)
Ten-Year Test Weight Summary on Selected Entries from Dryland Intrastate Spring Barley Nursery. Northern Agricultural Research Center.
Havre, Montana. 2006-2015. (EXP# 2102-SB)
1/ TEST WEIGHT (Pounds Per Bushel)
NARC On-Station
27
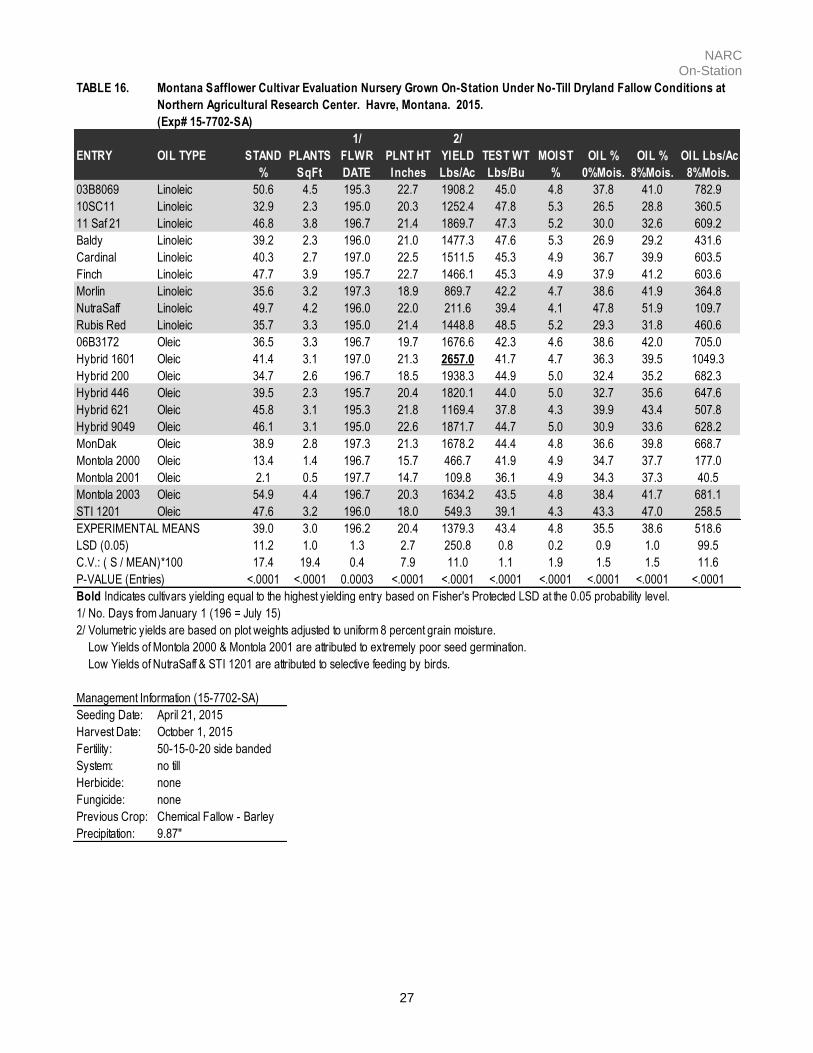
TABLE 16.
(Exp# 15-7702-SA)
1/ 2/
ENTRY OIL TYPE STAND PLANTS FLWR PLNT HT YIELD TEST WT MOIST OIL % OIL % OIL Lbs/Ac
% SqFt DATE Inches Lbs/Ac Lbs/Bu % 0%Mois. 8%Mois. 8%Mois.
03B8069 Linoleic 50.6 4.5 195.3 22.7 1908.2 45.0 4.8 37.8 41.0 782.9
10SC11 Linoleic 32.9 2.3 195.0 20.3 1252.4 47.8 5.3 26.5 28.8 360.5
11 Saf 21 Linoleic 46.8 3.8 196.7 21.4 1869.7 47.3 5.2 30.0 32.6 609.2
Baldy Linoleic 39.2 2.3 196.0 21.0 1477.3 47.6 5.3 26.9 29.2 431.6
Cardinal Linoleic 40.3 2.7 197.0 22.5 1511.5 45.3 4.9 36.7 39.9 603.5
Finch Linoleic 47.7 3.9 195.7 22.7 1466.1 45.3 4.9 37.9 41.2 603.6
Morlin Linoleic 35.6 3.2 197.3 18.9 869.7 42.2 4.7 38.6 41.9 364.8
NutraSaff Linoleic 49.7 4.2 196.0 22.0 211.6 39.4 4.1 47.8 51.9 109.7
Rubis Red Linoleic 35.7 3.3 195.0 21.4 1448.8 48.5 5.2 29.3 31.8 460.6
06B3172 Oleic 36.5 3.3 196.7 19.7 1676.6 42.3 4.6 38.6 42.0 705.0
Hybrid 1601 Oleic 41.4 3.1 197.0 21.3 2657.0 41.7 4.7 36.3 39.5 1049.3
Hybrid 200 Oleic 34.7 2.6 196.7 18.5 1938.3 44.9 5.0 32.4 35.2 682.3
Hybrid 446 Oleic 39.5 2.3 195.7 20.4 1820.1 44.0 5.0 32.7 35.6 647.6
Hybrid 621 Oleic 45.8 3.1 195.3 21.8 1169.4 37.8 4.3 39.9 43.4 507.8
Hybrid 9049 Oleic 46.1 3.1 195.0 22.6 1871.7 44.7 5.0 30.9 33.6 628.2
MonDak Oleic 38.9 2.8 197.3 21.3 1678.2 44.4 4.8 36.6 39.8 668.7
Montola 2000 Oleic 13.4 1.4 196.7 15.7 466.7 41.9 4.9 34.7 37.7 177.0
Montola 2001 Oleic 2.1 0.5 197.7 14.7 109.8 36.1 4.9 34.3 37.3 40.5
Montola 2003 Oleic 54.9 4.4 196.7 20.3 1634.2 43.5 4.8 38.4 41.7 681.1
STI 1201 Oleic 47.6 3.2 196.0 18.0 549.3 39.1 4.3 43.3 47.0 258.5
39.0 3.0 196.2 20.4 1379.3 43.4 4.8 35.5 38.6 518.6
LSD (0.05) 11.2 1.0 1.3 2.7 250.8 0.8 0.2 0.9 1.0 99.5
C.V.: ( S / MEAN)*100 17.4 19.4 0.4 7.9 11.0 1.1 1.9 1.5 1.5 11.6
P-VALUE (Entries) <.0001 <.0001 0.0003 <.0001 <.0001 <.0001 <.0001 <.0001 <.0001 <.0001
Bold Indicates cultivars yielding equal to the highest yielding entry based on Fisher's Protected LSD at the 0.05 probability level.
1/ No. Days from January 1 (196 = July 15)
2/ Volumetric yields are based on plot weights adjusted to uniform 8 percent grain moisture.
Low Yields of Montola 2000 & Montola 2001 are attributed to extremely poor seed germination.
Low Yields of NutraSaff & STI 1201 are attributed to selective feeding by birds.
Management Information (15-7702-SA)
Seeding Date: April 21, 2015
Harvest Date: October 1, 2015
Fertility: 50-15-0-20 side banded
System: no till
Herbicide: none
Fungicide: none
Previous Crop: Chemical Fallow - Barley
Precipitation: 9.87"
Montana Safflower Cultivar Evaluation Nursery Grown On-Station Under No-Till Dryland Fallow Conditions at
Northern Agricultural Research Center. Havre, Montana. 2015.
EXPERIMENTAL MEANS
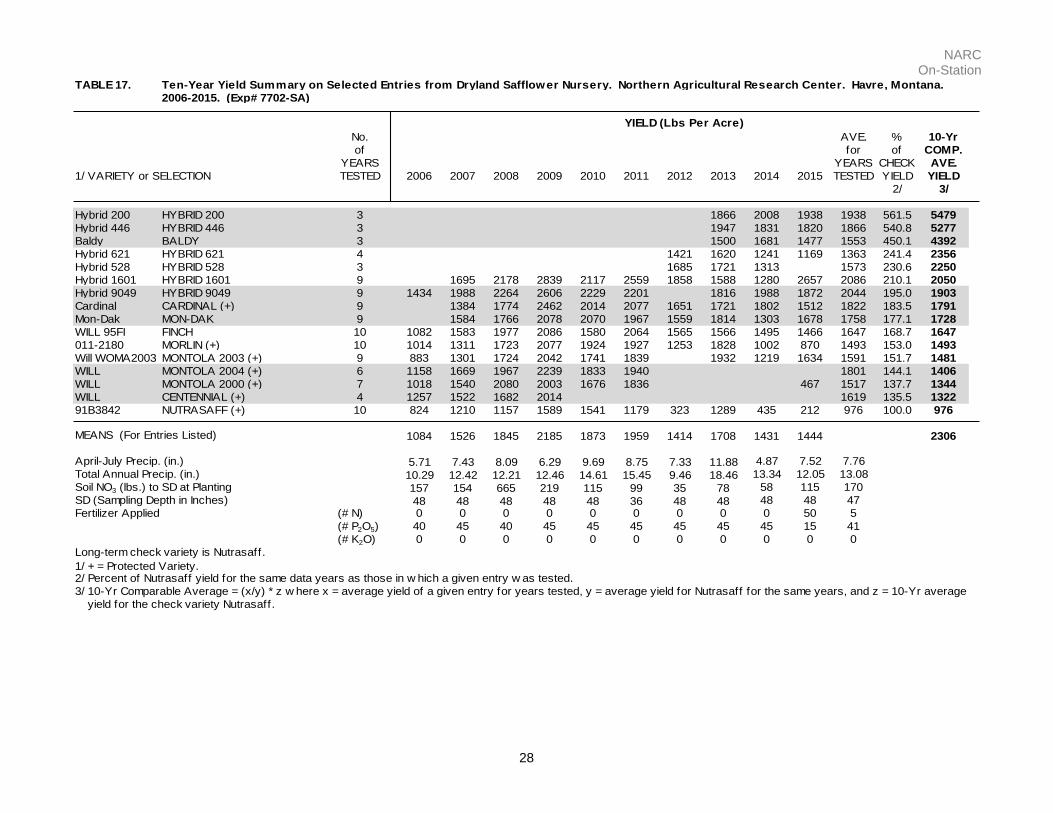
NARC On-Station
28
TABLE 17.
2006-2015. (Exp# 7702-SA)
No. AVE. % 10-Yr
of for of COMP.
YEARS YEARS CHECK AVE.
1/ VARIETY or SELECTION TESTED 2006 2007 2008 2009 2010 2011 2012 2013 2014 2015 TESTED YIELD YIELD
2/ 3/
Hybrid 200 HYBRID 200 3 1866 2008 1938 1938 561.5 5479
Hybrid 446 HYBRID 446 3 1947 1831 1820 1866 540.8 5277
Baldy BALDY 3 1500 1681 1477 1553 450.1 4392
Hybrid 621 HYBRID 621 4 1421 1620 1241 1169 1363 241.4 2356
Hybrid 528 HYBRID 528 3 1685 1721 1313 1573 230.6 2250
Hybrid 1601 HYBRID 1601 9 1695 2178 2839 2117 2559 1858 1588 1280 2657 2086 210.1 2050
Hybrid 9049 HYBRID 9049 9 1434 1988 2264 2606 2229 2201 1816 1988 1872 2044 195.0 1903
Cardinal CARDINAL (+) 9 1384 1774 2462 2014 2077 1651 1721 1802 1512 1822 183.5 1791
Mon-Dak MON-DAK 9 1584 1766 2078 2070 1967 1559 1814 1303 1678 1758 177.1 1728
WILL 95FI FINCH 10 1082 1583 1977 2086 1580 2064 1565 1566 1495 1466 1647 168.7 1647
011-2180 MORLIN (+) 10 1014 1311 1723 2077 1924 1927 1253 1828 1002 870 1493 153.0 1493
Will WOMA2003 MONTOLA 2003 (+) 9 883 1301 1724 2042 1741 1839 1932 1219 1634 1591 151.7 1481
WILL MONTOLA 2004 (+) 6 1158 1669 1967 2239 1833 1940 1801 144.1 1406
WILL MONTOLA 2000 (+) 7 1018 1540 2080 2003 1676 1836 467 1517 137.7 1344
WILL CENTENNIAL (+) 4 1257 1522 1682 2014 1619 135.5 1322
91B3842 NUTRASAFF (+) 10 824 1210 1157 1589 1541 1179 323 1289 435 212 976 100.0 976
1084 1526 1845 2185 1873 1959 1414 1708 1431 1444 2306
April-July Precip. (in.) 5.71 7.43 8.09 6.29 9.69 8.75 7.33 11.88 4.87 7.52 7.76
Total Annual Precip. (in.) 10.29 12.42 12.21 12.46 14.61 15.45 9.46 18.46 13.34 12.05 13.08
Soil NO3 (lbs.) to SD at Planting 157 154 665 219 115 99 35 78 58 115 170
SD (Sampling Depth in Inches) 48 48 48 48 48 36 48 48 48 48 47
Fertilizer Applied (# N) 0 0 0 0 0 0 0 0 0 50 5
(# P2O5) 40 45 40 45 45 45 45 45 45 15 41
(# K2O) 0 0 0 0 0 0 0 0 0 0 0
Long-term check variety is Nutrasaff.
1/ + = Protected Variety.2/ Percent of Nutrasaff yield for the same data years as those in w hich a given entry w as tested.
3/ 10-Yr Comparable Average = (x/y) * z w here x = average yield of a given entry for years tested, y = average yield for Nutrasaff for the same years, and z = 10-Yr average
yield for the check variety Nutrasaff.
Ten-Year Yield Summary on Selected Entries from Dryland Safflower Nursery. Northern Agricultural Research Center. Havre, Montana.
YIELD (Lbs Per Acre)
MEANS (For Entries Listed)

NARC On-Station
29
TABLE 18.
2006-2015. (Exp# 7702-SA)
No. AVE. % 10-Yr
of for of COMP.
YEARS YEARS CHECK AVE.
1/ VARIETY or SELECTION TESTED 2006 2007 2008 2009 2010 2011 2012 2013 2014 2015 TESTED Oil Oil
2/ 3/
91B3842 NUTRASAFF (+) 10 43.2 48.5 44.6 45.8 36.9 52.4 54.1 52.5 52.8 51.9 48.3 100.0 48.3
Hybrid 528 HYBRID 528 3 54.4 48.4 48.2 50.3 94.7 45.7
WILL CENTENNIAL (+) 4 39.9 43.9 41.7 39.9 41.4 90.8 43.8
Hybrid 621 HYBRID 621 4 53.5 45.2 46.3 43.4 47.1 89.2 43.0
011-2180 MORLIN (+) 10 36.9 39.3 37.2 35.3 39.5 41.8 43.7 43.6 43.5 41.9 40.3 83.4 40.3
WILL MONTOLA 2000 (+) 7 35.7 38.6 38.2 37.3 38.8 43.3 37.7 38.5 83.4 40.3
WILL MONTOLA 2004 (+) 6 33.9 35.8 35.3 35.2 39.1 43.5 37.1 82.1 39.6
Will WOMA2003 MONTOLA 2003 (+) 9 34.8 36.8 36.5 34.5 39.3 41.8 41.5 42.7 41.7 38.8 81.6 39.4
WILL 95FI FINCH 10 35.5 36.5 34.5 34.9 43.6 40.9 42.6 39.1 41.5 41.2 39.0 80.9 39.0
Hybrid 1601 HYBRID 1601 9 36.1 30.4 34.7 39.6 40.3 44.0 43.4 43.6 39.5 39.0 80.0 38.6
Mon-Dak MON-DAK 9 36.7 34.6 34.4 41.1 40.5 44.0 39.8 40.3 39.8 39.0 79.9 38.6
Cardinal CARDINAL (+) 9 36.1 33.7 34.8 43.6 39.2 42.2 39.3 40.5 39.9 38.8 79.5 38.4
Hybrid 9049 HYBRID 9049 9 31.0 32.1 34.3 29.1 42.8 34.6 34.1 35.3 33.6 34.1 71.6 34.6
Hybrid 446 HYBRID 446 3 39.5 37.0 35.6 37.4 71.3 34.4
Hybrid 200 HYBRID 200 3 38.5 36.6 35.2 36.8 70.1 33.9
Baldy BALDY 3 30.0 29.6 29.2 29.6 56.5 27.3
36.4 38.2 36.5 36.0 40.4 41.8 47.3 41.2 41.4 39.3 39.1
April-July Precip. (in.) 5.71 7.43 8.09 6.29 9.69 8.75 7.33 11.88 4.87 7.52 7.76
Total Annual Precip. (in.) 10.29 12.42 12.21 12.46 14.61 15.45 9.46 18.46 13.34 12.05 13.08
Soil NO3 (lbs.) to SD at Planting 157 154 665 219 115 99 35 78 58 115 170
SD (Sampling Depth in Inches) 48 48 48 48 48 36 48 48 48 48 47Fertilizer Applied (# N) 0 0 0 0 0 0 0 0 0 50 5
(# P2O5) 40 45 40 45 45 45 45 45 45 15 41
(# K2O) 0 0 0 0 0 0 0 0 0 0 0
Long-term check variety is Nutrasaff.
1/ + = Protected Variety.
2/ Percent of Nutrasaff oil % for the same data years as those in w hich a given entry w as tested.
3/ 10-Yr Comparable Average = (x/y) * z w here x = average oil % of a given entry for years tested, y = average yield for Nutrasaff for the same years, and z = 10-Yr average
oil % for the check variety Nutrasaff.
Ten-Year Percent Oil Summary on Selected Entries from Dryland Safflower Nursery. Northern Agricultural Research Center. Havre, Montana.
Oil (%) @ 8% Seed Moisture
MEANS (For Entries Listed)