title o'brien, eugene j.; hayrapetova, alisa; walsh
TRANSCRIPT

Provided by the author(s) and University College Dublin Library in accordance with publisher policies. Please
cite the published version when available.
Downloaded 2013-09-16T10:48:00Z
Some rights reserved. For more information, please see the item record link above.
Title The use of micro-simulation for congested traffic loadmodelling of medium- and long-span bridges
Author(s) O'Brien, Eugene J.; Hayrapetova, Alisa; Walsh, Cathal
PublicationDate 2011-11-28
Publicationinformation Structure and Infrastructure Engineering, 8 (3): 269-276
Publisher Taylor & Francis
Link topublisher's
versionhttp://dx.doi.org/10.1080/15732471003640477
This item'srecord/moreinformation
http://hdl.handle.net/10197/3061
Rights
This is an electronic version of an article whose final anddefinitive form has been published in Structure andInfrastructure Engineering. Structure and InfrastructureEngineering is available online at:http://www.tandfonline.com/openurl?genre=article&issn=1573-2479&volume=8&issue=3&spage=269
DOI http://dx.doi.org/10.1080/15732471003640477
Structure and Infrastructure Engineering
Keywords: micro-simulation; traffic load; bridge; loading; long; span.
1. Introduction
Whether for the assessment of existing bridges or the design of new ones, traffic load is
generally represented in standards with notional load models. Such models are deemed
to represent the worst loading condition in a specified return period – 1000 years in
Eurocode 1 (EC1 2003). However, more accurate assessments of traffic loading can
result in the retention of existing bridges for longer lives by proving that they are safe
for the load carried. Furthermore, the capability to calculate characteristic traffic loading
more accurately, opens up the prospect of designing longer spans than has been possible
to date.
* Corresponding author. Email: [email protected]
The use of micro-simulation for congested traffic load modelling of
medium- and long-span bridges
E.J. OBrien*, A. Hayrapetova and C. Walsh
aSchool of Architecture, Landscape & Civil Engineering, University College Dublin,
Newstead, Belfield, Dublin 4, Ireland; bRoughan & O’Donovan Consulting Engineers,
Arena House, Arena Road, Sandyford Dublin 18, Ireland; cDepartment of Statistics,
Trinity College Dublin, Dublin 2, Ireland
(Received XX Month 2009; final version received XX Month 2009)
ABSTRACT: This paper presents a new approach to the modelling of congested traffic
loading events on long span bridges. Conventional traffic load models are based on Weigh-
In-Motion data of non-congested traffic, or something similar to a Poisson Arrival process.
In neither case do they account for the mixing between lanes that takes place as traffic
becomes congested. It is shown here that cars move out from between trucks as traffic
slows down which results in a higher frequency of long platoons of trucks in the slow lane
of the bridge. These longer platoons increase some characteristic load effects under the
slow lane by a modest but significant amount. Micro-simulation, the process of modelling
individual vehicles that is widely used in traffic modelling, is presented here as a means of
predicting imposed traffic loading on long-span bridges more accurately. The traffic flow
on a congested bridge is modelled using a random mixing process for trucks and cars in
each lane, where each vehicle is modelled individually with driver behaviour parameters
assigned randomly in a Monte Carlo process. Over a number of simulated kilometres, the
vehicles move between lanes in simulated lane-changing manoeuvres. The algorithm was
calibrated against video recordings of traffic on a bridge in the Netherlands. Extreme value
statistics of measured strains on the bridge are then compared to the corresponding
simulation statistics to validate the model. The micro-simulation algorithm shows that the
histograms of truck platoon length are moderately affected by lane changing. This in turn is
shown to influence some characteristic load effects of the bridge deck.

E.J. OBrien et al.
A review of normal traffic loading on long-span bridges was carried out in by
Buckland et al (1978) and Buckland (1981). The maximum load effects are found to
occur when the traffic is stationary and 'bumper to bumper', with no dynamic
amplification. The Flint and Neill Partnership (1986) carried out numerical Monte-Carlo
simulations and statistical analysis of traffic loading models representative of traffic
flows and mixes on long span bridges on a heavily trafficked commercial route, to
determine characteristic traffic load effects when traffic is jammed. The characteristic
values obtained were used to develop a load model consisting of an equivalent
uniformly distributed load and a single knife edge load per lane. Due to the substantial
increase in the proportion of heavy goods traffic since the 1970’s, the design loadings
obtained by the authors for long span bridge were considerably heavier than those
recommended in the earlier code. The stochastic vehicle-queue-load model developed
by Ditlevsen & Madsen (1994) is an analytical approach for the prediction of extreme
load effects from any kind of traffic loads on long span bridges. In the model the traffic
along the lanes is represented as 'white-noise' load fields. The mean and variance of the
white-noise field depend on the traffic situation and are described by Gaussian random
processes. The model covers the entire range of traffic from free Poissonian traffic to
congested traffic with the full stop queue as a limit case. Nowak (1991 and 1999)
developed Monte-Carlo live load models to perform studies on the effect of multiple
vehicle presence for vehicles on a single-lane bridge and for vehicles in two adjacent
lanes with various degrees of correlation between the truck weights. For a range of
simply supported spans, a cumulative distribution function was determined for the
traffic load effects considered. For longer spans the maximum effects were caused by
the case of a fully correlated pair of trucks with headway distance of 5m that was
associated with stationary or slowly-moving vehicles. The range of considered spans
(from 12m to 60m), however, was not enough to draw conclusions for long-span
bridges. Therefore, this study was only applicable for use in codes for moderate span
bridges up to 60m.
This paper describes a new technique for the accurate modelling of traffic loading on
long-span bridges. For multi-lane (same direction) traffic, a key challenge in assessing
the extreme loading conditions is to model the movement of vehicles between lanes as
traffic becomes congested. Driver behaviour under such conditions results in changes to
the car-truck mix in each lane as car drivers seek to move out from behind trucks. This
is important as it results in the formation of long platoons of heavy trucks in the slow
lanes of the bridge. Previous methods, which seek to generate jams by reducing the gaps
in free flowing traffic data, are inaccurate as they neglect the movements of cars out of
lanes with large numbers of trucks and therefore underestimate the frequency of long
platoons of trucks. The approach adopted here is to model the behavioural response of vehicles to their
surroundings using commercial micro-simulation software, Paramics. The Paramics microsimulation package (www.sias.ie) includes a microscopic car-following and lane-changing model, dynamic routeing and inclusion of intelligent transport systems. Its mathematical model is based on the psycho-physical theory developed by Weidemann (1974) and Fritzche (1994). This model, calibrated using observed driver behaviour, is used to predict the mixing of multi-lane traffic on the bridge deck. A vehicle’s response to its environment is described in the model by two parameters, driver’s 'target headway' and 'reaction time'. The target headway is the bumper-to-bumper time gap that drivers try to achieve when following other vehicles in traffic. The reaction time is the lag in time between a change of speed of the preceding vehicle and the following vehicle’s reaction to that change. Target headway and reaction time values are drawn from a statistical distribution representing the range of driver behaviour and randomly

Structure and Infrastructure Engineering
allocated to the vehicles within the fleet. These parameters affect maximum speed and propensity to change lane of the individual vehicles.
In free-flowing traffic, vehicles attempt to travel at a speed closest to their target
speed, allowing a safe distance from vehicles in front of them. For congested traffic, the
vehicle is prevented from achieving its target speed so it considers a change into another
lane if vehicles in that lane are travelling faster. The lane changing process itself
considers a sequence of three steps: decision to attempt a lane change, choice of the
target lane, and gap acceptance. In heavily congested traffic, when acceptable gaps are
hard to find, a forced merging model is used to capture forced lane changing, i.e., where
a driver applies pressure on others to provide the space needed in the target lane.
Therefore, characteristic features of congested traffic such as stop-start behaviour,
queuing and platoons of trucks occur naturally in the simulation for the same reason that
they occur in the real world (Rapael et al 2000, Lieberman & Rathi 1999).
The methodology used to derive traffic load models for long-span bridges combines
traffic micro-simulation with bridge finite element analysis. Vehicle weights and car-
truck mix data in free-flowing traffic were collected from a weigh-in-motion (WIM)
station. This is used to add statistically representative weights to the vehicles in the
micro-simulation models and to set the initial conditions prior to the onset of
congestion.
2. Site description, instrumentation and finite element model
To validate the micro-simulation approach, a comparative study was carried out
between the model and results measured on a 100m simply supported bridge span. The
Moerdijk Bridge in the Netherlands spans the Hollands Diep River and forms a section
of the A16 highway between Dordrecht and Breda. It is subject to congested traffic on a
daily basis involving significant numbers of trucks. The complete bridge consists of ten
simply supported spans of 100m and is a box girder with orthotropic stiffened steel
plates of 10, 12 and 14mm and mastic asphalt surfacing of 60mm (Figure 1). It carries 3
lanes of traffic in each direction and serves more than two million vehicles annually, up
to 14% of which is heavy truck traffic.

E.J. OBrien et al.
Section A-A
1700
12800
42900
10 100000
3500
Layout of Strain Gauges
C
Video Camera
3500
A
A
3 35003400
G
A
x
D
x
3500
Video Camera
3500
Mastic Asphalt Pavement
3 3500
B
x 3400
H
Figure 1. Moerdijk Bridge elevation and cross section with layout of strain gauges (A,
B, C, etc.) and video cameras (dimensions in mm).
Strain measurements and video recordings were collected for 11 working days in
May-June, 2003. Four strain gauges, A-D in Figure 1, were placed on the bottom
longitudinal stiffeners of the steel plate while two (G and H) were positioned on the top
stiffeners. All six strain gauges were located at mid-span.
Gross vehicle weights (GVW) are recorded at several WIM stations in the region of
the Moerdijk Bridge. For this study, data over a one-month period (28th May – 1st July,
2001) was obtained from the WIM stations closest to the bridge Northbound and
Southbound (Figure 2). Histograms for GVW were assembled for each of 13 classes of
heavy vehicle, treating northbound and southbound traffic separately. Cars were all
considered as being of constant weight, 1500 kg, and length, 4.5m. Buses were assigned
a constant weight of 4000 kg and length, 6m, which is justified based on the very small
proportion of buses (0.05%) in the total flow.

Structure and Infrastructure Engineering
Figure 2. WIM measurement locations in region of Moerdijk Bridge.
In order to determine the influence surface, a three-dimensional Finite Element
Model was developed of a complete 100m span using the MSC NASTRAN package
(Figure 3). Quadrilateral plate elements were used to represent the top, bottom and side
plates, webs and longitudinal trapezoidal stiffeners. In total, there were 47,419 nodes
and 59,254 elements in the model.
3. Calibration and validation of micro-simulation model
Traffic data, which include observed speed ranges, volumes and vehicle classification
information, were used to calibrate and validate the micro-simulation model of the
bridge.
The daily traffic volume was subdivided into 10 time periods each of 1-hour
duration, from 8:30 to 18:30, for the 11 days of observation. Traffic flow characteristics
for each vehicle class varied between the time periods of the micro-simulation model.
This resulted in the simulation of free-flowing and congested traffic conditions,
depending on the time of day. Figure 4 illustrates actual and simulated traffic scenarios
on the bridge. Driver behaviour cannot readily be quantified and is largely based on
indirect calibration through the micro-simulation sub-models (car-following gap, gap
acceptance and lane changing), which govern the target headway and reaction time of
individual vehicles. The procedure is based on model run comparisons to video data sets
collected on the bridge and is purely empirical. Numerous experiments under various
traffic conditions were conducted in related studies (e.g. Kunzman (1978), Abdulhai
(1999), Chu et al. (2003)), in which the driver’s target headways and reaction times are
WIM station
WIM station
MOERDIJK

E.J. OBrien et al.
Figure 3. Moerdijk Bridge finite element model: (a) mesh details, (b) half cross-section
of the bridge with details of longitudinal stiffeners, (c) rendered solid view, (d) rendered
solid view of the bottom plate with details of side plates and transverse diaphragms.
(a) (b)
Figure 4. Congested traffic on the Moerdijk Bridge; (a) actual, (b) microsimulation
model.
(a)
(c) (d)
(b)
Structure and Infrastructure Engineering
determined to be Normally distributed about their mean values in the ranges of 0.6-2.0
seconds and 0.3-2.0 seconds respectively. In the micro-simulation model used here, the
initial driver’s target headway and reaction time were assumed to be 1 second (standard
deviation = 0.08). These values are based on research of the Transport Research
Laboratory (Jeffrey, 1994) and are extracted from observations of freeways in the
United Kingdom. In the presence of the field traffic data, to match local conditions for
the A16 highway, there was a need to validate the model by calibrating local mean
headways and reaction times. The simulation was run with multiple combinations of h
and r, and for each simulation two key output indicators were computed: average
network speed and the maximum vehicle throughput for the 3-lane freeway in each
direction. Numerous runs with different combinations of distributions were conducted
until the outputs of simulated traffic flow and speed were improved. Vehicles were manually counted from videotape observations and compared with
traffic counts from the micro-simulation model. The lane changing and platoon formation processes in the model were calibrated with observations through the adjustment of the drivers’ target speeds, target headway and reaction times. Good correspondence between the model and the observations was achieved by reducing the model target speeds of Southbound and Northbound links to 40 km/h and 17 km/h respectively for the peak hours. Normally distributed drivers’ target headway and reaction time distributions were assumed with mean values for both of 0.65 s and standard deviations of 0.48 and 0.45 respectively.
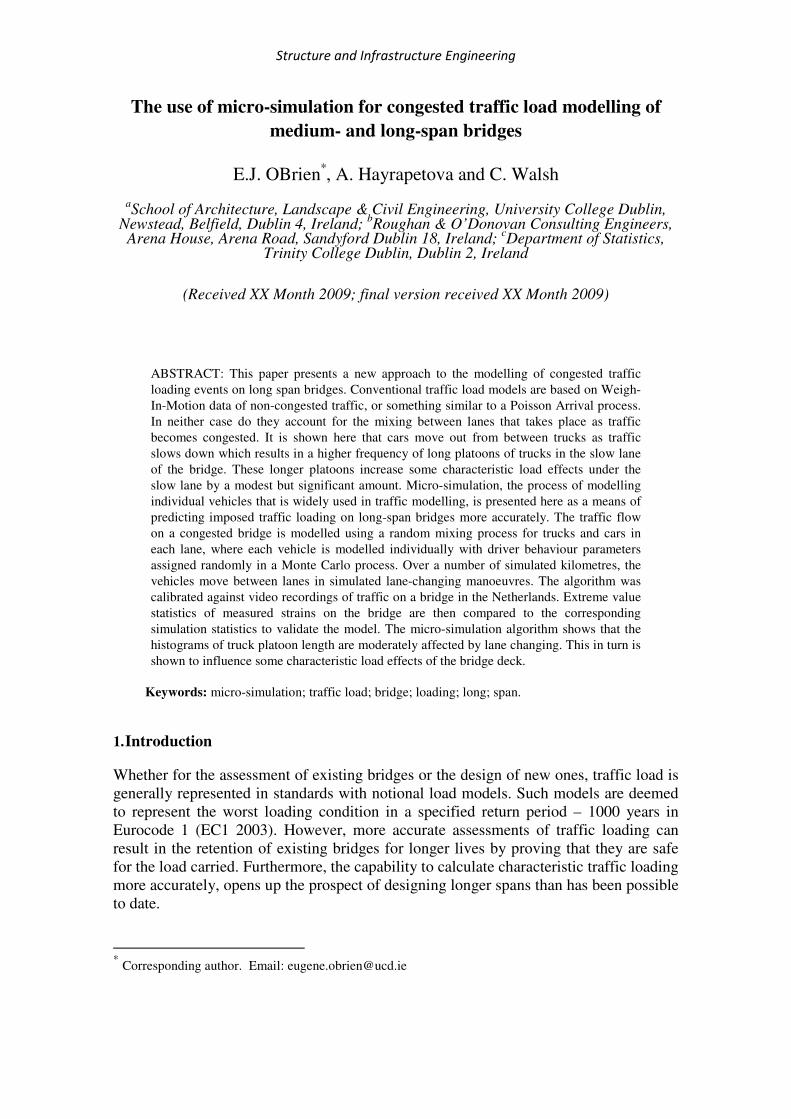
Figure 5. Platoon size distribution: comparison of micro-simulation with field
observations. (a) allowing for lane changes, (b) stay-in-lane regime.
(b)
0
5
10
15
20
25
30
35
40
45
50
55
1 2 3 4 5 6 7 8 9 10
platoon size
freq
uen
cy (
%)
congestion
sim congestion (lane
changing allowed)
0
5
10
15
20
25
30
35
40
45
50
55
1 2 3 4 5 6 7 8 9 10
platoon size
freq
uen
cy
(%
)
congestion
sim congestion (stay-in-
lane regime)
(a)

E.J. OBrien et al.
Agreement between the resulting platoon frequency distributions in Figure 5(a) demonstrates that realistic car-truck mixes were achieved in the model. To identify the influence of driver behaviour on the formation of truck platoons, the platoon frequency distributions were obtained for the same simulation scenarios of calibrated parameters assuming the “stay-in-lane” regime of traffic, i.e., when lane-changing/overtaking manoeuvres are not allowed between the traffic lanes. Figure 5(b) compares the results. There are a number of large platoons of vehicles in the simulated “stay-in-lane” regime (Figure 5(b)) due to the small gaps between vehicles in the high-density congested phase. However, the frequency of these longer platoons is low. The higher frequency of the longer platoons in the real data is due to faster vehicles being allowed to change lanes.
4. Results
For each vehicle type, the histogram of gross vehicle weight is fitted to a bimodal
Gaussian statistical distribution (Castillo 1987, Ang & Tang 1975). Monte Carlo
simulation is then used to generate weight data appropriate to the measured histogram.
The influence surface, as determined from the FE model for the left- and right-most
longitudinal stiffeners, i.e. points A & B (Figure 1) at the bottom plate of the bridge
mid-span is then used to determine strain histories from simulated traffic. These points
(A & B) represent the most critical mid-span bridge locations under global traffic
effects. Local effects (G, H) are only affected by local traffic and are similar to short-
span bridges. Hence, they are governed by single heavy trucks or two parallel trucks
rather than jams. Simulated vehicle loading patterns with the assigned gross vehicle
weights are applied to the bending moment influence surface to calculate its response to
traffic loading. It was not possible to carry out a load test to calibrate or validate the Finite Element
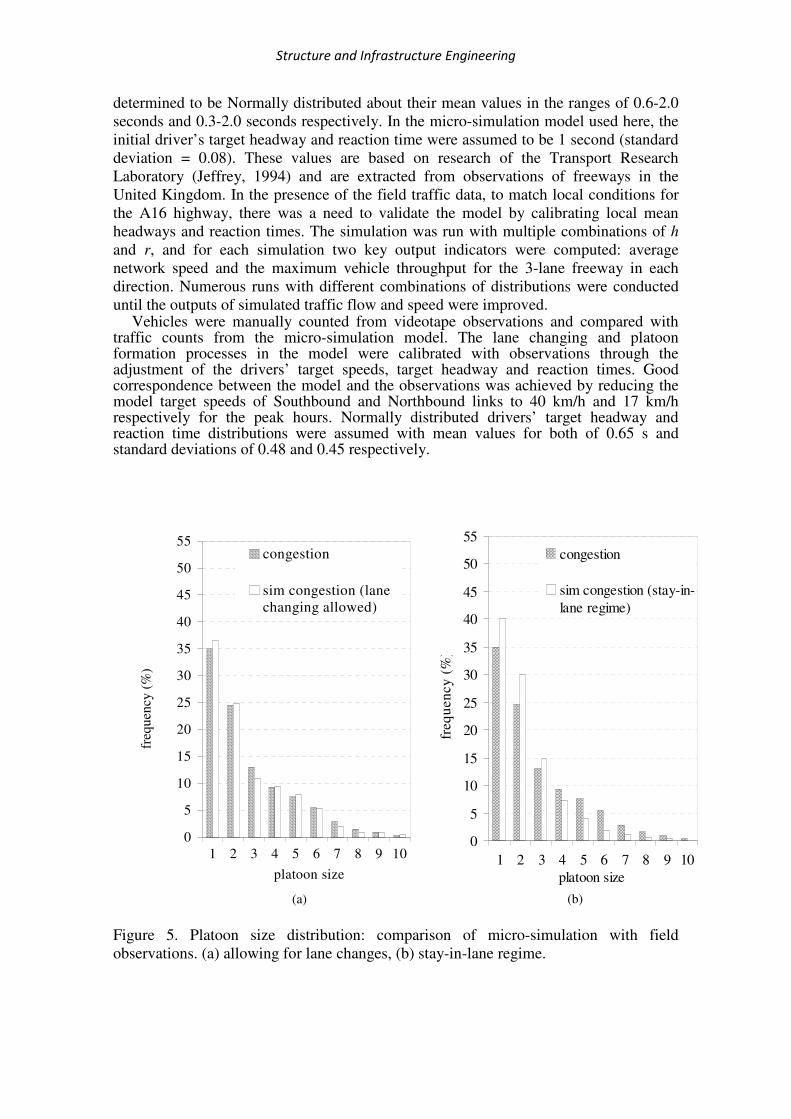
model. However, small adjustments were made to the model parameters to achieve a good match between measured and simulated mean maximum-per-hour strains. This calibration process combines the uncertainties in model parameters (such as modulus of elasticity), strain gauge factors and vehicle GVW data. Figure 6 illustrates a typical fragment of averages of four days of peak bending moments from each 10-minute interval. The range and the overall magnitude are similar for measured and simulated moment.
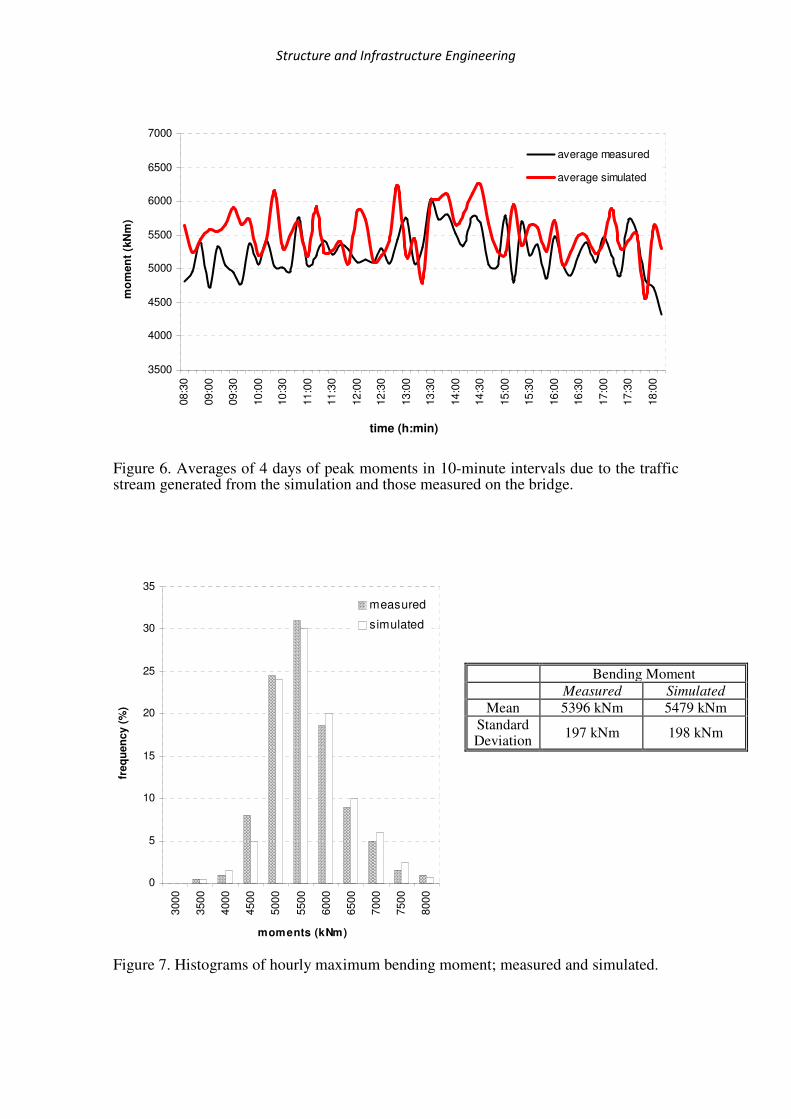
Table 1 gives the mean and standard deviation of the 10-minute peak moments through each of four different days of data. The differences between measured and simulated are within the natural range of variation from day to day. Figure 7 is the histogram of hourly maximum moments over the 11 days and the mean and standard deviations of these hourly maxima. It can be seen that, after calibration, the simulated and measured values match quite well. It is acknowledged that the calibration process can only be considered approximate.
Table 1. Mean and standard deviation of peak moments in 10-minute intervals of four days of data.
calculated moments, kNm simulated moments, kNm
02-Jun 03-Jun 05-Jun 06-Jun Day 1 Day 2 Day 3 Day 4 average
difference
mean 5168 5749 4878 5158 5318 5555 5870 5363 -5.50%
standard deviation
611
737
797
597
629
645
637
593
-3.09%
Structure and Infrastructure Engineering
Figure 6. Averages of 4 days of peak moments in 10-minute intervals due to the traffic stream generated from the simulation and those measured on the bridge.
Figure 7. Histograms of hourly maximum bending moment; measured and simulated.
3500
4000
4500
5000
5500
6000
6500
7000
08:3
0
09:0
0
09:3
0
10:0
0
10:3
0
11:0
0
11:3
0
12:0
0
12:3
0
13:0
0
13:3
0
14:0
0
14:3
0
15:0
0
15:3
0
16:0
0
16:3
0
17:0
0
17:3
0
18:0
0
time (hh:mm)
mo
men
t (k
Nm
)
average measured
average simulated
time (h:min)
0
5
10
15
20
25
30
35
3000
3500
4000
4500
5000
5500
6000
6500
7000
7500
8000
moments (kNm)
freq
uen
cy (
%)
measured
simulated
Bending Moment
Measured Simulated
Mean 5396 kNm 5479 kNm
Standard Deviation
197 kNm 198 kNm

E.J. OBrien et al.
Since in the current work, the bending moment is obtained as the sum of a large
number of independent loads coming from the single random vehicle weights, it is to be
expected from the central limit theorem that the instantaneous bending moment is
approximately normally distributed. Assuming the hourly maximum of the bending
moment to be normal, the extreme value CDF and PDF can be approximated as:
( )
−Φ==
σ
µxxFxF
nn
x )()( (1)
)()()( 1xfxnFxf
n
x
−= (2)
for some equivalent number n of independent Gaussian random variables in the sample,
where Φ is the standardized normal distribution function and σµ, are the mean and
standard deviation, respectively, of the Gaussian random variables. Free flowing and
congested hours involve different loading scenarios; however, the hours with congested
conditions will govern so free flowing traffic is not considered here.
The largest bending moments per hour were selected from the parent population of
empirical traffic load effect data observed/simulated between 08:30 and 17:30 for the
11-day period. Based on this selection, sets of 110 hourly moment maxima were
derived. Figure 8 illustrates the hourly maximum moment distributions of observed data
plotted on Gumbel probability paper but fitted to Equation (2). The maximum
likelihood fit to the data corresponded to n = 370 independent samples. However, the
likelihood is insensitive to n. An hour of congested traffic involves a large number of
overlapping loading events but it is difficult to determine the number of these that are
truly independent. A pragmatic approach is taken here, given the insensitivity of
likelihood to n, and the 'Normal raised to the nth
power' is simply treated as a
distribution that fits the data well.
Figure 8. Observed maximum bending moment data on Gumbel Probability Paper.
81258720
92809745
0
2000
4000
6000
8000
10000
12000
-4.00 -2.00 0.00 2.00 4.00 6.00 8.00 10.00 12.00 14.00 16.00 18.00
Reduced Variate
Ben
din
g M
om
en
t (k
Nm
)
observed data
fit to data distribution
1-year return period
10-year return period
100-year return period
1000-year return period

Structure and Infrastructure Engineering
The estimated extreme distributions have been used to calculate the characteristic
(maximum) moment due to traffic, i.e., the expected value of the maximum moment.
This is repeated for return periods of 1, 10, 100, and 1000 years. The return value is
calculated by assuming that the year has 250 working days, each with 10 hours of heavy
traffic. Thus, for example, the 100-year return value is the percentile that corresponds to
a probability of exceedance of 1/(10*250*100) in the 1-hour extreme value distribution.
The extrapolated results are summarised in Table 2 where it can be seen that there is a
good match between observed and micro-simulated. When vehicles are forced to stay in
lane, there is a non-conservative error of 9 to 11%.
Table 2. Characteristic values for bending moment (kNm).
Return
Period
Observed Micro-
simulation
Stay-in-Lane Micro-
simulation
Error
Stay-in-Lane
Error
1 year 8125 8261 7422 1.6% -8.7%
10 years 8720 8783 7861 0.7% -9.9%
100 years 9280 9311 8254 0.3% -11.1%
1000 years 9745 9776 8667 0.3% -11.1%
The characteristic values are also compared with the corresponding characteristic
value for mid-span bending moment calculated in accordance with Eurocode 1, Part 3.
The 3D FEM of the bridge was used to compute the moment at location A (Figure 1)
where strain measurements were available. Eurocode Load Model 1, consisting of
concentrated and uniformly distributed loads, is used to represent the traffic load effect
for general verification. Because the carriageway on the bridge desk is divided into two
parts, separated by a fixed central barrier, each part, including hard shoulders, is
separately divided into five notional lanes (in the Eurocode, every additional 3 m width
constitutes a notional lane). Hence, a design moment of 16,604 kNm is found. It should
be noted that this value includes an allowance for dynamic amplification which, for a
five notional lane bridge, is 1.1. Hence the static value is 16,604/1.1 = 15,095 kNm.
The difference is 35.4% between the calculated Eurocode characteristic value and the
corresponding observed value (Table 2). This reflects the code’s conservatism which is
necessary for a general load model for new bridges and valid for a wide range of
loading conditions.
5. Conclusion This paper describes the use of micro-simulation techniques to calculate the characteristic loading due to congested traffic on a long-span bridge structure. The driver behaviour and hence the car-truck mix is calibrated through a mixture of traffic parameters and behavioural characteristics. The aggregated output from multiple runs of the calibrated traffic-bridge simulation model was compared to real data collected from the field. Comparisons of micro-simulated and observed /measured variables were performed on hourly and daily bases. The system was calibrated to achieve agreement with the results found for the critical mid-span bending moment of the Moerdijk Bridge. On Gumbel probability paper for maxima, the trend for maximum-per-hour moment followed a very similar trend for micro-simulated and observed data. This shows that the micro-simulation is very effectively reproducing the critical combinations of vehicles (or ones which give the same extreme bending moment). It is evident from the detailed verification analysis of the system outputs that micro-simulation is an excellent

E.J. OBrien et al.
tool for a comprehensive and extensive modelling of bridge traffic loading conditions derived from the real traffic.
Acknowledgements
The authors are indebted to the Civil Engineering Division of the Ministry of Transport,
Public Works and Water Management (DWW), the Netherlands.
References Abdulhai, B., Sheu, J-B. and Recker, W., 1999. Simulation of ITS on the Irvine FOT area using Paramics
1.5 scalable microscopic simulator – phase 1: model calibration and validation. California PATH
Research Report UCB-ITS-PRR-99-12. University of California at Irvine.
Ang, A. H-S. and Tang, W.H., 1975. Probability concepts in engineering planning and design. New
Year: John Wiley.
Bruls, A., Croce, P., Sanpaolesi, L. and Sedlacek, G., 1996. EVN1991-Part 3: Traffic loads on bridges;
Calibration of load models for road bridges, Proceedings of IABSE Colloquium, Delft: IABSE-
AIPCIVBH, 439-453.
Buckland, P.G., McBryde, J.P. and Francis, P.D., 1978. Traffic loading of long span bridges. In:
Conference on bridge engineering proceedings, Transportation Record Research, 146-154.
Buckland, P.G., 1981. Recommended design loads for bridges (Committee on loads and forces on bridges
of the committee on bridges of the structural division), Journal of the Structural Division, ASCE, 1161
– 213.
Castillo, E., 1987. Extreme value theory in engineering. London: Academic Press.
Chu, L., Yang, X., 2003. Optimisation of the ALINEA ramp-metering control using generic algorithm
with micro-simulation. Transportation Research Board 82nd
Annual Meeting, Preprint CD-ROM,
Washington DC, January 12-16, 2003.
Ditlevsen, O. and Madsen, H., 1997. Stochastic vehicle-queue-load model for large bridges. Journal of
Engineering Mechanics, 120 (9), 1829-1847.
European Committee for Standardisation. EVN 1991-2:2003, EC1: 2003. Eurocode 1: Actions on
structures - Part 2: Traffic loads on bridges.
Flint and Neill Partnership for TRRL., 1986. Interim design standard: long span bridge loading.
Transport and Road Research Laboratory: Crowthorne (Contractor Report 16).
Fritzsche, H.T., 1994. A model for traffic simulation. Traffic Engineering and Control, 35 (5), 317 – 321.
Jeffreys, W., 1994. Motorway lane discipline: motorway traffic modelling study. Technical Report,
Transportation research Laboratory: United Kingdom, March 1994.
Kunzman, W., 1978. Another look at signalised intersection capacity. ITE Journal, 48 (1), 12-15.
Lieberman, E. and Rathi, A.K., 1999. Traffic simulation. New York.
Nowak, A.S., 1991. Bridge load models. In: R.Heywood, Austroads bridges conference, 13-15 November
1991 Brisbane, 27-44.
Nowak, A.S., 1999. Calibration of LRFD bridge design code. Transportation Research Board: National
Cooperative Highway Research Program, Report 368.
Rafael, P., Saldana, Winfer, C. Tabares., 2000. Traffic modeling on high perfomance computing systems.
In: Proceedings of the philippine computing science congress (PCSC 2000). Computing Science of
the Philippines, 2000.
Wiedemann, R., 1974. Simulation des Straβenverkehrsflusses. Schriftenreihe des Instituts für
Verkehrswesen der Universität Karlruhe, Vol 8.