title mechanism of permafrost landslide based on gps and
TRANSCRIPT

Title Mechanism of Permafrost Landslide Based on GPS andResistivity Surveying
Author(s) Shan, Wei; Hu, Zhaoguang; Jiang, Hua; Guo, Ying; Wang,Chunjiao
Citation
Matsue Conference Proceedings (The Tenth InternationalSymposium on Mitigation of Geo-disasters in Asia = 第10回地震・地盤災害軽減に関するアジア会議及び現地討論会)(2012): 82-94
Issue Date 2012-10-08
URL http://hdl.handle.net/2433/180411
Right
Type Presentation
Textversion publisher
Kyoto University
brought to you by COREView metadata, citation and similar papers at core.ac.uk
provided by Kyoto University Research Information Repository

Mechanism of Permafrost LandslideBased on GPS and Resistivity Surveying
Wei Shan, Zhaoguang Hu, Hua Jiang, Ying Guo and Chunjiao Wang
Abstract The formation and development of landslide at K178 ? 530 section ofBei’an-Heihe expressway was mainly affected by armchair shape topography of theslope, hydrologic and climatic conditions, frost-heave cycles, and geotechnicalengineering activities for highway construction. The study employed data obtainedfrom portable global positioning system (GPS) equipment and high-resolutionresistivity profiling to characterize landslide mass dynamic characteristics, strati-graphic log profile of the landslide and analyze the motion mechanism of thelandslide in K178 ? 530 section of Bei’an-Heihe expressway. Lithologic andgeological information were obtained from four monitoring wells drilled along theslope. About 40 GPS gauge piles were placed at different positions on the slidingmass on September 13, 2010, to accurately determine the time, direction and rate ofmovement at different locations and analyze the role of freezing, thawing andrainfall on the sliding mass. The field monitoring campaign lasted for more than1 year. Between June, and September 2010, we carried out a high-resolutionresistivity investigation to obtain resistivity profile logs of the slope. The resultsshow that the landslide material resistivity profile logs show a significant differencebefore and after the sliding. Result shows that before the movement of the slope,data obtained from resistivity log shows a uniform signature, while after or duringsliding, the resistivity signature changed. The change was due to the developmentof a slip surface within the landslide mass.
Keywords Landslide � Permafrost region � GPS � High-density resistivity method
W. Shan (&) � Z. Hu � H. Jiang � Y. Guo � C. WangNortheast Forestry University, 150040 Harbin, Chinae-mail: [email protected]
F. Wang et al. (eds.), Progress of Geo-Disaster Mitigation Technology in Asia,Environmental Science and Engineering, DOI: 10.1007/978-3-642-29107-4_18,� Springer-Verlag Berlin Heidelberg 2013
349
82

1 Foreword
Landslide is a downward movement of soil, rock or a mixture of both along slopesunder the effect of gravity (Kong et al. 2008; GB50021-2001 2002). It is one of themain disasters associated with mountainous regions where near vertical slopes lieclose to highways and poses serious threats to lives and properties (Feng et al.1999; Shan et al. 2008; Liu et al. 2007).
Accurate determination of the sliding surface of a landslide mass and failurecharacteristics is an important factor in slope stability analysis and landslideprevention programs (He 1991). The purpose of landslide geotechnical engineer-ing investigation is to determine these important parameters which play vital rolesin disaster prevention and mitigation (Zhu et al. 2008).
This article utilizes results from GPS technology and high-resolution resistivityprofiling to study motion mechanism and failure style of landslides in permafrostregions. The study area is located in Lesser Khingan Range central region atK178 ? 530 section of Bei’an-Heihe Expressway, in high altitude permafrostdegraded region of China. We used GPS technology to monitor the morphologicalchanges of the landslide and employed high-resolution resistivity profiling toobtain stratigraphic log profile of the landslide which aided in determining thefailure surface and other changes in discontinuity of horizontal strata.
2 General Situation of Study Area
2.1 Physical Geography of Study Area
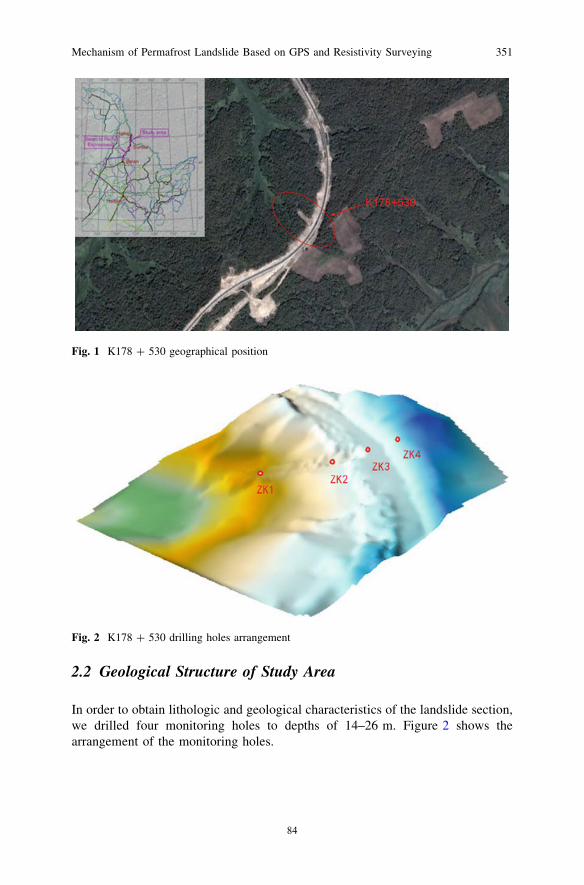
The study area is located in Lesser Khingan Range central region, in high altitudepermafrost degraded belt of China. Climatic data of the area shows that springseason is warm and short; summer hot and rainy with cool and short autumn periodand cold long winter season. Annual average temperature of the region is -0.8 �C,annual average precipitation is 510–572 mm, with high rainfall intensity betweenJuly and September, which accounts for 60 % of annual total precipitation. Winterstarts in October and ends in late March or early April. Permafrost depositsdominates the upper part of the slope with maximum seasonal frozen depth is2.30–2.50 m The geomorphology of the area is mainly low mountains and hillswith high topographic relief in high altitude permafrost region (Fig. 1).
350 W. Shan et al.
83
2.2 Geological Structure of Study Area
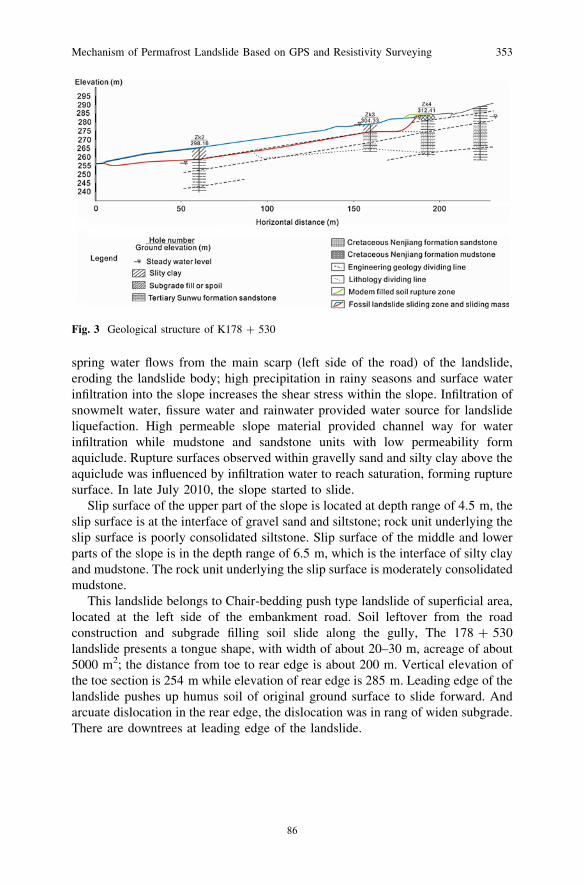
In order to obtain lithologic and geological characteristics of the landslide section,we drilled four monitoring holes to depths of 14–26 m. Figure 2 shows thearrangement of the monitoring holes.
Fig. 1 K178 ? 530 geographical position
Fig. 2 K178 ? 530 drilling holes arrangement
Mechanism of Permafrost Landslide Based on GPS and Resistivity Surveying 351
84

The stratigraphic log profile of the landslide material is made up of Cretaceousmudstone and sandstone, Tertiary pebbly sandstone, and Quaternary loose sedi-ments. These are further subdivided into the following units:
(1) Subgrade soil or highway construction material: This unit includes subgradematerials, Tertiary pebbly sandstone, Cretaceous mudstone and sandy mudstonewith characteristic reddish-brown colouration. It is wet, loose when dry and plasticonce saturated. Thickness is about 1–1.5 m at the upper and middle section of logprofile.
(2) Silty clay: This layer shows intercalation of silts and clay which enhancedpore water infiltration. It is soft and usually wet, poorly graded, brownishappearance with visible seepage outlets. This unit lies between 1.5–3.8 m on theupper section of the log profile (ZK2 hole), and in depth of 0–6.7 m in the middleand lower sections of the slope (ZK1 hole). Intercalation of fine sand and shalewere also observed, with thicknesses which range from 1 cm to 10 cm. Waterpermeability is also high at the sand-shale contacts.
(3) Tertiary pebbly sandstone: This unit is located in depth range of 3.8–4.5 m,on the upper section of the landslide (ZK1 hole). It is weathered, loose, poorlygraded composed pebbles distributed in a fine sand matrix which enhanced surfacewater infiltration.
(4.1) Weathered siltstone: This unit occupies depth range of 4.5–14.3 m on theupper section of the landslide (ZK1 hole). It shows thin parallel lamination, Sandystructure, bedding construction and week bonding force, all the mineral constit-uents is weathered into secondary minerals, the locality has clay substance, and thestructure has been compromised, the ability of water permeability is vey bad.
(4.2) Weathered mudstone: This unit is located below the silty clay layer atdepth range of 6.7–8.0 m for ZK1 hole and below siltstone layer at depth of14.3 m in ZK2. The rocks are unconsolidated, soft, and relatively impermeable.Colour of weathered sample is gray while fresh sample colour is black.
(5) Completely weathered mudstone: This unit dominates the basal section ofthe slope which is distributed around ZK1 and ZK2. It shows a massive structurelacking bedding planes with very fine grain sizes and characteristic black-grayappearance for fresh sample and gray for weathered sample (Fig. 3).
3 Formation Mechanism and Morphological Characteristicsof Landslide
The formation and development of the landslide at K178 ? 530 section ofBei’an-Heihe expressway mainly was affected by the topography, engineeringgeology, hydrology and climate characteristics, armchair shape topography, activegroundwater change, intense freeze–thaw cycle and civil engineering activities.Because of the highway construction, landslide materials dislodged from theunstable slope make up one-third part of exposed soil in the area; perennial fissure
352 W. Shan et al.
85
spring water flows from the main scarp (left side of the road) of the landslide,eroding the landslide body; high precipitation in rainy seasons and surface waterinfiltration into the slope increases the shear stress within the slope. Infiltration ofsnowmelt water, fissure water and rainwater provided water source for landslideliquefaction. High permeable slope material provided channel way for waterinfiltration while mudstone and sandstone units with low permeability formaquiclude. Rupture surfaces observed within gravelly sand and silty clay above theaquiclude was influenced by infiltration water to reach saturation, forming rupturesurface. In late July 2010, the slope started to slide.
Slip surface of the upper part of the slope is located at depth range of 4.5 m, theslip surface is at the interface of gravel sand and siltstone; rock unit underlying theslip surface is poorly consolidated siltstone. Slip surface of the middle and lowerparts of the slope is in the depth range of 6.5 m, which is the interface of silty clayand mudstone. The rock unit underlying the slip surface is moderately consolidatedmudstone.
This landslide belongs to Chair-bedding push type landslide of superficial area,located at the left side of the embankment road. Soil leftover from the roadconstruction and subgrade filling soil slide along the gully, The 178 ? 530landslide presents a tongue shape, with width of about 20–30 m, acreage of about5000 m2; the distance from toe to rear edge is about 200 m. Vertical elevation ofthe toe section is 254 m while elevation of rear edge is 285 m. Leading edge of thelandslide pushes up humus soil of original ground surface to slide forward. Andarcuate dislocation in the rear edge, the dislocation was in rang of widen subgrade.There are downtrees at leading edge of the landslide.
Fig. 3 Geological structure of K178 ? 530
Mechanism of Permafrost Landslide Based on GPS and Resistivity Surveying 353
86

4 Landslide Monitoring Based on GPS
4.1 The Arrangement of GPS Monitoring Piles
On 22 of July, 2010, two deformation monitoring pipes on the landslide body weresheared to the depth of 4.2 m and 6.5 m respectively under the ground; the sensorconnection lines were also sheared. The result was used in monitoring the motionmechanism of the landslide. We arranged 49 GPS gauge piles at different positionson the landslide on 13 of September, 2010. Using GPS to monitor the moving dataof these gauge piles, monitoring cycle is more than 1 year.
The arrangement of GPS gauge piles is shown in Fig. 4. From the rear edge oflandslide to the leading edge we respectively arranged 11 rows in order, respec-tively arranging on the both sides of the outside landslide, the central location onthe top of landslide and close to the rear edge of landslide. The distance from thefirst row to the rear edge of landslide is 15 m, and the numbers from left to right1#–3#; The distance from the second row to the rear edge of landslide is 30 m, andthe numbers from left to right 4#–10#; The distance from the third row to the rearedge of landslide is 50 m. The distance from the forth row to the rear edge oflandslide is 70 m. The distance from the fifth row to the rear edge of landslide is93 m. The distance from the sixth row to the rear edge of landslide is 119 m. Thedistance from the seventh row to the rear edge of landslide is 134 m. And theothers are distribution near the leading edge of the landslide. These GPS moni-toring piles can monitor the sliding condition at the upstream and middle stream,as well as the downstream of the landslide. It also can monitor the centre, near theedges and outside locations etc. of the landslide. The monitoring cycle lasted formore than one year.
4.2 Gauge Piles Motion Characteristic at Different Positions
By the first row of gauge piles sliding displacement graph (as shown in Fig. 5),From September 13, 2010 to November 2010, 1#, 2# and 3# gauge piles of slidingdisplacement were 6.90 m, 8.05 m and 4.12 m respectively. From November 2010to mid-late May 2011, landslide was not sliding. Until early June 2011, landslidebegan to slide, and by September 25, 2011, sliding displacements of 1#, 2# and 3#gauge piles were 45.70 m, 65.01 m and 23.82 m in 1 year. In the same cross-sectional inside, slip rate in a central location close to slip rate near the edge.
Figure 6 shows the displacement graph of the second row gauge piles. From thefront row and second row sliding displacement graph of gauge piles, frommonitoring commencement day (September 13, 2010) to the middle of November,Landslide had been in sliding state. After mid-November, land surface began tofreeze, and until the end of May 2011, landslide had been always in steady state.From early June 2011, Landslide began to slide once again. During the same time,
354 W. Shan et al.
87

gauge piles sliding displacement in the central location of landslide are obviouslybigger than gauge piles of sliding displacement near edge position.
From the gauge pile slip displacement curve (Fig. 7) in the central location oflandslide, we can see that, from September 13, 2010 to September 25, 2011, duringthe 377 days, the gauge pile slip displacement from the first row to the seventh rowrespectively are 65.01 m, 71.31 m, 64.20 m, 54.23 m, 46.37 m, and 39.43 m.
Fig. 4 Arrangement diagram of GPS monitoring piles
The first row
0
20
40
60
80
date
1#2#3#
Dis
plac
emen
t(m
)
Fig. 5 The slidingdisplacement graph of thefirst row gauge piles
The second row
0
20
40
60
80
date
5#6#7#8#9#
Dis
plac
emen
t(m
)
Fig. 6 The slidingdisplacement graph of thesecond row gauge piles
Mechanism of Permafrost Landslide Based on GPS and Resistivity Surveying 355
88
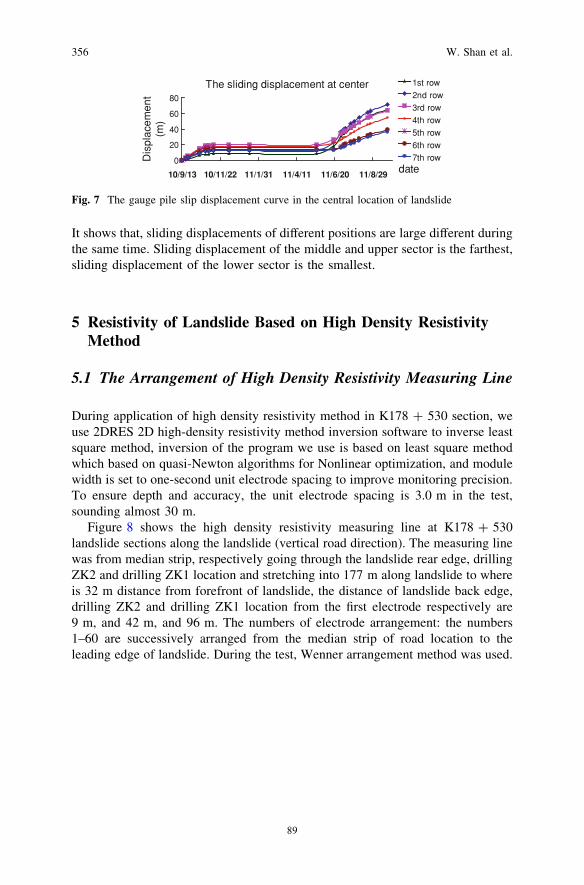
It shows that, sliding displacements of different positions are large different duringthe same time. Sliding displacement of the middle and upper sector is the farthest,sliding displacement of the lower sector is the smallest.
5 Resistivity of Landslide Based on High Density ResistivityMethod
5.1 The Arrangement of High Density Resistivity Measuring Line
During application of high density resistivity method in K178 ? 530 section, weuse 2DRES 2D high-density resistivity method inversion software to inverse leastsquare method, inversion of the program we use is based on least square methodwhich based on quasi-Newton algorithms for Nonlinear optimization, and modulewidth is set to one-second unit electrode spacing to improve monitoring precision.To ensure depth and accuracy, the unit electrode spacing is 3.0 m in the test,sounding almost 30 m.
Figure 8 shows the high density resistivity measuring line at K178 ? 530landslide sections along the landslide (vertical road direction). The measuring linewas from median strip, respectively going through the landslide rear edge, drillingZK2 and drilling ZK1 location and stretching into 177 m along landslide to whereis 32 m distance from forefront of landslide, the distance of landslide back edge,drilling ZK2 and drilling ZK1 location from the first electrode respectively are9 m, and 42 m, and 96 m. The numbers of electrode arrangement: the numbers1–60 are successively arranged from the median strip of road location to theleading edge of landslide. During the test, Wenner arrangement method was used.
The sliding displacement at center
0
20
40
60
80
10/9/13 10/11/22 11/1/31 11/4/11 11/6/20 11/8/29 date
Dis
plac
emen
t(m
)
1st row
2nd row
3rd row
4th row
5th row
6th row
7th row
Fig. 7 The gauge pile slip displacement curve in the central location of landslide
356 W. Shan et al.
89

5.2 The Landslide Soil Resistivity Change Before and Afterthe Landslide Forming
We began investigation and study on K178 ? 530 areas from May 2010, beforeJuly 22, 2010, K178 ? 530 landslides had been in stable state. On July 22, 2010,two deformation monitoring pipes on the landslide body were sheared respectivelyin the depth of 4.2 m and 6.5 m under the ground, the sensor connection lines werealso sheared, accordingly, we determined that the landslide soil began sliding.During the application of high density resistivity method in the process ofinvestigation and study on K178 ? 530 landslides, on June 1, 2010, andSeptember 10, 2010, we did twice measure on the landslide, gaining the landslidesoil resistivity change before and after the landslide forming.
As shown in Fig. 9 is the inversion images of landslide soil resistivity on June1, 2010, when the landslide had not yet been formed and the landslide body hadnot yet started to slide. Through the inversion images of resistivity we could get:before the landslide body formed, landslide body’s resistivity values was mono-tone decreasing with the depth increase, and had no jumping phenomenon ofresistivity values.
As Shown in Fig. 10 is landslide soil resistivity inversion image on September10, 2010. By the resistivity inversion image we can get: there is an obvious layered
Fig. 8 The high density resistivity measuring line
Mechanism of Permafrost Landslide Based on GPS and Resistivity Surveying 357
90

of landslide soil resistivity and clear differences of sliding surface soil resistivityvalue after landslide formed.
The first electrode distance of 96 m (drilling 1 position), resistivity value asshown Figs. 10, 11. Depth 0–2.1 m is silty clay, which containing about 15 % ofthe organic matter as grassroots ect., and resistivity value is 20–67 X � m; Depth2.1–6.7 m is silty clay, which local have weathered sand sandwich, and resistivityvalue is 15–32 X � m; Depth 6.7–8.0 m is mudstone, and its structure is pieces, andresistivity value is 46–54X � m; Depth 8.0–26 m is gray mudstone, where is closeto ground water level or below ground water level in the underground, andresistivity value smaller is 10–35X � m. In 0–2.1 m depth is silty clay that containsa lot of grassroots, water down the plant roots to infiltrate is easy; Below 6.7 m ismudstone, the permeability coefficient is small, water is difficult to infiltrate,forming water-resisting layer. Water is easy to gather in the top surface of mud-stone layer, mudstone in water softening disintegration and easy to form thesliding surface. Due to the local weathered sand sandwich, the silty clay in2.1–6.7 m depth can make water infiltrate easily.
The first electrode distance of 42 m (drilling 2 positions), resistivity value asshown Figs. 10, 12. In 0–4.5 m depth, resistivity value is 10–27X � m, the surfacelayer road building abandon soil give priority to silty clay (Depth 0–3.8 m),resistivity value is 15–27X � m, resistivity value of sand gravel (Depth 3.8–4.5 m)is 10–22X � m. Below 4.5 m is siltstone, particles smaller and seepage ability is
Fig. 9 The inversion images of landslide soil resistivity on June 1, 2010
Fig. 10 The inversion images of landslide soil resistivity on September 10, 2010
358 W. Shan et al.
91
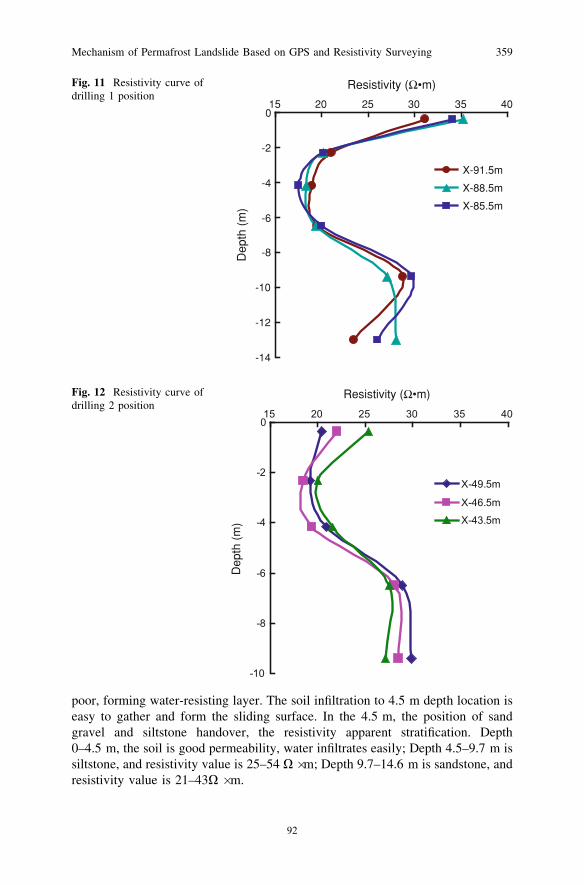
poor, forming water-resisting layer. The soil infiltration to 4.5 m depth location iseasy to gather and form the sliding surface. In the 4.5 m, the position of sandgravel and siltstone handover, the resistivity apparent stratification. Depth0–4.5 m, the soil is good permeability, water infiltrates easily; Depth 4.5–9.7 m issiltstone, and resistivity value is 25–54 X � m; Depth 9.7–14.6 m is sandstone, andresistivity value is 21–43X � m.
-14
-12
-10
-8
-6
-4
-2
015 20 25 30 35 40
Resistivity (Ω•m)
Dep
th (
m)
X-91.5m
X-88.5m
X-85.5m
Fig. 11 Resistivity curve ofdrilling 1 position
-10
-8
-6
-4
-2
015 20 25 30 35 40
X-49.5m
X-46.5mX-43.5m
Resistivity (Ω•m)
Dep
th (
m)
Fig. 12 Resistivity curve ofdrilling 2 position
Mechanism of Permafrost Landslide Based on GPS and Resistivity Surveying 359
92

The resistivity value at the slip surface location showed significant stratificationand the resistivity values of its upper and lower show more obvious differences.According to the typical characteristic of the slip surface, we can infer the positionof sliding surface, as shown Fig. 13.
6 Conclusion
(1) The slope failure belongs to superficial and translational movement on bed-ding planes in permafrost region. The soil within the sliding surface is siltyclay, which is loose when dry, soft and plastic. The main triggering factorobserved was freeze–thaw which has cycle have far-reaching consequences forthe landslide, exhibiting intermittent slide and bench slope. There are Drumlinfields on the landslide slope. Snowmelt water, rainwater and fissure waterprovide groundwater source for the landslide. Tympanites cracks on the slopecontribute to atmospheric precipitation pool in the landslide and permeate intothe landslide. High permeability of landslide soil mass provides passage forwater infiltration; mudstone and sandstone with low permeability form aqui-fuge while silty clay above the aquifuge is influenced by infiltration water toreach saturation, forming rupture surface.
(2) Different locations on the landslide have large different sliding displacementsduring the whole monitoring period. The displacement near the main scarp islargest, 50–72.56 m; at the middle of the landslide is 36.69–46.37 m, nearlandslide toe is 8.25–30 m. On the landslide exists bedding son-landslide, thedistance between son-landslide flank and mother-landslide flank is 1.5–4 m,within the same cross section of landslide, the sliding displacement of center islargest, the sliding displacement near landslide flank is smallest.
(3) Sliding velocity of the landslide is large different in different seasons. Frommid-November to late May of the following year, Rainfall was very small,the surface layer of ground was frozen, Landslide was at rest all the while; Inlate May of the following year, Due to the seasonal frozen ground melts and
Fig. 13 Infer the position of sliding surface
360 W. Shan et al.
93

snow cover melting and infiltrating, Landslide began slipping once again, thesliding velocity of landslide was fastest in this period (from late May to mid-June), sliding velocity of rear edge was 0.89 m/d, sliding velocity of middlelandslide was 0.37 m/d, and sliding velocity near toe was 0.16 m/d; Slidingvelocity began decreasing in late June, sliding velocity of rear edge was0.51 m/d, sliding velocity of middle landslide was 0.30 m/d, and slidingvelocity near toe was 0.11 m/d; After mid-October, sliding velocity of thelandslide was slower, the average was 0.08 m/d.
(4) Using the high-density resistivity method to survey the landslide and itssurroundings, and to accurately detect the landslide resistivity value at dif-ferent locations, according to characteristic of resistivity value, and combinedwith drilling results, to determine the position of sliding surface: at rear edge,the position of sliding surface was at the depth of 3.2 m apart from the ground;at 30 m apart from rear edge, sliding surface was at the depth of 4.5 m; at themiddle landslide, sliding surface was at the depth of 6.5 m; near the landslidetoe, sliding surface was at the depth of 4 m, at toe position, sliding surface wasat the depth of 2.5 m. Within the same cross section of landslide, slidingsurface of center is deepest; sliding surface near landslide flank is shallowest.
(5) At the position of the sliding surface, the resistivity is obviously low, about7–20X m; the resistivity at the position of landslide flank shows a suddenchange, obviously large. Resistivity value of soil on the landslide is lower thanresistivity value of soil at the same depth of outside landslide.
Acknowledgments This work was financially supported by Heilongjiang CommunicationsDepartment project and subtopic of the western communication science and technology project‘‘Study on Subgrade Stability Controlling Technology of Expressway Expansion ProjectPermafrost Melt and Landslides Sections’’.
References
Feng SR, Feng DX, Ge XR et al (1999) 3D limit equilibrium method for slope stability and itsapplication. Chin J Geotech Eng 21(6):657–661
GB50021-2001 (2002) Geotechnical engineering investigation specification. China Architecture& Building Press, Beijing
He YX (1991) Application of D.C electric sounding for the permafrost exploration alongXinjiang-Xizang highway. J Glaciol Geocryol
Kong FL, Chen C, Sun GJ (2008) Application of multi-electrodes electrical method to landslideinvestigation in Qingjiang Shuibuya reservoir. Chin J Eng Geophys 5(2):201–204
Liu LH, Zhu DY, Liu DF (2007) Discussion on multiple solutions of safety factor of a slope.Rock Soil Mech 28(8):1661–1664
Shan W, Liu HJ, Yang L et al. (2008) Study of regularity of variation of water content in shallow layerof soil road cutting slopes in seasonally frozen-ground region. Rock Soil Mech 29(sup.):335–340
Zhu Y, Rao Z, Wu B (2008) Organic and gas geochemistry of gas hydrate-bearing sedimentsfrom mallik 5L–38 production research well, Mackenzie Delta Canada. Geol surv Can Bull68(2):311–319
Mechanism of Permafrost Landslide Based on GPS and Resistivity Surveying 361
94