title ii geologic data compilation project geology …...and redding sheets was scarce or...
TRANSCRIPT

California Geological Survey Title II Geologic Compilation Project, 1979
TITLE II GEOLOGIC DATA COMPILATION PROJECT Geology and Landslides in Selected North Coast Quadrangles of Northern California A Project of the California Department of Forestry By
Donn Ristau, Jean B. Durham, and Barry S. Culver Under the Direction of
M.E. Huffman, California Division of Mines and Geology November 1979 INTRODUCTION
During 1978 and 1979, the California Department of Forestry (CDF), now the California Department of Forestry and Fire Protection (CalFIRE), hired several geologists to compile an initial source of existing geologic and landslide data on timberlands along California’s north coast. The project, known as the Title II Geologic Data Compilation Project, encompassed more than 70 topographic quadrangles from Del Norte County south to Santa Cruz County (Figures 1-4). Geologic and landslide data were compiled at a scale of either 1:62,500 (north of San Francisco) or 1:24,000 (south of San Francisco), under the direction of Michel E. Huffman, a licensed geologist with the California Division of Mines and Geology (CDMG), now the California Geological Survey (CGS). The purpose of the compilation was to assist CDF with the identification of possible non-point sources of sediment pollution from landslides along watercourses within proposed Timber Harvesting Plans submitted to CDF and other regulatory agencies for review.
The Title II Geologic Data Compilation Project represented the first attempt by CDF to capture the geologic conditions, including the steep unstable slopes, of California’s north coast on a regional basis. Although the source data was preliminary in some areas and mapped inconsistently, the maps provided a broad-scale overview of where certain types of geologic terrain might present slope stability and/or erosion problems that should be addressed on the ground to verify if additional mitigation to proposed timber harvesting and other land-use modifications would be needed. The usefulness of the maps eventually led to additional, more detailed 7.5-minute quadrangle mapping by CDMG under the 208 Watersheds Mapping Project of 1981, funded by the U.S. Environmental Protection Agency (Bedrossian, 1983). Watersheds mapping continued from 1982 through 1985 with funding from CDF (Bedrossian, 1986). More recent and more detailed mapping has been done in many of the quadrangles originally covered in the Title II Compilation (Davies and Spittler, 1999; Taylor and Brabb, 1986). However, in some remote places, these maps are still the only geologic information available and should be supplemented with more detailed mapping for site specific purposes. BACKGROUND
In 1972, Congress passed Public Law 92-500, called at the time the Federal Water Pollution Control Act (U.S. Environmental Protection Agency, 2013). The goals of the act were to reduce or

California Geological Survey Title II Geologic Compilation Project, 1979
eliminate pollutants entering streams and lakes throughout in order to make them fishable, swimmable, and drinkable. While the Act established the basic structure for regulating the discharge of point sources of pollution into the waters of the United States, Section 208 of the law dealt specifically with the reduction of pollutants arising from non-point sources such as agriculture and silviculture (timber harvesting). Under Section 208, the states were required to minimize non-point source pollution through the adoption and implementation of “Best Management Practices” (BMPs). It was understood that not all non-point source pollutants can be eliminated, especially those that occur naturally. In many states, the state forestry agencies were designated as responsible for adoption of BMPs to govern silvicultural activities (Martin, 1989). In California, however, then Governor Reagan designated the State Water Resources Control Board to oversee the implementation of all regulations under Section 208. In addition, under California’s Porter-Cologne Act of 1969, broad powers were given to the state’s Regional Water Quality Control Boards to reduce water pollution. While the water boards had limited authority to regulate specific practices, they proposed a joint effort with CDF and the Board of Forestry to address BMPs and subsequent regulations related to timber harvesting.
In 1977, Congress amended the Federal Water Pollution Control Act and renamed it the Federal Clean Water Act (U.S. Environmental Protection Agency, 2013). Cumulative effects were given additional prominence in Section 208 of the Act (Martin, 1989). As a result, CDF and the water boards took additional measures to address the identification and mitigation of possible non-point sources of sediment pollution. During this process, CDF applied for limited-term funding under Title II of the Public Works Employment Act of 1976 (U.S. Government Printing Office, 1976). Ultimately, the Geologic Data Compilation Project met certain of the criteria, such as being regional scale in nature and capable of promoting or advancing longer range existing plans and programs in the rural areas specifically covered by the work. Donn Ristau was hired in October 1978 to begin compilation of data within designated 15-minute (1:62,500 scale) quadrangles of the Weed and Redding 1:250,000 map sheets (Ristau, 1979; Figures 1 and 2). Jean B. Durham also began work in October 1978 on 15-minute quadrangles within the Ukiah and Santa Rosa 1:250,000 map sheets (Durham, 1979; Figures 1 and 3). Barry S. Pulver began work in January 1979, compiling data on 7.5-minute quadrangles within the San Francisco, Santa Clara, and Santa Cruz (now known as Monterey) 1:250,000 map sheets (Pulver, 1979; Figures 1 and 4). Differences in the compilations are described below.

California Geological Survey Title II Geologic Compilation Project, 1979
Figure 1. Simplified Index Map of Topographic Maps of California within each 1:250,000-Scale Map Sheet. Quadrangles in the Title II Project are highlighted (Modified from U. S. Geological Survey, 2015).

California Geological Survey Title II Geologic Compilation Project, 1979
SCOPE OF WORK 15-Minute Quadrangles within the Weed and Redding 1:250,000-Scale Map Sheets Geologic and landslide data were mapped at a scale of 1:62,500 on a total of 26 coastal 15-minute quadrangles within the Weed and Redding map sheets (nine on the Weed Sheet, 17 on the Redding Sheet; Figure 2). The compilations were developed over a one-year period (October 1978-October 1979) from a wide variety of sources. Geologic data were derived primarily from state and federal publications, unpublished state and federal open-file reports, unpublished theses from various academic institutions, unpublished mapping, and personal communication with private consultants as indicated on the Index to Geologic Mapping for the Weed and Redding sheets (Ristau, 1979). Landslide data was gathered primarily from the air photo interpretation of NASA high-altitude infrared photography in areas shown on the Index Map for Flight-Line 78-054 Index Map (Ristau, 1979). The infrared photographs were rectified with the topographic base maps using a zoom stereo transfer scope. Landslides observed on the photos were then plotted on mylar overlays registered with metal pins. Field work was also conducted on a limited basis to verify previous mapping in selected areas. The geological interpretations and definitions used in the Descriptions of Units for the quadrangles mapped within the Weed and Redding map sheets generally coincided with concepts used by the U.S. Geological Survey and the California Division of Mines and Geology at that time. Quadrangles mapped within the Weed and Redding sheets are underlain predominantly by landslide-prone mélange of the central belt Franciscan Formation of Jurassic-Cretaceous age, with undifferentiated inclusions of ultramafic peridotite and serpentinite. Lower lying coastal areas in the vicinity of Eureka and Arcata are overlain by Tertiary aged sandstones, mudstones, and siltstones and Quaternary age terrace and alluvial deposits. South of Eureka, metamorphosed sandstones of the coastal belt Franciscan Formation are prominent within the coastal quadrangles. Because detailed published data in quadrangles in the Weed and Redding sheets was scarce or non-existent, the delineation of geologic unit boundaries relied heavily upon 1:250,000-scale and 1:750,000-scale regional geologic maps published by CDMG (Jennings, 1977; Strand, 1962, 1963). Modifications were made based on original geologic source data listed in the references and limited field verification. However, structural and stratigraphic work was being carried out by other professionals in several areas, and it was expected that some ages and formational boundaries used in the compilations would later be revised. It was also noted that not all areas were uniformly mapped with the same thoroughness or intensity, especially with respect to landslide data (compare areas mapped by Nolan et al. 1976, or Jacks, 1972-73 with bordering areas). Landslide data is presented to some extent on all quadrangles. However, air photo interpretation of landslides was not conducted on four quadrangles where existing landslide data was available or where photo coverage used during this project was limited (see Index Map for Flight 78-054; Ristau, 1979). These included the Willow Creek, Pickett Peak, Kettenpom, and Black Rock Mountain 15-minute quadrangles. Thus, comparisons between areas, with respect to geological complexity or landform stability should be made with an understanding of these limitations. Variations from the cited source data result from interpretation and opinions of the compiling geologist or in the interest of increased map legibility.

California Geological Survey Title II Geologic Compilation Project, 1979
Figure 2: Index Map of 15-Minute Quadrangles in the Compilation of the Weed and Redding Sheets.

California Geological Survey Title II Geologic Compilation Project, 1979
15-Minute Quadrangles within the Ukiah and Santa Rosa 1:250,000-Scale Map Sheets
Geologic and landslide data were mapped at a scale of 1:62,500 on a total of 31 coastal 15-minute quadrangles within the Ukiah and Santa Rosa map sheets (18 on the Ukiah Sheet, 13 on the Santa Rosa Sheet; Figure 3). Although the Albion and Navarro 15-minute quadrangles are listed separately in the Index to Geologic Mapping for the Ukiah and Santa Rosa sheets, the two areas are combined on the Albion-Navarro 15-minute quadrangle map (Durham, 1979). In addition, three 15-minute Mosaic maps represent a composite of 7.5-minute quadrangles mapped at the 1:62,500 scale. These include: Mosaic I (Mosaic 1 on the Index Map) which includes areas covered in the Stewarts Point, Annapolis, and Plantation 7.5-minute quadrangles; Mosaic II (Mosaic 2 on the Index Map) which includes areas covered in the Tombs Creek, Skaggs Springs, Ft. Ross, and Cazadero 7.5-minute quadrangles; and Mosaic III (Mosaic 3 on the Index Map) which includes areas covered in the Arched Rock, Duncan Mills, and Bodega Head 7.5-minute quadrangles. The Comptche 15-minute quadrangle on the Ukiah map sheet is also known as the Glenblair 15-minute quadrangle in places (Bedrossian, 1983).
Similar to the 15-minute quadrangles mapped within the Weed and Redding sheets, the geologic and landslide compilations within the Ukiah and Santa Rosa were developed over a one-year period (October 1978-October 1979) from a wide variety of sources. Geologic data were derived primarily from state and federal publications, unpublished state and federal open-file reports, unpublished theses from various academic institutions, unpublished mapping, and personal communication with private consultants as indicated on the Index to Geologic Mapping for the Ukiah and Santa Rosa sheets (Durham, 1979). Landslide data was gathered primarily from the air photo interpretation of NASA high-altitude infrared photography in areas shown on the Index Map for Flight-Line 78-064 Index Map (Durham, 1979). The infrared photographs were rectified with the topographic base maps using a zoom stereo transfer scope. Landslides observed on the photos were then plotted on mylar overlays registered with metal pins. Field work was also conducted on a limited basis to verify previous mapping in selected areas. The geological interpretations and definitions used in the Descriptions of Units for quadrangles mapped the Ukiah and Santa Rosa sheets generally coincided with concepts used by the U.S. Geological Survey and California Division of Mines and Geology at the time. Along the coast, quadrangles mapped within the Ukiah and Santa Rosa sheets are underlain predominantly by sandstones of the coastal belt Franciscan Formation that are somewhat less metamorphosed than those mapped in quadrangles to the north. To the east, the coastal belt rocks grade into the central belt melange of the Franciscan Formation. In places, the Cretaceous units are overlain by Tertiary and Quaternary marine and non-marine sediments. In the southeastern portion of the area near Clear Lake, a series of Tertiary and Quaternary volcanic rocks abut thin-bedded sandstones, shales, and conglomerates of the Cretaceous Great Valley Sequence. Because published data in the more mountainous portions of the Ukiah sheet and northwest corner of the Santa Rosa sheet was scarce, the delineation of geologic unit boundaries in these areas relied heavily upon 1:250,000-scale and 1:750,000-scale regional geologic maps published by CDMG (Jennings, 1977; Jennings and Strand, 1960; Koenig, 1963). Modifications were made on quadrangles in the eastern portion of the Ukiah sheet and southern part of the Santa Rosa sheet where a greater number of original geologic references were available as source data (see Index to Geologic Mapping for the Ukiah and Santa Rosa map sheets, Durham, 1979). However, structural and stratigraphic work was being carried out by other professionals in several areas, and it was expected that some ages and formational boundaries used in the compilations would later be revised.

California Geological Survey Title II Geologic Compilation Project, 1979
It was also noted that not all areas were uniformly mapped with the same thoroughness or intensity, especially with respect to landslide data (compare NE1/4 of the Laytonville quadrangle to the rest of the Laytonville Quadrangle). Landslide data is presented to some extent on most of the quadrangles mapped. However, air photo interpretation of landslides was not conducted on several quadrangles where existing landslide data was available or where photo coverage used during this project was limited (see Index Map for Flight 78-064; Durham, 1979). These include: Covelo, Hull Mtn., Lake Pillsbury, Healdsburg, Calistoga, St. Helena, Sebastopol, Santa Rosa, and Mosaics I, II. III. Thus, comparisons between areas, with respect to geological complexity or landform stability should be made with an understanding of these limitations. Variations from the cited source data result from interpretation and opinions of the compiling geologist or in the interest of increased map legibility.

California Geological Survey Title II Geologic Compilation Project, 1979
Figure 3: Index Map of 15-Minute Quadrangles in the Compilation of the Ukiah and Santa Rosa Sheets.

California Geological Survey Title II Geologic Compilation Project, 1979
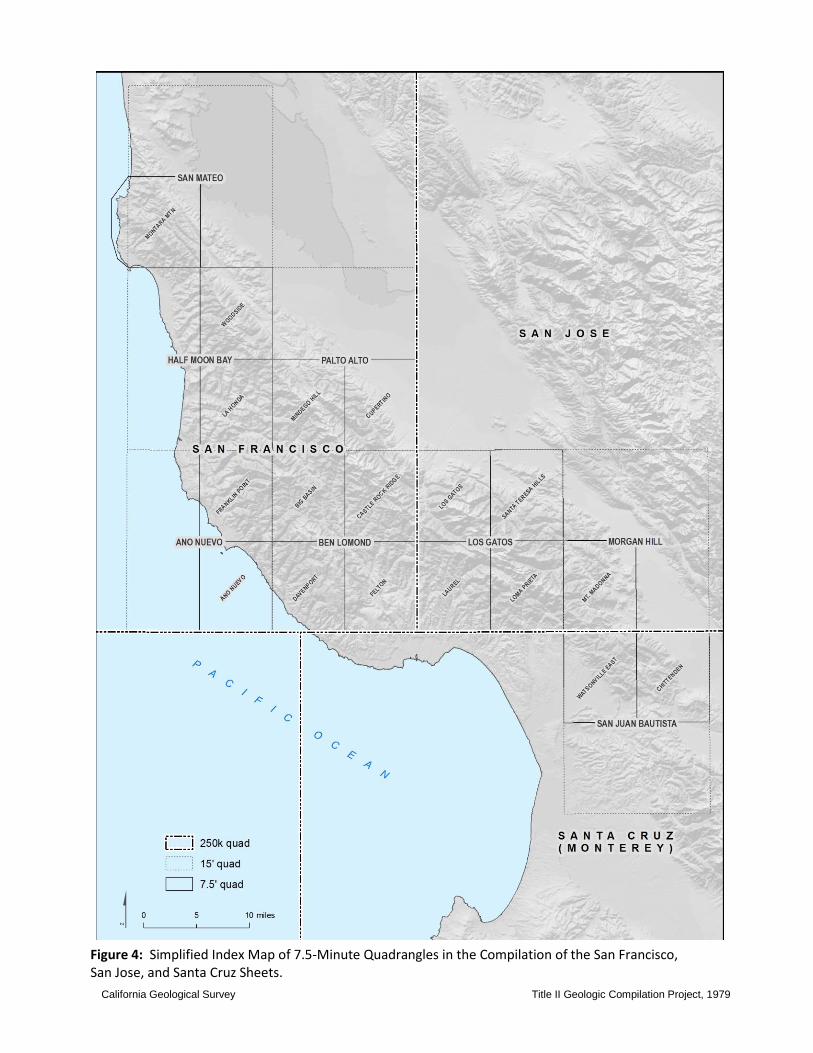
7.5-Minute Quadrangles within the San Francisco, San Jose, and Santa Cruz (now known as Monterey) 1:250,000-Scale Map Sheets
Geologic and landslide data in quadrangles with forested terrain south of San Francisco were compiled at a scale of 1:24,000. A total of 18 coastal 7.5-minute quadrangles (11 on the San Francisco Sheet, five on the San Jose Sheet, and two on the Santa Cruz Sheet) are shown on the Index to Geologic Mapping for the three 1:250,000-scale map sheets south of San Francisco (Pulver, 1979; Figure 4). However, it appears that the geologic compilations for five of the 7.5-minute quadrangles were never completed. Only topographic base maps are presented for the Los Gatos, Laurel, Loma Prieta, Mt. Madonna, and Watsonville East quadrangles.
Compilations of geologic and landslide data were developed over a 10-month period (January 1979-November 1979) using a wide variety of sources. Both geologic and landslide data were derived from state and federal publications, unpublished state and federal open-file reports, and unpublished theses from various academic institutions listed in the Index to Geologic Mapping for the San Francisco, San Jose, and Santa Cruz map sheets (Pulver, 1979). Unlike the quadrangles complied north of San Francisco, compilations in the 7.5-minute quadrangles are based entirely on data existing at that time. No aerial photo interpretation of landslides or field work was performed. The geological interpretations and definitions used in the Description of Units for quadrangles mapped in the San Francisco, San Jose, and Santa Cruz map sheets generally coincided with concepts used by the U.S. Geological Survey and California Division of Mines and Geology at the time. In general, geologic units mapped in quadrangles south of San Francisco are much younger in age than those mapped to the north of San Francisco. The San Andreas Fault divides younger Tertiary and Quaternary sandstones, shales, and conglomerate units west of the fault from older Franciscan sandstones to the east. Because forested terrain in the quadrangles mapped is located adjacent to the well-populated areas south of San Francisco, a larger number of published geologic reports with landslide data were available, and mapped in more detail by the U.S. Geological Survey and the CDMG, than in areas north of San Francisco (see Index to Geologic Mapping for the San Francisco, San Jose, and Santa Cruz map sheets; Pulver, 1979). In addition, more detailed fault mapping based on the CDMG Alquist-Priolo Special Study Zone maps was incorporated into the compilations. However, as in the quadrangles to the north, structural and stratigraphic work was on-going in several areas, and it was expected that some ages and formational boundaries that were used in these compilations would be revised. It was also noted that not all areas were uniformly mapped with the same thoroughness or intensity, especially with respect to landslide data (compare the southern half of the Chittenden quadrangle to the northern half). Thus, comparisons between areas, with respect to geological complexity or landform stability should be made with an understanding of these limitations. Variations from the cited source data result from interpretation and opinions of the compiling geologist.
California Geological Survey Title II Geologic Compilation Project, 1979
Figure 4: Simplified Index Map of 7.5-Minute Quadrangles in the Compilation of the San Francisco, San Jose, and Santa Cruz Sheets.

California Geological Survey Title II Geologic Compilation Project, 1979
LIMITATIONS AND USE OF MAPS
Northern California includes some of the most complex and varied geology in the western United States. Topographic relief ranges from sea level to rugged mountains. Large areas of low relief along coastal and inner valleys north of San Francisco are sparsely populated in comparison with more rapidly urbanizing areas south of San Francisco. However, low-lying drainages adjacent to steep fault-bounded and landslide-prone mountain ranges are subject to periodic debris laden floods and debris flows. In some areas, both the magnitude and areal extent of devastating landslides, flooding, and debris flows increase when seasonal wildfires are followed by heavy rainfall. For this reason, information contained in the Title II Geologic Data Compilation should not be used as a substitute for detailed geologic studies in any specific area. The maps, which are outdated in some areas, were originally intended only for rapid regional identification of areas subject to landslides and erosion based on geologic conditions in forested terrain. More detailed analyses by qualified professionals may be required where such areas are identified. REFERENCES CITED Bedrossian, T.L., 1983, Watersheds Mapping in Northern California: California Geology, v. 36, no. 7, p. 140-147. Bedrossian, T.L., 1986, An Update…Watersheds Mapping in Northern California: California Geology, v. 39 no. 2, p. 34-38. Davies, R.I., and Spittler, T.E., 1999: Index to Published Landslide Maps, California Coast Ranges, Monterey County and North, for Use in Timber Harvesting Plan Preparation on Non-Federal Land: Division of Mines and Geology, Special Publication 120, 20 p. Durham, J.B., 1979, Title II Geologic Compilation Project, Ukiah and Santa Rosa Map Sheets: California Department of Forestry, unpublished 15-minute quadrangle maps, scale 1:62,500. Jacks, J., 1972-1973, Geologic and Landform Maps, Resource Capability Inventory, Six Rivers National Forest: Unpublished maps in Eureka Office, Eight Mile Planning Unit, Blue Creek Planning Units 1& 2, Camp Creek Planning Unit, scale 1: 31,250. Jennings, C.W., 1977, Geologic Map of California: California Division of Mines and Geology, Geologic Data Map #2, scale 1:750,000. Jennings, C.W., and Strand, R.G., 1960, Geologic Map of California – Ukiah Sheet: California Division of Mines and Geology, scale 1:250,000. Koenig, J. B., 1963, Geologic Map of California – Santa Rosa Sheet: California Division of Mines and Geology, scale 1:250,000. Martin, E.F., 1989, “A Tale of Two Certificates”, The California Forest Practice Program, 1976 through 1988: Department of Forestry and Fire Protection, Sacramento, 322 p.

California Geological Survey Title II Geologic Compilation Project, 1979
Nolan, K.M., Harden, D.R., and Colman, S.M., 1976, Erosional Landform Map of the Redwood Creek Drainage Basin, Humboldt County, California, 1947-1974: U.S. Geological Survey, Water Resources Investigations, Open-File Report 76-42, scale 1:62,500. Pulver, B.S., 1979, 1979, Title II Geologic Compilation Project, San Francisco, San Jose Map, and Santa Cruz Map Sheets: California Department of Forestry, unpublished 7.5-minute quadrangle maps, scale 1:24,000. Ristau, D., 1979, 1979, Title II Geologic Compilation Project, Weed and Redding Map Sheets: California Department of Forestry, unpublished 15-minute quadrangle maps, scale 1:62,500. Strand, R.G., 1962, Geologic Map of California – Redding Sheet: California Division of Mines and Geology, scale 1:250,000. Strand, R.G., 1963, Geologic Map of California – Weed Sheet: California Division of Mines and Geology, scale 1:250,000. Taylor, F., and Brabb, E.E., 1986, Map Showing the Status of Landslide Inventory and Susceptibility Mapping in California: U.S. Geological Survey, Open-File Report 86-100, 39 p. U.S. Environmental Protection Agency, 2015, Laws & Regulations, Clean Water Act: 230 PDF pages. (http://www.thecre.com/fedlaw/legal14water/cwa.htm) U.S. Geological Survey, 1973 and 2015, Index to Topographic Maps of California. U.S. Government Printing Office, 1976, Public Works Employment Act of 1976, (S. 3201): Public Law 94-369 together with Fact Sheet and Section-by-Section Analysis, Printed for the use of the Committee on Public Works and Transportation, 94th Congress, 2nd Session, 27 p. (http://heinonline.org) Project Summary prepared by Trinda L. Bedrossian, September 2015

California Geological Survey Title II Geologic Compilation Project, 1979