title: glassboro test score analysis date: october 27, 2010 glassboro public schools
TRANSCRIPT

Title: Glassboro Test Score Analysis
Date: October 27, 2010
Glassboro Public Schools

2
Standards-Based Education Reform
• The 21st century supports standards-based educational reform,
which is based on the belief that setting high standards and
establishing measurable goals can improve individual outcomes in
education.
• Our Focus is on the Future / Moving Forward
* Improving the educational experience of our children at
Glassboro Schools
* Proactive Problem Solvers
3
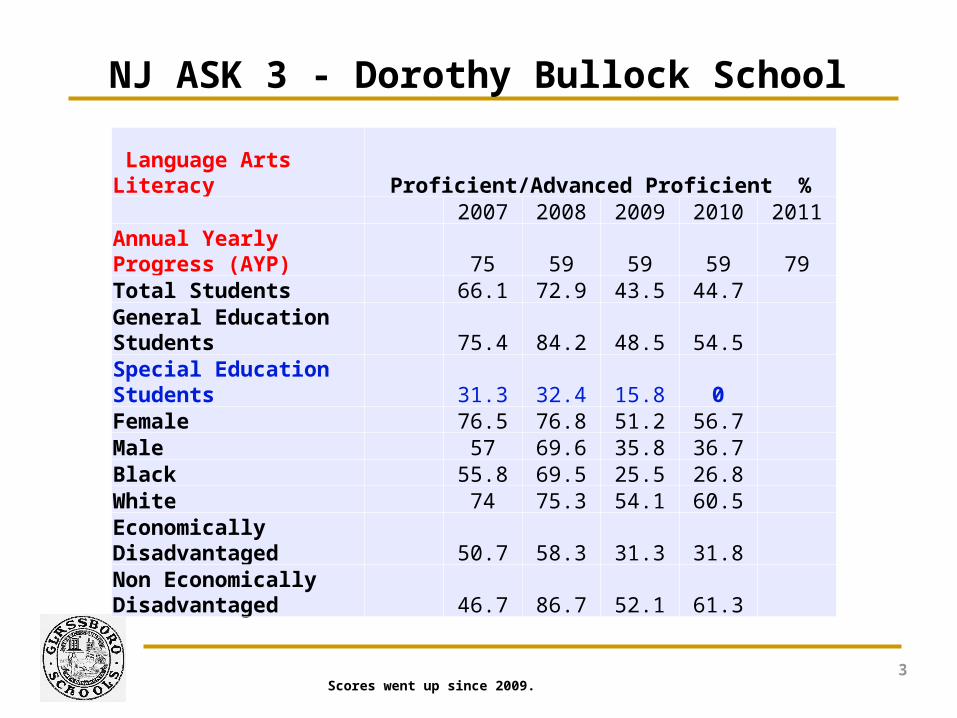
NJ ASK 3 - Dorothy Bullock School
Language Arts Literacy %Proficient/Advanced Proficient 2007 2008 2009 2010 2011Annual Yearly Progress (AYP) 75 59 59 59 79Total Students 66.1 72.9 43.5 44.7 General Education Students 75.4 84.2 48.5 54.5 Special Education Students 31.3 32.4 15.8 Female 76.5 76.8 51.2 56.7 Male 57 69.6 35.8 36.7 Black 55.8 69.5 25.5 26.8 White 74 75.3 54.1 60.5 Economically Disadvantaged 50.7 58.3 31.3 31.8 Non Economically Disadvantaged 46.7 86.7 52.1 61.3
0
Scores went up since 2009.

4
NJ ASK 3 - Dorothy Bullock SchoolMathematics %Proficient/Advanced Proficient 2007 2008 2009 2010 2011Annual Yearly Progress (AYP) 62 66 66 66 83Total Students 77.8 71.5 58.9 62 General Education Students 85.4 79.7 64.7 71.5 Special Education Students 52.9 39.4 26.4 18.1 Female 83.9 68.3 59.8 65 Male 82.3 74.4 58 60 Black 54 61.1 39.2 41 White 87.6 73.3 71.8 81.6 Economically Disadvantaged 61.9 55.3 41.8 45.5 Non Economically Disadvantaged 88.5 86.8 70.8 85.5 Advanced Proficient % 2007 2008 2009 2010 2011Language Arts 4 6.2 1.8 0.7 Mathematics 14.9 20.7 19 28.7
We are making progress in every subgroup except for Special Education.

5
NJ ASK 4- Thomas Bowe School
Language Arts Literacy Proficient/Advanced Proficient 2007 2008 2009 2010 2011Annual Yearly Progress (AYP) 75 59 59 59 79Total Students 60.3 66.7 44.6 39.6 General Education Students 70.4 77.5 53.1 43.9 Special Education Students 26.3 28.1 21.4 15.8 Female 62.5 70.3 45.1 40 Male 60.8 63.9 44.2 41.7 Black 50 56.1 29.2 22 White 68.9 75.8 53 58.3 Economically Disadvantaged 33.3 49.2 21.4 23.1Non Economically Disadvantaged 77.3 76.2 55.4 49.5
Scores have been declining since 2009.
6
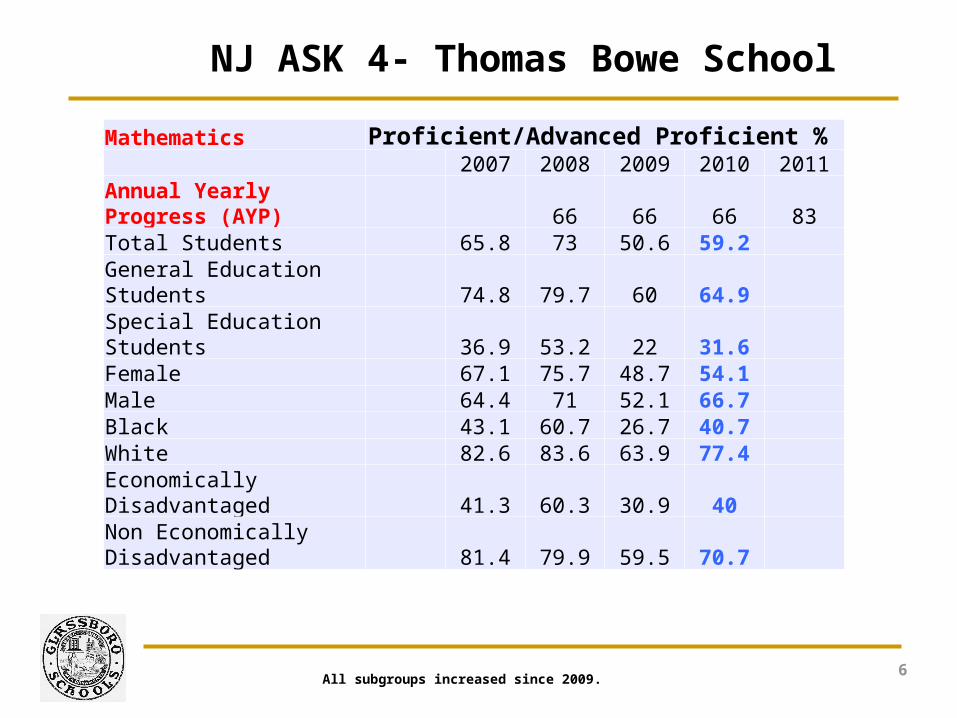
NJ ASK 4- Thomas Bowe School
Mathematics % Proficient/Advanced Proficient 2007 2008 2009 2010 2011Annual Yearly Progress (AYP) 66 66 66 83Total Students 65.8 73 50.6 59.2 General Education Students 74.8 79.7 60 64.9 Special Education Students 36.9 53.2 22 31.6 Female 67.1 75.7 48.7 54.1 Male 64.4 71 52.1 66.7 Black 43.1 60.7 26.7 40.7 White 82.6 83.6 63.9 77.4 Economically Disadvantaged 41.3 60.3 30.9 40 Non Economically Disadvantaged 81.4 79.9 59.5 70.7
All subgroups increased since 2009.

7
NJASK 5- Thomas Bowe SchoolLanguage Arts Literacy % Proficient/Advanced Proficient 2007 2008 2009 2010 2011Annual Yearly Progress (AYP) 75 59 59 59 79Total Students 86.8 39.1 45.3 50 General Education Students 94.3 48.2 57.6 58.2 Special Education Students 46.2 9.5 12.5 22.2 Female 91.3 37.4 55.1 61.9 Male 82.6 40.9 37 40.7 Black 76.7 27 20 34.4 White 92.6 48.5 63.3 60 Economically Disadvantaged 81 19.7 31.5 33.4 Non Economically Disadvantaged 90 48.8 51.7 62.1
All subgroups increased except for white students.
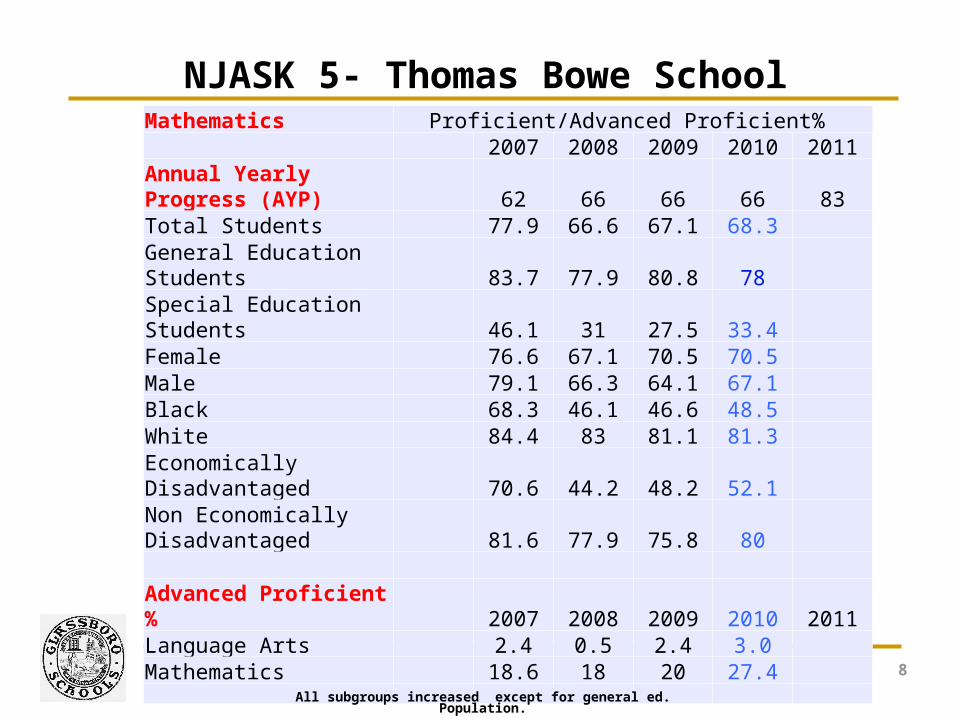
8
NJASK 5- Thomas Bowe SchoolMathematics % Proficient/Advanced Proficient 2007 2008 2009 2010 2011Annual Yearly Progress (AYP) 62 66 66 66 83Total Students 77.9 66.6 67.1 68.3 General Education Students 83.7 77.9 80.8 78 Special Education Students 46.1 31 27.5 33.4 Female 76.6 67.1 70.5 70.5 Male 79.1 66.3 64.1 67.1 Black 68.3 46.1 46.6 48.5 White 84.4 83 81.1 81.3 Economically Disadvantaged 70.6 44.2 48.2 52.1 Non Economically Disadvantaged 81.6 77.9 75.8 80 Advanced Proficient % 2007 2008 2009 2010 2011Language Arts 2.4 0.5 2.4 3.0 Mathematics 18.6 18 20 27.4
All subgroups increased except for general ed. Population.
9
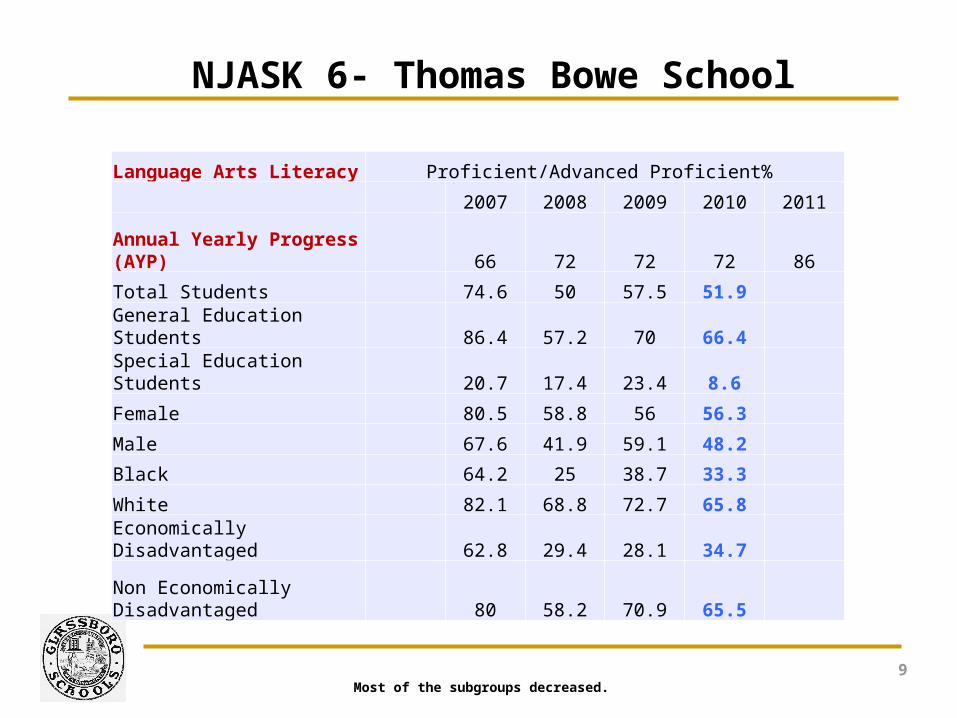
NJASK 6- Thomas Bowe School
Language Arts Literacy % Proficient/Advanced Proficient
2007 2008 2009 2010 2011
Annual Yearly Progress (AYP) 66 72 72 72 86
Total Students 74.6 50 57.5 51.9
General Education Students 86.4 57.2 70 66.4
Special Education Students 20.7 17.4 23.4 8.6
Female 80.5 58.8 56 56.3
Male 67.6 41.9 59.1 48.2
Black 64.2 25 38.7 33.3
White 82.1 68.8 72.7 65.8
Economically Disadvantaged 62.8 29.4 28.1 34.7
Non Economically Disadvantaged 80 58.2 70.9 65.5
Most of the subgroups decreased.

10
NJASK 6- Thomas Bowe School
Mathematics % Proficient/Advanced Proficient
2007 2008 2009 2010 2011
Annual Yearly Progress (AYP) 49 61 61 61 80
Total Students 70.6 61.1 57.5 49.4
General Education Students 82.6 68.1 71.5 61.2
Special Education Students 14.3 25 19.1 14.3
Female 78.2 60 54.8 52.2
Male 61.6 62 60.2 47.1
Black 59 35.1 37.1 35
White 78.3 77.4 72.7 59.5
Economically Disadvantaged 54.9 30.7 35.1 40.9
Non Economically Disadvantaged 78 74.8 67.8 56.3
Advanced Proficient % 2007 2008 2009 2010 2011
Language Arts 7.5 0.6 2.8 1.3
Mathematics 12.5 10.2 7.2 10.3
Most of the sub groups decreased since 2009.

11
NJASK 7- Intermediate School
Language Arts Literacy % Proficient/Advanced Proficient
2007 2008 2009 2010 2011Annual Yearly Progress (AYP) 66 72 72 72 86
Total Students 74.8 58.9 60.2 49.4
General Education Students 81.4 72.8 70.6 62.7
Special Education Students 37.5 6.7 15.4 8.9
Female 76.3 64 64.6 52
Male 75.6 52.7 56 46.7
Black 59.3 36.2 47.2 37.3
White 82.9 73.8 75 57.3
Economically Disadvantaged 60 31.7 43.1 36.4
Non Economically Disadvantaged 82.9 68.4 67 60.4
Across all subgroups the scores have decreased.

12
NJASK 7- Intermediate School
Mathematics % Proficient/Advanced Proficient
2007 2008 2009 2010 2011
Annual Yearly Progress (AYP) 49 61 61 61 80
Total Students 58.5 51.9 53.3 44.1
General Education Students 65.9 63.2 61 55.6
Special Education Students 13 10 20 8.9
Female 62.3 57 53.7 40.8
Male 54.9 45.9 53 47.8
Black 39.6 34.5 30.7 23.9
White 69.3 67.5 75 56.3
Economically Disadvantaged 35.2 29.2 26 30.6
Non Economically Disadvantaged 70.5 59.8 65.3 55.4
Advanced Proficient % 2007 2008 2009 2010 2011
Language Arts 3.8 5.7 6.6 7.4
Mathematics 9.5 13.9 14.5 11.7
All but one subgroup decreased.

13
NJASK 8- Intermediate School
Language Arts Literacy % Proficient/Advanced Proficient
2007 2008 2009 2010 2011
Annual Yearly Progress (AYP) 66 72 72 72 86
Total Students 60.3 70.4 71.9 73.6
General Education Students 74.1 79.6 87.4 83.6
Special Education Students 5.9 29.6 19.4 30.8
Female 65.2 75.1 78.6 80.7
Male 54.9 66.7 63.8 66.3
Black 43.5 57.4 58.2 59.3
White 74.7 80 81.5 92.1
Economically Disadvantaged 51.7 44.2 56.8 55.2
Non Economically Disadvantaged 65 79.8 78 86.5
Test scores went up except for two subgroups, gen ed & economically disadvantaged.

14
NJASK 8- Intermediate School
Mathematics % Proficient/Advanced Proficient
2007 2008 2009 2010 2011
Annual Yearly Progress (AYP) 49 61 61 61 80
Total Students 56.6 49.3 64.3 51.0
General Education Students 68.1 59.1 78 58.9
Special Education Students 11.8 3.7 10 15.3
Female 53.3 48.8 67.8 44.6
Male 60.5 50.6 59.7 57.6
Black 31.6 32.7 49.1 31.5
White 71 60 75.3 69.3
Economically Disadvantaged 38 23.2 44.2 26.9
Non Economically Disadvantaged 66.1 58.9 72.2 67.8
Same as 6th, 7th, all but one subgroup decreased.
15
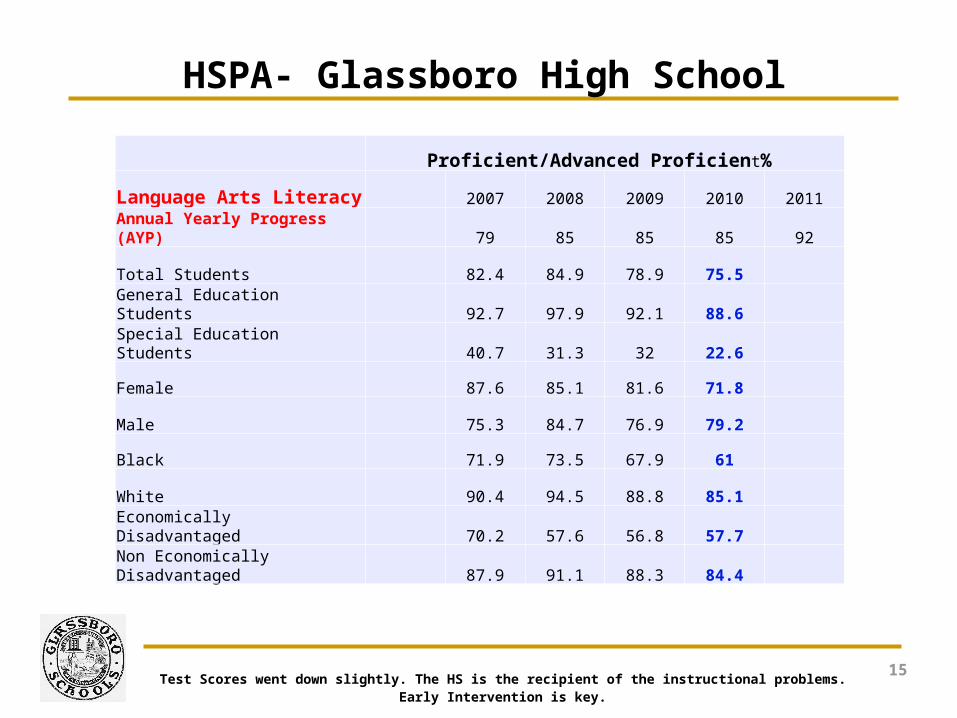
HSPA- Glassboro High School
% Proficient/Advanced Proficient
Language Arts Literacy 2007 2008 2009 2010 2011
Annual Yearly Progress (AYP) 79 85 85 85 92
Total Students 82.4 84.9 78.9 75.5
General Education Students 92.7 97.9 92.1 88.6
Special Education Students 40.7 31.3 32 22.6
Female 87.6 85.1 81.6 71.8
Male 75.3 84.7 76.9 79.2
Black 71.9 73.5 67.9 61
White 90.4 94.5 88.8 85.1
Economically Disadvantaged 70.2 57.6 56.8 57.7
Non Economically Disadvantaged 87.9 91.1 88.3 84.4
Test Scores went down slightly. The HS is the recipient of the instructional problems.Early Intervention is key.

16
HSPA- Glassboro High School
% Proficient/Advanced Proficient
Mathematics 2007 2008 2009 2010 2011
Annual Yearly Progress (AYP) 64 74 74 74 86
Total Students 72.3 69.4 67.6 60 General Education Students 83 81.3 79.8 69.9
Special Education Students 25 21.2 20.7 22.6
Female 75.3 65.9 57.8 51.3
Male 68.1 73.3 75.3 68.8
Black 55.1 51.5 44.2 44.1
White 85 84.6 87.5 70.1
Economically Disadvantaged 47.9 48.5 34.9 46.1
Non Economically Disadvantaged 83.2 74.1 81.3 67
Advanced Proficient % 2007 2008 2009 2010 2011
Language Arts 14.9 8.4 4.8 12.3
Mathematics 12.9 14.4 18.6 14.2

17
Long Term Vision For Glassboro School District
• Revise all curriculum to reflect the 2009 CCCS.
• Implement a 5 Year Curriculum Plan
• Support and oversee the utilization of formative and summative assessments to show multiple means of both teacher and student academic progress.
• Support, enhance and review the Literacy Program using the revised NJ CCCS district wide. (Guided Reading/Writer’s Workshop)
• Examine the feasibility of implementing Everyday Math in sixth grade and examine the rigor of the math program at the middle school level.
• Professional Development in the areas of Reading and Writing
• Examine intervention programs
•

18
District Assessment Overview
P K 1 2 3 4 5 6 7 8
Individual Child Profile/The Developmental Continuum
X
Kindergarten Screening X
DIBELS (3X per year) Nov./Feb./June X X X X
RIGBY READS X X
JJ Reading Inventories X X X
Accelerated Reading X X X X X X
Accelerated Math X X X X X X
Monthly Guided Reading Levels X X X X X X
Literacy By Design Benchmark Assessments X X X X X X
McDougal-Littell Benchmark Assessments X X X
Everyday Math/Pre/Post Assessment/Unit Assessments
X
X
X
X
X
X
Connected Math/Algebra Unit Assessments X X X
Elementary Technology Portfolio Assessment X
NJ ASK Testing X X X X X X
8th Grade Technology Portfolio Assessment X
MAP Assessments X X X X X X X X X
Wilson WADE Assessment X X X
Project Read X X X
End of Course Algebra Exam X

19
The Vision of Glassboro
• Writer's Workshop is a program that teaches children the conventions of writing. Students not only learn proper grammar and punctuation; they also come to learn and value the importance of drafting, revising, and editing their pieces of writing.
• Writer's Workshop is a process that needs to be consistent. It is composed of three parts. The first part is the mini-lesson where the teacher meets with the whole class and discusses writing concerns. The second part is conferencing, where the teacher meets with individuals or small groups. The third part is sharing, where the students publicly share a part of their work.
• Writer's Workshop is an excellent way to prepare students for state tests. The National Assessment of Educational Progress (NAEP) has indicated that 75% of our nation's children are writing on an average level. Of this percentage, students received higher scores on writing assessments who spent time in the writer's workshop.
• Research indicates that writer's workshop provides an excellent way to support and teach young children how to become good writers.

20
The Vision of Glassboro
•Guided Reading is a context in which a teacher supports each reader’s development of effective strategies at levels of difficulty for processing novel texts at increasingly challenging levels of difficulty.
•The goal of guided reading is to enable children to read for meaning at all times and to help students to use reading strategies independently.
•Provide reading comprehension questions that require students to recall or locate a detail.
•Inferential questions: Reading comprehension questions that require students to combine prior knowledge with information in the passage in order to deduce the correct response.
•Analytical questions : Reading comprehension questions that require students to analyze information. Often these questions involve the author’s purpose or point of view.
•Benchmark Assessments

21
The New Vision of Professional Development
• The New Jersey Professional Teaching Standards Board believes that educators must be dedicated to a continuous plan of professional development that begins with their pre-service activities, that continues with their induction into the profession, and that extends through the life of their professional career in education through on-going and sustained professional development endeavors.
• Effective educators are life-long learners, professional development must be an on-going process of refining skills, inquiring into practice, and developing new methods.
• Professional development activities must also complement both the needs of the educator and the goals and objectives of the school district.
• Activities must focus on the conditions which affect student learning in order for teachers to develop the knowledge and expertise needed to enable students to function as independent thinkers and creative learners both in the school community and in the larger environment of society as a whole.
• Effective implementation of new techniques requires financial support, time and planning. Therefore, those new techniques and practices should be protected and nurtured as well as appropriately evaluated.

22
Preparing for the Long Haul
• Leadership has a great deal to do with creating a shared vision and inspiring others to join you in working to achieve these goals.
• Goal: To foster classrooms where excellent teaching is targeted to the variable learning needs of diverse students.
• Substantial change is a slow process that must be initiated and implemented.
• This plan will be revised over the years but we need to make a commitment to provide meaningful changes that enhance teacher pedagogy (toolkit) and student achievement.

23
Any Questions!