title estimates of the harvested area of oil palm in …...1 comparison of faostat statistics and...
TRANSCRIPT

TitleComparison of FAOSTAT statistics and Dot sampling surveyEstimates of the harvested area of oil palm in Indonesia,Malaysia, and Thailand
Author(s) Jinguji, Issei
Citation Working Paper Series (2018), 8: 1-12
Issue Date 2018-07
URL http://hdl.handle.net/2433/233867
RightCopyright (C) 2014 Academic Center for Computing andMedia Studies, Agricultural Economics and InformationLaboratory, Kyoto University. All Rights Reserved
Type Research Paper
Textversion author
Kyoto University
STATISTICAL DIGITAL ARCHIVE OF AGRICULTURE, FORESTRY AND FISHERIES
WORKING PAPER SERIES
学術情報メディアセンター 食料・農業統計情報開発研究分野
Working Paper Series No. 8
Comparison of FAOSTAT statistics and
Dot sampling survey Estimates of the harvested area of
oil palm in Indonesia, Malaysia, and Thailand
Issei Jinguji
Kyoto University Academic Center for Computing and Media Studies
Jul. 2018
Academic Center for Computing and Media Studies,
Agricultural Economics and Information Laboratory
本 Working Paper は、京都大学寄附講座 農林水産統計デジタルアーカイ
ブ講座のプロジェクト研究として実施された研究成果を公表するための
ものである。
Copyright (C) 2014 Academic Center for Computing and Media Studies, Agricultural Economics and Information Laboratory, Kyoto University. All Rights Reserved

1
Comparison of FAOSTAT statistics and
Dot sampling survey Estimates of the harvested area of
oil palm in Indonesia, Malaysia, and Thailand
1. Introduction
In recent years, there has been a sharp increase in the harvested area of oil palm in
Indonesia, Malaysia, and Thailand, which are major producers of palm oil. According to the
statistics of the Food and Agriculture Organization Corporate Statistical Database (FAOSTAT),
in 2014, the harvested area reached 8.15 million hectares in Indonesia, 4.69 million hectares in
Malaysia, and 644 thousand hectares in Thailand. The harvested area of oil palm in these three
countries represents 69.4% of the 19,439 million hectares of the world’s harvested area for the
crop. These data are used widely across the globe as reliable, official statistical data. However,
although these statistics are computed by experts, their accuracy cannot be determined. Therefore,
to confirm the reliability of FAOSTAT statistics, we tried to estimate the harvested area in these
three countries in November 2017, using the new “dot sampling survey” method on Google Earth,
which we developed in 2011. We discovered that the current FAOSTAT statistics (values from
2014) are much smaller than the dot sampling survey estimates of the growing area.
Fig 1 shows the comparisons of FAOSTAT statistics and the dot sampling survey
estimates for the three countries in 2014. Fig.2 compares the dot sampling survey estimates with
time series statistics of FAOSTAT on the harvested area of oil palm in recent years. As can be
seen in the figure, although FAO's statistics show a rapid increase, the estimates are lower than
that of the dot sampling survey method, which shows the growing area in real time on Google
Earth. Fig.3 shows three types of oil palm areas; the blue bars show growing area based on the
dot sampling survey method (2017), green bars are the planted or harvested area (2014) according
to each country's website, and orange bars are the harvested area (2014) from the FAOSTAT
website by country. According to the figures, the government statistics of each country yield larger
estimates than FAOSTAT statistics; however, they are still lower than dot sampling survey
estimates. It is unknown why FAOSTAT statistics and the government statistics of each country
are so different. We now compare the dot sampling survey value to the statistical value of FAOSTAT.

2
Fig.1: Comparison of the dot sampling survey estimate and
FAOSTAT statistics (2014)
Fig.2: Comparison of the dot sampling survey estimate and
long-term statistics of FAOSTAT
0
200
400
600
800
1000
1200
1400
0
2,000
4,000
6,000
8,000
10,000
12,000
14,000
19
61
19
64
19
67
19
70
19
73
19
76
19
79
1982
19
85
19
88
19
91
19
94
19
97
20
00
20
03
20
06
20
09
20
12
Do
t es
tim
ate
Indonesia Malaysia Thailand
1000ha
Indonedia and Malaysia
100ha
Thailand
0
2,000
4,000
6,000
8,000
10,000
12,000
14,000
Indonesia Malaysia Thailand
Dot sampling method(growing area)(ha)
FAOSTAT(harvested area)(ha)
1000ha

3
Fig.3: Comparison of the dot sampling survey estimates, each government’s
estimate and FAOSTAT statistics
Note: The dot sampling survey value in this figure is the growing area and the statistical value of FAOSTAT is the
harvested area. The published figures of Malaysia and Thailand are for planted areas, and it is unclear whether
the statistical value for Indonesia pertains to planted or harvested areas. The statistics of FAOSTAT and
Thailand are for harvested area.
2. Method of the Survey
To estimate oil palm area using the survey, a sampling survey was designed for a sample
size of 1,000; however, the sampling survey was designed for a sample size of 200, to be repeated
five times independently, while changing the sample spots for convenience in conducting the
survey. The results of the five surveys changing sample points (sampling) were summarized in
November 2017. This method also follows the practical rule of thumb for calculating a given area
three times when using a dot-grid plate or planimeter. Next, we compared the results with the
FAOSTAT statistics. The procedure for each survey and sample design with 200 observations was
as follows:
Step 1: A given sample of 200 was set on Google Earth, using Excel macro programs for the
survey.
0
2,000
4,000
6,000
8,000
10,000
12,000
14,000
Indonesia Malaysia Thailand
Dot sampling method(growing area)
Government statistics
FAOSTAT(harvested area)
1000ha
4
Step 2: The land use survey, using the attribute survey method, was applied to the sample
dots on Google Earth, as a preparatory survey on the growing area of oil palm. Four
categories (arable land, permanent crops, permanent pastures-meadows, and others (non-
cultivated)) were set to conduct the survey (Note: It was possible to skip step 2, if we
verify directly whether the sample dots are on the growing area of oil palm point. The
reason for setting these four categories seems to be extra work; however, its purpose was
further verifying the area of arable land, permanent crops, and permanent pasture-
meadow, although the results are not shown here).
Step 3: The growing area of oil palm was verified one-by-one with the sample dots, which
were identified as permanent crops in the preparatory survey.
Step 4: The sample dots that indicated a growing area of oil palm were counted.
Step 5: The above survey process was repeated five times, changing the locations of sample
dots.
Step 6: The total number of sample dots that indicated a growing area of oil palm was
computed and divided by the total number of sample dots in the surveys of the country,
to estimate the share of the growing area of oil palm.
Step 7: Finally, the growing area of oil palm (�̂�) was estimated by multiplying the share of
oil palm (𝑛𝑜𝑖𝑙 𝑝𝑎𝑙𝑚
𝑛𝑡𝑜𝑡𝑎𝑙⁄ = �̂�) and country land area (W). The formula is shown below.
�̂� = (𝑛𝑜𝑖𝑙 𝑝𝑎𝑙𝑚
𝑛𝑡𝑜𝑡𝑎𝑙⁄ ) × W = �̂�𝑊
Note: For the actual dot sampling survey, growing area should be estimated by conducting the field survey at the
dot sample points on the ground. For the results of this study, growing area is estimated using Google Earth,
without a field survey.
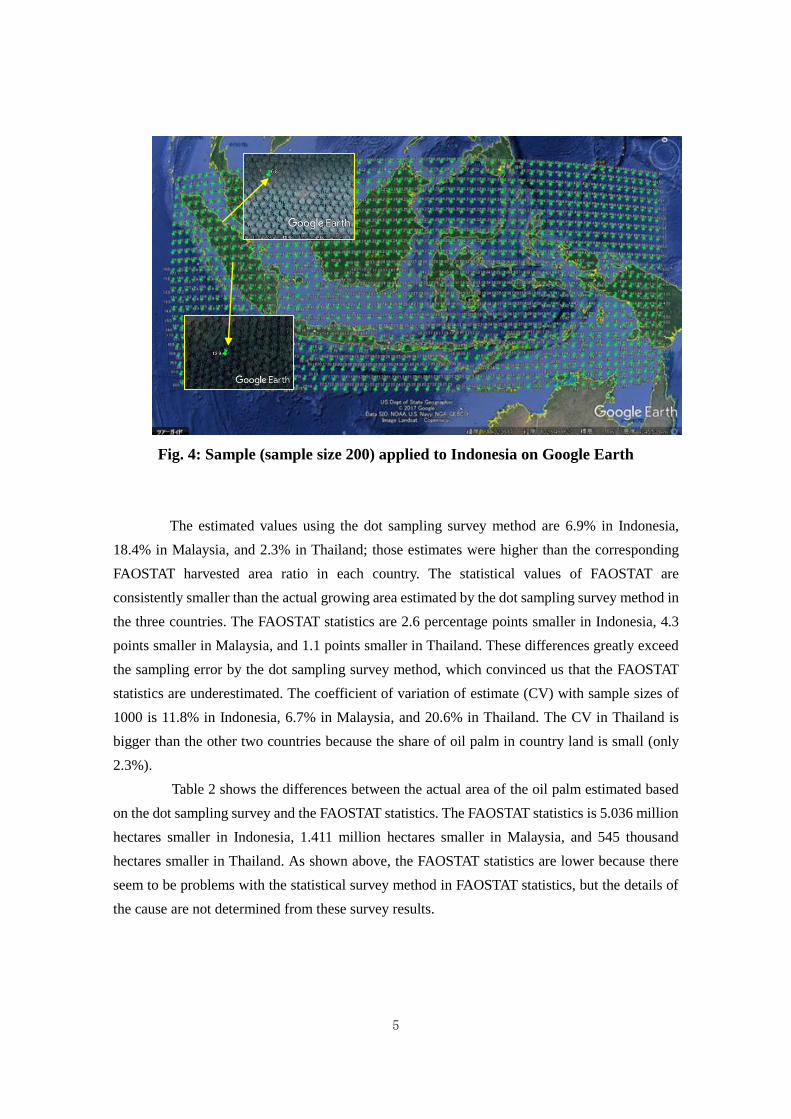
Fig.4 is an additional reference that shows an example of the sample (size 200) for
Indonesia on Google Earth. The sample dots were assigned an identifier and applied
systematically. By zooming in at each sample spot, the attribution of land use can be clearly
judged. About 14 sample dots on average included an oil palm farm in Indonesia.
3. Results of the survey
3.1 Comparison of the results of the dot sampling survey and the FAOSTAT statistics
To compare the estimated values from the dot sampling survey on oil palm area to the
FAOSTAT values by country, we first calculated the respective ratios of the survey results to the
country land area and organized them as shown in Table 1.
5
Fig. 4: Sample (sample size 200) applied to Indonesia on Google Earth
The estimated values using the dot sampling survey method are 6.9% in Indonesia,
18.4% in Malaysia, and 2.3% in Thailand; those estimates were higher than the corresponding
FAOSTAT harvested area ratio in each country. The statistical values of FAOSTAT are
consistently smaller than the actual growing area estimated by the dot sampling survey method in
the three countries. The FAOSTAT statistics are 2.6 percentage points smaller in Indonesia, 4.3
points smaller in Malaysia, and 1.1 points smaller in Thailand. These differences greatly exceed
the sampling error by the dot sampling survey method, which convinced us that the FAOSTAT
statistics are underestimated. The coefficient of variation of estimate (CV) with sample sizes of
1000 is 11.8% in Indonesia, 6.7% in Malaysia, and 20.6% in Thailand. The CV in Thailand is
bigger than the other two countries because the share of oil palm in country land is small (only
2.3%).
Table 2 shows the differences between the actual area of the oil palm estimated based
on the dot sampling survey and the FAOSTAT statistics. The FAOSTAT statistics is 5.036 million
hectares smaller in Indonesia, 1.411 million hectares smaller in Malaysia, and 545 thousand
hectares smaller in Thailand. As shown above, the FAOSTAT statistics are lower because there
seem to be problems with the statistical survey method in FAOSTAT statistics, but the details of
the cause are not determined from these survey results.

6
Table 1: Comparison of the results of the dot sampling survey and
FAOSTAT statistics (ratio)
Note: The sampling error was calculated by √𝑝𝑞/𝑛 .
Table 2: Comparison of the dot sampling survey estimate of oil palm area and
FAOSTAT statistics (real number)
3.2 Precautions for comparison of the data
Strictly speaking, a field survey should be conducted to verify the growing area of oil
palm at sites indicated by the sample dots. However, it is impossible to visit all sample sites in
Dot sampling
method(growi
ng area)(%)
FAOSTAT
(harvested
area)(%)
Difference
(point)
Indonesia 6.9 4.3 -2.6
Malaysia 18.4 14.2 -4.3
Thailand 2.3 1.3 -1.1
Planed sample
size
Real sample
size
Indonesia 1,000 973 0.81 11.8
Malaysia 1,000 988 1.23 6.7
Thailand 1,000 993 0.48 20.6
Comparison of the dot sampling value and
FAO value
Sample size Sampling
error
(point)
C.V
(%)
Dot sampling
method(growing
area)(ha)
FAOSTAT
(harvested area)
(ha)
Difference(ha)Dot estimate /
FAOSTAT
Indonesia 13,185,621 8,150,000 -5,035,621 1.6
Malaysia 6,099,858 4,689,321 -1,410,537 1.3
Thailand 1,188,495 643,811 -544,684 1.8

7
those countries from Japan. Fortunately, in this dot sampling survey, it is quite easy to determine
from Google Earth that oil palm is growing at a given sample site. As oil palm has a special crown
shape, alleviating the need to conduct a field survey. Further precautions that should be considered
when comparing the data used here are listed below:
(a) Definition of harvested area and growing area
The FAOSTAT statistics of oil palm area is regarded as the harvested area. On the other
hand, the estimated value by the dot sampling survey method is the growing area (planted area).
It is impossible to determine the harvested area, based on FAOSTAT’s definition of “harvested
area,” using the dot sampling survey method and Google Earth. Therefore, there is a conceptual
difference in definition between both surveys. According to data from the Thai government, the
planted area of oil palm is about 1.20 times larger than the harvested area; however, even
considering this factor, the difference in the FAOSTAT statistics and the dot sampling survey
estimates in each country are still large, especially in Indonesia and Thailand.
(b) How to distinguish oil palm from other crops on Google Earth
In general, it is difficult to strictly conduct agricultural land use surveys (arable land,
permanent crops, permanent pastures and permanent meadows and pastures, and others (non-
cultivated), etc.) only using Google Earth if the resolution of the maps is low, or if the reading
technique of operators is still immature. As such, the results could be unreliable. However, in the
three countries targeted here, oil palm trees are often in clear areas. This makes them readily
detectable from the Google Earth map images, and the unique shape of the crown ensures they
can be distinguished clearly from other trees. Therefore, an area survey of oil palm can easily be
performed with precision, and without non-sampling errors such as misreading the attribution.
The picture below shows an oil palm farm on Google Earth.
(c) How to deal with farm roads, dykes, etc., in an oil palm farm
It is unknown whether statistical values of FAOSTAT, for example, include the roads
and dykes in oil palm farms (such as plantations); however, in the dot sampling survey, it can
estimate a pure planted or growing area excluding the area taken up by roads or dykes in the farms.
(d) How to deal with the situation when other permanent crops are growing in the oil palm
farm
Other permanent crops are sometimes cultivated in the same lot (such as mixed
cultivation) with oil palm; however, in this case, if an area indicated by sample dots does not
consist of oil palm, it is not counted as an oil palm growing area.

8
Fig. 5: Image of oil palm growing farm on Google Earth (Malaysia)
Note: The oil palm is distinctive in its crown shape and can be clearly distinguished from other tree species.
(e) How to deal with the situation when the maps on Google Earth are unclear (low resolution)
If the sample dots area lies in a low-resolution area on Google Earth, it is necessary to
refer to the archived image using the Google Earth function, or by examining land use around the
sample dots; however, those cases were few.
(f) Time lag issues
Old Google Earth maps cause errors due to time lag. However, in recent years, Google
Earth maps have been updated frequently, and maps for most areas surveyed in this study were
updated in the 2010s. Therefore, there does not seem to be a serious time lag problem even when
comparing the results of the dot sampling survey in this time period (2017) with the FAOSTAT
statistics in 2014.
4. Conclusion
We compared the harvested area of oil palm in Indonesia, Malaysia, and Thailand, as
per FAOSTAT statistics, with the estimates of the dot sampling trial survey conducted in

9
November 2017, using Google Earth. The results suggest that the FAOSTAT statistics are
underestimated. From the FAOSTAT statistics, the area of Indonesia might be 5.0 million hectares
smaller than our dot sampling survey estimate, and that of Malaysia might be 1.4 million hectares
smaller than our survey estimate, demonstrating the magnitude of difference. Although the results
of this survey were obtained through deskwork using the dot sampling survey method and Google
Earth, without field surveys, we believe that our methodology for statistical estimates is
adequately reliable. A key factor supporting the accuracy of this survey is the recognizable special
shape of the crown of the oil palm, making it readily distinguishable from other tree types on
Google Earth maps. The reliability of the survey could be improved with a larger sample size and
better map resolution.
Finally, this short report is written with the intent to be shared among stakeholders who
are interested in agricultural statistics, especially crop area surveys. We hope this report
contributes to improving agricultural statistics. We welcome suggestions on this first dot sampling
survey of growing areas of oil palm using the dot sampling method.
Acknowledgements
I deeply appreciate the advice for summarizing this report from associate Professor
Tetsuji Senda of Kyoto University and the useful suggestions for improving this report from Mr.
Kenji Kamikura, who was a senior statistician at the Ministry of Agriculture, Forestry and
Fisheries, Japan (MAFF). Furthermore, we would like to thank Editage (www.editage.jp) for
English language editing.
It is a matter of great honor that this small report is to be printed as a paper in the
working paper series of the Academic Center for Computing and Media Studies of Kyoto
University.
Glossary
Attribute survey
The attribute survey investigates only inclusion in predefined categories, in contrast to the
variable survey, which measures the amount in a category. When using this method, it is not
necessary to measure the area at sample points, but only identify the category. The dot
10
sampling method adopts this method; in this survey, we investigated only whether oil palm
is growing at sample points on Google Earth.
Dot sampling method
The dot sampling method was developed to estimate the area of land use using Google Earth.
The theory comes from the attribute survey. It has long been known as a sampling survey
method using maps. The dot sample survey method is able to extract sample points on Google
Earth directly at random. Therefore, it is not necessary to organize the population for a
sampling survey, and it is also considered an excellent survey method because it is possible
to conduct land use surveys on Google Earth. In this system, the sample points are designed
to be determined by a combination of latitude and longitude, and arranged in a dot-grid
pattern. The following report on the FAO website explains the method:
http://www.fao.org/fileadmin/templates/rap/files/Project/Expert_Meeting__17Feb2014_/P1-
1_Dot_sampling_method_for_planted_area_estimation_using_Google_earth___land_use_survey__
FAO_RAP_17_Feb_2014.pdf
Dyke
Generally, it is a portion of embankment or similar structure that surrounds paddy fields so
that the water used to flow into the paddy does not leak outside, but it can also be used to
identify the boundary of the fields (lots). In this report, it is used to refer to the boundary of
the growing area.
FAO
FAO (United Nations Food and Agriculture Organization) is a specialized agency of the
United Nations, working on the development of the world's agriculture, forestry and fishery
industry, and rural development. The FAO consists of 196 member countries (including two
sub-member countries) and the EU (European Union), with headquarters in Rome, Italy.
FAOSTAT
FAOSTAT is the largest and most comprehensive online statistical database related to the
food and agriculture, forestry and fishery industry operated by the FAO (United Nations Food
and Agriculture Organization).
http://www.fao.org/faostat/en/#data
Growing area
See “Planted area.”
Google Earth (Pro)
Google Earth is a computer program, provided by Google, which renders a representation
of the Earth based on satellite imagery combining satellite images, aerial photography, and
GIS data, readily usable by anyone. The dot sampling method uses Google Earth Pro,
which integrated with Google Earth in 2017, and added significant functionality for

11
manipulating GIS data. In this report, we use “Google Earth” referring, actually, to Google
Earth Pro.
https://www.google.com/earth/download/gep/agree.html
Harvested area
See “Planted area.”
Oil palm
Oil palm is a type of palm that produces palm oil, which is now the most widely used
vegetable oil in the world. Of the total 200 million tons of vegetable oils and fats produced,
the production of palm oil accounts for 59.2 million tons (2014), nearly 30%.
Planimeter
Planimeter is a measuring instrument used to calculate the area of a figure on a map.
Planted area (Harvested area, Growing area)
Planted area is the crop area intended for harvesting. Harvested area is the crop area that has
actually been harvested. In general, harvested area is smaller than planted area owing to
disaster, etc. The growing area is where oil palms are grown, regardless of intent to harvest.
Areas for permanent crops such as oil palm, which is not harvested for reasons such as
abandoned cultivation, could also be considered growing area. It is very difficult to
distinguish between harvested area and growing area on Google Earth without an actual field
survey. Therefore, conceptually, growing area could be larger than planted area or harvested
area in our survey.
References
Team Dot Sampling, MAFF Japan: The Dot Sampling Method, 29 March 2016
KAMIKURA, Kenji: What you can do with the Dot Sampling Method using Google Earth,
Fifth meeting of the Regional Steering Committee for Asia and the Pacific for the Global
Strategy to Improve Agricultural and Rural Statistics Bangkok, Thailand, 9 December 2015
KAMIKURA, Kenji: Package of Agricultural Production Survey, AfricaRice, Cotonue, Benin,
March 2013
(https://wpqr4.adb.org/LotusQuickr/agstatap/Main.nsf/0/6716E47F1793360B48257B5D00
2EC9F4/$file/Package%20of %20Agricultural%20Production%20Survey.pdf)
KAMIKURA, Kenji: Estimation of Planted Area using the Dot Sampling Method, FAO APCAS
24, October 2012
(http://www.fao.org/fileadmin/templates/ess/ess_test_folder/Workshops_Event
s/APCAS_24/Paper_after/APCAS-12-21_Planted_Area_using_Dot_Sampling.pdf)

12
JINGUJI, Issei: Dot Sampling Method for area estimation, CROP MONITORING FOR
IMPROVED FOOD SECURITY, FAO & ADB, 2014
(http://www.fao.org/fileadmin/templates/rap/files/Project/Expert_Meeting__17F
eb2014_/P11_Dot_sampling_method_for_planted_area_estimation_using_Google_earth_
__land_use_survey__FAO_RAP_17_Feb_2014.pdf)
JINGUJI, Issei: How to Develop Master Sampling Frames using Dot Sampling Method and
Google earth, December 2012
(http://www.fao.org/fileadmin/templates/ess/global_strategy/PPTs/MSF_PPTs/
5.MSF_Dot_sampling_method_on_Google_Earth_Jinguji.pdf)
YATES, Frank: Sampling Methods for Censuses and Surveys, Charles Griffin & Co. Ltd., 1949