title cover annual report 2012 - home - sanghar … · human resource & remuneration ......
TRANSCRIPT


Statement of Value Addition and Its Distribution
2012 2011 Value Addition: (Rs. ‘000) % (Rs. ‘000) %
Turnover Gross 3,222,158 1,596,539
Other Income 3,698 7,423
3,225,856 1,603,962
Sugarcane Procurement Expenses 1,929,052 2,521,074
Direct Costs & Services 742,574 (1,364,321)
2,671,626 1,156,753
554,230 447,209
Value Distribution:
Distributed as followsTo Employees as:
– Remuneration 126,462 22.82 118,513 26.50
– Worker's profit participation fund — — 3,456 0.77
126,462 121,969
To Government:
– Sales Tax, FED & SED 216,897 39.13 98,242 21.97
– Income Tax 83,773 15.12 38,738 8.66
– Deferred Tax (10,369) (1.87) 668 0.15
– Cess & Fees 7,853 1.42 6,449 1.44
298,154 144,097
To Providers of Capital as:
– Finance Cost 93,952 16.95 94,682 21.17
– Dividend — — 17,919 3.20
93,952 112,601
Retained in the Business as:
– Depreciation 42,216 7.62 30,783 6.88
– (Loss)/profit for the year (6,554) (1.18) 37,759 8.44
35,662 68,542
554,230 100.00 447,209 100.00
15

Statement of Compliance with the Code of Corporate GovernanceName of company: SANGHAR SUGAR MILLS LIMITEDYear ended: September 30, 2012This statement is being presented to comply with the Code of Corporate Governance (CCG) contained in listingregulations of Karachi and Lahore Stock Exchanges for the purpose of establishing a framework of good governance,whereby a listed company is managed in compliance with the best practices of corporate governance.The Company has applied the principles contained in the CCG in the following manner:1. The Company encourages representation of independent, non-executive directors and directors representing
minority interests on its Board of Directors. At present the Board includes: Category Name(i) Independent Directors 1. Mr. Shahid Aziz
2. Mr. Irshad Husain
(ii) Executive Directors 1. Haji Khuda Bux Rajar2. Mr. Mohammad Aslam3. Mr. Gul Mohammad
(iii) Non-Executive Directors 1. Mr. Jam Mitha Khan2. Mr. Ghulam Dastagir Rajar3. Mr. Qazi Shamsuddin
The independent directors meet the criteria of independence under clause (i) (b) of the CCG. The condition ofClause (i) (b) of the CCG will be applicable after election of next Board of Directors of the Company due inNovember 2014, as provided under proviso of the clause (vi) of the CCG.
2. The directors have confirmed that none of them is serving as a director on more than seven listed companies,including this Company.
3. All the resident directors of the Company are registered as taxpayers and none of them has defaulted in paymentof any loan to a banking company, a DFI or an NBFI or, being a member of a stock exchange, has been declaredas a defaulter by that stock exchange.
4. No casual vacancy occurred on the Board during the year.5. The Company has prepared a “Code of Conduct” and has ensured that appropriate steps have been taken to
disseminate it throughout the Company along with its supporting policies and procedures.6. The Board has developed a vision/mission statement, overall corporate strategy and significant policies of the
Company. A complete record of particulars of significant policies along with the dates on which they wereapproved or amended has been maintained.
7. All the powers of the Board have been duly exercised and decisions on material transactions, including appointment and determination of remuneration and terms and conditions of employment of the ChiefExecutive Officer, other executive and non-executive directors, have been taken by the Board.
8. The meetings of the Board were presided over by the Chairman and, in his absence, by a director elected by theBoard for this purpose and the Board met at least once in every quarter. Written notices of the Board meetings,along with agenda and working papers, were circulated at least seven days before the meetings. The minutes ofthe meetings were appropriately recorded and circulated.
9. The Board has been provided information and relevant details to acquaint them with the Code, and other applicable laws. They are aware of their duties, responsibilities and regulations as they are on the Board since last manyyears. One Director is exempted from the requirement of directors’ training program as provided in the CCG.
10. The Board has already ratified appointment of CFO, Company Secretary and Head of Internal Audit, includingtheir remuneration and terms and conditions of employment.
11. The Directors’ Report for this year has been prepared in compliance with the requirements of the CCG and fullydescribes the salient matters required to be disclosed.
12. The Financial Statements of the Company were duly endorsed by Chief Executive Officer and CFO beforeapproval of the Board.
13. The Directors, Chief Executive Officer and Executives do not hold any interest in the shares of the Companyother than that disclosed in the pattern of shareholding.
14. The Company has complied with all the corporate and financial reporting requirements of the CCG.15. The Board has already formed the Audit Committee and now reconstituted it keeping in view the requirement of
the CCG. It comprises 03 members, of whom 02 are non-executive directors and one is independent director and the condition of independent director as the Chairman of the Committee under clause 1(b) of the CCG will beapplicable after election of next Board of Directors of the Company as provided under proviso of clause (vi) of theCCG.
16
16. The meetings of the Audit Committee were held at least once every quarter prior to approval of interim and finalresults of the Company and as required by the CCG. The terms of reference of the Committee have been formedand advised to the Committee for compliance.
17. The Board has formed a Human Resource & Remuneration Committee. It comprises 03 members, of whom 01 is independent director and 02 are non-executive directors including the Chairman of the HR & R Committee.
18. The Board has set up an effective internal audit function.19. The statutory auditors of the Company have confirmed that they have been given a satisfactory rating under the
quality control review program of the Institute of Chartered Accountants of Pakistan (ICAP), that they or any ofthe partners of the firm, their spouses and minor children do not hold shares of the company and that the firm andall its partners are in compliance with International Federation of Accountants (IFAC) guidelines on code of ethics as adopted by the ICAP.
20. The statutory auditors or the persons associated with them have not been appointed to provide other servicesexcept in accordance with the listing regulations and the auditors have confirmed that they have observed IFACguidelines in this regard.
21. The ‘closed period’, prior to the announcement of interim/final results, and business decisions, which may materially affect the market price of Company’s securities, was determined and intimated to directors,employees and Karachi & Lahore Stock Exchanges.
22. Material/price sensitive information has been disseminated among all market participants at once throughKarachi and Lahore Stock Exchanges.
23. We confirm that all other material principles enshrined in the CCG have been complied with.
For and On Behalf of Board of Directors
Karachi: January 05, 2013 Chief Executive Officer
Review Report to the Members on Statement of ComplianceWith Best Practices of Code of Corporate GovernanceWe have reviewed the Statement of Compliance with the best practices contained in the Code of Corporate Governancefor the year ended September 30, 2012 prepared by the Board of Directors of Sanghar Sugar Mills Limited (“theCompany”) to comply with the Listing Regulations of the Karachi and Lahore Stock Exchanges, where the Company islisted.
The responsibility for compliance with the Code of Corporate Governance is that of the Board of Directors of theCompany. Our responsibility is to review, to the extent where such compliance can be objectively verified, whether theStatement of Compliance reflects the status of the Company’s compliance with the provisions of the Code of CorporateGovernance and report if it does not. A review is limited primarily to inquiries of the Company’s personnel and review ofvarious documents prepared by the Company to comply with the Code.
As part of our audit of financial statements, we are required to obtain an understanding of the accounting and internalcontrol systems sufficient to plan the audit and develop an effective audit approach. We have not carried out any specialreview of the internal control system to enable us to express an opinion as to whether the Board’s statement on internalcontrol covers all controls and the effectiveness of such internal controls.
Further, Sub – Regulation (x) of Listing Regulation no. 35 of Karachi Stock Exchange Limited requires the Company toplace before the Board of Directors for their consideration and approval related party transactions distinguishingbetween transactions carried out on terms equivalent to those that prevail in arm’s length transactions and transactionswhich are not executed at arm’s length price recording proper justification for using such alternate pricing mechanism.Further, all such transactions are also required to be separately placed before the audit committee. We are only requiredto check the approval of the related party transactions by the Board of Directors and placement of such transactionsbefore the audit committee. We have not carried out procedures to determine whether the related party transactionswere undertaken at arm’s length price or not.
Based on our review, nothing has come to our attention which causes us to believe that the Statement of Compliancedoes not appropriately reflect the Company’s compliance, in all material respects, with the best practices contained inthe Code of Corporate Governance, as applicable to the Company for the year ended September 30, 2012.
Hyder Bhimji & Co.Chartered Accountants
Karachi:January 05, 2013 Engagement Partner: Mohammad Hanif Razzak
17
Auditor’s Report to the Members
We have audited the annexed Balance Sheet of SANGHAR SUGAR MILLS LIMITED (“the Company”) as at September 30, 2012 and the related Profit and Loss Account, Statement of Comprehensive Income, CashFlow Statement and Statement of Changes in Equity together with the notes forming part thereof, for theyear then ended and we state that we have obtained all the information and explanations which, to the bestof our knowledge and belief, were necessary for the purposes of our audit.
It is the responsibility of the Company’s management to establish and maintain a system of internal control,and prepare and present the above said statements in conformity with the approved accounting standardsand the requirements of the Companies Ordinance, 1984. Our responsibility is to express an opinion onthese statements based on our audit.
We conducted our audit in accordance with the auditing standards as applicable in Pakistan. Thesestandards require that we plan and perform the audit to obtain reasonable assurance about whether theabove said statements are free of any material misstatement. An audit includes examining, on a test basis,evidence supporting the amounts and disclosures in the above said statements. An audit also includesassessing the accounting policies and significant estimates made by management, as well as, evaluatingthe overall presentation of the above said statements. We believe that our audit provides a reasonable basisfor our opinion and, after due verification, we report that:
(a) in our opinion, proper books of accounts have been kept by the Company as required by theCompanies Ordinance, 1984;
(b) in our opinion:
i) the Balance Sheet and Profit and Loss Account together with the notes thereon have beendrawn up in conformity with the Companies Ordinance, 1984, and are in agreement with thebooks of account and are further in accordance with accounting policies consistently applied;
ii) the expenditure incurred during the year was for the purpose of the Company’s business; and
iii) the business conducted, investments made and the expenditure incurred during the year werein accordance with the objects of the Company;
(c) in our opinion and to the best of our information and according to the explanations given to us, theBalance Sheet, Profit and Loss Account, Statement of Comprehensive Income, Cash FlowStatement and Statement of Changes in Equity together with the notes forming part thereof conformwith approved accounting standards as applicable in Pakistan, and give the information required bythe Companies Ordinance, 1984, in the manner so required and respectively give a true and fair viewof the state of the Company's affairs as at September 30, 2012 and of the loss, total comprehensiveincome, its cash flows and changes in equity for the year then ended; and
(d) in our opinion, no Zakat was deductible at source under the Zakat and Ushr Ordinance, 1980.
Hyder Bhimji & Co.Chartered Accountants
Karachi:January 05, 2013 Engagement Partner: Mohammad Hanif Razzak
18

Balance SheetAs at September 30, 2012
Sep 30 Sep 30 2012 2011
ASSETS Note (Rupees in ‘000)NON-CURRENT ASSETSProperty, plant and equipment 6 747,116 754,005 Long term deposits 7 36,369 36,396
783,485 790,401 CURRENT ASSETS Stores, spare parts and loose tools 8 50,204 45,906 Stock-in-trade 9 499,923 1,355,937 Trade debts 10 317,421 12,425 Loans and advances 11 39,097 42,060 Short term prepayments 12 994 1,552 Income tax refundable- Payments less provision 22,128 — Cash and bank balances 13 5,341 13,638
935,108 1,471,518 TOTAL ASSETS 1,718,593 2,261,919
EQUITY AND LIABILITIES SHARE CAPITAL AND RESERVES Authorized capital 20,000,000 shares of Rs.10 each 200,000 200,000
Issued, subscribed and paid up capital 14 119,460 119,460 Unappropriated profit 211,238 208,989
330,698 328,449 SURPLUS ON REVALUATION OF FIXED ASSETS 15 160,241 169,043 NON CURRENT LIABILITIES Long term financing 16 — — Liabilities against asset subject to finance lease 17 64,908 85,089 Deferred liabilities 18 216,974 216,247
281,882 301,336 CURRENT LIABILITIES Trade and other payables 19 475,558 1,004,548 Accrued mark-up 20 20,176 19,595 Short term borrowings 21 428,420 355,274 Current portion of long term financing & liabilities against asset subject to finance lease 22 21,618 38,527 Provision for taxation - Provision less payments — 45,147
945,772 1,463,091
CONTINGENCIES AND COMMITMENTS 23TOTAL EQUITY AND LIABILITIES 1,718,593 2,261,919
The annexed notes from 1 to 41 form an integral part of these financial statements.
Chief Executive Director
19
Profit and Loss AccountFor the year ended September 30, 2012
Sep 30 Sep 30 2012 2011
Note (Rupees in ‘000)
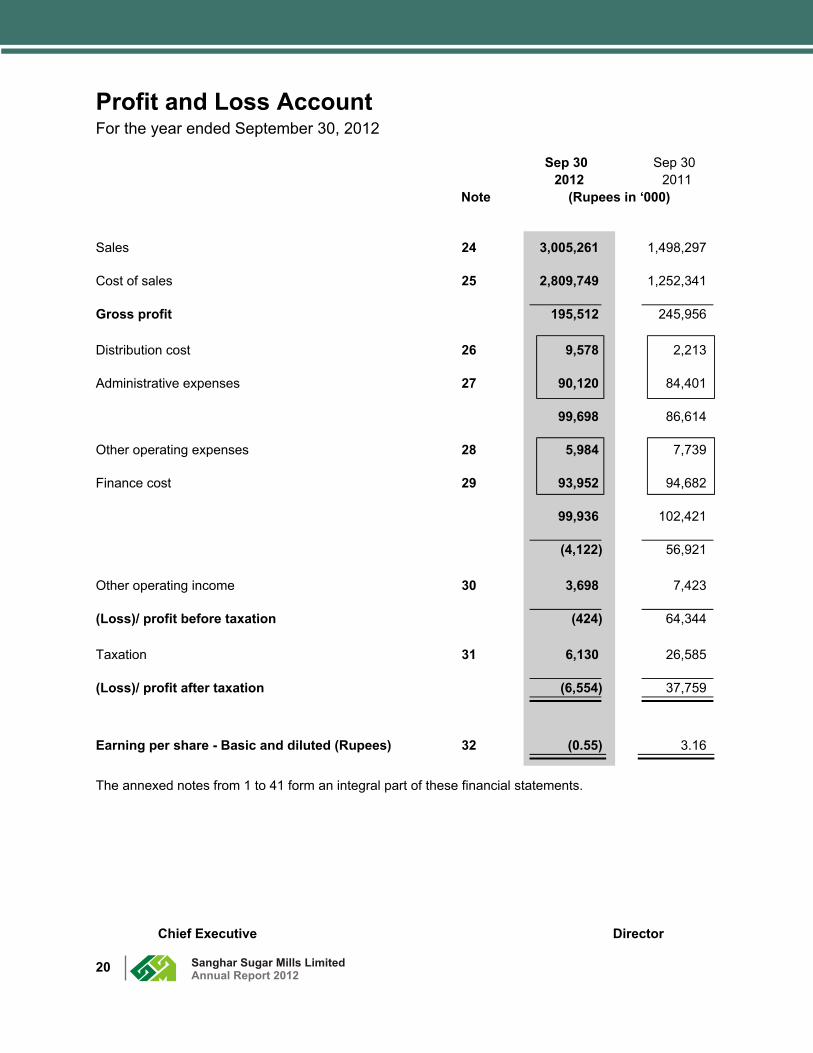
Sales 24 3,005,261 1,498,297
Cost of sales 25 2,809,749 1,252,341
Gross profit 195,512 245,956
Distribution cost 26 9,578 2,213
Administrative expenses 27 90,120 84,401
99,698 86,614
Other operating expenses 28 5,984 7,739
Finance cost 29 93,952 94,682
99,936 102,421
(4,122) 56,921
Other operating income 30 3,698 7,423
(Loss)/ profit before taxation (424) 64,344
Taxation 31 6,130 26,585
(Loss)/ profit after taxation (6,554) 37,759
Earning per share - Basic and diluted (Rupees) 32 (0.55) 3.16
The annexed notes from 1 to 41 form an integral part of these financial statements.
Chief Executive Director
20

Statement of Comprehensive Income For the year ended September 30, 2012
Sep 30 Sep 30 2012 2011
(Rupees in ‘000)
(Loss)/profit after taxation (6,554) 37,759
Other Comprehensive Income
Incremental depreciation charged on surplus on revaluation of fixed assets net of deferred tax 8,803 3,147
Total Other Comprehensive Income 8,803 3,147
Total Comprehensive Income 2,249 40,906
The annexed notes from 1 to 41 form an integral part of these financial statements.
Chief Executive Director
21

Cash Flow StatementFor the year ended September 30, 2012
Sep 30 Sep 30 2012 2011
Note (Rupees in ‘000)
CASH FLOW FROM OPERATING ACTIVITIES
Cash generated from Operations 33 169,316 (69,641)
Employees benefits paid (2,266) (1,392)
Finance cost paid (93,371) (86,008)
Taxes paid (83,773) (38,738)
Net cash outflow from operating activities (10,094) (195,779)
CASH FLOW FROM INVESTING ACTIVITIES
Fixed capital expenditure (35,624) (141,068)
Proceeds from disposal of fixed assets 1,365 728
Net cash outflow from investing activities (34,259) (140,340)
CASH FLOW FROM FINANCING ACTIVITIES
Proceeds from sale and lease back transaction — 72,500
Decrease of Long term deposits — 1,649
Repayment of liabilities against assets subject to finance lease (13,931) (7,202)
Dividend Paid — (17,919)
Repayment of long term financing (23,159) (21,623)
Net cash (out flow)/inflow from financing activities (37,090) 27,405
Net decrease in cash and cash equivalents (81,443) (308,714)
Cash and cash equivalents at beginning of the year (341,636) (32,922)
Cash and cash equivalents at end of the year 34 (423,079) (341,636)
The annexed notes from 1 to 41 form an integral part of these financial statements.
Chief Executive Director
22

Statement of Changes in EquityFor the year ended September 30, 2012
Share Unappropriated Particulars Capital profit Total .......................... (Rs in '000) ...........................
Balance as at October 01, 2010 119,460 186,002 305,462
Total Comprehensive Income for the year
Net profit after tax for the year ended September 30, 2011 — 37,759 37,759
Incremental depreciation charged on surplus on revaluation of fixed assets net of deferred tax — 3,147 3,147
— 40,906 40,906
Transaction with owners
Final Dividend for the year ended September 30, 2010 — (17,919) (17,919)
Balance as at September 30, 2011 119,460 208,989 328,449
Total Comprehensive Income for the year
Loss after tax for the year ended September 30, 2012 — (6,554) (6,554)
Incremental depreciation charged on surplus on revaluation of fixed assets net of deferred tax — 8,803 8,803
— 2,249 2,249
Balance as at September 30, 2012 119,460 211,238 330,698
The annexed notes from 1 to 41 form an integral part of these financial statements.
Chief Executive Director
23

Notes to the Financial StatementsFor the year ended September 30, 2012
1 COMPANY AND ITS OPERATIONSThe Company is a public limited Company incorporated in 1986 in Pakistan under the CompaniesOrdinance, 1984. Its shares are quoted on Karachi and Lahore Stock Exchanges. The Company isprincipally engaged in the manufacture and sale of sugar and its by-products i.e. molasses andbagasse. The registered office of the Company is situated at 101, 1st Floor, Ocean Centre, TalpurRoad, Karachi and its manufacturing facilities are located in district Sanghar, Sindh.
2 BASIS OF PREPARATION2.1 Statement of Compliance
These financial statements have been prepared in accordance with the approved accountingstandards, as applicable in Pakistan. Approved accounting standards comprise of such InternationalFinancial Reporting Standards (IFRS) issued by the International Accounting Standards Board(IASB) as are notified under the Companies Ordinance, 1984 (the Ordinance), provisions anddirectives issued under the Ordinance. In case requirements differ, the provisions or directives of theOrdinance shall prevail.
2.2 Accounting ConventionThese financial statements have been prepared under the historical cost convention without anyadjustments for the effect of inflation or current values, except for, certain employees retirementbenefits that are based on actuarial valuation and items of property, plant and equipment which arecarried at revalued amounts.
3 STANDARDS, AMENDMENTS TO PUBLISHED APPROVED ACCOUNTING STANDARD ANDINTERPRETATIONS
3.1 New and amended standards and interpretations became effectiveDuring the year, the following amendments, interpretations and improvements to the accountingstandards became effective, but these are either irrelevant or do not have any significant effect on thecompany’s operations and financial statements except for additional disclosures, incorporated inthese financial statements:
IFRS 7 Financial Instruments: Disclosures - Amendments enhancing disclosures abouttransfer of financial assets.This amendment aims to promote transparency in the reporting of transfer transactionsand improve users’ understanding of the risk exposures relating to transfers of financialassets and the effect of those risks on an entity’s financial position, particularly thoseinvolving securitization of financial assets.
IAS 24 Related Party Disclosures (Revised)The revised standard clarifies and simplifies the definition of a related party and removesthe requirement for government-related entities to disclose details of all transactions withthe government and other government-related entities. The Company complies with therequirements of revised IAS.
IFRIC 14 Prepayments of a Minimum Funding Requirement (Amendment)The limit on a defined benefit asset, minimum funding requirements and their interaction.Without the amendments, entities are not permitted to recognize as an asset somevoluntary prepayments for minimum funding contributions. This was not intended whenIFRIC 14 was issued, and the amendments correct this.
24

3.2 Accounting and Financial Reporting Standards and Interpretations and Amendments topublished approved accounting standards issued but not yet effective for the current financial yearThe following revised standards, amendments and interpretations with respect to approvedaccounting standards as applicable in Pakistan and would be effective from the dates mentionedbelow against the respective standards or interpretations:
Standard, interpretation or amendment Effective dates(accounting period
beginning on or after)
IAS-12 Income Tax (Amendment)- Deferred Taxes: Recovery ofunderlying AssetsThe amendment provides an exception to the measurementprinciple in respect of investment property measured using thefair value model in accordance with IAS 40 Investment Property.
January 1, 2012
IAS-1 Presentation of Financial Statement- Amendments toPresentation of items of comprehensive incomeThe main change resulting from these amendment is arequirement for entities to group items presented in 'othercomprehensive income' (OCI) on the basis of whether they arepotentially reclassifiable to profit or loss subsequently(reclassification adjustments).
July 1, 2012
IFRS-7 Financial Instruments: Disclosures- Disclosures aboutoffsetting of financial assets and liabilitiesThe amendments to IFRS 7 contain new disclosurerequirements for financial assets and liabilities that are offset inthe statement of financial position or subject to master nettingagreement or similar arrangement.
January 1, 2013
IAS-19 Employee Benefits- Amended The amended IAS-19 require the actuarial gains and losses to be recognized immediately in other comprehensive income; thischange will remove the corridor method and eliminate the abilityfor entities to recognized all changes in the defined benefitobligation and in plan assets in profit or loss, which currentlyallows under IAS 19; and that the expected return on plan assetsrecognized in profit or loss is calculated based on the rate use todiscount the defined benefit obligation.
January 1, 2013
IFRIC -20 Stripping Costs in the Production Phase of a Surface MineThe costs of stripping activity to be accounted for in accordancewith the principles of IAS 2 Inventories to the extent that thebenefit from the stripping activity is realized in the form ofinventory produced.
January 1, 2013
IAS-32 Financial Instruments - Presentation- Offsetting FinancialAssets and Financial Liabilities - (Amendments)This amendment clarifies some of requirements for offsettingfinancial assets and financial liabilities on the balance sheet.
January 1, 2014
25

The Company expects that the adoption of the above revisions, amendments and interpretations ofthe standards will not have material affect on the Company's financial statements in the period of theinitial application.
Further, the following new standards have been issued by IASB which are yet to be notified by theSecurities and Exchange Commission of Pakistan for the purpose of applicability in Pakistan.
Standard or Interpretation IASB Effective dates(annual period
beginning on or after)
IFRS-9 Financial InstrumentsThis standard is the first step in the process to replace IAS 39,Financial instruments: recognition and measurement. IFRS 9introduces new requirements for classifying and measuringfinancial assets and is likely to affect the Company’s accountingfor its financial assets.
January 1, 2015
IFRS-10 Consolidated Financial StatementsThis standard outlines the requirements for the preparation andpresentation of consolidated financial statements, requiringentities to consolidate entities it controls. Control requiresexposure or rights to variable returns and the ability to affectthose returns through power over an investee.
January 1, 2013
IFRS-11 Joint ArrangementsThis standard outlines the accounting by entities that jointlycontrol an arrangement. Joint control involves the contractualagreed sharing of control and arrangements subject to jointcontrol are classified as either a joint venture (representing ashare of net assets and equity accounted) or a joint operation(representing rights to assets and obligations for liabilities,accounted for accordingly).
January 1, 2013
IFRS-12 Disclosure of Interest in Other EntitiesThis standard includes the disclosure requirement for all forms of interests in other entities, including joint arrangements,associates, special purpose vehicles and other off balance sheetvehicles.
January 1, 2013
IFRS-13 Fair Value MeasurementThis standard applies to IFRSs that require or permit fair valuemeasurements or disclosures and provide a single IFRS framework for measuring fair value and requires disclosures about fairvalue measurement. The standard defines fair value on the basis of an 'exit price' notion and uses 'a fair value hierarchy', whichresults in market-based, rather than entity-specificmeasurement.
January 1, 2013
4 Critical accounting estimates, judgments and assumptionsThe preparation of these financial statements in conformity with the approved accounting standardsrequires management to make judgments, estimates and assumptions that affects the application ofpolicies and reported amounts of assets and liabilities, income and expenses. The estimates andassociated assumptions are based on historical experience and various other factors that are
26

believed to be reasonable under that circumstances, the results of which form the basis of makingjudgment about carrying value of assets and liabilities that are not readily apparent from othersources. However, uncertainty about these assumptions and estimates could result in outcome thatrequire material adjustment to the carrying amount of the asset or liability affected in future periods.
The estimates and underlying assumptions are reviewed on an ongoing basis. Revision to accounting estimates are recognized in the period in which estimates are revised if the revision affects only thatperiod, or in the period of the revision and any future period affected.
Judgments made by the management in the application of approved accounting standards that havesignificant effect on the financial statements and estimates with a significant risk of materialadjustment in the next year are discussed in the ensuing paragraphs.
In the process of applying the accounting policies, management has made the following estimates,judgments and assumptions which are significant to the financial statements:
— Taxation :In making the estimate for income tax payable by the Company, the Company takes into account theapplicable tax laws and decision by the appellate authorities on certain issues in past.
Deferred tax assets are recognized for all unused tax losses and credits to the extent that it isprobable that the taxable profit will be available against such losses and credits can be utilized.Significant management judgment is required to determine the amount of deferred tax asset that canbe recognized, based upon the likely timing and level of future taxable profits together with future taxplanning strategies.
— Defined Benefit PlanCertain actuarial assumptions have been adopted as disclosed in these financial statements forvaluation of present value of defined benefit obligation and fair value of plan assets. Any changes inthese assumptions in future years might effect gains and losses in those years. The actuarialvaluation involves making assumptions about discount rates, expected rate of return on assets, future salary increases and mortality rates.
— Property, Plant and EquipmentThe Company's management determines the estimated useful lives and related depreciation chargefor its property, plant and equipment. The Company reviews the value of assets for possibleimpairment on financial year end. Any change in the estimate in the future years might effect thecarrying amounts of the respective items of property, plant and equipment with a corresponding affect on the depreciation charge and impairment.
— Stock in tradeStock in trade is carried at lower of the cost and net realizable value. The net realizable value isassessed by the Company having regard to the budgeted cost of completion , estimated selling priceand knowledge of recent comparable transactions.
— ContingenciesNature of contingencies is evaluated based on the element of issue involved, opinion of the legalcounsel and conclusion is accordingly reflected in the financial statements.
— Provision against trade debts, advances and other receivablesThe Company reviews the recoverability of its trade debts, advances and other receivables to assessamount of bad debts and provision required there against on annual basis.
— Slow Moving and Stores ObscelenceIn making estimates of quantum of slow moving and obsolescence, the aging analysis, currentcondition of various items component of realization and expected use in future are considered.
27
5 SIGNIFICANT ACCOUNTING POILICIES5.1 Taxation5.1.1 Current
Provision for current taxation is based on taxable income at the current rates of taxation afterconsidering tax credits and rebates, if any, and minimum tax based on turnover of the Companywhichever is higher. The Company falls under the final tax regime under section 154 and 169 of theIncome Tax Ordinance, 2001 to the extent of direct export sales.
5.1.2 DeferredDeferred tax is recognized using the balance sheet liability method in respect of all temporarydifferences arising between the carrying amount of assets and liabilities in the financial statementsand their tax base and is recognized on the basis of the expected manner of the realization orsettlement of the carrying amount of assets and liabilities using the tax rates enacted or substantiallyenacted at the balance sheet date. Deferred tax asset is recognized to the extent that it is probablethat the future taxable profit will be available against which the deductible temporary differences canbe utilized. Deferred tax asset is reduced to the extent that is no longer probable that the related taxbenefit will be realized. In this regard, the effects on deferred taxation of the portion of incomeexpected to be subject to final tax regime is adjusted in accordance with the requirement ofAccounting Technical Release - 27 of the Institute of Chartered Accountants of Pakistan (ICAP), ifconsidered material.
5.1.3 Sales tax and Federal Excise Duty (FED)Revenues, expenses and assets are recognized net off amount of sales tax/FED except:— Where amount incurred on a purchase of asset or service is not recoverable from the taxation
authorities, in which case the tax / duty is recognized as part of the cost of the acquisition of theassets or as part of the expense item as applicable; and
— Receivables or payables that are stated with the amount of Sales tax / FED included. The net amount of sales tax and FED recoverable from, or payable to, the taxation authority isincluded as part of receivables or payables in the balance sheet.
5.2 Retirement benefits:5.2.1 Defined benefit plan
After termination of provident fund scheme on June 30, 2003, an unfunded gratuity scheme is inoperation for all employees eligible to the scheme with qualifying service period. Provision is madeannually to cover the obligation on the basis of actuarial valuation carried out using Projected UnitCredit Method, and is charged to profit and loss account, related details of which are given in therespective note to the accounts. Actuarial gains and losses are amortized over the expected averageremaining working lives of employees except when the net cumulative gains or losses do not exceedthe corridor of 10% of the present value of the defined benefit obligation as stated in IAS -19 in whichcase the gain or loss is charged to profit and loss account.
5.3 Property, plant and equipment5.3.1 Owned assets
These are stated at cost less accumulated depreciation except for free hold land, buildings and plantand machinery which are stated at revalued amounts.Depreciation is charged, on a systematic basis over the economic useful life of the asset, on reducingbalance method, which reflects the pattern in which the assets economic benefits are consumed bythe Company, at the rates specified in respective note. Depreciation on additions is charged from themonth in which the assets are put to use while no depreciation is charged in the month in which theassets are disposed off.
In compliance with the revised International Accounting Standard No. 16, “ Property, Plant andEquipment” the Company adopted revaluation model for its property, plant and equipment and the
28

revalued figures treated as deemed costs. The Surplus on revaluation of these assets, however, isrecognized in accordance with section 235 of the Companies Ordinance, 1984. The surplus onrevaluation of fixed assets to the extent of incremental depreciation net of deferred tax thereoncharged on the related assets is transferred by the Company to statement of changes in equity underunappropriated profit. In case of disposal of revalued asset, any revaluation surplus is directlytransferred to retained earning. The assets' residual values and useful lives are reviewed, andadjusted if appropriate, at each balance sheet date.
Maintenance and normal repairs are charged to income as and when incurred. Major renewals andimprovements are capitalized and the assets so replaced, if any, are retired.
Profit or loss on disposal of property, plant and equipment, if any, is taken to profit and loss account.
5.3.2 Assets subject to finance leaseAssets held under finance lease are stated at cost less accumulated depreciation and accumulatedimpairment losses, if any. These are accounted for by recording the assets at the lower of presentvalue of minimum lease payments under the lease agreements and the fair value of assets acquired.The related obligation under the lease is accounted for as liability. Financial charges are allocated tothe accounted period in a manner so as to provide a constant periodic rate of change on the netstanding liability.
Depreciation is charged to the profit and loss account using the same basis as for owned assets.
5.3.3 Capital work-in-progressCapital work-in-progress is stated at cost accumulated up to the balance sheet date less impairmentif any and represents expenditure incurred on property, plant and equipment in the course ofconstruction. These expenditures are transferred to relevant category of property, plant andequipment as and when the assets becomes available for use.
5.4 Stores, spare parts and loose toolsThese are valued at cost calculated on weighted average basis less provision for obsolescence, andslow moving items, except for the items in transit, which are valued at cost accumulated upto thebalance sheet date.
5.5 Stock in tradeThese are valued at lower of the weighted average cost and estimated net realizable value.
Cost in relation to work in process and finished goods consists of material cost, proportionatemanufacturing overheads.
Net realizable value signifies the budgeted selling price in the ordinary course of business less theestimated costs of completion and the estimated cost necessary to be incurred to make the sale.
5.6 Trade debtsTrade debts are carried at original invoice amount less provision if any. Provision for doubtful debts isbased on management's assessment of customers and their credit worthiness. Bad debts are writtenoff when there is no realistic prospect of recovery.
5.7 Trade and other payablesLiabilities for trade and other payables are carried at cost which is the fair value of the considerationto be paid in the future for goods and services received.
5.8 Revenue recognitionRevenue is recognized to the extent that it is probable that the future economic benefits will flow to the Company and the revenue can be measured reliably. Revenue is measured at the fair value of theconsideration received or receivable, excluding discounts, rebates and government levies.
29

Revenue from sale of goods is recognized when the significant risks and rewards of ownership of thegoods have passed to the buyer, usually on dispatch of the goods to customers.
5.9 Functional and presentation currencyThese financial statements are presented in Pakistan Rupee which is the Company’s functional andpresentation currency.
5.10 Foreign currency transaction and translationAll monetary assets and liabilities in foreign currencies are translated into Pak Rupees at the ratesruling on the balance sheet date or as fixed under contractual arrangements.
Exchange gains and losses resulting from the settlement and from the translation, at the balancesheet date, of such transactions are recognized in the profit and loss account.
5.11 ProvisionsProvisions are recognized in the balance sheet when the Company has present legal or constructiveobligation as a result of past event, and it is probable that outflow of economic benefits will berequired to settle the obligation. However, provisions are reviewed at each balance sheet date andadjusted to reflect current best estimate.
5.12 Borrowing costMark-up, interest and other charges on loans are capitalized upto the date of commissioning of the respective qualifying assets. All other mark-up, interest, profit and other charges are charged toincome.
5.13 Financial InstrumentsFinancial assets and liabilities are recognized at the time when the Company becomes a party to thecontractual provisions of the instrument and derecognized when the Company loses control ofcontractual rights that comprise the financial assets and in the case of financial liability when theobligation specified in the contract is discharged, cancelled or expired. Any gain or loss onderecognition of financial assets and financial liabilities is included in the profit and loss accountcurrently.
5.14 Offsetting of financial assets and liabilitiesAll financial assets and financial liabilities are offset and the net amount is reported in the balancesheet if the Company has a legal enforceable right to set off the recognized amounts and intendseither to settle on net basis or to realize the assets and settle the liabilities simultaneously.
5.15 Cash and cash equivalentsCash and cash equivalents are carried at cost.
For the purpose of the cash flow statement, cash and cash equivalents consist of cash in hand andbank balances net of short term borrowings.
5.16 Dividend and appropriation to reservesDividend and appropriation to reserve are recognized in the financial statements in the period inwhich these are approved.
5.17 ImpairmentThe carrying amount of the Company's assets are reviewed for any indication of impairment at eachfinancial year end. If such indication exists, the asset recoverable amount is estimated, in order todetermine the extent of impairment loss, which is taken to profit and loss account.
5.18 Employee compensated absencesThe Company provides for compensated absences for all eligible employees in the period in whichthese are earned in accordance with the terms of employment.
30

Sep. 30 Sep. 30 2012 2011
6 PROPERTY, PLANT AND EQUIPMENT (Rupees in ‘000) These are comprised as under:Operating fixed assets Note- 6.1 744,394 749,087 Capital work-in-progress Note- 6.2 2,722 4,918
747,116 754,005
6.1 Operating Fixed AssetsNet carrying value as at
Sep 30, 2012Free hold
landFactory
Building onfree hold land
Non-FactoryBuilding on
free hold land
Plant andMachinery
Furnitureand Fittings
Vehicles ComputerEquipment &Appliances
Total
................................................................. Rupees in’000 ....................................................................Owned AssetsOpening Net Book Value (NBV) 25,600 44,779 10,741 550,878 1,916 7,834 2,628 644,376 Addition (at Cost) — — — 31,470 471 5,608 271 37,820 Disposal/Adjustment (at NBV) — — — — — (297) — (297)Depreciation — (4,478) (1,074) (28,597) (203) (2,264) (365) (36,981)Closing Net Book Value 25,600 40,301 9,667 553,751 2,184 10,881 2,534 644,918 Leased AssetsOpening Net Book Value (NBV) — — — 104,711 — — — 104,711 Depreciation — — — (5,235) — — — (5,235)Closing Net Book Value — — — 99,476 — — — 99,476
Total Net Book Value 25,600 40,301 9,667 653,227 2,184 10,881 2,534 744,394 Gross carrying value as atSeptember 30, 2012Owned and Leased AssetsCost/Revaluation 25,600 80,479 23,257 899,918 6,398 17,511 10,279 1,063,442Accumulated Depreciation — (40,178) (13,590) (246,691) (4,214) (6,630) (7,745) (319,048)Total Net Book Value 25,600 40,301 9,667 653,227 2,184 10,881 2,534 744,394
Net carrying value as at Sep 30, 2011
Free holdland
FactoryBuilding on
free hold land
Non-FactoryBuilding on
free hold land
Plant andMachinery
Furnitureand Fittings
Vehicles ComputerEquipment &Appliances
Total
................................................................. Rupees in’000 ....................................................................Owned AssetsOpening Net Book Value (NBV) 25,600 33,717 11,262 395,763 1,198 7,046 2,922 477,508 Addition (at Cost) – – – 24,284 890 2,636 82 27,892 Revaluation during the year – 14,433 605 151,437 – – – 166,475 Disposal/Adjustment (at NBV) – – – – – (327) – (327)Depreciation – (3,371) (1,126) (20,606) (172) (1,521) (376) (27,172)
Closing Net Book Value 25,600 44,779 10,741 550,878 1,916 7,834 2,628 644,376 Leased AssetsOpening Net Book Value (NBV) – – – – – – – – Additions (at Cost) – – – 108,322 – – – 108,322 Disposal/Adjustment (at NBV) – – – – – – – – Depreciation – – – (3,611) – – – (3,611)Closing Net Book Value – – – 104,711 – – – 104,711
Total Net Book Value 25,600 44,779 10,741 655,589 1,916 7,834 2,628 749,087 Gross carrying value as atSeptember 30, 2011Owned and Leased AssetsCost/Revaluation 25,600 80,479 23,257 868,448 5,927 13,272 10,008 1,026,991Accumulated Depreciation – (35,700) (12,516) (212,859) (4,011) (5,438) (7,380) (277,904)
Total Net Book Value 25,600 44,779 10,741 655,589 1,916 7,834 2,628 749,087
Depreciation rate % per annum – 10 10 5 10 20 10 & 20
31
Sep. 30 Sep. 302012 2011
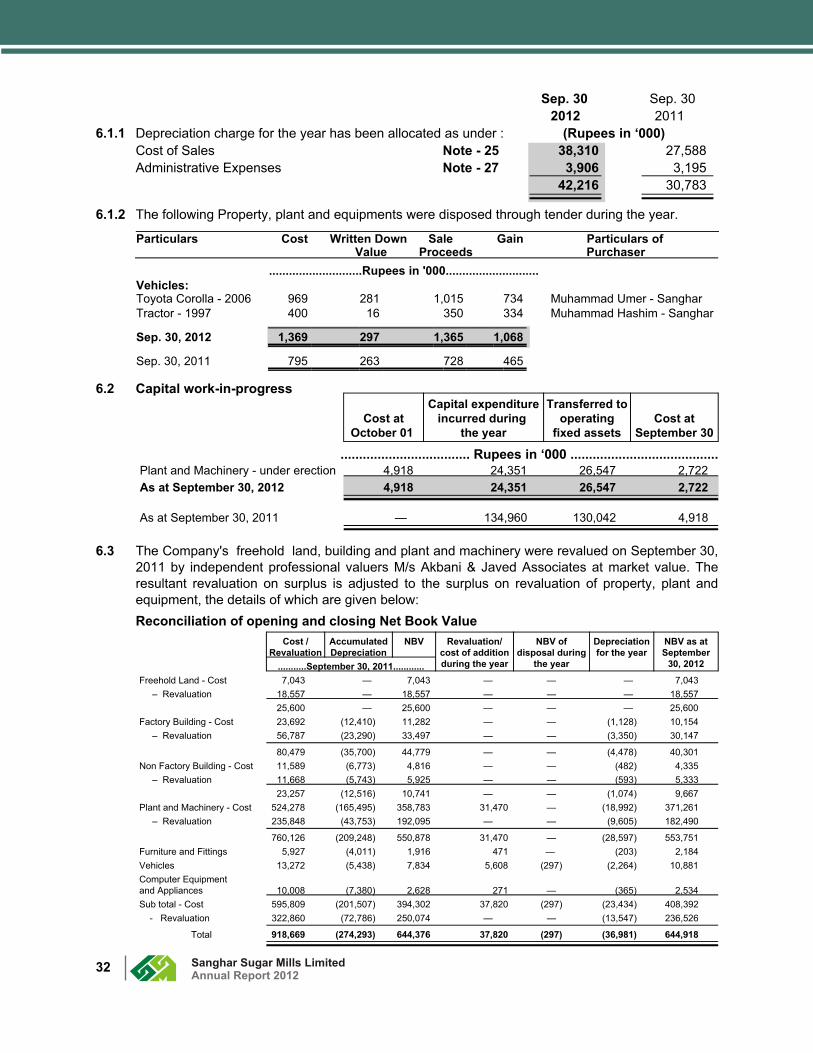
6.1.1 Depreciation charge for the year has been allocated as under : (Rupees in ‘000)Cost of Sales Note - 25 38,310 27,588 Administrative Expenses Note - 27 3,906 3,195
42,216 30,783
6.1.2 The following Property, plant and equipments were disposed through tender during the year.
Particulars Cost Written Down Sale Gain Particulars of Value Proceeds Purchaser
............................Rupees in '000............................Vehicles:Toyota Corolla - 2006 969 281 1,015 734 Muhammad Umer - SangharTractor - 1997 400 16 350 334 Muhammad Hashim - Sanghar
Sep. 30, 2012 1,369 297 1,365 1,068
Sep. 30, 2011 795 263 728 465
6.2 Capital work-in-progress
Cost atOctober 01
Capital expenditureincurred during
the year
Transferred to operating
fixed assetsCost at
September 30
................................... Rupees in ‘000 ........................................Plant and Machinery - under erection 4,918 24,351 26,547 2,722 As at September 30, 2012 4,918 24,351 26,547 2,722
As at September 30, 2011 — 134,960 130,042 4,918
6.3 The Company's freehold land, building and plant and machinery were revalued on September 30,2011 by independent professional valuers M/s Akbani & Javed Associates at market value. Theresultant revaluation on surplus is adjusted to the surplus on revaluation of property, plant andequipment, the details of which are given below:Reconciliation of opening and closing Net Book Value
Cost /Revaluation
AccumulatedDepreciation
NBV Revaluation/cost of additionduring the year
NBV ofdisposal during
the year
Depreciationfor the year
NBV as atSeptember
30, 2012...........September 30, 2011............Freehold Land - Cost 7,043 — 7,043 — — — 7,043 – Revaluation 18,557 — 18,557 — — — 18,557
25,600 — 25,600 — — — 25,600 Factory Building - Cost 23,692 (12,410) 11,282 — — (1,128) 10,154 – Revaluation 56,787 (23,290) 33,497 — — (3,350) 30,147
80,479 (35,700) 44,779 — — (4,478) 40,301 Non Factory Building - Cost 11,589 (6,773) 4,816 — — (482) 4,335 – Revaluation 11,668 (5,743) 5,925 — — (593) 5,333
23,257 (12,516) 10,741 — — (1,074) 9,667 Plant and Machinery - Cost 524,278 (165,495) 358,783 31,470 — (18,992) 371,261 – Revaluation 235,848 (43,753) 192,095 — — (9,605) 182,490
760,126 (209,248) 550,878 31,470 — (28,597) 553,751 Furniture and Fittings 5,927 (4,011) 1,916 471 — (203) 2,184 Vehicles 13,272 (5,438) 7,834 5,608 (297) (2,264) 10,881 Computer Equipment and Appliances 10,008 (7,380) 2,628 271 — (365) 2,534 Sub total - Cost 595,809 (201,507) 394,302 37,820 (297) (23,434) 408,392 - Revaluation 322,860 (72,786) 250,074 — — (13,547) 236,526
Total 918,669 (274,293) 644,376 37,820 (297) (36,981) 644,918
32

Sep 30 Sep 30 2012 2011
(Rupees in ‘000) 7 LONG TERM DEPOSITS
Lease key money 35,822 35,822 Others - security deposits 547 574
36,369 36,396
8 STORES, SPARE PARTS AND LOOSE TOOLSStores 30,177 25,111 Spare parts 30,992 28,690 Loose tools 576 457
61,745 54,258 Provision for slow moving items and obsolescence Note 8.1 11,541 8,352
50,204 45,906
8.1 Movement of provision for slow moving and obsolete itemsBalance as on October 01 8,352 8,352 Charge for the year 3,189 — Balance as on September 30 11,541 8,352
9 STOCK-IN-TRADESugar – Finished Note 9.1 497,147 1,349,729
– In process 1,156 3,859 498,302 1,353,588
Molasses 175 326 Baggasse 1,445 2,023
499,923 1,355,937
9.1 The closing stock of sugar bags having carrying value of Rs. 494,111 thousands (2011: Rs. 427,188thousands) has been pledged against cash finance obtained from the Banking Companies.
10 TRADE DEBTS– Unsecured Considered good
– Local 219,560 12,425 – Foreign 97,861 —
317,421 12,425
33

Sep 30 Sep 30 2012 2011
(Rupees in ‘000) 11 LOANS AND ADVANCES - Interest free
Loans to– Secured
– Employees - Other than CEO, directors and executives 1,166 1,304 Advances to– Un secured
– Contractors and suppliers 10,402 10,273 – Employees against salaries 172 364 – Growers – Considered good Note 11.1 27,357 30,119
– Considered doubtful 6,925 6,925 – Provision against doubtful growers loan (6,925) (6,925)
27,357 30,119 39,097 42,060
11.1 During the year, advance to growers comprises of payments and provision for fertilizer and seedswhich is adjustable against the supplies of sugarcane during the ensuing season.
12 SHORT TERM PREPAYMENTSPrepaid Insurance 918 1,341 Others 76 211
994 1,552
13 CASH AND BANK BALANCESCash in hand 192 167 Cash with banks in current accounts 5,149 13,471
5,341 13,638
14 ISSUED, SUBSCRIBED AND PAID UP CAPITAL
2012 2011 10,860,000 10,860,000 Ordinary shares of Rs.10 each allotted
for consideration fully paid in cash 108,600 108,6001,086,000 1,086,000 Ordinary shares of Rs.10 each
allotted as bonus shares 10,860 10,860
11,946,000 11,946,000 119,460 119,460
14.1 National Bank of Pakistan -Trustee Department NI(U)T Fund and National Investment Trust Limitedholds 1,063,616 and 27,390 shares respectively in the Company. (2011: National Bank of Pakistan -Trustee Department NI(U)T Fund and National Investment Trust Limited holds 1,063,616 and 27,390shares respectively).
15 SURPLUS ON REVALUATION OF FIXED ASSETSGross opening balance 250,074 88,440 Revaluation Surplus for the year — 166,475 Incremental depreciation - net of deferred tax (8,803) (3,147)Effect of Deferred Tax on Incremental Depreciation (4,740) (1,694)
(13,543) (4,841)236,531 250,074
Relevant deferred tax (76,290) (81,031)Revaluation surplus net of deferred tax 160,241 169,043
34

Sep 30 Sep 30 2012 2011
(Rupees in ‘000) 16 LONG TERM FINANCING - SECURED
Long term finance utilized under mark-up arrangementFrom Banking Company Note 16.1 — 23,159Less: Current portion shown under current liabilities Note 22 — 23,159
— —
16.1 The above facility was secured by 1st equitable mortgage over specified items of property, plant &equipment and personal guarantee of directors of the Company. The facility carried a floating markupbased on 6 months KIBOR as base rate plus 5% per annum (with no floor or cap) chargeable andpayable bi-annually. The tenure of finance was 8 years and expired in March 2012. The outstandingbalance was repaid during the year.
17 LIABILITIES AGAINST ASSET SUBJECT TO FINANCE LEASE Present Value of Minimum Lease Payments 86,526 100,457 Less: Current Portion shown under current liabilities 21,618 15,368
64,908 85,089
The amounts of future payments for the lease and the period of maturity is as follows:
Minimum Lease Finance Present ValuePayments (MLP) Charges of MLP
Lease Rentals due within one year 30,782 9,164 21,618
Lease Rentals due after one year but within three years 68,723 3,815 64,908
99,505 12,979 86,526
17.1 The Company has entered into combined lease agreement, for the amount of Rs. 108,322 thousandswith Orix Leasing Company (Rs. 62,264 thousands) and National Bank of Pakistan Leasing (NBPLeasing)(Rs. 46,058 thousands) to acquire Generator and Steam Turbine for enhancing Company'spower generation capacity by 6 MW. The Company has option to purchase the assets upon expiry ofthe lease term by making payment of residual value/ adjustment of security deposit. Minimum leasepayments have been discounted using interest rates linked with KIBOR i-e 6 months KIBOR+5.5%(2011: 17.67 to 21.02%). Lease rentals are payable in 48 months on quarterly basis starting fromMarch 2011.
18 DEFERRED LIABILITIESDeferred taxation Note 18.1 156,611 166,981 Market committee fee Note 23.1.1 28,816 23,982 Staff retirement benefits
— Defined benefits plan Note 18.2 31,547 25,284 216,974 216,247
35

Sep 30 Sep 30 2012 2011
(Rupees in ‘000) 18.1 Deferred taxation:
Deferred tax credit arising due to:– surplus on revaluation 76,290 81,031 – accelerated depreciation 144,576 143,931
220,866 224,962 Deferred tax debit arising due to:– provisions and losses (50,688) (57,981)– Minimum tax (13,567) —
(64,255) (57,981)156,611 166,981
18.2 Staff retirement benefits:The Company operates an unfunded gratuity scheme for its employees eligible to the benefit effective from July 01, 2003 and provision is made as per actuarial valuation of the scheme conducted for theyear ended September 30, 2011 & 2012 vide report dated December 09, 2011 under the “ProjectedUnit Credit” method. The principal assumptions used for actuarial valuation for the gratuity schemeare as follows:
Discount rate 12.50 % p.a Expected rate of future salary increase 11.50 % p.a Average expected remaining working life time of employees 9 years
18.2.1 Movement in the present value of the obligationPresent value of obligation as at October 01 26,464 19,674 Expense for the year 8,529 7,002 Benefit paid to employees (2,266) (1,392)Actuarial loss on present value of defined benefit obligation — 1,180 Present value of obligation as at September 30 32,727 26,464
18.2.2 Reconciliation of balance sheet liabilityPresent value of defined benefit obligations 32,727 26,464 Actuarial loss to be recognized in later period (1,180) (1,180)
31,547 25,284
18.2.3 Expense for the yearCurrent service cost 5,221 4,641 Interest cost 3,308 2,361
8,529 7,002
18.2.4 Charge for the year has been allocated as under:Cost of Sales Note 25 6,397 5,252 Administrative Expenses Note 27 2,132 1,750
8,529 7,002
36

Sep 30 Sep 30 2012 2011
(Rupees in ‘000) 19 TRADE AND OTHER PAYABLES
Creditors 7,211 14,166 Accrued liabilities 14,474 7,586 Road cess and surcharge — 372 Advances from customers 405,445 965,980 Sales tax / FED payable 44,846 1,416 Unclaimed dividend 1,639 3,108 Other liabilities Note 19.1 1,943 11,920
475,558 1,004,548
19.1 Other liabilitiesSales tax withhold/ Income tax deducted at source 796 514 Worker's profit participation fund Note 19.1.1 — 3,456 Worker's welfare fund Note 19.1.2 — 5,662 Others 1,147 2,288
1,943 11,920
19.1.1 Worker’s Profit Participation FundBalance as on October 01 3,456 11,442 Interest on funds utilized by the Company 201 756
3,657 12,198 Less: Payments made during the year 3,657 12,198
— — Add: Contribution for the year — 3,456 Balance as on September 30 — 3,456
19.1.2 In view of loss for the year and taxable loss, no provision for WWF arises for the year.20 ACCRUED MARK-UP
Mark-up on – Long term financing — 2,174 – Liabilities against asset subject to finance lease 2,295 267 – Short term borrowings 17,881 17,154
20,176 19,595
21 SHORT TERM BORROWINGS -SecuredAvailed from Banking Companies under markup arrangementsCash Finance Note 21.1 428,420 355,274
21.1 The aggregate financing facilities available amounting to Rs. 800,000 thousands (2011: 800,000thousands), are secured by pledge of sugar stocks under the supervision of approved muccadum and hypothecation over current assets of the Company totaling to Rs. 666,000 thousands and 1sthypothecation charge of Rs. 40,000 thousands on Company's movables and second charge upto Rs.150,000 thousands over fixed assets of the Company. The financing facilities are collaterally securedby the personal guarantees of all the sponsor directors. The facilities carries markup at 3 monthsKIBOR as base rate plus 2.25% & 3% per annum (2011: 3% to 2.5%) chargeable and payablequarterly. The facilities are renewable annually at the time of maturity.
37

Sep 30 Sep 30 2012 2011
(Rupees in ‘000) 22 CURRENT PORTION OF LONG TERM FINANCING AND
LIABILITIES AGAINST ASSET SUBJECT TO FINANCE LEASE - SecuredCurrent portion of long term financing Note 16 — 23,159
Current portion of liabilities against asset subject to finance lease Note 17 21,618 15,368
21,618 38,527
23 CONTINGENCIES AND COMMITMENTS
23.1 Contingencies:
23.1.1 The Company has filed a case in the Honourable High Court of Sindh against the levy of marketcommittee fee by the Government of Sindh on sugarcane purchases at the factory. The Sindh HighCourt has granted status quo. Full provision of Rs. 28,816 thousands (2011: 23,982 thousands) hasbeen made as a matter of prudence, which includes Rs. 4,833 thousands for the current crushingseason 2011-2012.
23.1.2 The Competition Commission of Pakistan has issued show cause notice to the Company allegingcartelization by industry. The Company has challenged this show cause notice in Sindh High Court inKarachi challenging the jurisdiction of Competition Commission of Pakistan. The Honourable HighCourt has stayed the show cause notice and case hearings are in progress in Sindh High CourtKarachi. There is no financial implications related to this matter at the moment.
23.2 Commitments:
23.2.1 Commitments in respect of plant & machinery amount to Rs. 31,222 thousands (2011: Rs. 20,400thousands).
23.2.2 Outstanding letter of credit amounts to Rs. Nil in respect of plant and machinery. (2011: Rs. 20,506thousands)
24 SALES
Export sales 291,846 —
Local sales 2,930,312 1,596,539
Federal excise duty / Sales tax (216,897) (81,238)
Special excise duty — (17,004)2,713,415 1,498,297 3,005,261 1,498,297
38

Sep 30 Sep 30 2012 2011
(Rupees in ‘000)
25 COST OF SALESSugar cane consumed ( including procurement expenses ) 1,929,052 2,521,074 Market committee fee 4,833 3,379 Road cess 3,020 3,070 Salaries, wages and staff benefits Note 25.1 73,865 69,453 Stores and spares consumed 65,242 65,767 Fuel and power 7,734 14,380 Insurance 8,071 8,222 Repairs and maintenance 8,312 10,763 Packing materials consumed 17,304 18,935 Vehicle running expenses 5,213 4,619 Depreciation 38,310 27,588 Other expenses 2,421 2,578
2,163,377 2,749,828 Sugar -in-process – Opening 3,859 3,457 – Closing (1,156) (3,859)
2,703 (402)2,166,080 2,749,426
Sale of Molasses Note 25.2 192,443 219,791 Inventory adjustment (151) (6)
192,292 219,785 Sale of Bagasse Note 25.2 17,199 9,956 Inventory adjustment (578) 578
16,621 10,534 Cost of goods manufactured 1,957,167 2,519,107 Finished sugar– Opening stock 1,349,729 82,963 – Closing stock (497,147) (1,349,729)
852,582 (1,266,766)2,809,749 1,252,341
25.1 Salaries, wages and benefits include Rs. 6,397 thousands (2011: 5,252 thousands) in respect ofdefined benefit plan.
25.2 These figures are net off sales tax and special excise duty of Rs. 246 thousands (2011:7 thousands)in respect of molasses and Rs. 2,752 thousands (2011: Rs. 1,792 thousands) in respect of bagasse.
39

Sep 30 Sep 30 2012 2011
(Rupees in ‘000) 26 DISTRIBUTION COST
Handling, stacking and others 9,578 2,213 9,578 2,213
27 ADMINISTRATIVE EXPENSESSalaries, wages and staff benefits Note 27.1 52,597 49,060 Rent, rates and taxes 1,182 1,460 Communication 1,307 946 Repairs and maintenance 4,492 4,042 Utilities 2,311 2,240 Entertainment 1,618 2,242 Subscription 1,021 575 Cartage 4,299 3,220 Printing and stationery 1,358 1,018 Insurance 2,691 2,654 Conveyance and traveling 7,363 7,099 Depreciation 3,906 3,195 Legal and professional charges 2,908 2,441 Mess Expenses 1,049 1,348 Other expenses 2,018 2,861
90,120 84,401
27.1 Salaries, wages and benefits include Rs. 2,132 thousands (2011: 1,750 thousands) in respect ofdefined benefit plan.
28 OTHER OPERATING EXPENSESAuditors' remuneration Note 28.1 630 630 Corporate social responsibility Note 28.2 2,165 2,340 Workers Profit Participation Fund — 3,456 Workers Welfare Fund — 1,313 Provision for slow moving and obsolete items 3,189 —
5,984 7,739
28.1 Auditors' remunerationStatutory AuditorsHyder Bhimji and Co.Audit fee 500 500 Half yearly review fee 25 25Review of code of corporate governance 15 15Out of pocket expenses 8 10
548 550 Cost AuditorsSiddiqi and Co.Audit fee 70 70Out of pocket expenses 12 10
82 80630 630
28.2 Corporate social responsibility costs do not include any amount paid to any person or organization inwhich any director or their spouse had any interest.
40
Sep 30 Sep 30 2012 2011
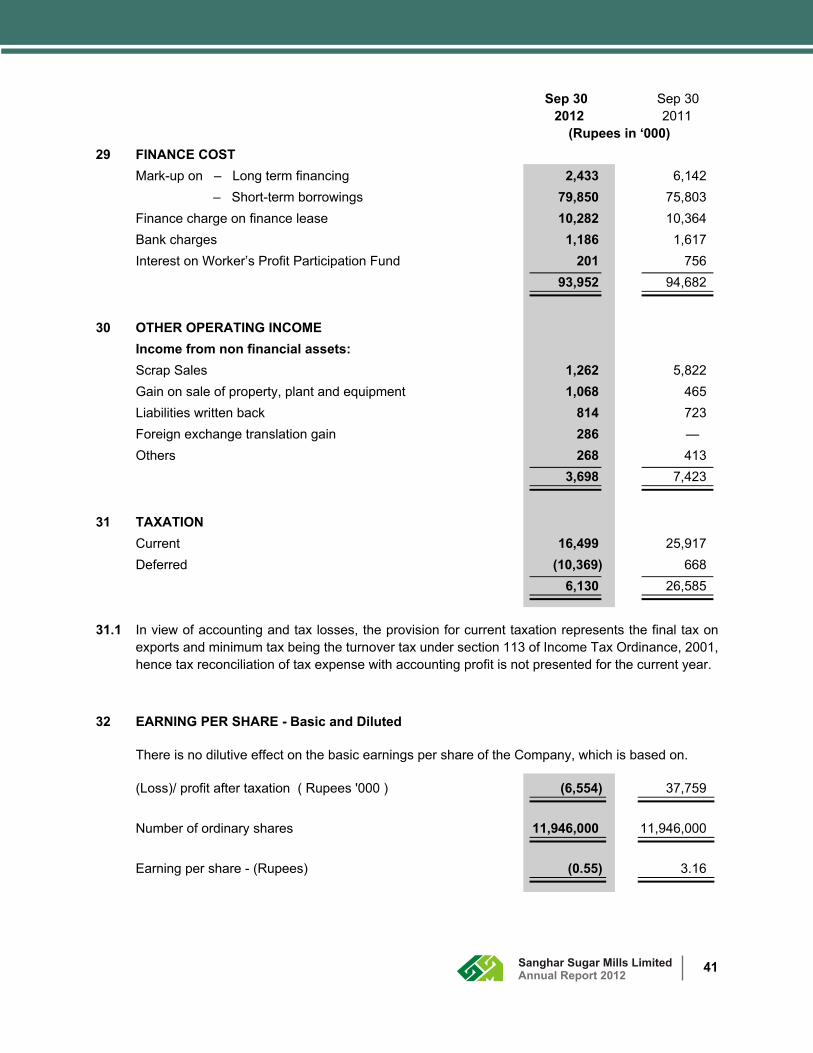
(Rupees in ‘000) 29 FINANCE COST
Mark-up on – Long term financing 2,433 6,142 – Short-term borrowings 79,850 75,803
Finance charge on finance lease 10,282 10,364 Bank charges 1,186 1,617 Interest on Worker’s Profit Participation Fund 201 756
93,952 94,682
30 OTHER OPERATING INCOMEIncome from non financial assets:Scrap Sales 1,262 5,822 Gain on sale of property, plant and equipment 1,068 465 Liabilities written back 814 723 Foreign exchange translation gain 286 — Others 268 413
3,698 7,423
31 TAXATIONCurrent 16,499 25,917 Deferred (10,369) 668
6,130 26,585
31.1 In view of accounting and tax losses, the provision for current taxation represents the final tax onexports and minimum tax being the turnover tax under section 113 of Income Tax Ordinance, 2001,hence tax reconciliation of tax expense with accounting profit is not presented for the current year.
32 EARNING PER SHARE - Basic and Diluted
There is no dilutive effect on the basic earnings per share of the Company, which is based on.
(Loss)/ profit after taxation ( Rupees '000 ) (6,554) 37,759
Number of ordinary shares 11,946,000 11,946,000
Earning per share - (Rupees) (0.55) 3.16
41

Sep 30 Sep 30 2012 2011
(Rupees in ‘000) 33 CASH GENERATED FROM OPERATIONS
(Loss)/ profit before taxation (424) 64,345 Adjustment for non cash charges and other items:Depreciation 42,216 30,783 Gain on sale of fixed assets (1,068) (465)Provision for Market Committee Fee 4,833 3,379 Provision for employees benefits 8,529 7,002 Provisions made during the year 3,216 — Finance cost 93,952 94,682 Working capital changes Note 33.1 18,062 (269,367)
169,740 (133,986)169,316 (69,641)
33.1 Working capital changesDecrease / ( Increase) in current assetsStores, spare parts and loose tools (7,487) (5,694)Stock - in - trade 856,014 (1,267,740)Trade debts (304,996) 37,094 Loans and advances 2,963 13,583 Short term prepayments 558 (905)
547,052 (1,223,662)(Decrease)/Increase in current liabilitiesTrade and other payables (528,990) 954,296
18,062 (269,367)
34 CASH AND CASH EQUIVALENTSCash and cash equivalents comprise of the following itemsCash and bank balances 5,341 13,638 Less: Short term borrowings (428,420) (355,274)
(423,079) (341,636)
35 FINANCIAL INSTRUMENTS
35.1 FINANCIAL ASSETS AND LIABILITIES
Table below summarizes the maturity profile of the Company's financial assets and liabilities at thefollowing reporting periods.
42

FINANCIAL ASSETS AND LIABILITIES 2012
Interest / Mark-up bearing Non Interest / Mark-up bearingInterest /markup Maturity Maturity Sub Maturity Maturity Sub
rate upto one after one Total upto one after one Total Total year year year year 2012
............................................ (Rupees in ‘000) ...............................................................
Financial AssetsLong term deposits — — — — 36,369 36,369 36,369 Trade debts — — — 317,421 — 317,421 317,421 Cash and bank balances — — — 5,341 — 5,341 5,341 T O T A L 2012 — — — 322,762 36,369 359,131 359,131 Financial LiabilitiesLong term financing 6M KIBOR
+ 5% — — — — — — —Liabilities against asset subject to finance lease 6M KIBOR
+ 5.5 % 21,618 64,908 86,526 — — — 86,526 Trade & other payables — — — 430,712 — 430,712 430,712 Accrued mark-up — — — 20,176 — 20,176 20,176 Short term 3 M KIBOR +borrowings 2.25 % to 3% 428,420 — 428,420 — — — 428,420
T O T A L 2012 450,038 64,908 514,946 450,888 — 450,888 965,834
2011Interest / Mark-up bearing Non Interest / Mark-up bearing
Interest /markup Maturity Maturity Sub Maturity Maturity Sub
rate upto one after one Total upto one after one Total Total year year year year 2011
............................................ (Rupees in ‘000) ...............................................................
Financial Assets
Long term deposits — — — — 36,396 36,396 36,396
Trade debts — — — 12,425 — 12,425 12,425
Cash and bank balances — — — 13,638 — 13,638 13,638 T O T A L 2011 — — — 26,063 36,396 62,459 62,459
Financial Liabilities
Long term financing 6M KIBOR + 5% 23,159 — 23,159 — — — 23,159
Liabilities against asset subject to 17.67% to finance lease 21.02% 15,368 85,089 100,457 — — — 100,457
Short term 3M KIBOR + borrowings 2.5% to 3% 355,274 — 355,274 — — — 355,274
Trade & other payables — — — 1,003,132 — 1,003,132 1,003,132
Accrued mark-up — — — 19,595 — 19,595 19,595 T O T A L 2011 393,801 85,089 478,890 1,022,727 — 1,022,727 1,501,617
43

36 FINANCIAL RISKS MANAGEMENT
36.1 Financial Risk Management Objectives, Policies and Responsibilities
The Company's overall risk management programs focuses on the unpredictability of financialmarkets and seeks to minimize potential adverse effects on the Company's financial statements.The Company's risk management policies are established to identify and analyze the risk faced bythe Company, to set appropriate risk limits and controls, and to monitor risks and adherence tolimits.
The Board of Directors has overall responsibility for the establishment and oversight of Company’srisk management framework. The Board is also responsible for developing and monitoring theCompany's risk management policies. Risk management policies and systems are reviewedregularly to reflect changes in market conditions and the Company's activities.
The Company's senior management provides policies for overall risk management, as well aspolicies covering specific areas such as foreign exchange risks, interest rate risks, credit risks,financial instruments and investment of excess liquidity. It is the Company's policy that no trading in derivatives for speculative purpose shall be undertaken.
The Company has exposure to the following risks from its use of financial instruments:
– Market risk
– Credit risk
– Liquidity risk
36.1.1 Market Risk
Market risk is the risk that the value of the financial instrument may fluctuate as a result of changesin market interest rates or the market price due to change in credit rating of the issuer of theinstrument, change in market sentiments, speculative activities, supply and demand of securitiesand liquidity in the market. The Company is subject to following market risks:
36.1.1.1 Foreign Exchange Risk
Foreign exchange risk represents the risk that the fair value of the future cash flows of a financialinstrument will fluctuate because of changes in foreign exchange rates. Foreign exchange riskarises mainly from future economic transaction or receivables or payables that exist due totransactions in foreign exchange. The Company is exposed to currency risk on Trade Debts,Advances from Customers and import of machinery mainly denominated in United States Dollarand Euro. The Company's exposure to foreign currency risk is as follows:
Sep 30 Sep 30 2012 2011
(In ‘000)Balance Sheet ExposureTrade Debts $1,034 — Advances from Customers $98 — Net Exposure $936 —
44

The following exchange rate has been applied: Average rate Reporting date rate
2012 2011 2012 2011
US$ to PKR 94.36 — 94.70 / 95.00 —
Sensitivity analysis
At reporting date, if the PKR would strengthen by 10% against the foreign currency with all othervariables held constant , effect of increase / decrease on the equity and profit and loss account willbe as shown below:
Sep 30 Sep 30 2012 2011
(Rupees in ‘000)
Effect on profit and loss
Effects in Pak Rupees of US $ Exposure 8,864 —
The sensitivity analysis prepared is not necessarily indicative of the effects on profit/loss for theyear and assets / liabilities of the Company.
The Company is not exposed to any material foreign exchange risk other than disclosed above.
36.1.1.2 Interest rate risk
Interest rate risk is the risk that the value or future cash flows of the financial instruments willfluctuate because of changes in market interest rate. The Company has liabilities against assetsubject to finance lease and short term borrowings which are based at varying rates.
At the reporting date, the interest rate profile of the Company's significant interest bearing financial instruments are as follows:
2012 2011 2012 2011 Effective interest rate Carrying amount (in percent) (Rupees in '000)
Financial liabilities
Fixed rate instruments - Finance lease — 17.67 to 21.02 — 100,457
Variable rate instruments - Long term financing 6M KIBOR 6M KIBOR
+ 5% + 5% — 23,159
- Finance lease 6M KIBOR + 5.5% — 86,526 —
- Short term borrowings 3M KIBOR + 3M KIBOR2.5% & 3% + 2% & 3% 428,420 355,274
514,946 378,433
45

Sensitivity analysisFair value sensitivity analysis for fixed rate instrumentsA change of 100 basis points in interest rates at the reporting date would have decreased /(increased) profit/loss for the year by the amounts shown below. This analysis assumes that allother variables, in particular foreign currency rates, remain constant. The analysis is performed onthe same basis for 2011.
Profit and loss 100 bpincrease decrease
Financial liabilities (Rupees in '000)As at September 30, 2012
Cash flow sensitivity — —
As at September 30, 2011Cash flow sensitivity 1,005 (1,005)
Cash flow sensitivity analysis for variable rate instruments
A change of 100 basis points in interest rates at the reporting date would have decreased /(increased) profit/loss for the year by the amounts shown below. This analysis assumes that allother variables, in particular foreign currency rates, remain constant. The analysis is performed onthe same basis for 2011.
Profit and loss 100 bpincrease decrease
Financial liabilities (Rupees in ‘000)As at September 30, 2012Cash flow sensitivity (5,149) 5,149
As at September 30, 2011
Cash flow sensitivity (3,784) 3,784
The sensitivity analysis prepared is not necessarily indicative of the effects on profit for the yearand assets / liabilities of the Company.
36.1.1.3 Other Price Risk Other price risk is the risk that the fair value or future cash flows from a financial instrument willfluctuate due to changes in market prices (other than those arising from interest rate risk orcurrency risk), whether those changes are caused by factors specific to the individual financialinstrument or its issuer, or factors affecting all similar financial instruments traded in the market.The Company does not have financial instruments dependent on market prices.
36.1.2 Credit RiskCredit risk represents the accounting loss that would be recognized at the reporting date if counterparties failed to perform as contracted. The Company manages credit risk interalia by setting outcredit limits in relation to individual customers and / or by obtaining advance against sales and / orthrough letter of credits and / or by providing for doubtful debts.
46
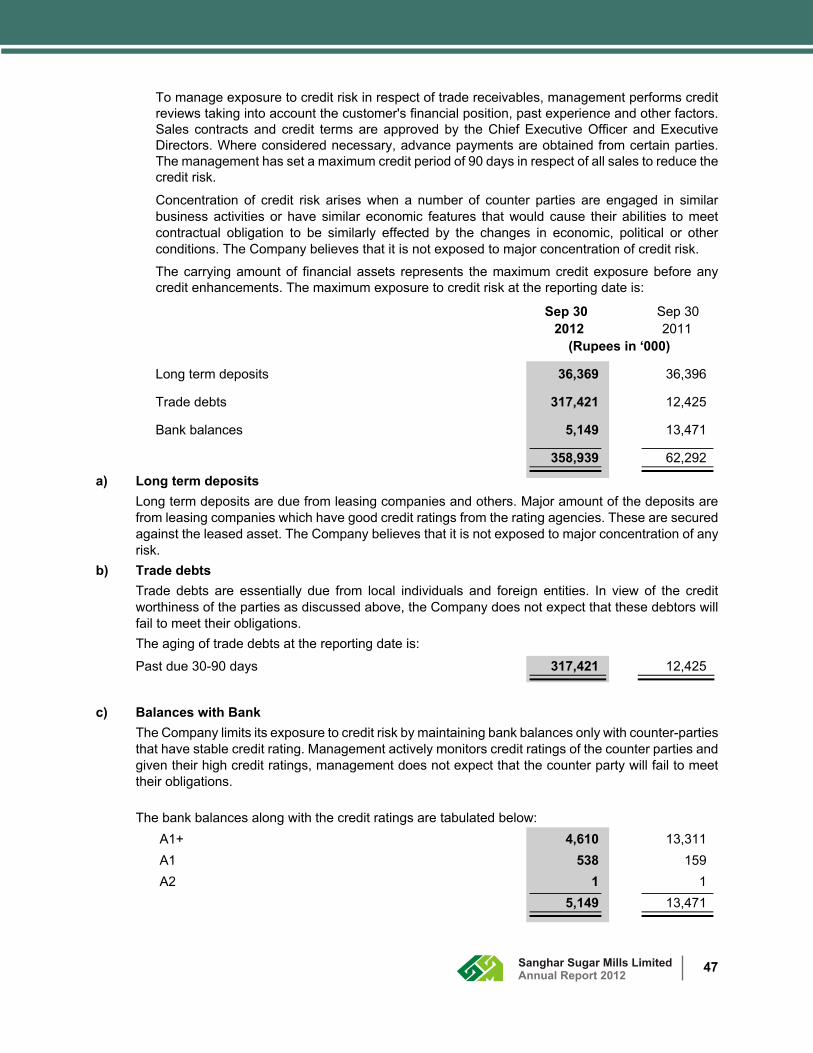
To manage exposure to credit risk in respect of trade receivables, management performs creditreviews taking into account the customer's financial position, past experience and other factors.Sales contracts and credit terms are approved by the Chief Executive Officer and ExecutiveDirectors. Where considered necessary, advance payments are obtained from certain parties.The management has set a maximum credit period of 90 days in respect of all sales to reduce thecredit risk.
Concentration of credit risk arises when a number of counter parties are engaged in similarbusiness activities or have similar economic features that would cause their abilities to meetcontractual obligation to be similarly effected by the changes in economic, political or otherconditions. The Company believes that it is not exposed to major concentration of credit risk.
The carrying amount of financial assets represents the maximum credit exposure before anycredit enhancements. The maximum exposure to credit risk at the reporting date is:
Sep 30 Sep 30 2012 2011
(Rupees in ‘000)
Long term deposits 36,369 36,396
Trade debts 317,421 12,425
Bank balances 5,149 13,471
358,939 62,292
a) Long term depositsLong term deposits are due from leasing companies and others. Major amount of the deposits arefrom leasing companies which have good credit ratings from the rating agencies. These are securedagainst the leased asset. The Company believes that it is not exposed to major concentration of anyrisk.
b) Trade debtsTrade debts are essentially due from local individuals and foreign entities. In view of the creditworthiness of the parties as discussed above, the Company does not expect that these debtors willfail to meet their obligations. The aging of trade debts at the reporting date is:
Past due 30-90 days 317,421 12,425
c) Balances with BankThe Company limits its exposure to credit risk by maintaining bank balances only with counter-partiesthat have stable credit rating. Management actively monitors credit ratings of the counter parties andgiven their high credit ratings, management does not expect that the counter party will fail to meettheir obligations.
The bank balances along with the credit ratings are tabulated below:A1+ 4,610 13,311 A1 538 159 A2 1 1
5,149 13,471
47

36.1.2.1 Financial assets that are either past due or impaired
The credit quality of financial assets that are either past due or impaired can be assessed byreference to historical information and external ratings or to historical information about counterparty default rates as disclosed in respective notes.
Management believes that there are no financial assets that are either past due or impaired.
36.1.3 Liquidity Risk
Liquidity risk represent the risk where the Company will encounter difficulty in meeting obligationsassociated with financial liabilities.
The Company manages liquidity risk by maintaining sufficient cash and ensuring the fundavailability through adequate credit facilities. As at September 30, 2012, the Company hasavailable sanctioned borrowing facilities of Rs. 800,000 thousands (2011: 800,000 thousands)from various commercial banks. Unutilized borrowing facilities Rs. 371,580 thousands (2011: Rs.444,726 thousands) and also has deposit of Rs. 5,149 thousands (2011: 13,741 thousands) atbanks. Based on the above, the management believes that the Company is not significantlyexposed to the liquidity risk.
The maturity profile of the Company's financial assets and liabilities as at the balance seet date with respect to period lags is given in Note 35.1.
36.2 Fair Value of Financial Instruments
Fair value is the amount for which an asset could be exchanged, or a liability settled, betweenknowledgeable willing parties in an arm's length transaction.
The carrying value of all the financial assets and liabilities reflected in the financial statementsapproximates their fair values. The method used in determining fair values of each class of financial assets and liabilities are disclosed in the respective policy notes.
36.3 CAPITAL RISK MANAGEMENT
The Company’s objective when managing capital is to safeguard the Company’s ability to continueas a going concern in order to provide returns for shareholders and benefits for other stakeholdersand to maintain an optimal capital structure to reduce the cost of capital. In order to maintain oradjust the capital structure, the Company may adjust the amount of dividends paid to shareholders, issue new shares and take other measures commensuration to the circumstances. The Companyfinances its expansions projects through equity, borrowings and management of its working capitalwith a view to maintaining an appropriate mix between various sources of finance to minimize risk.
The Company monitors capital using a gearing ratio, which is net debt divided by total shareholders equity plus net debt. Net debt is calculated as total loans and borrowings less cash and bankbalances. The Company's strategy was to maintain leveraged gearing. The gearing ratios as at the balance sheet are as follows:
48

Sep 30 Sep 30 2012 2011
(Rupees in ‘000)
Total financing and borrowings including finance lease 509,605 364,795
Less: Cash and bank balances (5,341) (13,638)
Net debt 504,264 351,157
Total Equity 330,698 328,449
Total Capital employed 834,962 679,606
Gearing Ratio 60.39% 51.67%
37 REMUNERATION OF CHIEF EXECUTIVE, DIRECTORS AND EXECUTIVES
The aggregate amount charged in the accounts for the year for remuneration, including all benefits tothe Chief Executive, Directors and Executives of the Company were as follows:
Chief Executive Directors Executives Total2012 2011 2012 2011 2012 2011 2012 2011
................................................................ (Rupees in ‘000) ................................................................
Non Executive Directors’fee - 5 Directors — — 135 140 — — 135 140
Managerial remuneration 4,775 3,714 1,204 846 5,320 4,884 11,299 9,444
Housing 1,470 1,129 541 381 1,646 1,510 3,657 3,020
Medical and others 326 501 240 175 731 671 1,297 1,347
6,571 5,344 1,985 1,402 7,697 7,065 16,253 13,811
Number of persons 1 1 2 2 3 3 6 6
The Chief Executive, two Executive Directors and Executives as stated above are provided with theCompany maintained cars for the business and personal use and the Chief Executive and twoExecutive Directors are also provided with telephone facilities for the business and personal use.
49

38 RELATED PARTY TRANSACTIONS
The Company in the normal course of business carried out transactions with related parties asdetailed below:
Relationship with Company Nature of Transaction Sep. 30, 2012 (Rupees in '000)
Key Management Personnel and their relatives Purchase of sugarcane 29,940
Transactions, as applicable in relation to Directors of the Company and Key Management Personnel(KMP) have been disclosed in note # 37 & 38. Key Management Personnel are those persons havingauthority and responsibility for planning, directing and controlling the activities of the entity directly orindirectly.
39 CAPACITY AND PRODUCTION
2012 2011 Quantity No. of Quantity No. of M. Tons days M. Tons days
Crushing capacity 6,000 Per day 6,000 Per day
Capacity based on actualworking days 654,000 109 702,000 117
Actual Crushing 483,352 109 491,295 117
Sucrose recovery ( in %) 9.62 — 9.57 —
Sugar production from cane 46,516 — 47,008 —
39.1 Main reason for under utilization of production capacity is non availability of sugarcane during theseason.
40 DATE OF AUTHORIZATION FOR ISSUE
These financial statements were authorized for issue on January 05, 2013 by the Board of Directorsof the Company.
41 GENERAL
Figures have been rounded off to nearest thousand of rupees.
Chief Executive Director
50

Pattern of Share HoldingAs at September 30, 2012
Number of Share Holding Total Shareholders From To Shares Held
636 1 100 23,540113 101 500 31,88389 501 1000 56,58694 1001 5000 219,75544 5001 10000 277,4055 10001 15000 58,6803 15001 20000 53,0004 20001 25000 95,8504 25001 30000 107,3301 35001 40000 36,7952 40001 45000 89,6502 60001 65000 125,4001 75001 80000 75,1751 85001 90000 87,8401 90001 95000 95,0003 95001 100000 289,4901 100001 105000 101,2502 105001 110000 216,0752 110001 115000 224,1141 120001 125000 120,3612 125001 130000 251,6151 130001 135000 131,7521 170001 175000 170,0051 240001 245000 241,4871 325001 330000 329,5271 360001 365000 360,1791 400001 405000 403,1001 410001 415000 410,7401 495001 500000 497,7151 520001 525000 522,6001 655001 660000 659,2501 670001 675000 674,7501 855001 860000 858,0001 910001 915000 913,0001 975001 980000 979,0001 1060001 1065000 1,063,6161 1090001 1095000 1,094,485
1,027 11,946,000
* There is no shareholding in the slab not mentioned
Shareholder's Category Number of Shares Held
Percentage%
01 Directors, Chief Executive Officer and their spouse and minor children
1,649,137 13.8049
02 Associated Companies, undertakings and related parties.
– –
03 Executives 25,300 0.2118 04 NIT & ICP 1,091,406 9.1361 05 Banks, DFIS, NBFIS, Mudaraba 211,665 1.7718 06 Mutual Funds 618,076 5.1739 07 Insurance Companies 418,040 3.4994 08 Shareholders holding 5% or more 3,844,485 32.1821 09 Limited Companies 267,638 2.2404 10 General Public - Local 3,820,253 31.9791
TOTAL 11,946,000 100.0000
51

Detail of Pattern of Share Holding As per Requirement of Code of Corporate GovernanceAs at September 30, 2012
Category Name Category wise Category Number of Percentage Number of wise Percentage
shares held % shareholders shares held %
Directors, Chief Executive andtheir spouse and minor children 7 1,649,137 13.8049 Haji Khuda Bux Rajar 241,487 2.0215
* Mr. Ghulam Dastagir Rajar 659,250 5.5186Mr. Jam Mitha Khan 62,700 0.5249Mr. Mohammad Aslam 3,300 0.0276Mr. Qazi Shamsuddin 4,900 0.0410
* Mr. Gul Mohammad 674,750 5.6483Mrs. Khanzady W/o Haji Khuda Bux Rajar 2,750 0.0230Associated Companies, Undertaking and related parties — — — Executives 2 25,300.00 0.2118 NIT & ICP 3 1,091,406 9.1361 National Investment Trust Limited 27,390 0.2293
* NBP Trustee - NI(U)T (LOC) Fund 1,063,616 8.9035Investment Corporation of Pakistan 400 0.0033Banks, DFIS, NBFIS, Mudaraba 4 211,665 1.7718 Mutual Funds 2 618,076 5.1739 CDC-Trustee AKD Opportunity Fund 120,361 1.0075Golden Arrow Selected Stocks Fund Ltd 497,715 4.1664Insurance Companies 3 418,040 3.4994
* Shareholders holding 5% or more 4 3,844,485 32.1821 Limited Companies 9 267,638 2.2404 General Public - Local 993 3,820,253 31.9791
1,027 11,946,000 100.000
* Shareholders having 5% or more shares marked as(*) are shown in their relevant categories. The name wisedetails of the remaining shareholders having 5% or more given below
Name of Shareholders Number of shares held Percentage %
Ali Ghulam 858,000 7.1823 Khuda Bux 913,000 7.6427 Abdul Jabbar 979,000 8.1952 Pir Baksh 1,094,485 9.1618
3,844,485 32.1821
Information under clause (xvi) (l) of the Code of Corporate Governance
The Directors, Executives and their spouse and their minor children have not undertaken any trading of Company'sshares during the year 2011-2012.
52

