title analysis of customer satisfaction survey for fruit
TRANSCRIPT

ชื่อเร่ือง การวิเคราะห การสํารวจความพึงพอใจของผูบริโภคสําหรับน้ําผลไมโดยใชแบบจําลองคาโน
Title Analysis of Customer Satisfaction Survey for Fruit Juice using Kano Model
ชื่อผูวิจัย ผูชวยศาสตราจารย ดร.พิชญอร ไหมสุทธิสกุล คณะวิทยาศาสตรและเทคโนโลยี มหาวิทยาลัยหอการคาไทย E-Mail : [email protected] Abstract
Under rapidly changing and highly competitive circumstances, the timely design, development and marketing of new products with creative and innovative features are essential for a company’s survival. In order to capture and retain market share, consumer requirements and expectations should be met and exceeded through product innovation. For effective new-product-development project management, a systematic approach to understanding consumer requirements and further embedding them into the future product is desirable. This paper analyses the notion of consumer satisfaction based on the Kano model and points to the importance of fruit juice product innovation in exceeding consumer satisfaction. Data were collected from a consumer sample (n = 100) in Bangkok during January to June 2009. The questionnaires are analyzed with focus on consumer need analysis of fruit juice beverage. The results indicated that the packaging material and varieties could be classified as a dominant “indifferent” characteristic. The exotic material showed a dominant one-dimensional characteristic. Moreover, a must-be requirement was the healthy benefit. Attractive requirement were concentration, fruit meat and innovative product. However, a segment-specific analysis demonstrates that drivers of satisfaction from Kano analysis are dissimilar between different customer groups, especially with regard to exotic material and healthy benefit. Keywords; fruit juice, consumer satisfaction, product development, Kano model Introduction
There is a significant growth in the fruit juice market, which has attracted the attention of fruit growers, fruit juice distributors and processors to meet the demand. Fruit juice beverages with neutraceuticals are now gaining more importance in the fruit juice market (Renuka et al., 2009). These nutrient-rich beverages are gaining in popularity due to consumers’ desire to eat healthily while sampling new and exotic tastes, and – at the same time – due to the health focus of world beverage industries as a product positioning and differentiation parameter (Sabbe et al., 2009).

2
However, market place success and long-term consumption of novel foods depend on consumers’ acceptance and satisfaction. A good understanding of consumers’ responses and their reactions towards novel food products carrying a specific health is recognized as a key success factor. Novel food products are costly to develop and bring to market. Various methods and tools have been developed accordingly to help companies obtain a better understanding of consumer satisfaction and bring a new product more succeed. Among them, Kano’s model is a widely used tool for understanding the voice of consumers and their impact on consumer satisfaction.
The seminal study by Kano et al. (1984) was the first to thoroughly address the non-linear relationship between quality attribute performance and overall consumer satisfaction. They suggested that quality attributes can be classified into five categories (i.e., basic, performance, excitement, indifference and reverse) based on the level of impact of individual attributes on overall consumer satisfaction. Table 1 summarizes the definition of those five factors. Among them, indifference factor is a quality attribute without which consumer satisfaction will not be affected, and reverse factor is an attribute with which consumers will be dissatisfied. Neither factor has much relevance to fulfilling improving overall satisfaction. Therefore, the literature has traditionally excluded these two factors when the research focus is on fulfilling consumer needs and ‘‘improving’’ overall consumer satisfaction. In other words, research has generally concentrated on discussion of the first three quality factors, basic, performance, and excitement. Table 1 Kano’s five quality factors. Quality factor Definition Basic (Must-be) factor
Performance (One-dimensional) factor Excitement (Attractive) factor Indifference factor
Reverse factor
Consumers will accept the product or service if quality attribute is provided; otherwise, they will feel dissatisfied (if this quality attribute is not provided). Consumers will be satisfied if quality attribute is provided; otherwise, they will be dissatisfied. Consumers will be satisfied if quality attribute is provided; otherwise, they will accept the product or service with no dissatisfaction. Consumer satisfaction will not be affected no matter whether this quality attribute is provided or not Consumers will be dissatisfied if this quality attribute is provided; otherwise, they will be satisfied
Source: Matzler et al (1996) As Figure 1 shows, the extent to which a quality element is provided is indicated on the x-axis.
The more the arrow moves towards the right, the greater the extent to which the quality element is

3 provided, while the more the arrow moves towards the left, the less the left, the less the extent to which the quality element is provided. The consumer satisfaction is indicated on the y-axis. The higher the arrow, the higher the consumer dissatisfaction, while the lower the arrow, the higher the consumer dissatisfaction. Based on these axes, the following are the popularly named Kano consumer requirement categories. Figure 1 Kano’s two-dimensional quality model. Source: Matzler et al (1996)
This paper was intended to show the use of Kano’s questionnaires to find out consumer needs
analysis towards fruit juice beverage.
Methodology
This research adopts a quantitative approach, which analyses the relationship between qualities attributes of the fruit juice beverage and consumer satisfaction based on the Kano model and the CS coefficient matrix.
An overview of the proposed process model includes (1) initial product idea generation, (2) consumer requirement acquisition and (3) Kano model analysis. Note that this process model is more concerned with the early phases of new product development than the whole process.
• The initial product idea generation or voice of consumer has received considerable attention. Product ideas arise from 2 Focus groups from 10 potential consumers each. After that, group the consumer requirements into their appropriate Kano categories using the Kano questionnaire.
4
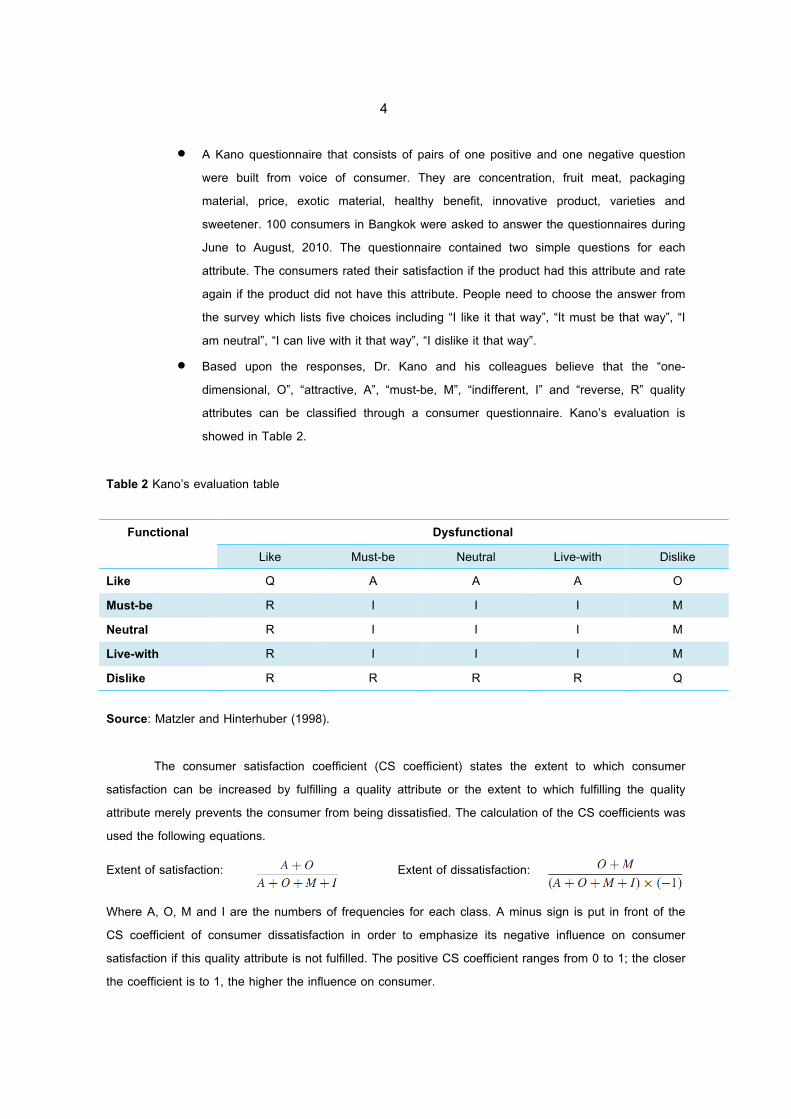
• A Kano questionnaire that consists of pairs of one positive and one negative question were built from voice of consumer. They are concentration, fruit meat, packaging material, price, exotic material, healthy benefit, innovative product, varieties and sweetener. 100 consumers in Bangkok were asked to answer the questionnaires during June to August, 2010. The questionnaire contained two simple questions for each attribute. The consumers rated their satisfaction if the product had this attribute and rate again if the product did not have this attribute. People need to choose the answer from the survey which lists five choices including “I like it that way”, “It must be that way”, “I am neutral”, “I can live with it that way”, “I dislike it that way”.
• Based upon the responses, Dr. Kano and his colleagues believe that the “one-dimensional, O”, “attractive, A”, “must-be, M”, “indifferent, I” and “reverse, R” quality attributes can be classified through a consumer questionnaire. Kano’s evaluation is showed in Table 2.
Table 2 Kano’s evaluation table
Functional Dysfunctional Like Must-be Neutral Live-with Dislike
Like Q A A A O Must-be R I I I M Neutral R I I I M Live-with R I I I M Dislike R R R R Q
Source: Matzler and Hinterhuber (1998).
The consumer satisfaction coefficient (CS coefficient) states the extent to which consumer satisfaction can be increased by fulfilling a quality attribute or the extent to which fulfilling the quality attribute merely prevents the consumer from being dissatisfied. The calculation of the CS coefficients was used the following equations.
Extent of satisfaction: Extent of dissatisfaction:
Where A, O, M and I are the numbers of frequencies for each class. A minus sign is put in front of the CS coefficient of consumer dissatisfaction in order to emphasize its negative influence on consumer satisfaction if this quality attribute is not fulfilled. The positive CS coefficient ranges from 0 to 1; the closer the coefficient is to 1, the higher the influence on consumer.
5 Results and Discussion
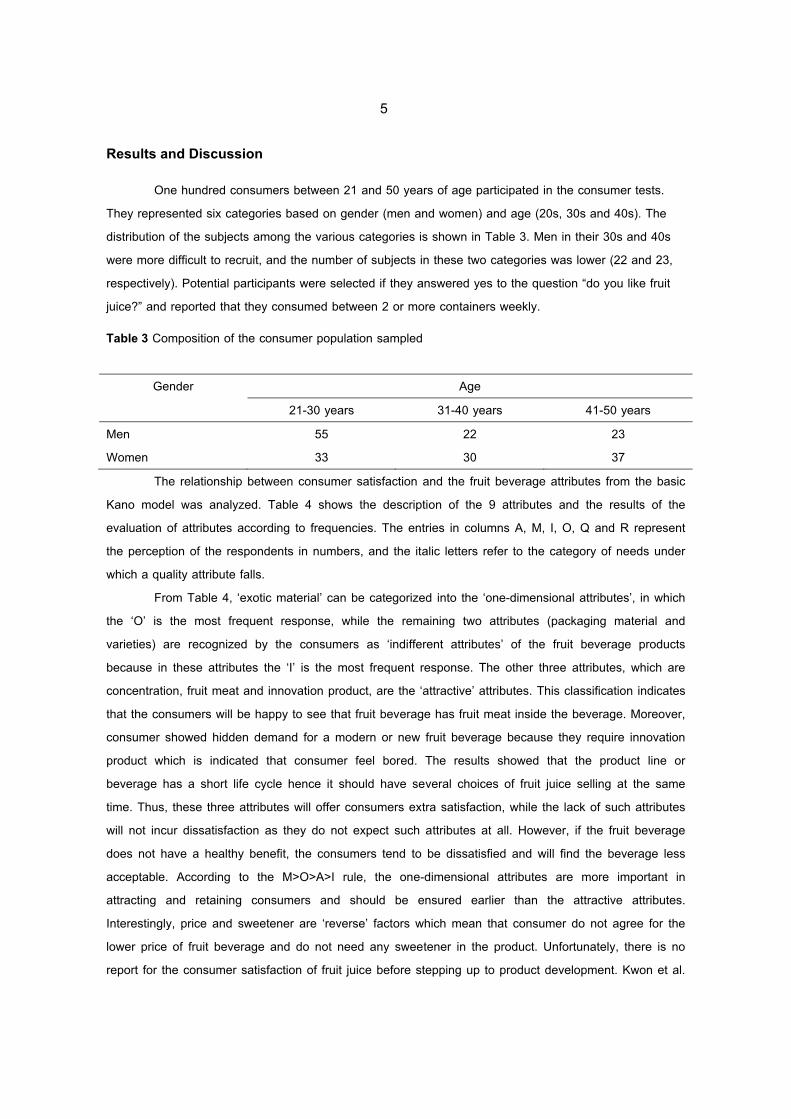
One hundred consumers between 21 and 50 years of age participated in the consumer tests. They represented six categories based on gender (men and women) and age (20s, 30s and 40s). The distribution of the subjects among the various categories is shown in Table 3. Men in their 30s and 40s were more difficult to recruit, and the number of subjects in these two categories was lower (22 and 23, respectively). Potential participants were selected if they answered yes to the question “do you like fruit juice?” and reported that they consumed between 2 or more containers weekly.
Table 3 Composition of the consumer population sampled
Gender Age 21-30 years 31-40 years 41-50 years
Men Women
55 33
22 30
23 37
The relationship between consumer satisfaction and the fruit beverage attributes from the basic Kano model was analyzed. Table 4 shows the description of the 9 attributes and the results of the evaluation of attributes according to frequencies. The entries in columns A, M, I, O, Q and R represent the perception of the respondents in numbers, and the italic letters refer to the category of needs under which a quality attribute falls.
From Table 4, ‘exotic material’ can be categorized into the ‘one-dimensional attributes’, in which the ‘O’ is the most frequent response, while the remaining two attributes (packaging material and varieties) are recognized by the consumers as ‘indifferent attributes’ of the fruit beverage products because in these attributes the ‘I’ is the most frequent response. The other three attributes, which are concentration, fruit meat and innovation product, are the ‘attractive’ attributes. This classification indicates that the consumers will be happy to see that fruit beverage has fruit meat inside the beverage. Moreover, consumer showed hidden demand for a modern or new fruit beverage because they require innovation product which is indicated that consumer feel bored. The results showed that the product line or beverage has a short life cycle hence it should have several choices of fruit juice selling at the same time. Thus, these three attributes will offer consumers extra satisfaction, while the lack of such attributes will not incur dissatisfaction as they do not expect such attributes at all. However, if the fruit beverage does not have a healthy benefit, the consumers tend to be dissatisfied and will find the beverage less acceptable. According to the M>O>A>I rule, the one-dimensional attributes are more important in attracting and retaining consumers and should be ensured earlier than the attractive attributes. Interestingly, price and sweetener are ‘reverse’ factors which mean that consumer do not agree for the lower price of fruit beverage and do not need any sweetener in the product. Unfortunately, there is no report for the consumer satisfaction of fruit juice before stepping up to product development. Kwon et al.
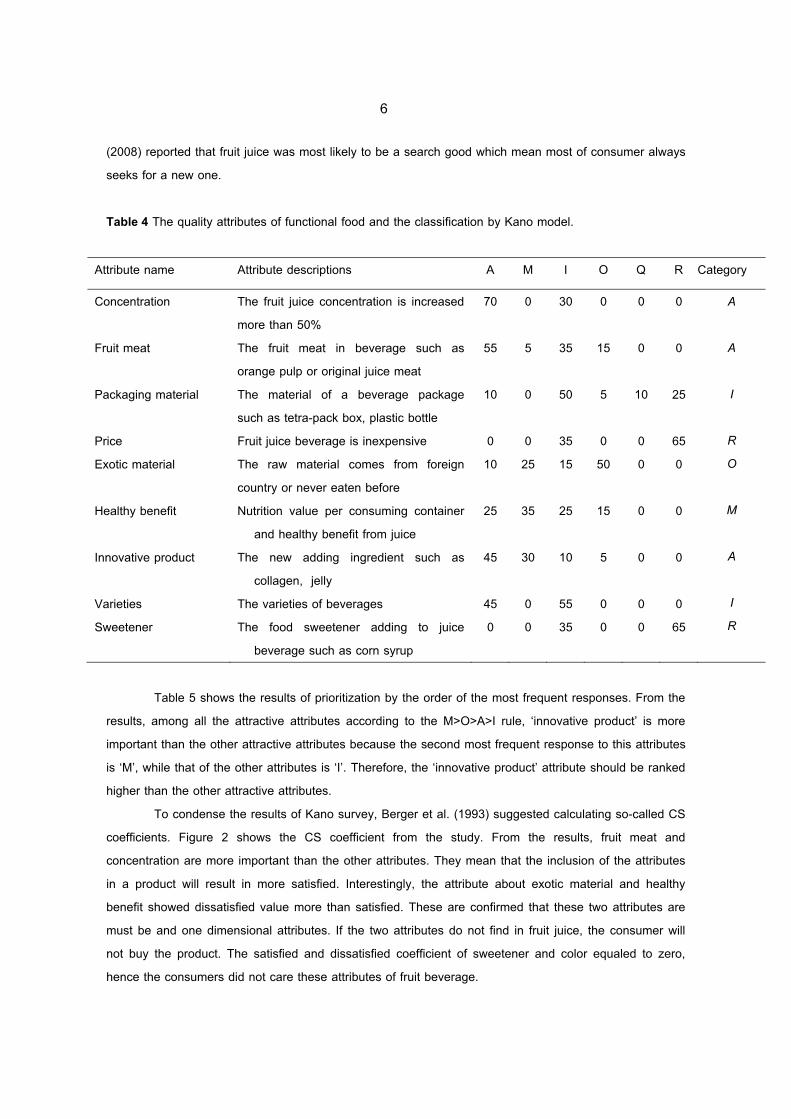
6 (2008) reported that fruit juice was most likely to be a search good which mean most of consumer always seeks for a new one.
Table 4 The quality attributes of functional food and the classification by Kano model.
Attribute name Attribute descriptions A M I O Q R Category
Concentration Fruit meat Packaging material Price Exotic material Healthy benefit Innovative product Varieties Sweetener
The fruit juice concentration is increased more than 50% The fruit meat in beverage such as orange pulp or original juice meat The material of a beverage package such as tetra-pack box, plastic bottle Fruit juice beverage is inexpensive The raw material comes from foreign country or never eaten before Nutrition value per consuming container
and healthy benefit from juice The new adding ingredient such as
collagen, jelly The varieties of beverages The food sweetener adding to juice
beverage such as corn syrup
70
55
10 0 10
25
45
45 0
0 5 0 0 25
35
30 0 0
30
35
50
35 15
25
10
55 35
0
15 5 0 50
15 5 0 0
0 0
10 0 0 0 0 0 0
0 0
25
65 0 0 0 0 65
A
A I
R O
M
A I R
Table 5 shows the results of prioritization by the order of the most frequent responses. From the
results, among all the attractive attributes according to the M>O>A>I rule, ‘innovative product’ is more important than the other attractive attributes because the second most frequent response to this attributes is ‘M’, while that of the other attributes is ‘I’. Therefore, the ‘innovative product’ attribute should be ranked higher than the other attractive attributes.
To condense the results of Kano survey, Berger et al. (1993) suggested calculating so-called CS coefficients. Figure 2 shows the CS coefficient from the study. From the results, fruit meat and concentration are more important than the other attributes. They mean that the inclusion of the attributes in a product will result in more satisfied. Interestingly, the attribute about exotic material and healthy benefit showed dissatisfied value more than satisfied. These are confirmed that these two attributes are must be and one dimensional attributes. If the two attributes do not find in fruit juice, the consumer will not buy the product. The satisfied and dissatisfied coefficient of sweetener and color equaled to zero, hence the consumers did not care these attributes of fruit beverage.

7
Table 5 Quality attributes of fruit juice beverage ranked by most frequent response.
Attribute name Most frequent response
Second most frequent response
Third most frequent response
Fourth most frequent response
Concentration Fruit meat Packaging material Price Exotic material Healthy benefit Innovative product Varieties Sweetener
A A I I O M A A I
I I R R M A/I M I R
- O
A/Q - I O I - -
- M O - A - O - -
Figure 2 Consumer satisfaction coefficients. Based on CS-coefficients, it is possible to position the dimension of perception in a satisfaction-
dissatisfaction grid (Berger et al. 1993). One-dimensional requirements, causing both satisfaction and dissatisfaction, are positioned in the top right quadrant (CS->0.5, CS+>0.5). The bottom right quadrant represents must-be requirements (CS->0.5, CS+<0.5). Attractive requirements (CS-<0.5, CS+>0.5) and indifferent requirements (CS-<0.5, CS+<0.5) are positioned in the bottom quadrant (Figure 3). The categorized requirement of each attributes is similar from Kano and Berger except reverse requirement (Figure 3 and Table 4). Interestingly, healthy benefit is stand for the border region between must be
0 0.2 0.4 0.6 0.8
Concentration
Fruit meat
Packaging material
Price
Exotic material
Healthy benefit
Innovative product
Varieties
Sweetener
satisfactiondissatisfaction
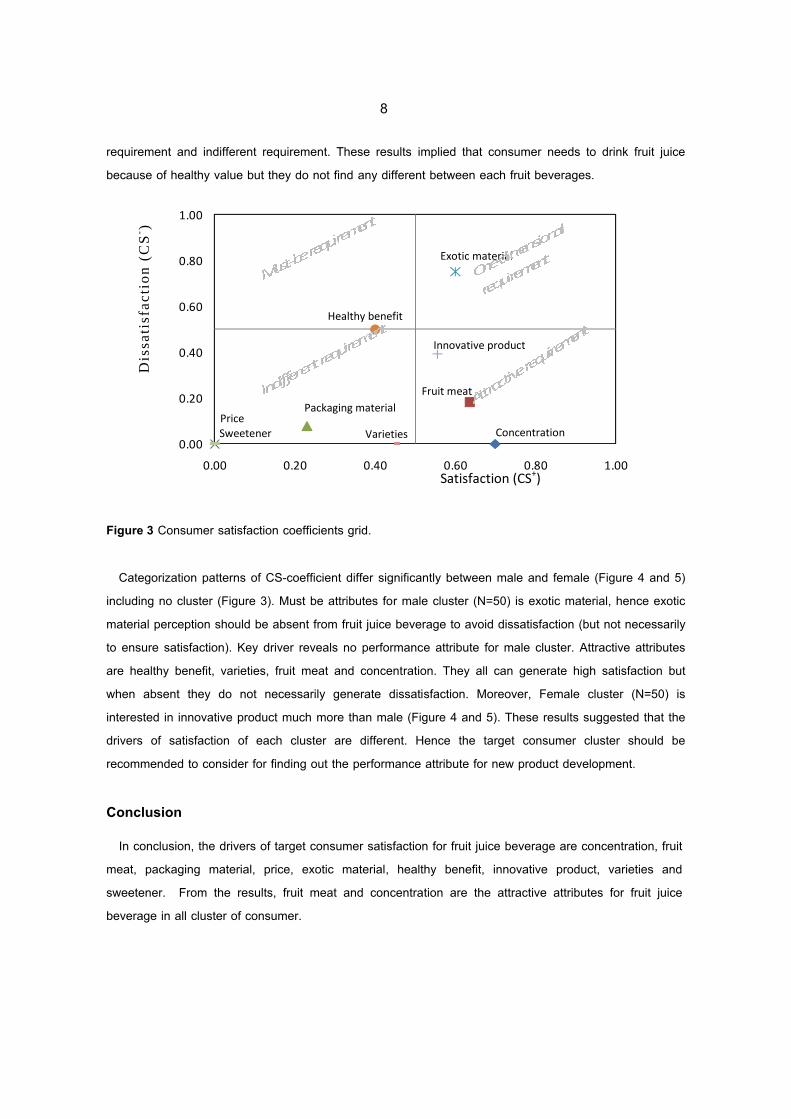
8 requirement and indifferent requirement. These results implied that consumer needs to drink fruit juice because of healthy value but they do not find any different between each fruit beverages.
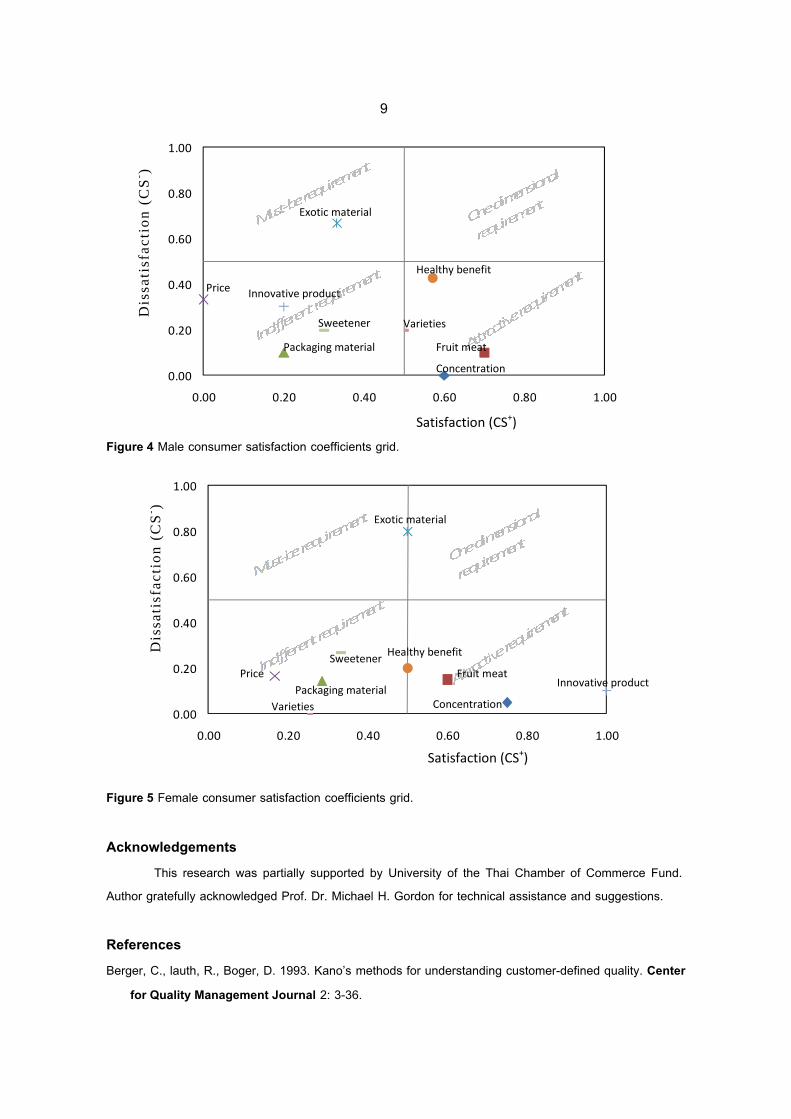
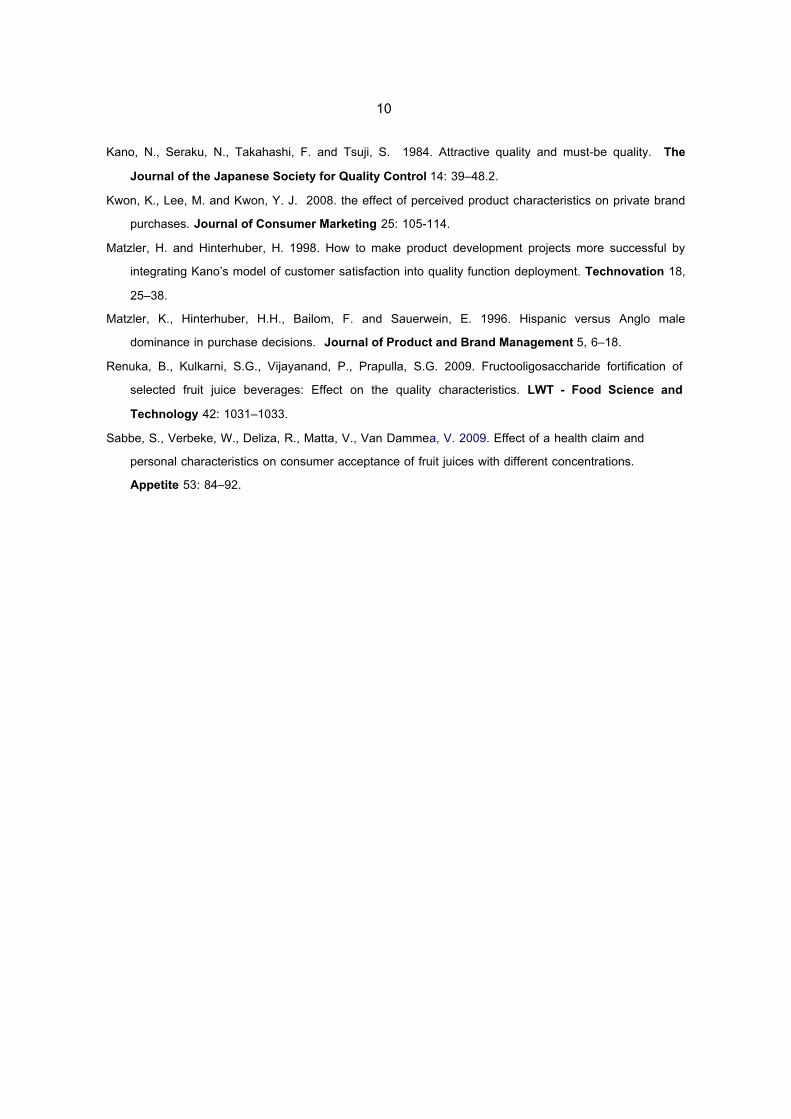
Figure 3 Consumer satisfaction coefficients grid. Categorization patterns of CS-coefficient differ significantly between male and female (Figure 4 and 5) including no cluster (Figure 3). Must be attributes for male cluster (N=50) is exotic material, hence exotic material perception should be absent from fruit juice beverage to avoid dissatisfaction (but not necessarily to ensure satisfaction). Key driver reveals no performance attribute for male cluster. Attractive attributes are healthy benefit, varieties, fruit meat and concentration. They all can generate high satisfaction but when absent they do not necessarily generate dissatisfaction. Moreover, Female cluster (N=50) is interested in innovative product much more than male (Figure 4 and 5). These results suggested that the drivers of satisfaction of each cluster are different. Hence the target consumer cluster should be recommended to consider for finding out the performance attribute for new product development. Conclusion In conclusion, the drivers of target consumer satisfaction for fruit juice beverage are concentration, fruit meat, packaging material, price, exotic material, healthy benefit, innovative product, varieties and sweetener. From the results, fruit meat and concentration are the attractive attributes for fruit juice beverage in all cluster of consumer. นีน
0.00
0.20
0.40
0.60
0.80
1.00
0.00 0.20 0.40 0.60 0.80 1.00
Concentration
Fruit meat
Innovative product
Exotic material
Healthy benefit
Packaging materialPriceSweetener Varieties
Satisfaction (CS+)
Dis
sati
sfac
tion
(C
S- )
9
Figure 4 Male consumer satisfaction coefficients grid. Figure 5 Female consumer satisfaction coefficients grid. Acknowledgements
This research was partially supported by University of the Thai Chamber of Commerce Fund. Author gratefully acknowledged Prof. Dr. Michael H. Gordon for technical assistance and suggestions. References Berger, C., lauth, R., Boger, D. 1993. Kano’s methods for understanding customer-defined quality. Center
for Quality Management Journal 2: 3-36.
0.00
0.20
0.40
0.60
0.80
1.00
0.00 0.20 0.40 0.60 0.80 1.00
Innovative product
Exotic material
Concentration
Fruit meat
Healthy benefit
Packaging material
Price
Sweetener Varieties
Satisfaction (CS+)
Dis
sati
sfac
tion
(C
S- )
0.00
0.20
0.40
0.60
0.80
1.00
0.00 0.20 0.40 0.60 0.80 1.00
Innovative product
Exotic material
Concentration
Fruit meat
Healthy benefit
Packaging materialPrice
Sweetener
Varieties
Satisfaction (CS+)
Dis
sati
sfac
tion
(C
S- )
10 Kano, N., Seraku, N., Takahashi, F. and Tsuji, S. 1984. Attractive quality and must-be quality. The
Journal of the Japanese Society for Quality Control 14: 39–48.2. Kwon, K., Lee, M. and Kwon, Y. J. 2008. the effect of perceived product characteristics on private brand
purchases. Journal of Consumer Marketing 25: 105-114. Matzler, H. and Hinterhuber, H. 1998. How to make product development projects more successful by
integrating Kano’s model of customer satisfaction into quality function deployment. Technovation 18, 25–38.
Matzler, K., Hinterhuber, H.H., Bailom, F. and Sauerwein, E. 1996. Hispanic versus Anglo male dominance in purchase decisions. Journal of Product and Brand Management 5, 6–18.
Renuka, B., Kulkarni, S.G., Vijayanand, P., Prapulla, S.G. 2009. Fructooligosaccharide fortification of selected fruit juice beverages: Effect on the quality characteristics. LWT - Food Science and Technology 42: 1031–1033.
Sabbe, S., Verbeke, W., Deliza, R., Matta, V., Van Dammea, V. 2009. Effect of a health claim and personal characteristics on consumer acceptance of fruit juices with different concentrations. Appetite 53: 84–92.