title: a comparative study of the wine fermentation ...digital.csic.es/bitstream/10261/19572/1/a...
TRANSCRIPT

Title: A comparative study of the wine fermentation performance of Saccharomyces
paradoxus under different nitrogen concentrations and glucose/fructose ratios
Authors:
Sandi Orlić 1,2*; F. Noé Arroyo-López 1; Katarina Huić-Babić 2; Iacumin Lucilla3;
Amparo Querol 4 and Eladio Barrio 1
Affiliations:
1Institut “Cavanilles” de Biodiversitat i Biologia Evolutiva. Universitat de València.
Edifici d’Instituts, Parc Científic de Paterna. P.O. Box 22085, E-46071 València, Spain.
2Department of Microbiology. Faculty of Agriculture. University of Zagreb.
Svetošimunska 25. 10 000 Zagreb, Croatia.
3 Dipartimento di Scienze degli Alimenti, Università degli Studi di Udine, via Sondrio
2, 33100 Udine, Italy
4Departamento de Biotecnología de Alimentos. Instituto de Agroquímica y Tecnología
de los Alimentos. CSIC. P.O. Box 73. E-46100 Burjassot, Valencia, Spain.
Running title: S. paradoxus wine fermentation performance
Corresponding author: Sandi Orlić, Department of Microbiology, Svetošimunska 25,
10 000 Zagreb, Croatia; tel. +38512394034; fax. +38512393881; email: [email protected]
1

Abstract 1
2
3
4
5
6
7
8
9
10
11
12
13
14
15
16
17
18
19
20
21
22
23
24
25
26
27
Aims: The main goal of the present study is to determine the effects of different
nitrogen concentrations and glucose/fructose ratios on the fermentation performance of
Saccharomyces paradoxus, a non-conventional species for wine making.
Methods and Results: Ethanol yield, residual sugar concentration, as well as glycerol
and acetic acid production were determined for diverse wine fermentations conducted
by S. paradoxus. Experiments were also carried out with a commercial S. cerevisiae
wine strain used as control. The values obtained were compared to test significant
differences by means of a factorial ANOVA analysis and the Scheffé test. Our results
show that S. paradoxus strain was able to complete the fermentation even in the non-
optimal conditions of low nitrogen content and high fructose concentration. In addition,
the S. paradoxus strain showed significant higher glycerol synthesis and lower acetic
acid production than S. cerevisiae in media enriched with nitrogen, as well as a lower,
but not significant, ethanol yield.
Conclusions: The response of S. paradoxus was different with respect to the
commercial S. cerevisiae strain, especially to glycerol and acetic acid synthesis.
Significance and Impact of the Study: The presented study has an important
implication for the implementation of S. paradoxus strains as new wine yeast starters
exhibiting interesting enological properties.
Keywords: Wine fermentation; Saccharomyces paradoxus; Saccharomyces cerevisiae;
nitrogen content; fructose; glycerol.
2

Introduction 28
29
30
31
32
33
34
35
36
37
38
39
40
41
42
43
44
45
46
47
48
49
50
51
52
Grape must is usually fermented by Saccharomyces cerevisiae strains, being the main
responsible of the quality and flavour of the final product (Pretorius 2000). Although S.
cerevisiae is the predominant species, S. bayanus var. uvarum has been described as
adapted to low-temperature fermentations during winemaking (Naumov et al. 2000).
Recently, Majdak et al. (2002) and Orlić et al. (2007) reported the possibility to use S.
paradoxus strains as starters in fermentation because of their excellent contribution to
the aroma of the wines. S. paradoxus is a widespread species usually present in natural
habitats (plants, insects, soils, etc) (Sweeney et al. 2004), but also in man-manipulated
environments, such as ‘pulque’, a Mexican traditional fermented beverage made with
Agave sap (originally described as S. carbajali; Ruiz 1938), and from Croatian
vineyards (Redžepović et al. 2002). It is worth noting that these S. paradoxus strains
isolated from fermentative environments exhibit physiological properties of
biotechnological interest (Redžepović et al. 2003; Belloch et al. 2008).
The nutritional requirements for Saccharomyces species to produce wines with
desirable organoleptic characteristics are relative high, and many factors have been
found to influence their growth and their metabolic capabilities, including sugar content,
temperature, aeration and nitrogen availability (Gardner et al. 1993; Bisson 1999;
D’Amato et al. 2006).
Sugar content is one of the most important factors during wine fermentation.
Grape must usually contain very similar amounts of glucose and fructose (Fleet and
Heard 1993), but in some ecological conditions and grape varieties, the proportion may
differ. As a consequence of the climatic change, fructose concentration in grapes is
increasing respect to glucose, affecting the global wine quality (Jones et al. 2005).
Although glucose and fructose are co-consumed by yeasts during wine fermentation,
3

Saccharomyces strains have a preference for glucose, which is usually consumed faster,
resulting in a reduction of the glucose/fructose ratio, and the preponderance of fructose
towards the end of fermentation (Fleet 1998; Berthels et al. 2004). During this phase of
fermentation, when nitrogen sources are consumed and ethanol concentrations are high,
some strains have difficulties to ferment the remaining fructose, resulting in slugged and
stuck fermentations (Bauer and Pretorius 2000).
53
54
55
56
57
58
59
60
61
62
63
64
65
66
67
68
69
70
71
72
73
74
75
76
77
Assimilable nitrogen content is another important factor that directly affects the
course of fermentation. Nitrogen deficiency may also lead to delayed or stuck
fermentations caused by low biomass yield (Bisson 1999; Varela et al. 2004). Nitrogen
is an important macronutrient that plays a major role in many of the functions and
processes carried out by yeasts. The intrinsic importance of nitrogen content on both
yeast growth and its metabolism is well known by winemakers. A minimal
concentration of 140 mg l-1 is often quoted as necessary for the fermentation of a must
with moderate sugar content (200 g l-1) (Bell and Henscke 2005). Moreover, the
concentration of assimilable nitrogen also influences the formation of volatile and non-
volatile compounds that are important for the organoleptic quality of the wine (Bell and
Henscke 2005; Hernández-Orte et al. 2006; Vilanova et al. 2007).
In recent years, there has been an increasing demand for wines with high
glycerol levels and reduced ethanol content. Glycerol is the major and the most
important non-volatile compound produced by yeasts in wines, and significantly
contributes to the wine quality by providing slight sweetness and fullness. It is
considered as the third major compound produced during wine fermentation after
ethanol and carbon dioxide. The amount of glycerol formed during fermentation by S.
cerevisiae is around one tenth of the amount of ethanol produced, and its concentrations
in wine varying between 1 and 10 g l-1 (Ough et al. 1972), although normal
4

concentrations are in the range 4-9 g l-1. Due to the favorable impact on wine quality,
glycerol production is one of the desirable features in wine yeast selection. Glycerol
production by yeast is affected by many growth and environmental factors (Gardner et
al. 1993; Remize et al. 2000). This metabolite is synthesized by yeasts in response to a
hyperosmotic medium.
78
79
80
81
82
83
84
85
86
87
88
89
90
91
92
93
94
95
96
97
98
99
100
101
Most fermentation requirements have been studied for S. cerevisiae but not for
other Saccharomyces species. The aim of the presented study is to determine the effect
of different concentrations of assimilable nitrogen and glucose/fructose ratios on the
fermentation performance and synthesis of ethanol, glycerol and volatile acidity (the
major compounds of wine fermentation) by S. paradoxus in a wine model system.
Materials and methods
Yeast strains and inocula preparation
Two yeast, a commercial S. cerevisiae wine strain (SOY51) and a S. paradoxus strain
(SOY54) isolated from Croatian vineyards, were used in the present study. Yeast
cultures were maintained on YEPG medium slopes (yeast extract 10 g l-1;
bacteriological peptone 10 g l-1; glucose 20 g l-1; agar 20 g l-1) at 4oC and transferred
monthly to fresh medium until fermentation experiments were carried out.
Starter cultures were prepared according to Wang et al. (2003) with slight
modifications. Briefly, one colony was transferred into 10 mL of a basal medium of 6.7
g l-1of Yeast Nitrogen Base (DifcoTM, Becton and Dickinson Company, Sparks, USA)
adjusted to pH 3·2 and supplemented with 50 g l-1 of glucose, and incubated at 30oC
overnight. Subsequently, yeast cells were harvested (1500 rpm x 15 min), washed three
5

times with 0·2 M phosphate buffer (pH 7·0), and resuspended into 3 ml of fermentation
medium. Experiments were inoculated at ≈ 5·0 log
102
103
104
105
106
107
108
109
110
111
112
113
114
115
116
117
118
119
120
121
122
123
124
125
126
10 CFU ml-1.
Experimental design and growth media
In this work, a complete factorial design resulting of the combination of 2 yeast strains
and 4 growth media was carried out in triplicate. Table 1 summarizes the total number
of treatments included in the experimental design. Fermentations were performed in a
synthetic must developed by Varela et al. (2004). Natural musts show a variable
composition from vintage to vintage that can influence the yeast growth. For this
reason, a defined synthetic must was chosen in this work as the most appropriate growth
medium to overcome this variation. In the present study, the basal must was modified
by adding aseptically different assimilable nitrogen concentrations in the form of amino
acids and ammonium salt (must S, 50 mg l-1; and must N, 300 mg l-1; for a complete
description of the different sources of nitrogen used see Varela et al. 2004) and
glucose/fructose ratios (must G, 100 g l-1glucose + 100 g l-1 fructose; must F, 80 g l-1
glucose + 120 g l-1 fructose). Fermentations were carried out at 18oC, which is a normal
temperature for white must fermentations, without shaking in 500 ml of must air fitted
with a side-arm port sealed with a rubber septum for sampling and closed with airlocks.
Experiments were monitorized during 900 h. At variable time intervals, must samples
were taken and diluted in a sterile saline solution and plated onto YEPG agar plates.
Then, plates were incubated aerobically at 25ºC for 48 h. Counts were expressed as
log10 CFU ml-1.
Chemical analysis
Final ethanol and volatile acidity productions, as well as the residual sugar content in
6

the must, were quantified according to the Official EU Methods for wine analysis (EC
2000). Glycerol was determined with an enzymatic/colorimetric commercial kit
especially designed for wines (Roche Applied Science, Mannheim, Germany) following
the
127
128
129
130
131
132
133
134
135
136
137
138
139
140
141
142
143
144
145
146
manufacturer's instructions.
The production of glycerol along the fermentative process was fit with the
reparameterized Gompertz equation proposed by Zwietering et al. (1990):
y = G*exp{-exp[((Gr*e)/G)*(λ-t))+1]} (1)
where y (dependent variable) is the glycerol concentration at time t, G is the maximum
glycerol production reached (g l-1), Gr is the maximum glycerol production rate (g h-1),
and λ is the lag phase period for glycerol production (h). The fit was accomplished
using the non-linear module of Statistica version 7.0 (Statsoft Inc, Tulsa, USA),
minimizing the sum of squares of the difference between experimental data and the
fitted model, i.e., loss function (observed-predicted)2. Fit adequacy was checked by the
proportion of variance explained by the model (R2) respect to experimental data.
Microbiological analysis
The microbial growth and decay observed in the different treatments was described by
the model developed by Peleg (1996) based on the continuous logistic equation (which
accounts for growth) on which a Fermi’s term (for decay) was superimposed. It has the
form:
)](exp[1)])(exp[1()(
00
cll
cgg
s
ttkttk
NNNtN
−+−+
−
=+
(2) 147
148
149
150
where N(t) is the number of yeasts at time t, N0 the initial number of yeasts, Ns the
maximum number that the environment can support, kg a growth rate constant, tcg a
characteristic time indicating the time required to reach half the environmental capacity
7

(i.e. N(tcg)/Ns = 0·5), kl a lethality or decline rate constant and tcl the time to reach 50%
survival. Since N
151
152
153
154
155
156
157
158
159
160
161
162
163
164
165
166
167
168
169
170
171
172
173
174
175
0 is usually known, the equation may be reduced to one with only five
adjustable parameters. To facilitate the fit at the normal plot of log10 CFU ml-1 vs time
used in microbiology, the log10 transformation at both sides of the equation was
achieved. This task was also accomplished using the non-linear regression module of
Statistica version 7.0.
Statistical data analysis
An analysis of variance was performed by means of the factorial ANOVA module of
Statistica software version 7.0, using “yeast strains” and “growth media” as categorical
predictor variables. Dependent variables introduced for the analysis were the maximum
glycerol production reached (G), the maximum glycerol rate production (Gr), the final
ethanol concentration produced (E), the maximum volatile acidity obtained (V), as well
as the growth\decay biological parameters estimated with the Peleg model (1996). To
check for significant differences between treatments and to form homogeneous group, a
post-hoc comparison test was applied by means of the Scheffe test, which is considered
to be one of the most conservative post-hoc tests (Winer 1962). An alternative
advantage of the Scheffé test is that it can also be used with unequal sample sizes. In
this way, when statistical significance is obtained in an ANOVA analysis (p ≤ 0·05), we
can reject the null hypothesis of no differences between means exist, and accept the
alternative hypothesis that the means are different from each other.
Results
Yeast growth/decay modeling
8

S. cerevisiae and S. paradoxus showed a first phase of growth, and subsequent decay,
during the 900 h that fermentations were monitorized. After the maximum population
was reached, the number of yeasts was progressively falling until no viable cells were
detected. This behavior could be well fitted by means of the Peleg model (1996),
obtaining diverse growth and decline biological parameters of yeast population in the
different media (Table 2). An example of this fit is shown in Figure 1 for both yeasts,
obtained using 10 samples (marked as circles in the figure) taken along the fermentative
process. The proportion of variance explained by the models (R
176
177
178
179
180
181
182
183
184
185
186
187
188
189
190
191
192
193
194
195
196
197
198
199
200
2), indicative of the fit
adequacy, was high and ranged from 94·5 to 99·6% (Table 2).
Growth rate (kg) and maximum yeast population obtained (Ns), both parameters
of the initial growth phase, depended on the media and yeasts tested, and diverse
homogenous groups were obtained according to the Scheffé test (see Table 2). Ns
ranged from 5·70 (S. cerevisiae yeast in SF must) to 8·30 log10 CFU ml-1 (S. paradoxus
in both NF and NG musts and S. cerevisiae in NG must), resulting both extreme values
statistically different. In general, there was a slight tendency in S. paradoxus to reach
higher population levels than S. cerevisiae in the different media (except in NG must
where values were exactly identical). Media enriched with higher initial nitrogen
concentrations (NG and NF musts) showed also higher Ns for both yeasts. For the
specific case of S. cerevisiae, those media with higher glucose concentrations (G)
showed higher Ns than media enriched with fructose (F) (comparing NG and SG respect
to NF and SF musts, respectively), but with no significant differences. However, for S.
paradoxus, there was not a clear relation of the influence of the glucose/fructose ratio
on this parameter.
The growth rate (that is the increase in the number of yeasts, in logarithmic
scale, per time unit) ranged from 0·021 h-1 for S. cerevisiae in SF must to 0·868 h-1 for
9

S. cerevisiae in SG must. It was very difficult to obtain any conclusions about the
influence of the yeast species or must type on this parameter, although three different
homogeneous groups were obtained after the post-hoc comparison. For S. paradoxus,
the highest k
201
202
203
204
205
206
207
208
209
210
211
212
213
214
215
216
217
218
219
220
221
222
223
224
225
g was obtained in NG must (enriched with nitrogen and a glucose/fructose
ratio of 1). However, for S. cerevisiae, the highest kg was obtained in SG must but with
values very similar to the NF must.
Finally, the decline rates (parameter of the decay phase) were very similar
among the different runs, and non-significant differences were found according to the
ANOVA analysis, ranged from 0·007 (S. paradoxus in NF must) until 0·013 h-1 (S.
cerevisiae in SG must). Therefore, the number of viable cells decreased more slowly for
S. paradoxus in NF must than for S. cerevisiae in SG must. Table 2 also shows the
values of time required to reach half the environmental capacity (included between 2·15
and 120·5 h) and time to reach 50% of survival (between 217·5 and 420·0 h). In the case
of tcg, no significant differences were found among treatments, but for tcl, three different
homogeneous were formed.
Glycerol production modeling
In this work, the production of glycerol along the fermentative process could also be
appropriately modeled, but in this case by means of the reparameterized Gompertz
equation proposed by Zwietering et al. (1990). A graphic example of the fit is depicted
in Figure 1 (marked with squared points), while the parameters obtained for the diverse
treatments are shown in Table 3.
The production of glycerol in synthetic must was composed by a first lag phase,
where the concentration did not increase, a second phase of intense production, and a
third phase where the maximum asymptote was reached and the glycerol concentration
10

226
227
228
229
230
231
232
233
234
235
236
237
238
239
240
241
242
243
244
245
246
247
248
249
250
remained stable. As can be seen in Figure 1, the maximum release of glycerol in must
occurred during the decay phase for both yeasts. Similar results were also found in the
other treatments (data not shown). The proportion of variance explained by the models
was high and ranged from 90·6 to 99·9% (Table 3).
The maximum production of glycerol obtained ranged from 3·76 (S. paradoxus
in SG must) to 6·84 g l-1 (S. paradoxus in NG must). Statistically, the production of
glycerol in S. paradoxus increased in those media with higher nitrogen levels (N).
However, for S. cerevisiae, the production of glycerol was not statistically influenced by
the type of must (Table 3). Apparently, for S. paradoxus the effect of glucose/fructose
ratio did not show influence on glycerol production. However, in the case of S.
cerevisiae, glycerol production slightly decreased in those fructose-enriched media (F),
but with no significant differences.
The glycerol production rate was influenced by the yeast species and type of
must used, and three different homogeneous groups were detected according to the
Scheffé test (Table 3). Glycerol production rates ranged from 0·009 g h-1 for S.
cerevisiae in NG must, to 0·031 g h-1 for S. paradoxus in SF must. S. paradoxus always
showed a higher glycerol production rate than S. cerevisiae in any must, except in NF,
in which S. cerevisiae and S. paradoxus rates were almost identical. In all cases, a lag
period was observed for the glycerol production (see Figure 1). This lag period ranged
from 7·79 h for S. cerevisiae in NG must to 252·07 h for S. paradoxus in SF must.
Influence of the must composition on other enological parameters
Table 4 shows the final alcohol, volatile acidity and residual sugar concentrations for
the different fermentations conducted by both yeast species. According to Table 4, the
final volatile acidity produced by S. paradoxus in all fermentations was statistically
11

lower than that produced by S. cerevisiae. Three different homogeneous groups were
obtained. One group formed by the fermentations performed with S. paradoxus (average
≈ 0·21 g l
251
252
253
254
255
256
257
258
259
260
261
262
263
264
265
266
267
268
269
270
271
272
273
274
275
-1), a second group including the fermentation conducted by S. cerevisiae in
NF must (0·76 g l-1), and a third group including the remaining S. cerevisiae
fermentations (average ≈1·09 g l-1).
The residual sugar concentration was very similar in all treatments, with no
significant differences among them. The average residual sugar concentration was 0·41
g l-1, indicating that the fermentative processes were finished in all cases. Finally, the
ethanol yield ranged from 10·7% for S. paradoxus in NG must to 12·1% for S.
cerevisiae in SG must. Not significant differences were found among the diverse
fermentations according to the ANOVA analysis (Table 4), although a slight tendency
to increase the ethanol yield was noticed in those fermentations performed by S.
cerevisiae (Table 4). In fact, the lowest yields were obtained in the NG and NF must
fermentations conducted by S. paradoxus.
Discussion
In this paper, we studied the effect that different nitrogen and fructose concentrations
had on the fermentative performance of S. paradoxus, a species of potential enological
interest (Orlić et al. 2007), in comparison to that of the classical wine species S.
cerevisiae. We compared the production of major wine compounds during fermentation
such as ethanol, glycerol and acetic acid.
S. paradoxus, the closest species to S. cerevisiae (Rokas et al. 2003), is not
usually isolated from wine environments (Rainieri et al. 2003), but Croatian wines
fermented by indigenous S. paradoxus strains isolated from vineyard showed good
enological properties, with a positive influence on final wine quality (Orlić et al. 2007).
12

In this study, S. paradoxus was able to finish the fermentation independently of the
initial nitrogen or fructose concentrations present in the must (100 and 120 g l
276
277
278
279
280
281
282
283
284
285
286
287
288
289
290
291
292
293
294
295
296
297
298
299
300
-1), which
is very important for the utilization of strains of this species as a starters in wine
fermentations. Our results confirm those obtained previously by Orlić et al. (2007) in
Chardonnay wine fermentations, where some S. paradoxus strains showed a
considerable fermentative vigour.
Nitrogen has been described as one of the major limiting yeast growth factors,
and assimilable nitrogen concentration around 140-150 mg l-1 has been reported to be
necessary to complete fermentation (Bell and Henscke 2005). Some authors have
reported that must with 60 mg l-1 of assimilable nitrogen achieve dryness (Wang et al.
2003; Beltran et al. 2005), but Varela et al. (2004) demonstrated that fermentations with
50 mg l-1 of nitrogen left 16 g l-1 of residual sugars. In this work, a total nitrogen
concentration of 50 mg l-1 was enough for S. paradoxus, as well as for S. cerevisiae, to
complete the fermentation with an initial sugar concentration of 200 g l-1. Wine yeast
strains have significantly different nitrogen requirements that are strain specific and
mostly appear during the stationary phase (Manginot et al. 1998). D’Amato et al.
(2006) reported that the maximum population of a S. cerevisiae strain in synthetic must
fermentations was attained at the higher ammonium concentrations assayed (270 mg l-
1). It is very interesting to notice that in this work S. paradoxus reached higher
population levels than S. cerevisiae practically in all conditions assayed. In fact, S.
paradoxus reached its highest population levels in media enriched with nitrogen, but
their values were not statistically different than those obtained for S. cerevisiae.
Glycerol represents a very important non-volatile compound for wine quality,
and from a technological point of view it is worth to get a better knowledge of the
influence of must components on glycerol production. The maximum production of
13

301
302
303
304
305
306
307
308
309
310
311
312
313
314
315
316
317
318
319
320
321
322
323
324
325
glycerol was obtained during the decay phase for both yeast species (Figure 1) in all
fermentation conditions. Possibly, glycerol is produced by yeasts at the early stage of
fermentation in response to osmotic pressure, but only is released during the last phase
of fermentation when occur the breakage of the cell wall due to cellular lysis or higher
membrane permeability. Apparently, nitrogen seems to have a significant influence on
the glycerol synthesis in S. paradoxus, which is not observed in the case of S.
cerevisiae. Glycerol formation is the results of redox balance and stress response
(Nevoigt and Stahl 1997) and the observed differences suggest that the two species
could have a different osmotic shock response, especially in presence of nitrogen. This
hypothesis is also supported by the final production of volatile acids (mainly acetic
acid), another significant redox-driven product, which was also different between S.
cerevisae and S. paradoxus. Clearly, S. cerevisiae produced higher concentrations of
acetic acid than S. paradoxus under all fermentation conditions.
Although ethanol yields in fermentations conducted by S. paradoxus were not
significantly different to those obtained with S. cerevisiae, we found that S. paradoxus
always produced lower ethanol concentrations than S. cerevisiae. In addition, for both
species, there was a slight tendency to produce higher ethanol levels in musts with
lower nitrogen content. These results are not in agreement with those obtained by
Vilanova et al. (2007), who observed higher ethanol yields in fermentations with 300
mg l-1 of nitrogen. However, under lower nitrogen concentrations yeast strains
metabolize amino acids as a nitrogen source and as a mechanism for NAD(P)H
reoxidation (Valero et al. 2003). D’Amato et al. (2006) determined that an excess of
ammonium could also lead to a modification of the aromatic profile of wines. The
reason could be that under these conditions yeasts do not need to metabolize amino
acids, and hence, a lower production of higher alcohols and their esters is obtained.
14

326
327
328
329
330
331
332
333
334
335
336
337
338
339
340
341
342
343
344
345
346
347
348
349
Conclusions
This is the first study carried out to evaluate the fermentative performance of S.
paradoxus under different nitrogen levels and glucose/fructose ratios in a wine model
system. In the present work, we have found that a S. paradoxus strain isolated from
vineyards possess enological properties of interest for the wine industry, such as
significant higher synthesis of glycerol and lower production of volatile acidity than S.
cerevisiae. These properties together with their excellent behavior under the typical
stresses present in fermentation environments and an excellent contribution to the
aromatic fraction of wines makes them an alternative to S. cerevisiae as wine starters
according to the current winemaking trends.
Acknowledgements
This work was funded by Croatian Ministry of Science, Education and Sports (grant
number 178-0580477-2130) and by the Spanish Ministry of Science and Innovation
(MICINN) (projects AGL2006-12703-CO2-01/ALI and 02/ALI). F.N. Arroyo-López
(‘Juan de la Cierva’ program) and Sandi Orlić, thank to the Ministry of Education and
Science of Spain (MEC) for their respective postdoctoral research contracts.
References
Bauer, F.F. and Pretorius, I.S. (2000) Yeast stress response and fermentation efficiency:
how to survive the making of wine – A review. S Afr J Enol Vitic 21, 27-51.
Bell, S.J. and Henscke, P.A. (2005) Implication of nitrogen nutrition for grapes,
fermentation and wine. Aust J Grape Wine Res 11, 242-295.
15
350
351
352
353
354
355
356
357
358
359
360
361
362
363
364
365
366
367
368
369
370
371
372
373
Belloch, C., Orlić, S., Barrio, E. and Querol, A. (2008) Fermentative stress adaptation of
hybrids within the Saccharomyces sensu stricto complex. Int J Food Microbiol 122,
188-195.
Beltrán, G., Esteve-Zarzoso, B., Rozès, N., Mas, A. and Guillamón, J.M. (2005)
Influence of timing of nitrogen additions during synthetic grape must fermentations
on fermentation kinetics and nitrogen consumption. J Agri Food Chem 53, 996-
1002.
Berthels, N.J., Cordero-Otero, R.R., Bauer, F.F., Thevelein, J.M. and Pretorius, I.S.
(2004) Discrepancy in glucose and fructose utilization during fermentation by
Saccharomyces cerevisiae wine yeast strains. FEMS Yeast Research 4, 683-689.
Bisson, L.F. (1999) Stuck and sluggish fermentation. Am J Enol Viticul 50, 107-119.
D’Amato, D., Corbo, M.R., Del Nobile, M.A. and Sinigaglia, M. (2006) Effects of
temperature, ammonium and glucose concentrations on yeast growth in a model
wine system. Int J Food Sci Technol 41, 1152-1157.
EC. (2000) Community reference methods for the analysis of spirit drinks. Official
Journal of the European Community. Brussels. Reg EC No 2870/00. December 19.
Fleet, G.H. and Heard, G.M. (1993) Yeasts – growth during fermentation. Wine
Microbiology and Biotechnology (Fleet GH, ed). pp. 27-54. Harwood Academic
Publishers GmbH, Chur.
Fleet, G.H. (1998) The microbiology of alcoholic beverages. Microbiology of fermented
foods (Wood, B.J.B., ed). pp. 217-262. Blackie, Glasgow.
Gardner, N., Rodrigue, N. and Champagne, C.P. (1993) Combined effects of sulfites,
temperature and agitation time on production of glycerol in grape juice by
Saccharomyces cerevisiae. Appl Environ Microbiol 59, 2022-2028.
16

374
375
376
377
378
379
380
381
382
383
384
385
386
387
388
389
390
391
392
393
394
395
396
397
Hernández-Orte, P., Bely, M., Cacho, J. and Ferreira, V. (2006) Impact of ammonium
additions on volatile acidity, ethanol, and aromatic compounds produced by
different Saccharomyces cerevisiae strains during fermentation in controlled
synthetic media. Aust J Grape Wine Res 12, 150-160.
Jones, G.V., White, M.A., Cooper, O.R. and Storchmann, K. (2005) Climate change
and global wine quality. Climatic Change 73, 319-343.
Majdak, A., Herjaveć, S., Orlić, S., Redžepović, S. and Mirosević, N. (2002)
Comparison of wine aroma compounds produced by Saccharomyces paradoxus and
Saccharomyces cerevisiae strains. Food Technol Biotechnol 40, 103-109.
Manginot, C., Roustan, J.L. and Sablayrolles, J.M. (1998) Nitrogen demand of different
yeast strains during alcoholic fermentation. Importance of stationary phase. Enzyme
Microb Technol 23, 511-517.
Naumov, G.I., Masneuf, I., Naumova, E.S., Aigle,M. and Dubourdieu, D. (2000)
Association of Saccharomyces bayanus var. uvarum with some French wines:
genetic analysis of yeast populations. Res Microbiol 151, 683-691.
Nevoigt, E. and Stahl, U. (1997) Osmoregulation and glycerol metabolism in the yeast
Saccharomyces cerevisiae. FEMS Microbiol Rev 21, 231-234.
Orlić, S., Redžepović, S., Jeromel, A., Herjaveć, S. and Iacumin, L. (2007) Influence of
indigenous Saccharomyces paradoxus strains on Chardonnay wine fermentation
aroma. Int J Food Sci Technol 42, 95-101.
Ough, C.S., Fong, D. and Amerine, M.A. (1972) Glycerol in wine: determination and
some factors affecting. Am J Enol Vitic 23, 1-5.
Peleg, M. (1996) A model of microbial growth and decay in a closed habitat based on a
combined Fermi’s and the logistic equations. J Sci Food Agri 71, 225-230.
17

398
399
400
401
402
403
404
405
406
407
408
409
410
411
412
413
414
415
416
417
418
419
420
421
422
Pretorius, I.S. (2000) Tailoring wine yeast for the new millennium: novel approaches to
the ancient art of winemaking. Yeast 16, 675-729.
Rainieri, S., Zambonelli, C. and Kaneko, Y. (2003) Saccharomyces sensu stricto:
systematics, genetic diversity and evolution. J Biosci Bioeng 96, 1-9.
Redžepović, S., Orlić, S., Sikora, S., Majdak, A. and Pretorius, I.S. (2002)
Identification and characterization of Saccharomyces paradoxus and
Saccharomyces cerevisiae strains from Croatian vineyards. Lett Appl Microbiol 35,
305-310.
Redžepović, S., Orlić, S., Majdak, A., Kozina, B., Volschenk, H. and Viljoen-Bloom,
M. (2003) Differential malic acid degradation by selected strains of Saccharomyces
during alcohol fermentation. Int J Food Microbiol 83, 49-61.
Remize, F., Sablayrolles, J.M. and Dequin, S. (2000) Re-assessment of the influence of
yeast strain and environmental factors on glycerol production in wine. J Appl
Microbiol 88, 371-378.
Rokas, A., Williams, B.L., King, N. and Carroll, S.B. (2003) Genome-scale approaches
to resolving incongruence in molecular phylogenies. Nature 425, 798-804.
Ruiz, M. (1938) Contribución al conocimiento de las levaduras del aguamiel y del
pulque. I. Saccharomyces carbajali. An Inst Biol Univ Nac Auton Mex 9, 47-80.
Sweeney, J.Y., Kuehne, H.A. and Sniegowski, P.D. (2004) Sympatric natural
Saccharomyces cerevisiae and S. paradoxus populations have different thermal
growth profiles. FEMS Yeast Res 4, 521-525.
Valero, E., Millán, C., Ortega, J.M. and Mauricio, J.C. (2003) Concentration of amino
acids in wine after the end of fermentation by Saccharomyces cerevisiae strains. J
Sci Food Agri 83, 830-835.
Varela, C., Pizarro, F. and Agosin, A. (2004) Biomass content governs fermentation rate
18

in nitrogen-deficient wine musts. Appl Environ Microbiol 70, 3392-3400. 423
424
425
426
427
428
429
430
431
432
433
434
435
Vilanova, M., Ugliano, M., Varela, C., Siebert, T., Pretorius, I.S. and Henschke, P.A.
(2007) Assimilable nitrogen utilization and production of volatile and non-volatile
compounds in chemically defined medium by Saccharomyces cerevisiae wine
yeasts. Appl Microbiol Biotechnol 77, 145-157.
Wang, X.D., Bohlscheid, J.C. and Edwards, C.G. (2003) Fermentative activity and
production of volatile compounds by Saccharomyces cerevisiae grown in synthetic
grape juice media deficient in assailable nitrogen and/or pantothenic acid. J Appl
Microbiol 94, 249-359.
Winer, B.J. (1962) Statistical principles in experimental design. McGraw-Hill. New
York.
Zwietering, M.H., Jongerburger, I., Rombouts, F.M. and Van’t Riet, K. (1990)
Modeling of the bacteria growth curve. Appl Environ Microbiol 56, 1875-1881.
19
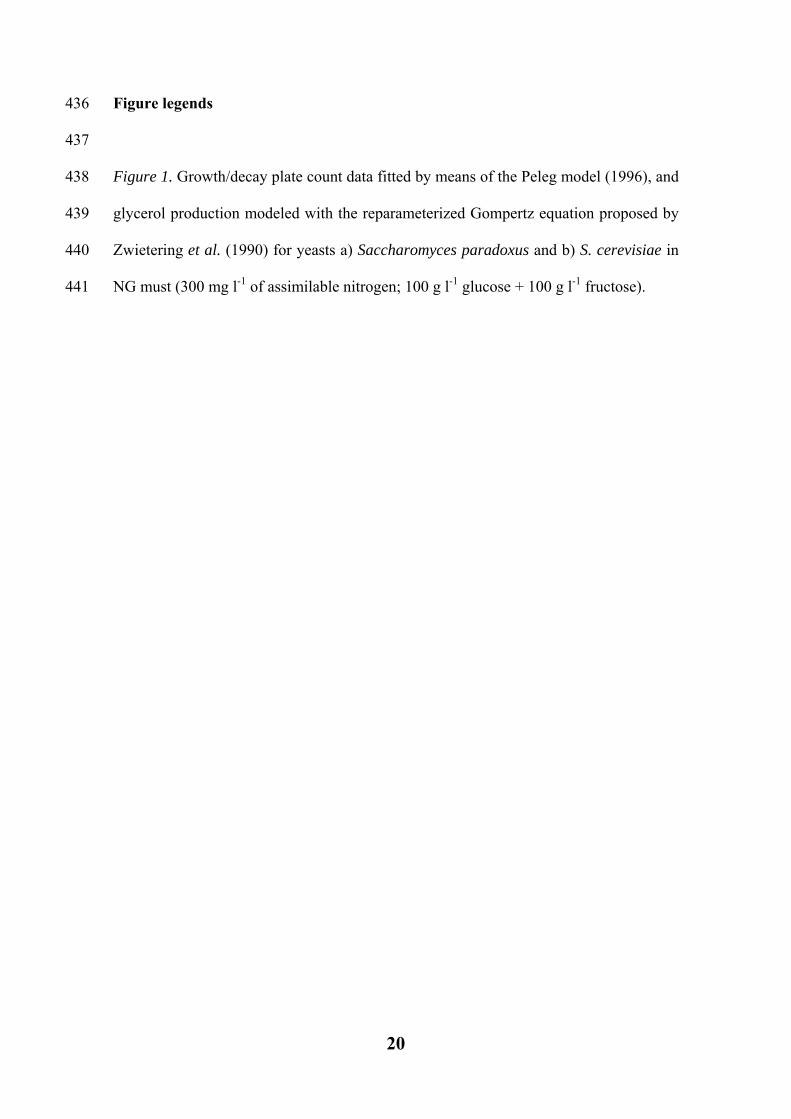
Figure legends 436
437
438
439
440
441
Figure 1. Growth/decay plate count data fitted by means of the Peleg model (1996), and
glycerol production modeled with the reparameterized Gompertz equation proposed by
Zwietering et al. (1990) for yeasts a) Saccharomyces paradoxus and b) S. cerevisiae in
NG must (300 mg l-1 of assimilable nitrogen; 100 g l-1 glucose + 100 g l-1 fructose).
20

Table 1. Fermentations included in the factorial experimental design (2 yeast strains x 4
musts) used in the present work.
Treatment code Yeast strains Must composition
Sp – NG S. paradoxus SOY54 300 mg l-1 of assimilable nitrogen
100 g l-1 glucose + 100 g l-1 fructose
Sp – NF S. paradoxus SOY54 300 mg l-1 of assimilable nitrogen
80 g l-1 glucose + 120 g l-1 fructose
Sp – SG S. paradoxus SOY54 50 mg l-1 of assimilable nitrogen
100 g l-1 glucose + 100 g l-1 fructose
Sp – SF S. paradoxus SOY54 50 mg l-1 of assimilable nitrogen
80 g l-1 glucose + 120 g l-1 fructose
Sc – NG S. cerevisiae SOY51 300 mg l-1 of assimilable nitrogen
100 g l-1 glucose + 100 g l-1 fructose
Sc – NF S. cerevisiae SOY51 300 mg l-1 of assimilable nitrogen
80 g l-1 glucose + 120 g l-1 fructose
Sc – SG S. cerevisiae SOY51 50 mg l-1 of assimilable nitrogen
100 g l-1 glucose + 100 g l-1 fructose
Sc – SF S. cerevisiae SOY51 50 mg l-1 of assimilable nitrogen
80 g l-1 glucose + 120 g l-1 fructose
21

Table 2. Growth/decay biological parameters obtained by means of the Peleg model
(1996) for the different fermentations.
Treatment
code†
R2 Ns kg tcg kl tcl
Sp – NG 0·977
(0·002)
8·300a
(0·424)
0·708b,c
(0·016)
24·190a
(0·113)
0·009a
(0·001)
292·600a,b,c
(20·85)
Sp – NF 0·945
(0·000)
8·300a
(0·000)
0·098a
(0·007)
23·015a
(1·407)
0·007a
(0·000)
358·620a,b,c
(2·559)
Sp – SG 0·986
(0·009)
7·300b,d
(0·141)
0·177a
(0·010)
54·925a
(0·247)
0·009a
(0·002)
420·010c
(3·464)
Sp – SF 0·987
(0·001)
7·700a,b
(0·141)
0·340a,c
(0·073)
58·740a
(0·141)
0·010a
(0·000)
395·615a,c
(1·576)
Sc – NG 0·977
(0·017)
8·300a
(0·141)
0·699b,c
(0·164)
23·460a
(0·110)
0·012a
(0·001)
266·520a,b
(30·197)
Sc – NF 0·988
(0·002)
7·700a,b
(0·141)
0·864b
(0·081)
23·635a
(0·007)
0·012a
(0·001)
262·875a,b
(5·154)
Sc – SG 0·980
(0·022)
6·400c,d
(0·141)
0·868b
(0·070)
2·155a
(0·219)
0·013a
(0·003)
217·545b
(3·330)
Sc – SF 0·996
(0·003)
5·700c
(0·141)
0·021a
(0·009)
120·57a
(90·990)
0·009a
(0·001)
359·885a,c
(71·721)
† Yeast species and types of musts for the different fermentations are shown in Table 1. Note: Ns, maximum number of yeasts (log10 CFU ml-1) that the fermentation environment can support; kg, growth rate constant (h-1); tcg, time (h) required to reach half the environmental capacity (Ntcg/Ns=0·5); kl, lethality or decline rate constant (h-1); tcl, time to reach 50% survival (h). R2, proportion of variance explained by the models. Values followed by different superindexes, within the same column, are significantly different according to Scheffé test. Standard deviations are given between parentheses.
22
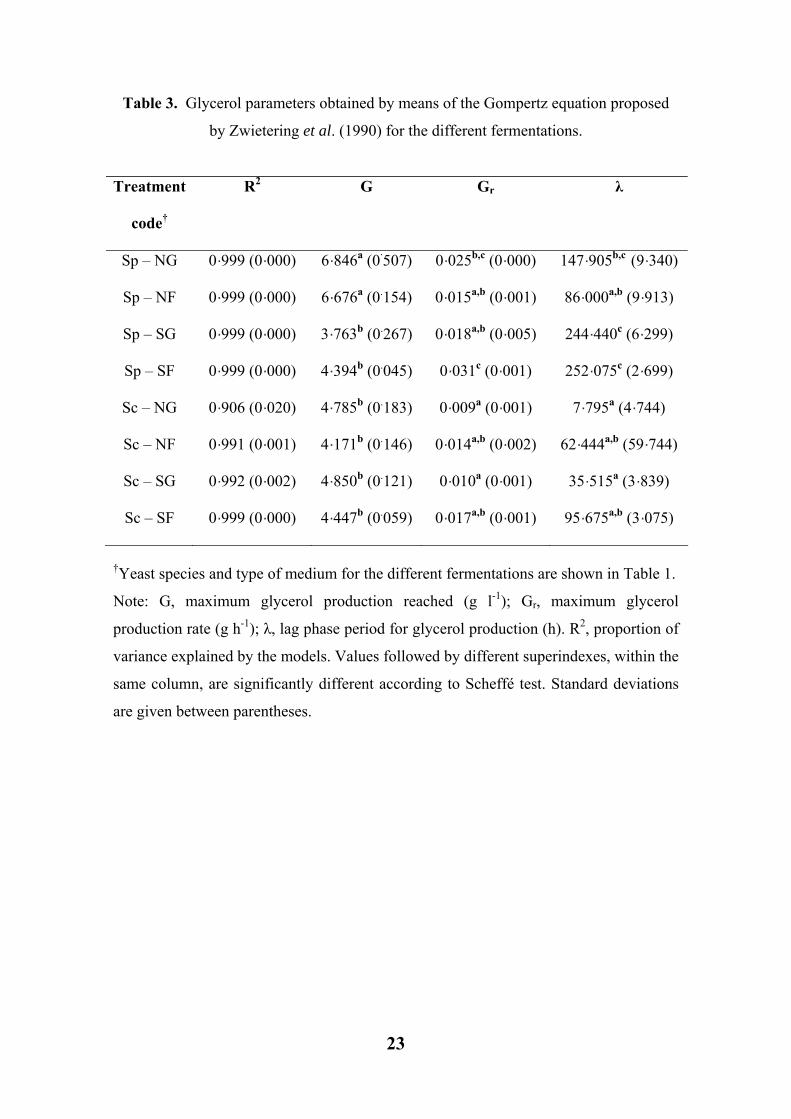
Table 3. Glycerol parameters obtained by means of the Gompertz equation proposed
by Zwietering et al. (1990) for the different fermentations.
Treatment
code†
R2 G Gr λ
Sp – NG 0·999 (0·000) 6·846a (0·507) 0·025b,c (0·000) 147·905b,c (9·340)
Sp – NF 0·999 (0·000) 6·676a (0.154) 0·015a,b (0·001) 86·000a,b (9·913)
Sp – SG 0·999 (0·000) 3·763b (0.267) 0·018a,b (0·005) 244·440c (6·299)
Sp – SF 0·999 (0·000) 4·394b (0.045) 0·031c (0·001) 252·075c (2·699)
Sc – NG 0·906 (0·020) 4·785b (0.183) 0·009a (0·001) 7·795a (4·744)
Sc – NF 0·991 (0·001) 4·171b (0.146) 0·014a,b (0·002) 62·444a,b (59·744)
Sc – SG 0·992 (0·002) 4·850b (0.121) 0·010a (0·001) 35·515a (3·839)
Sc – SF 0·999 (0·000) 4·447b (0.059) 0·017a,b (0·001) 95·675a,b (3·075)
†Yeast species and type of medium for the different fermentations are shown in Table 1.
Note: G, maximum glycerol production reached (g l-1); Gr, maximum glycerol
production rate (g h-1); λ, lag phase period for glycerol production (h). R2, proportion of
variance explained by the models. Values followed by different superindexes, within the
same column, are significantly different according to Scheffé test. Standard deviations
are given between parentheses.
23

Table 4. Final production of alcohol (%), volatile acidity (g l-1) and residual sugars (g
l1) for the different fermentations.
Treatment code† Alcohol Volatile acidity Residual sugar
Sp – NG 10·70 (0·28)a 0·230 (0·030)a 0·333 (0·057)a
Sp – NF 10·82 (0·84)a 0·140 (0·020)a 0·433 (0·057)a
Sp – SG 11·35 (0·08)a 0·290 (0·030)a 0·466 (0·057)a
Sp – SF 11·60 (0·00)a 0·176 (0·005)a 0·366 (0·057)a
Sc – NG 11·15 (0·08)a 1·140 (0·040)b 0·400 (0·100)a
Sc – NF 11·60 (0·43)a 0·766 (0·057)c 0·400 (0·100)a
Sc – SG 12·10 (0·14)a 1·066 (0·057)b 0·466 (0·057)a
Sc – SF 11·70 (0·28)a 1·072 (0·017)b 0·433 (0·057)a
†Yeast species and type of medium for the different fermentations are shown in Table 1.
Note: Values followed by different superindexes, within the same column, are
significantly different according to Scheffé test. Standard deviations are given between
parentheses.
24