titan company limited fy 18-19 investor presentation.pdfjewellery brands tanishq: flagship brand...
TRANSCRIPT

Titan Company Limited Delivering value by creating brands Earnings Presentation – Q1 FY ’19 (For quarter ended 30th June, 2018) 03rd August, 2018
1

Disclaimer
Certain statements are included in this release which contain words or phrases such as “will,” “aim,” “will likely result,” “believe,” “expect,” “will continue,” “anticipate,” “estimate,” “intend,” “plan,” “contemplate,” “seek to,” “future,” “objective,” “goal,” “project,” “should,” “will pursue” and similar expressions or variations of these expressions that are “forward-looking statements.” Actual results may differ materially from those suggested by the forward-looking statements due to certain risks or uncertainties associated with our expectations with respect to, but not limited to, our ability to implement our strategy successfully, the market acceptance of and demand for our products, our growth and expansion, the adequacy of our allowance for credit to franchisees, dealers and distributors, technological changes, volatility in income, cash flow projections and our exposure to market and operational risks. By their nature, certain of the market risk disclosures are only estimates and could be materially different from what may actually occur in the future. As a result, actual future gains, losses or impact on net income could materially differ from those that have been estimated.
In addition, other factors that could cause actual results to differ materially from those estimated by the forward-looking statements contained in this document include, but are not limited to: general economic and political conditions in India and the other countries which have an impact on our business activities; inflation, unanticipated turbulence in interest rates, foreign exchange rates, the prices of raw material including gold and diamonds, or other rates or prices; changes in Indian and foreign laws and regulations, including tax and accounting regulations; and changes in competition and the pricing environment in India. The Company may, from time to time make additional written and oral forward-looking statements, including statements contained in the Company’s filings with SEBI and the Stock Exchanges and our reports to shareholders. The Company does not undertake to update any forward-looking statements that may be made from time to time by or on behalf of the Company, to reflect events or circumstances after the date thereof.
2

3
The Journey
1984
Conceived 1987
1992
Timex JV 1996
1998
2003
2005
PED 2007
2008
2009
2010
Accessories
2016
2013
Perfumes
2011

4
Titan Today
5th
largest watch
maker globally
~$11 bn market cap
~$2.5 bn annual revenue
11k+
mutli-brand outlets
that sells our watches
~8 k
employees on rolls
~1,600
stores with 2mn sft
retail space
4
times in Forbes
Asia Fab Fifty
Note: Above figures are on consolidated basis for Q1 ‘19 ending 30th Jun’18.

5
Our Strengths
Design and Development 800+ New time products every year
reddot Award to 2 Edge watches
Differentiated Jewellery Collections
Customized lenses with 3D visual mapping
Retail and Customer Service Exceptional Customer Experience
Merchandising Effectiveness
Impactful Retail Identities
Engagement of store staff
Extensive After Sales Service network
Manufacturing 12 Manufacturing and assembly facilities
State of the art Karigar Centres for Jewellery
Components exported to Swiss watch makers
3600+ employees engaged in factories
Brand Building Tanishq: India’s leading Jewellery brand
Titan: Our flagship watch brand
Raga: Exclusive women’s watch brand
Fastrack: India’s largest youth brand
Sonata: India’s largest selling watch brand

Our Brands
Luxury
Premium
Mid Market
Mass Market
6

Our Retail Network
Luxury
Premium
Mid Market
(3)
(263)
(497)
(73)
(39) (39) (509)
(173)
~1,600 Exclusive Stores 278 Towns ~2 mn sq ft of retail space
Note: 1. We also have a service network of 730 ‘Watch Care Centres’ 2. Helios is our own Multi Brand Outlet (MBO) and rest others are our Exclusive Business Outlets (EBO) 3. Store count comprises of both company owned and franchisee stores.
7

Watches - Overview
Brands 6 major in-house brands & 6 licensed brands
Customer Service Largest network of exclusive service centers
730 watch care centers in 277 towns
Manufacturing 5 state of the art, watch and component
manufacturing/assembly plants
Points of Sale EBO: World of Titan, Fastrack Stores
OWN MBO: Helios
MBO: present across 11k+ dealers/ MBOs
LFS: Large format departmental stores
ECOM: www.titan.co.in , www.fastrack.in and market
places
EXPORTS: 2,264 POS in 33 countries
Sophisticated Design & Development Core strength: Industrial, Retail and Graphic design
Numerous international award-winning designs
8
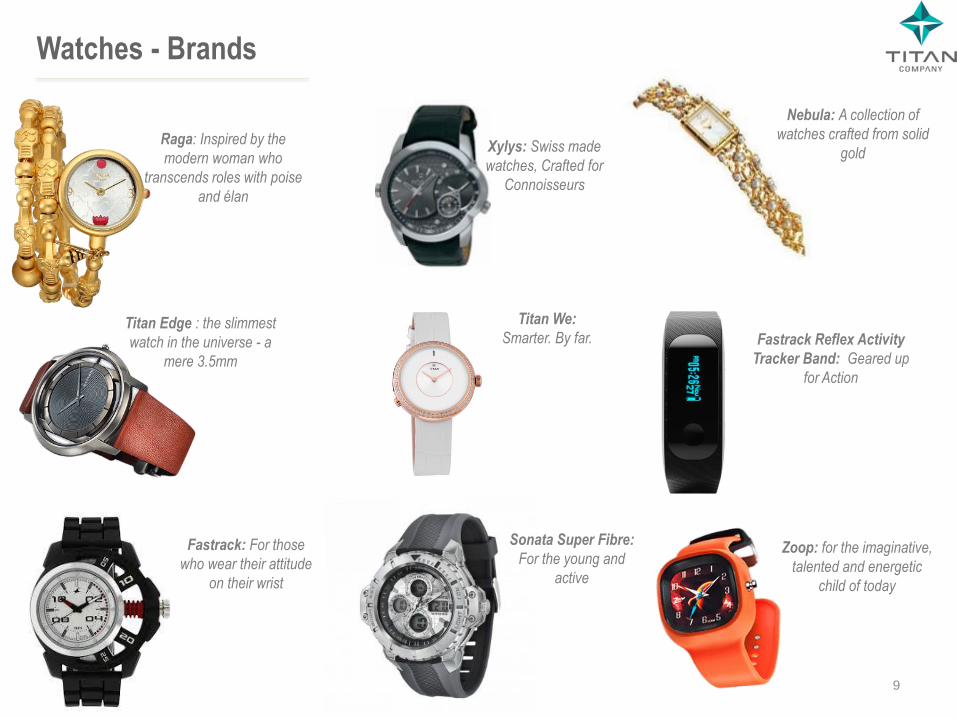
Titan Edge : the slimmest
watch in the universe - a
mere 3.5mm
Nebula: A collection of
watches crafted from solid
gold
Zoop: for the imaginative,
talented and energetic
child of today
Xylys: Swiss made
watches, Crafted for
Connoisseurs
Fastrack: For those
who wear their attitude
on their wrist
Sonata Super Fibre:
For the young and
active
Watches - Brands
Raga: Inspired by the
modern woman who
transcends roles with poise
and élan
Fastrack Reflex Activity
Tracker Band: Geared up
for Action
Titan We:
Smarter. By far.
9

• Hosur
Pantnagar
Roorkee
Manufacturing/ Assembly
facilities
• Coimbatore
Watch factory, Hosur
Watch Assembly, Hosur
Pantnagar factory
Watches - Manufacturing
• Sikkim
10

Singapore - 77
Malaysia- 158
Thailand- 66
Pakistan- 32
Sri Lanka- 74
Bangladesh - 135
Maldives - 15
Nepal - 45
Fiji- 4
Vietnam- 133
UAE- 146
Oman - 134
Saudi Arabia - 642
Qatar - 58
Bahrain - 60
Kuwait - 41
Mauritius- 17 Kenya - 23
Iran- 41
Ethiopia – 11
Uganda - 15 Djibouti - 1
Nigeria- 10
Ghana - 5
Yemen - 15
Philippines- 60
South Africa- 70
Myanmar-10
Russia- 100
Indonesia - 50
2,264 Outlets
33 Countries
Watches - International Presence
Titan Watches are sold in USA through ecommerce partners 11

WORLD OF TITAN
496 showrooms (Net 10 addition in Q1 FY’19)
226 towns – 419k sq ft
12

FASTRACK STORES
173 showrooms (Net 7 additions in Q1 FY ‘19)
88 towns – 95k sft
13

HELIOS STORES
72 showrooms (Net 3 additions in Q1 FY ‘19)
35 towns – 68k sft
14

15

Jewellery
Brands TANISHQ: flagship brand
ZOYA: luxury segment play
MIA: Tanishq sub-brand for faishonable fine jewellery
CARATLANE: a Tanishq partnership
Manufacturing Studded jewellery manufactured mostly in-house
Plain gold jewellery mostly outsourced
3 manufacturing facilities
4 state of the art karigar centers: Industry best practice
Points of Sale Largest jewellery retailer in the country
Jewellery sales through EBO and ecommerce
EBO: Tanishq, Zoya, Mia, Caratlane
Ecommerce: www.titan.co.in and www.caratlane.com
Design Excellence Key product differentiator
Capability for in-house design of many collections
16

17
Jewellery

• Hosur
Pantnagar
Manufacturing Facilities/ Karigar Centers
Karigar Center, Hosur Jewellery
• Sikkim
18

Tanishq Stores
262 showrooms of Tanishq. 3 Zoya stores.
Net 10 Tanishq stores added in Q1 FY’19, (24k sq ft added in Q1 FY‘19)
173 towns – 1.02 mn sft of Tanishq 19

Mia Stores
39 stores across 13 cities (~7k sq ft)
20

Carat Lane Stores
39 showrooms across 13 towns (~29k sq ft)
21

22
View Advertisement

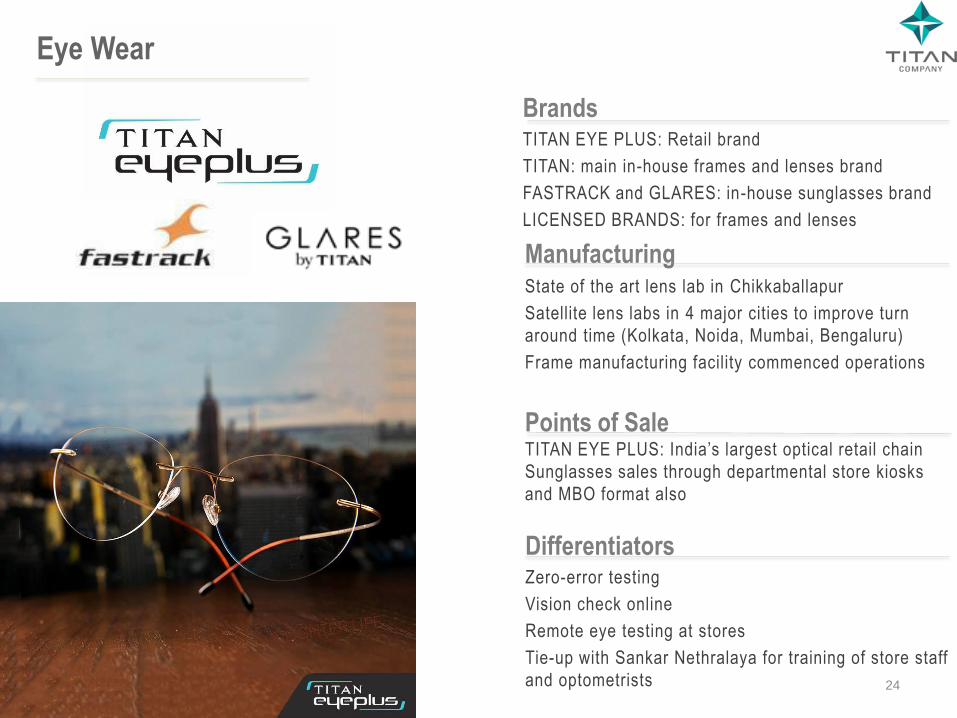
Eye Wear
Brands TITAN EYE PLUS: Retail brand
TITAN: main in-house frames and lenses brand
FASTRACK and GLARES: in-house sunglasses brand
LICENSED BRANDS: for frames and lenses
Manufacturing State of the art lens lab in Chikkaballapur
Satellite lens labs in 4 major cities to improve turn
around time (Kolkata, Noida, Mumbai, Bengaluru)
Frame manufacturing facility commenced operations
Points of Sale TITAN EYE PLUS: India’s largest optical retail chain
Sunglasses sales through departmental store kiosks
and MBO format also
Differentiators Zero-error testing
Vision check online
Remote eye testing at stores
Tie-up with Sankar Nethralaya for training of store staff
and optometrists
24
Eye Wear
25
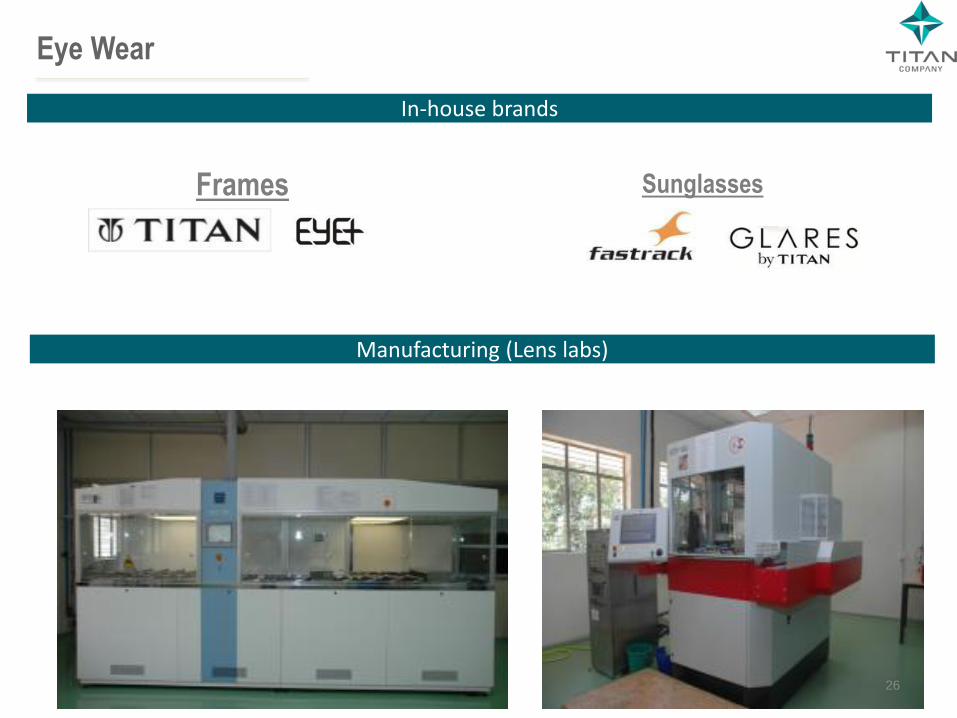
Frames
Sunglasses
Eye Wear
In-house brands
Manufacturing (Lens labs)
26
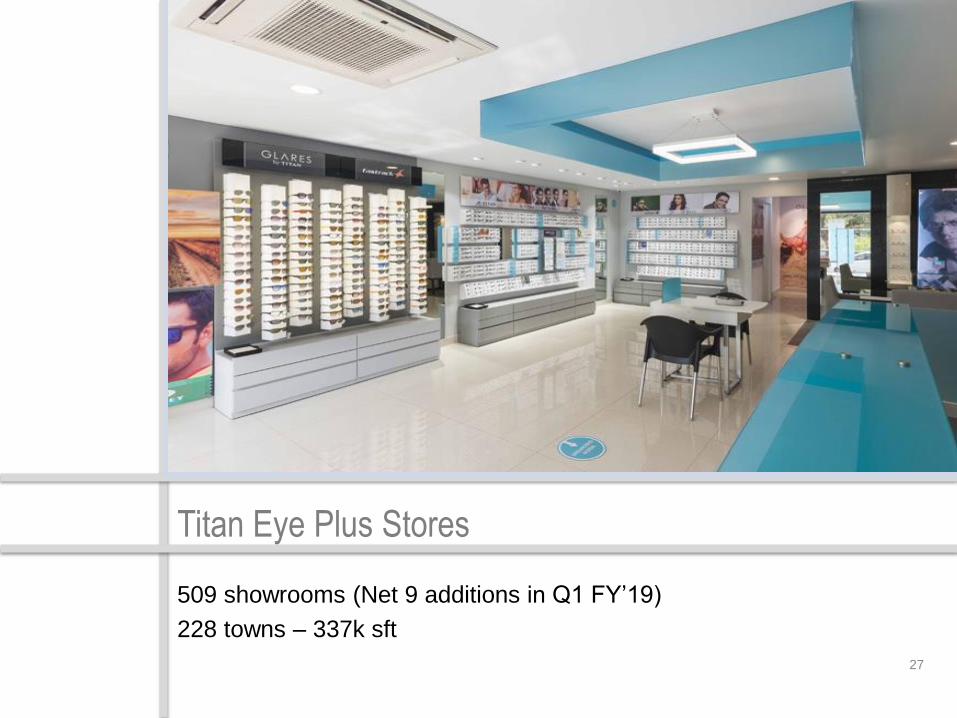
Titan Eye Plus Stores
509 showrooms (Net 9 additions in Q1 FY’19)
228 towns – 337k sft
27

28

Fragrances
Brands SKINN by Titan
Fine French perfumes at very attractive price points
Entry into body mist category in FY 18- Skinn Kissed
Manufacturing Manufactured in France by celebrated perfumers, and
distilled from the finest ingredients
Bottled in France and India
Points of Sale Sold through World of Titan Channel, key
departmental store chains and Ecommerce
One of the highest selling perfumes in all
departmental stores
Plans to strengthen the distribution further in the
coming year
Packaging innovations for trial and gifting
Differentiators Exceptional fragrances at a very attractive price point
Similar products from international competition at very
high price points
Domestic branded competition almost non existent
29
30

Taneira Who we are
• This youngest brand of Titan Company Ltd was
launched as a pilot in Feb 2017 with 2 stores in
Bangalore.
• Anchored in special occasion wear Sarees from
across India.
• Evolved as a natural extension of Titan’s
proposition – self expression and design.
• Large, unorganized, deeply Indian 5,000 year old
category (like Jewellery). 31

Our Stores
32

Titan Company Limited
Q1 Performance
33

Q1 FY’19 - Background
• The year has started off well for the Company with market share gains continuing across businesses.
• The Jewellery industry experienced weak consumer sentiment. Fall in gold imports during the quarter along with internal channel checks clearly indicated that the industry has declined in Q1.
• For the Company, Q1 FY’19 also had a very high base for comparison with estimated sales of Rs 250 crores getting advanced from Q2 to Q1 last year.
• The Company’s efforts in re-crafting Watches and Eyewear division has started paying off and both the divisions have shown good revenue growth in Q1’19.
• Revenue for Eyewear division grew by 16.4% largely due to growth in sunglasses but profits were muted due to enhanced investments in marketing.
• EBIT Margins for divisions were higher due to effect of operating leverage and no spends on business associate meets this year (Rs 19 cr spent last year)
• The Company added 46 stores with a retail space of 44k square feet in Q1 FY’19, on net basis
• As part of the drive to divest the company of non-core businesses, Titan Time Products Ltd (TTPL), a subsidiary of Titan Company that was in the electronic manufacturing services business based in Goa, has been divested in June’18.
34

Q1 Background
Jewellery
• The Jewellery division started the quarter on a good note with a good Akshaya Trithiya but weak consumer sentiments in the month of June’18, led to the topline growth being below our internal expectations.
• The division also had a very high base (Q1 FY’18 had exceptionally high growth of 54%) which also included advancement of sales in anticipation of high GST rates amounting to ~Rs 250 cr.
• The retail sales (consumer price) grew at 8%
• Higher gross margins coming in from a better mix and lower overhead spends resulted in the EBIT growth of 16% YoY.
• The revised gold exchange program continues to bring in new customers and along with the Golden Harvest scheme, is a major contributor to customer acquisitions.
• 10 Tanishq stores added in Q1 FY’19 adding 24k square feet to Tanishq retail, on net basis.
• Despite the lower than anticipated sales, inventory management was good resulting in higher cash generation in the quarter.
35

Q1 Background Watches
• Watch division had a very good quarter, with growth of 15%, on the back of good growth in modern retail formats as well as higher primary sales to the trade channel in anticipation of the Titan activation.
• Higher sales of Titan Watches also had a positive impact on the division’s margins for the quarter.
• Continued focus on introducing new designs and engaging marketing campaigns is bringing back customers to this category and younger customers are also showing good interest
• The division added 11 WOTs, 7 Fastrack and 3 Helios stores in Q1, adding 14,000 sq feet in the quarter, on net basis.
Eye Wear
• The Titan Eye Plus Business had overall and like-to-like retail growth of 19% and 8% respectively.
• Sunglasses category grew by 44%.
• Eye Wear business saw good pick up, with growth of 16.4% on reported basis, contributed primarily by Sunglasses, after the introduction of more assortments at competitive price points along with many product innovations that has improved the style quotient, comfort and the product functionality.
• 7 new stores were added in Q1 FY’19.
Fragrances & Taneira
• Fragrance business continues to be in high growth phase and also continues to be the best seller in its category in departmental chain stores
• Taneira brand continues to progress well on its journey of establishing itself as a credible brand for bringing the authentic ethnic wear to the women and has received encouraging response to the offerings. Brand metrics of repeat business and referral business are trending at very healthy levels.
36

Q1 Background - Subsidiaries
TEAL (Titan Engineering and Automation Ltd)
• TEAL had a good quarter with the revenues growing by 95% YoY, helped by low base. The aerospace and defence business grew strongly and is expected to do well in the current fiscal.
• Current order book gives almost full visibility of FY’19 targeted revenue. Pipeline of orders is also strong.
• The manufacturing economy in Europe and USA is looking very positive for the automation solution business. Aerospace and defence business is witnessing strong demand across customers.
• Received Best Supplier Award from a Fortune 500 company for a low cost robot palletiser automation.
CaratLane
• Caratlane's revenue recorded a 26% growth despite muted consumer sentiment, primarily due to network expansion.
• Gross margins have improved significantly for the quarter, on the back of better pricing and product mix, helping reduce the losses in the quarter
• Caratlane continues to invest in marketing and brand building.
• Caratlane added 3 stores to its network, in Q1 FY 19, taking the total store count to 39
Favre Leuba
• Delivery of smaller and commercial products (Sea King and Deep Blue 41mm) has started during the quarter
• Opening the Swiss market by selling through a prominent retailer, Christ, with confirmation of 6 new Point of Sales
• Japan, Taiwan and Indian markets have started growing.
• The Company continues to invest adequately in advertising and marketing.
37

Sales value
growth
Like to like
growth
Tanishq 8% 2%
World of Titan 3% 2%
Fastrack 4% 0%
Helios 25% (2)%
LFS (for Watches) 17% 12%
Titan Eye+ 19% 8%
Q1 FY ‘19 Retail Growth
Note: 1. Above retail growth is based on secondary sales to consumers in the retail channel only (L1, L2 & L3 stores and LFS) and is at price to consumer whereas revenue recorded in financials is based on secondary sale to consumers in L1 and L2 stores and primary billing to L3 stores, distribution partners and institutional clients. 2. Retail network shown above represent sales of almost 100%, ~50% and ~80% of Jewellery, Watches and Eyewear businesses respectively on consumer price basis. The remaining sales is to the distribution channels and institutional clients. 38
4,027
381 267
4,319
487 349
0
500
1,000
1,500
2,000
2,500
3,000
3,500
4,000
4,500
5,000
Net Sales PBT PAT
Rs
Cro
res
Q1'18 Q1'19
Growth :
7.3%
39
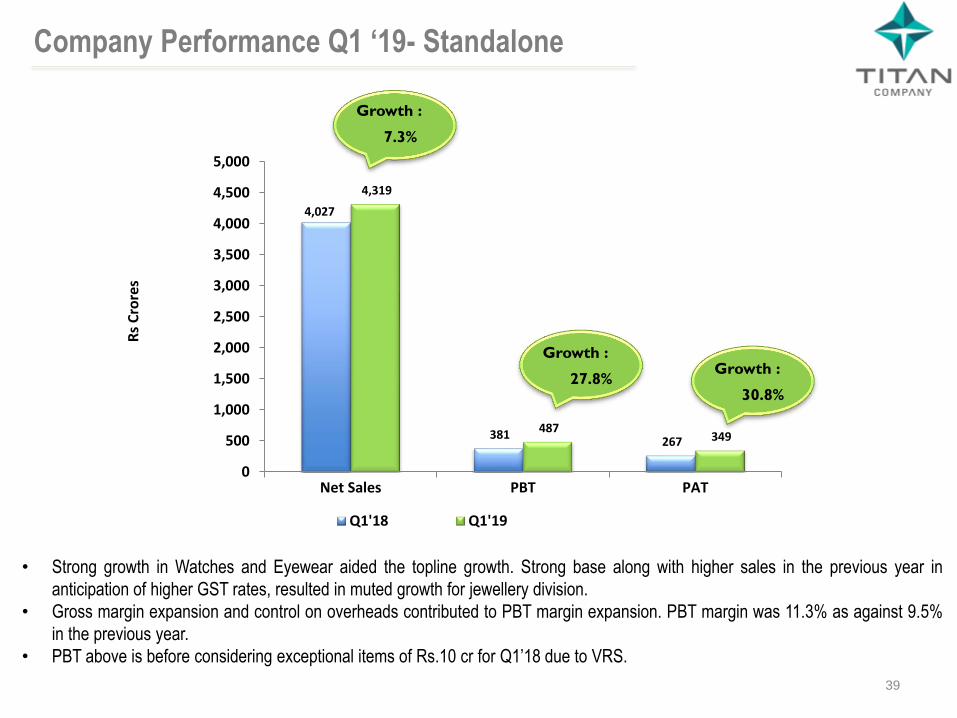
• Strong growth in Watches and Eyewear aided the topline growth. Strong base along with higher sales in the previous year in
anticipation of higher GST rates, resulted in muted growth for jewellery division.
• Gross margin expansion and control on overheads contributed to PBT margin expansion. PBT margin was 11.3% as against 9.5%
in the previous year.
• PBT above is before considering exceptional items of Rs.10 cr for Q1’18 due to VRS.
Company Performance Q1 ‘19- Standalone
Growth :
27.8% Growth :
30.8%

40
• The division grew by 20% over the previous year on a comparative basis (adjusted for Excise Duty)
• Revenue and EBIT margin was higher due to higher primary sales to trade channels in the end of June in anticipation of Titan
activation
• EBIT margin of 18.8% led by higher sales, significantly better mix (Titan brand sales) and ongoing cost control measures.
• Overheads for previous year included business associate meet costing about Rs 11 cr. that was not incurred in the current year
• EBIT above is before the impact of VRS of Rs.10 cr for Q1 FY’18
Growth :
14.9%
Watches
Growth :
89.6%
517
59
594
111
0
100
200
300
400
500
600
700
Net Sales EBIT
Rs
Cro
res
Q1'18 Q1'19
41
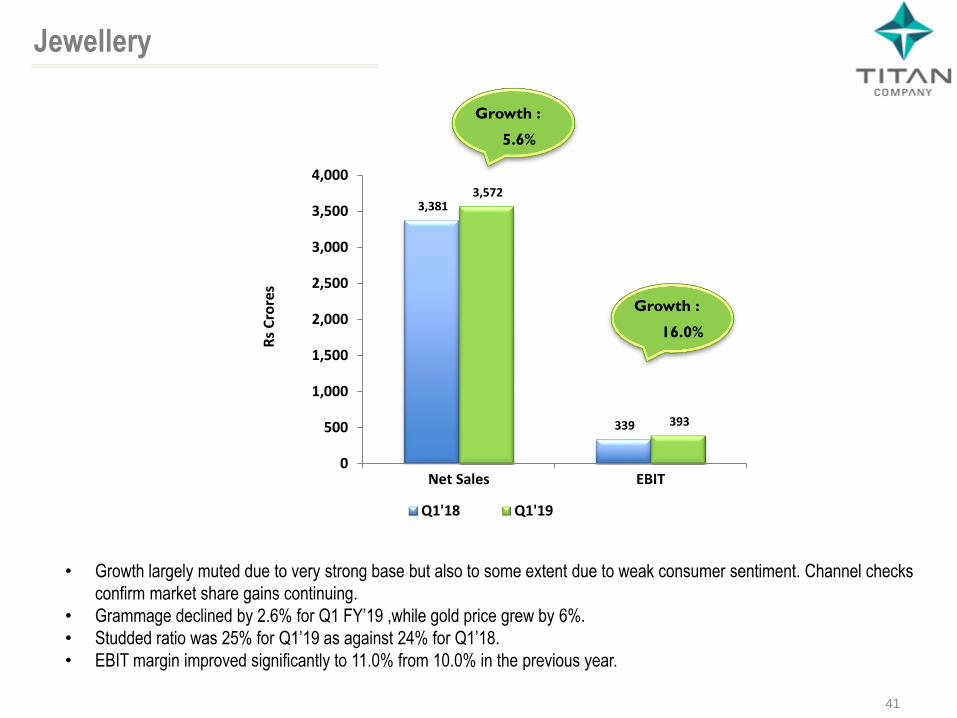
• Growth largely muted due to very strong base but also to some extent due to weak consumer sentiment. Channel checks
confirm market share gains continuing.
• Grammage declined by 2.6% for Q1 FY’19 ,while gold price grew by 6%.
• Studded ratio was 25% for Q1’19 as against 24% for Q1’18.
• EBIT margin improved significantly to 11.0% from 10.0% in the previous year.
Jewellery
Growth :
5.6%
Growth :
16.0%
3,381
339
3,572
393
0
500
1,000
1,500
2,000
2,500
3,000
3,500
4,000
Net Sales EBIT
Rs
Cro
res
Q1'18 Q1'19

42
• Sunglasses category grew by 44%
• Higher investments in marketing and brand building impacted the bottom line.
Eye Wear
Growth :
16.4%
113
3
132
2
0
20
40
60
80
100
120
140
Net Sales EBIT
Rs
Cro
res
Q1'18 Q1'19

43
• Strong growth in both CaratLane and TEAL revenues
• PBT above is before considering exceptional items of Rs.10 cr for Q1’18 due to VRS
Company Performance - Consolidated
4,103
352 238
4,451
467 328
0
500
1,000
1,500
2,000
2,500
3,000
3,500
4,000
4,500
5,000
Net Sales PBT PAT
Rs
Cro
res
Q1'18 Q1'19
Growth :
8.5%
Growth :
32.8% Growth :
37.9%

44
• Jewellery capital employed decreased due to reduction in inventory.
• Capital employed for ‘Others’ is higher due to increase in cash position.
Capital Employed - Standalone
906
2,076
206
2,006
5194
984
1,417
214
2,986
5601
0
1,000
2,000
3,000
4,000
5,000
6,000
Watches Jewellery Eye Wear Others Company
Rs
Cro
res
Mar-18 Jun-18
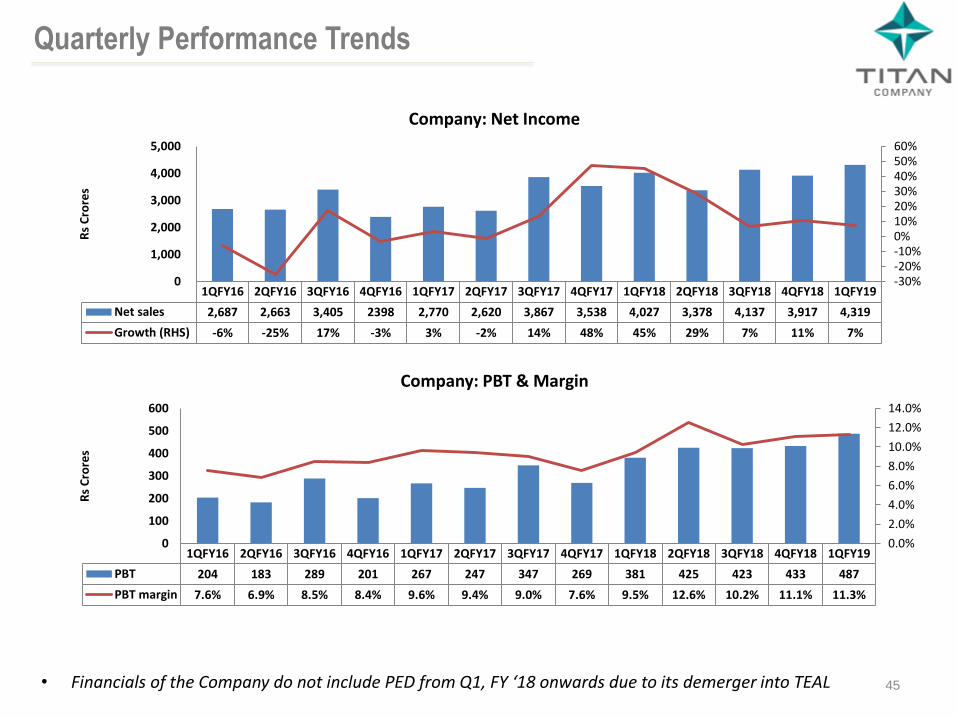
1QFY16 2QFY16 3QFY16 4QFY16 1QFY17 2QFY17 3QFY17 4QFY17 1QFY18 2QFY18 3QFY18 4QFY18 1QFY19
PBT 204 183 289 201 267 247 347 269 381 425 423 433 487
PBT margin 7.6% 6.9% 8.5% 8.4% 9.6% 9.4% 9.0% 7.6% 9.5% 12.6% 10.2% 11.1% 11.3%
0.0%
2.0%
4.0%
6.0%
8.0%
10.0%
12.0%
14.0%
0
100
200
300
400
500
600
Rs
Cro
res
Company: PBT & Margin
1QFY16 2QFY16 3QFY16 4QFY16 1QFY17 2QFY17 3QFY17 4QFY17 1QFY18 2QFY18 3QFY18 4QFY18 1QFY19
Net sales 2,687 2,663 3,405 2398 2,770 2,620 3,867 3,538 4,027 3,378 4,137 3,917 4,319
Growth (RHS) -6% -25% 17% -3% 3% -2% 14% 48% 45% 29% 7% 11% 7%
-30%-20%-10%0%10%20%30%40%50%60%
0
1,000
2,000
3,000
4,000
5,000
Rs
Cro
res
Company: Net Income
45
Quarterly Performance Trends
• Financials of the Company do not include PED from Q1, FY ‘18 onwards due to its demerger into TEAL

46
Quarterly Performance Trends
1QFY16 2QFY16 3QFY16 4QFY16 1QFY17 2QFY17 3QFY17 4QFY17 1QFY18 2QFY18 3QFY18 4QFY18 1QFY19
Net sales 485 552 484 449 500 524 508 503 517 570 532 494 594
Growth (RHS) 9.1% 5.5% 9.4% -12.1% 3.1% -5.2% 5.0% 11.9% 3.4% 8.8% 4.7% -1.7% 14.9%
-15.0%
-10.0%
-5.0%
0.0%
5.0%
10.0%
15.0%
20.0%
0
100
200
300
400
500
600
700
Rs
Cro
res
Watches: Net Income
1QFY16 2QFY16 3QFY16 4QFY16 1QFY17 2QFY17 3QFY17 4QFY17 1QFY18 2QFY18 3QFY18 4QFY18 1QFY19
EBIT 47 83 32 8 70 68 53 13 59 91 83 39 111
EBIT Margin (RHS) 9.8% 15.1% 6.7% 1.7% 14.0% 13.0% 10.5% 2.6% 11.4% 16.0% 15.5% 8.0% 18.8%
0.0%
5.0%
10.0%
15.0%
20.0%
0
20
40
60
80
100
120
Rs
Cro
res
Watches: EBIT & Margin

47
Quarterly Performance Trends
1QFY16 2QFY16 3QFY16 4QFY16 1QFY17 2QFY17 3QFY17 4QFY17 1QFY18 2QFY18 3QFY18 4QFY18 1QFY19
Net sales 2,073 1,983 2,820 1847 2,151 1,988 3,255 2,913 3,381 2,711 3,497 3,292 3,572
Growth (RHS) -10.9% -32.3% 20.1% 1.0% 3.7% 0.2% 15.4% 57.8% 57.2% 36.4% 7.4% 13.0% 5.6%
-40.0%
-20.0%
0.0%
20.0%
40.0%
60.0%
80.0%
0
500
1,000
1,500
2,000
2,500
3,000
3,500
4,000
Rs
Cro
res
Jewellery: Net Income
1QFY16 2QFY16 3QFY16 4QFY16 1QFY17 2QFY17 3QFY17 4QFY17 1QFY18 2QFY18 3QFY18 4QFY18 1QFY19
EBIT 180 120 290 208 218 218 334 283 339 368 385 453 393
EBIT Margin (RHS) 8.7% 6.1% 10.3% 11.3% 10.1% 11.0% 10.3% 9.7% 10.0% 13.6% 11.0% 13.8% 11.0%
0.0%
2.0%
4.0%
6.0%
8.0%
10.0%
12.0%
14.0%
16.0%
-
100
200
300
400
500
Rs
Cro
res
Jewellery: EBIT & Margin

48
Quarterly Performance Trends
1QFY16 2QFY16 3QFY16 4QFY16 1QFY17 2QFY17 3QFY17 4QFY17 1QFY18 2QFY18 3QFY18 4QFY18 1QFY19
Volume Growth -4% 0% 0% -19% 1% -9% 4% 10% 5% 9% 11% -1% 10%
-25%
-20%
-15%
-10%
-5%
0%
5%
10%
15%
Gro
wth
(%
)
Watches: Volume growth
1QFY16 2QFY16 3QFY16 4QFY16 1QFY17 2QFY17 3QFY17 4QFY17 1QFY18 2QFY18 3QFY18 4QFY18 1QFY19
Gold price (LHS) 2,544 2,443 2,451 2643 2,809 2,964 2791 2773 2790 2,777 2,798 2,903 2,968
Grammage growth -10% -10% 28% 15% 6% -32% 4% 37% 49% 49% 6% 6% -3%
-40%
-30%
-20%
-10%
0%
10%
20%
30%
40%
50%
60%
-
500
1,000
1,500
2,000
2,500
3,000
3,500
Gra
mm
age
Gro
wth
(%
)
Jewellery: Gold price (22kt) and Grammage growth

8,739 9,421
8,723
10,485
13,036
0
2,000
4,000
6,000
8,000
10,000
12,000
14,000
2013-14 2014-15 2015-16 2016-17 2017-18
(Rs
Cro
res)
Jewellery: Net Income
1,796
1,921
1,974
2,053
2,126
1,600
1,700
1,800
1,900
2,000
2,100
2,200
2013-14 2014-15 2015-16 2016-17 2017-18
(Rs
Cro
res)
Watches: Net Income
10,916 11,903
11,105
12,999
15,656
0
2,000
4,000
6,000
8,000
10,000
12,000
14,000
16,000
18,000
2013-14 2014-15 2015-16 2016-17 2017-18
(Rs
Cro
res)
Income from operations (net)
CAGR: 9%
CAGR: 11%
CAGR: 4%
Annual Performance Trends
49

741 823
698 762
1,163
0
200
400
600
800
1,000
1,200
1,400
2013-14 2014-15 2015-16 2016-17 2017-18
(Rs
Cro
res)
PAT CAGR: 12%
CAGR: 13%
CAGR: 9%
CAGR: 13%
Annual Performance Trends
FY’17 PAT after VRS cost of Rs 96 cr
1,016 1,056
888
1,130
1,662
0
200
400
600
800
1,000
1,200
1,400
1,600
1,800
2013-14 2014-15 2015-16 2016-17 2017-18
(Rs
Cro
res)
PBT
195 206
171
204
272
0
50
100
150
200
250
300
2013-14 2014-15 2015-16 2016-17 2017-18
(Rs
Cro
res)
Watches: PBIT
961 991
800
1,053
1,546
0
200
400
600
800
1,000
1,200
1,400
1,600
1,800
2013-14 2014-15 2015-16 2016-17 2017-18
(Rs
Cro
res)
Jewellery: PBIT
50

33.0%
29.3%
21.1% 19.4%
24.5%
0%
5%
10%
15%
20%
25%
30%
35%
2013-14 2014-15 2015-16 2016-17 2017-18
ROE
Annual Performance Trends
FY’17 ROE is after excluding VRS cost of Rs 96 cr
3,321 3,172 3,551
4,312
5,194
0
1,000
2,000
3,000
4,000
5,000
6,000
2013-14 2014-15 2015-16 2016-17 2017-18
(Rs
Cro
res)
Capital Employed
37.9%
32.6%
25.8%
29.2%
35.1%
0%
5%
10%
15%
20%
25%
30%
35%
40%
2013-14 2014-15 2015-16 2016-17 2017-18
ROCE
51

Dividend 10 year
CAGR: 24%
2007-08 2008-09 2009-10 2010-11 2011-12 2012-13 2013-14 2014-15 2015-16 2016-17 2017-18
Dividend 36 44 67 111 155 186 186 204 195 231 333
Payout Ratio-RHS 23.6% 27.9% 26.6% 25.8% 25.9% 25.7% 25.2% 24.8% 27.7% 30.3% 28.6%
0.0%
5.0%
10.0%
15.0%
20.0%
25.0%
30.0%
35.0%
0
50
100
150
200
250
300
350
(Rs
Cro
res)
52
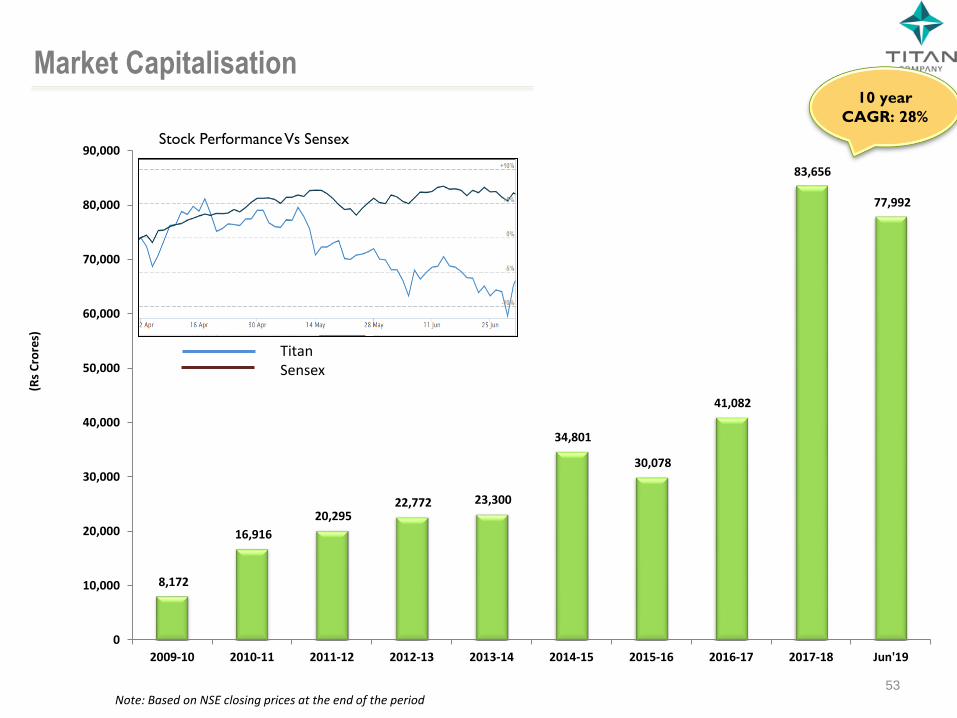
8,172
16,916
20,295 22,772 23,300
34,801
30,078
41,082
83,656
77,992
0
10,000
20,000
30,000
40,000
50,000
60,000
70,000
80,000
90,000
2009-10 2010-11 2011-12 2012-13 2013-14 2014-15 2015-16 2016-17 2017-18 Jun'19
(Rs
Cro
res)
10 year
CAGR: 28%
Note: Based on NSE closing prices at the end of the period
Market Capitalisation
Stock Performance Vs Sensex
Titan Sensex
53

Sustainability @ Titan
Formally defined CSR Policy in line with the company’s vision
The CSR focus at Titan will be driven by broad themes such as upliftment of the underprivileged girl child, Skill development for the under privileged and support for Indian Arts, Crafts and Heritage
Key initiatives driven:
Girl Child / education: Remedial Education and holistic engagement with Girl child in two most backward locations of TN and Karnataka
Education support through Titan Scholarship Program
Skill development Titan Skill centre – Titan LeAP (Learn , Apply and Progress) launched in Chennai.
Planning to skill 10,000 underprivileged during the year, completed 3,000 in quarter
Supporting Arts Crafts . Heritage / Celebrating Indian Heritage
Working with two craft communities one in Benares, & one with the youth of Kashmir for revival & enable market linkages
Created sustainable model for one craft community in Tamilnadu - Porgai
Support towards local and National Causes
Happy Eyes – Eye screening and supporting cataract operations for underprivileged children and adults, covered more than 5,000 beneficiaries during 1st Quarter
Design Impact award for social change
Completion of phase 1 of Design Impact awards for social change – Declared 8 beneficiaries Launch of Design Impact award for social Change
Adoption of 4 lakes for desilting and rejuvenation
Reached out to 42.5k beneficiaries during Q1 2018-19 through our CSR programs
54
Thank You