tisco financial group public co., ltd. · analyst presentation 4q10 & fy10 results 12 january...
TRANSCRIPT
1
Disclaimer: This presentation material may contain forward-looking statements. These forward-looking statements are not guarantees of future performance and involve risks and uncertainties, and actual results may differ from those in the forward looking statements as a result of various factors. TISCO accepts no liability whatsoever with respect to the use of this document of its content.
TISCO Financial Group Public Co., Ltd.TISCO Financial Group Public Co., Ltd.
Analyst Presentation 4Q10 & FY10 ResultsAnalyst Presentation 4Q10 & FY10 Results
12 January 201112 January 2011

2
I. 2010 Performance Highlights
II. Financial Results 2010
III. Appendix
Agenda

3
2010 Highlights
• Record high loan growth contributed by strong growth in all
business areas
• Loan spread slightly soften in 4Q10 due to changes in asset and
liability mix, while overall spread remained high with net spread
after provision at target level
• NPL reported at record low with wide excess provisions
• ROAE sustained at above 20%

4
Key Financial Performance
21.2%
15.4%
147 bps
1.8%
45.0%
5.0%
28.7%
24.7%
75.4%
32.2%
2010
ROAE targeted at more than 20% going forward
Capital base remained strong
Provisions remained high to cushion against future volatility
Asset quality continued to improve
Cost to income maintained at low level
Loan spread declined due to changes in asset and funding mix
Retail deposit mix maintained despite expanding assets
Deposit mix shifted toward longer-term borrowings
Retail loan mix decreased as Corporate & SME showed strong loan growth
Loan continued to grow in all segments
Notes
80.1%75.4%76.5%Loan Mix – Retail
16.7%18.8%21.3%ROAE
17.0%15.4%15.2%CAR
143 bps167 bps179 bpsProvisions
2.5%1.8%1.9%NPL Ratio
50.4%43.1%42.7%Cost to Income Ratio
5.0%4.6%5.0%Loan Spread
27.5%28.7%33.5%Deposit Mix – Retail(Deposit amount less than 20 MB)
22.9%24.7%34.6%Deposit Mix – CASA(CASA/Deposits+ST borrowings)
13.8%*7.1%9.3%Loan Growth
20094Q103Q10
Remark: * 2009 Loan Portfolio includes acquired HP Portfolio recorded as investments
5
I. 2010 Performance Highlights
II. Financial Results 2010
III. Appendix
Agenda

6
Consolidated Income Statements
21.216.718.821.316.9ROAE (%)
0.94
683
(287)
971
(605)
1,576
(1,196)
946
1,826
(707)
2,533
4Q10
(6.6)
(6.6)
(22.1)
(11.9)
1.0
(7.3)
(5.5)
(16.0)
(0.8)
20.0
4.2
%QoQ
30.2
31.4
39.4
33.1
3.6
20.0
(3.2)
5.7
10.5
39.0
17.2
%YoY
51.6
45.3
49.5
46.2
24.9
38.7
11.8
34.9
20.5
(7.1)
12.4
%YoY
3.97
2,888
(1,256)
4,159
(1,933)
6,092
(4,989)
3,876
7,205
(2,315)
9,520
2010
2.62
1,988
(840)
2,845
(1,548)
4,393
(4,461)
2,873
5,981
(2,492)
8,473
2009Unit: Million Baht 4Q09 3Q10
Interest income 2,162 2,430
Interest expense (509) (589)
Net interest income 1,653 1,841
Non-interest income 895 1,126
Operating expense (1,235) (1,266)
PPOP 1,313 1,701
Provisions (584) (599)
Pre-tax profit 730 1,102
Income tax (206) (368)
Net profit 520 731
Diluted EPS (Baht) 0.72 1.00

7
Assets and Liabilities
87%89%82%
2009 3Q10 2010
Other assets
Interbank & MM
Investments
Loans
23.5%YoY
Assets Liabilities
9.6%QoQ
16.44.06,8126,5485,850Other assets
(1.3)74.912,5457,17412,708Interbank & MM
Unit: Million Baht 2009 3Q10 2010 %QoQ %YoY
Loans 113,233 139,865 149,731 7.1 32.2
Allowance (2,425) (3,675) (4,162) 13.3 71.6
Investments 9,438 6,494 6,481 (0.2) (31.3)
Total Assets 138,804 156,407 171,408 9.6 23.5
24.010.0156,550142,283126,286Total Liabilities
n.m.18.9293246(38)Revaluation
Unit: Million Baht 2009 3Q10 2010 %QoQ %YoY
Deposits & ST
borrowings
110,507 114,307 123,849 8.3 12.1
Interbank & MM 6,380 7,473 10,843 45.1 69.9
LT borrowings 5,430 14,450 15,460 7.0 184.7
Other liabilities 3,968 6,054 6,398 5.7 61.2
Total Equity 12,519 14,123 14,857 5.2 18.7
Unit: Million Baht Unit: Million Baht
80%88%79%
2009 3Q10 2010
Other Liabilities
LT Borrowings
Interbank & MM
Deposits & ST Borrowings
10.0%QoQ
24.0%YoY
82%
171,408
126,286
156,407
138,804142,283
156,550

8
Loans and Deposits
76%80%
75%
13%13%
11%
2009 3Q10 2010
Other Loans
SME Loans
Corporate Loans
Retail Loans
Loans
113,233
32.2%YoY
7.1%QoQ
139,865149,731
Unit: Million Baht
Deposits + B/Es
23%32%23%
14%15%
28%
57%45%48%
6%7%
2009 3Q10 2010
LT Borrowings(excl. debentures)
ST Borrowings
Fixed Deposits
CASA
110,937
19.3% YoY
122,756
7.8% QoQ
Unit: Million Baht
132,309
120.9122.4102.5Loans / Deposits + ST borrowings
113.2113.9102.1Loans / Deposits + BEs
20103Q102009
Loans to Deposits

9
Loan Composition
Corporate Loans
18,474 18,959
12,602
2009 3Q10 2010
4,634
6,9909,304
2009 3Q10 2010
Retail Loans
24.5%YoY
90,732106,986 112,959
2009 3Q10 2010
5.6%QoQ
SME Loans
100.8%YoY
33.1%QoQ
50.4%YoY
2.6%QoQ
Loan Portfolio Breakdown
Unit: Million Baht Unit: Million Baht Unit: Million Baht
Retail
75%
Others
6%SME
6%
Corporate
13%
2010
Retail
80%
Others
5%SME
4%Corporate
11%
2009
10
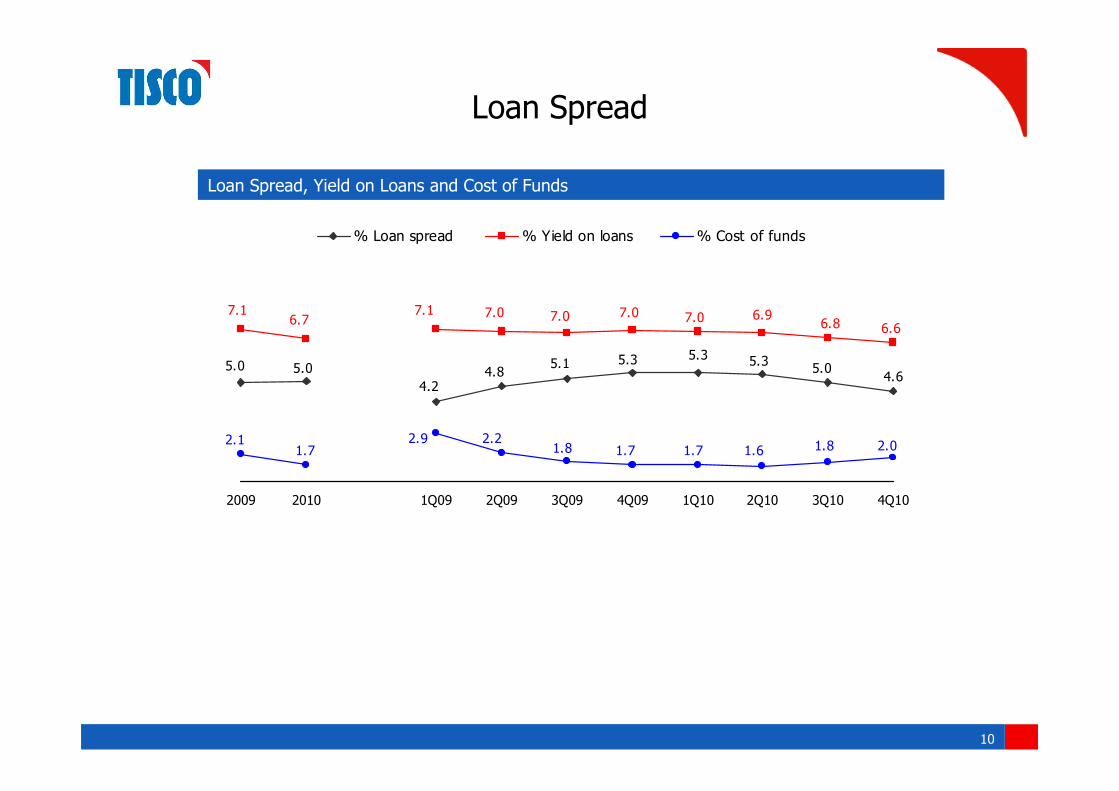
Loan Spread
4.65.0
5.3
4.2
5.0 5.0 4.85.1 5.3 5.3
7.16.7
7.1 7.0 7.0 7.0 7.0 6.96.8 6.6
2.9 2.21.8 1.7 1.7 1.6
2.11.7 1.8 2.0
2009 2010 1Q09 2Q09 3Q09 4Q09 1Q10 2Q10 3Q10 4Q10
% Loan spread % Yield on loans % Cost of funds
Loan Spread, Yield on Loans and Cost of Funds
11
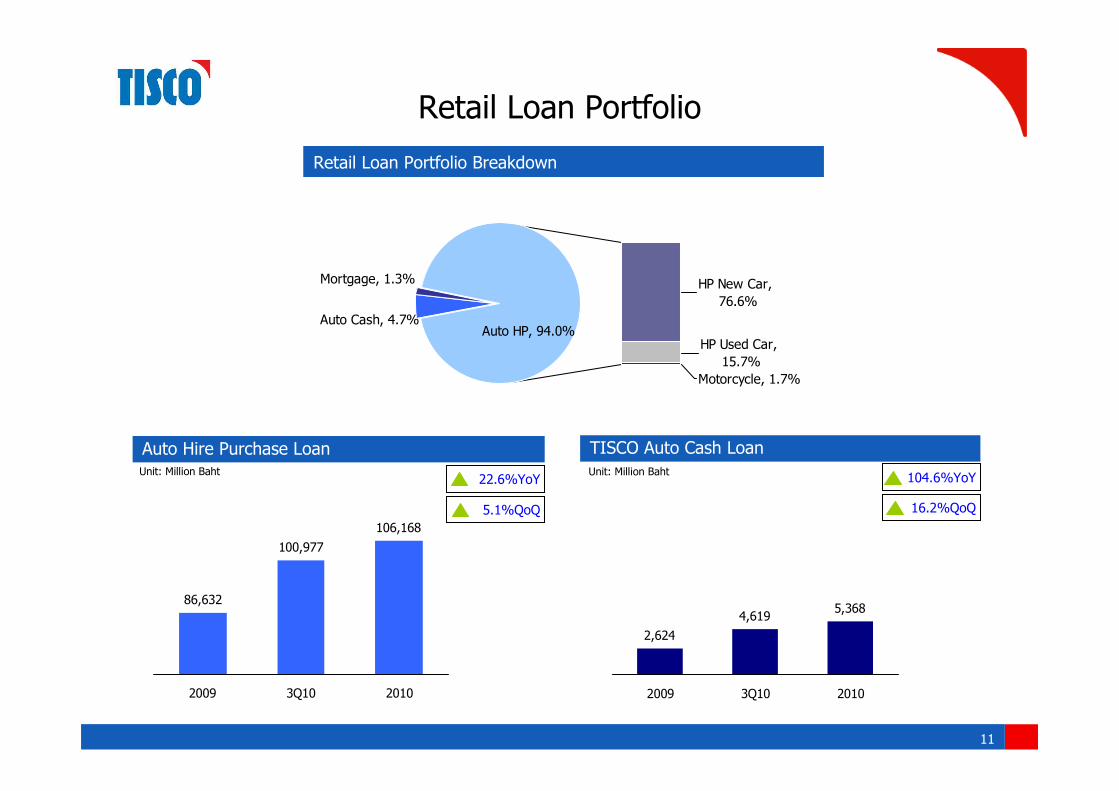
Retail Loan Portfolio
86,632
100,977
106,168
2009 3Q10 2010
2,624
4,6195,368
2009 3Q10 2010
Auto Hire Purchase Loan
22.6%YoY
TISCO Auto Cash Loan
104.6%YoY Unit: Million Baht Unit: Million Baht
5.1%QoQ 16.2%QoQ
Retail Loan Portfolio Breakdown
Mortgage, 1.3% HP New Car,
76.6%
HP Used Car,
15.7%
Auto Cash, 4.7%Auto HP, 94.0%
Motorcycle, 1.7%

12
TISCO Penetration Rate
Industry Car Sales and Penetration Rate
476.8
150.9199.7189.9166.8
707.2
10.9%9.4%
11.3%
12.2%12.6%
11.8%
11M09 11M10 1Q10 2Q10 3Q10 Oct-Nov10
No. of New Car Sales ('000 Units) Penetration Rate (%)
20,000
40,000
60,000
80,000
Jan Feb Mar April May Jun Jul Aug Sep Oct Nov Dec
2007 2008 2009 2010
Industry New Car Sales
Units

13
Asset Quality
(%)(Million Baht)(%)(Million Baht)(%)(Million Baht)
1.41,4961.41,4121.71,497Hire Purchase
NPL by Loan Type2009 3Q10 2010
Corporate 600 4.0 562 2.7 536 2.4
SME 73 1.6 121 1.7 77 0.8
Mortgage 171 11.6 119 8.6 124 8.7
Others 466 7.0 432 3.8 422 3.6
Total NPL 2,807 2.5 2,646 1.9 2,654 1.8
NPL and NPL Ratio
2,807 2,654 2,633 2,641 2,646 2,654
2.5%
1.8%2.2% 2.0%
1.8%1.9%
2009 2010 1Q10 2Q10 3Q10 4Q10
Total NPL % NPL
Unit: Million Baht
14
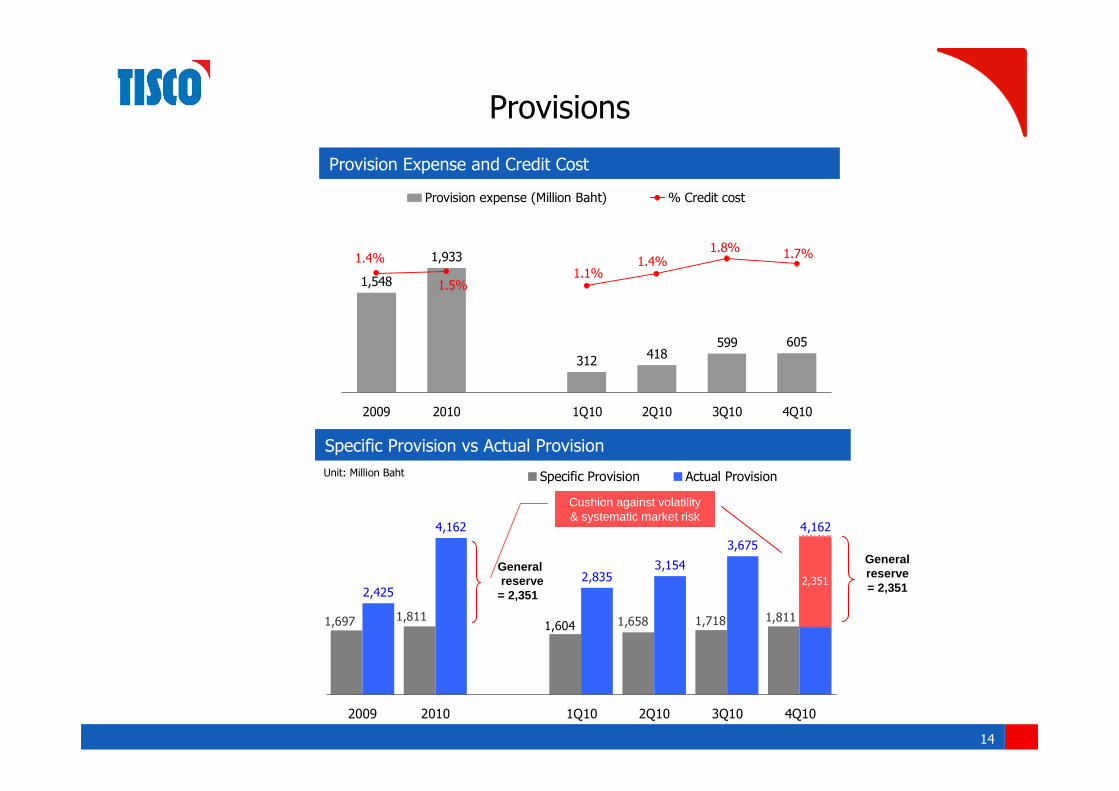
Provisions
Provision Expense and Credit Cost
1,548
1,933
312418
599 605
1.1%
1.7%1.8%1.4%
1.5%
1.4%
2009 2010 1Q10 2Q10 3Q10 4Q10
Provision expense (Million Baht) % Credit cost
2,425
4,162
2,8353,154
3,675
4,162
1,718 1,8111,6581,6041,8111,697
2009 2010 1Q10 2Q10 3Q10 4Q10
Specific Provision Actual Provision
Specific Provision vs Actual Provision
Unit: Million Baht
Cushion against volatility & systematic market risk
General reserve= 2,351
Generalreserve
= 2,3512,351
15
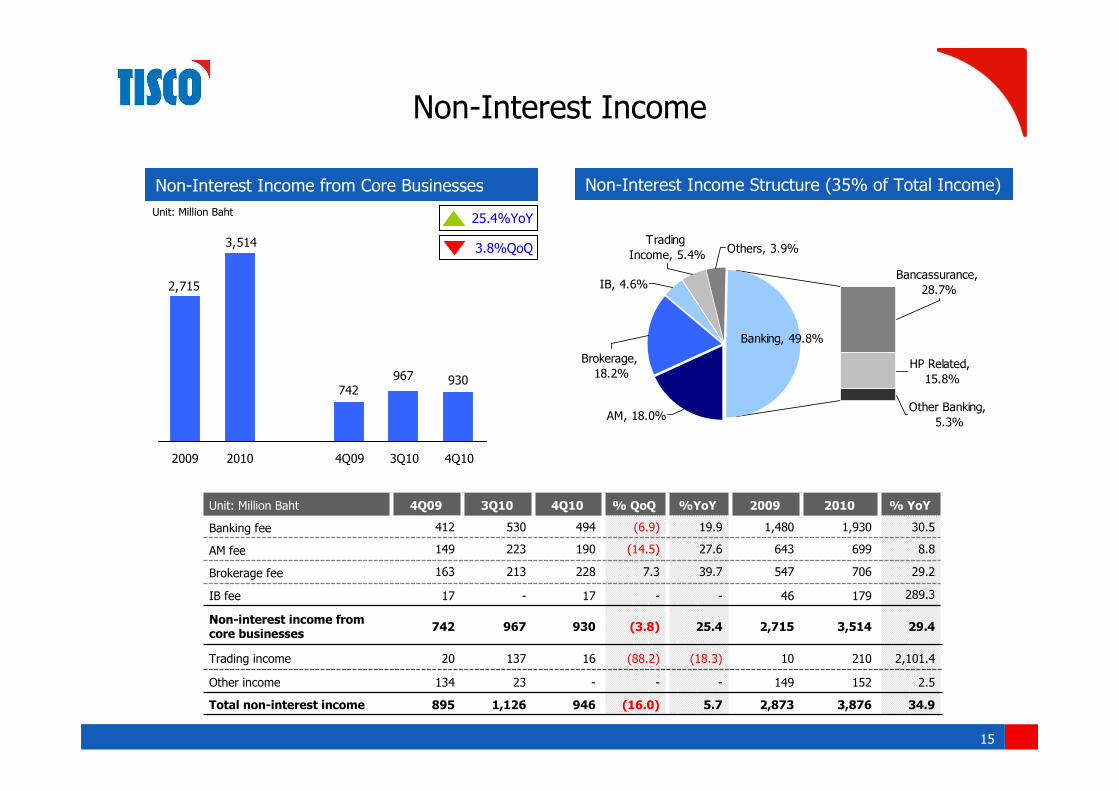
Non-Interest Income
2.5152149---23134Other income
29.43,5142,71525.4(3.8)930967742Non-interest income from core businesses
2,101.421010(18.3)(88.2)1613720Trading income
Unit: Million Baht 4Q09 3Q10 4Q10 % QoQ %YoY 2009 2010 % YoY
Banking fee 412 530 494 (6.9) 19.9 1,480 1,930 30.5
AM fee 149 223 190 (14.5) 27.6 643 699 8.8
Brokerage fee 163 213 228 7.3 39.7 547 706 29.2
IB fee 17 - 17 - - 46 179 289.3
Total non-interest income 895 1,126 946 (16.0) 5.7 2,873 3,876 34.9
930967742
3,514
2,715
2009 2010 4Q09 3Q10 4Q10
Non-Interest Income from Core Businesses
Unit: Million Baht
3.8%QoQ
25.4%YoY
Non-Interest Income Structure (35% of Total Income)
AM, 18.0%
Brokerage,
18.2%
IB, 4.6%
Trading
Income, 5.4%
Bancassurance,
28.7%
Others, 3.9%
Banking, 49.8%
HP Related,
15.8%
Other Banking,
5.3%
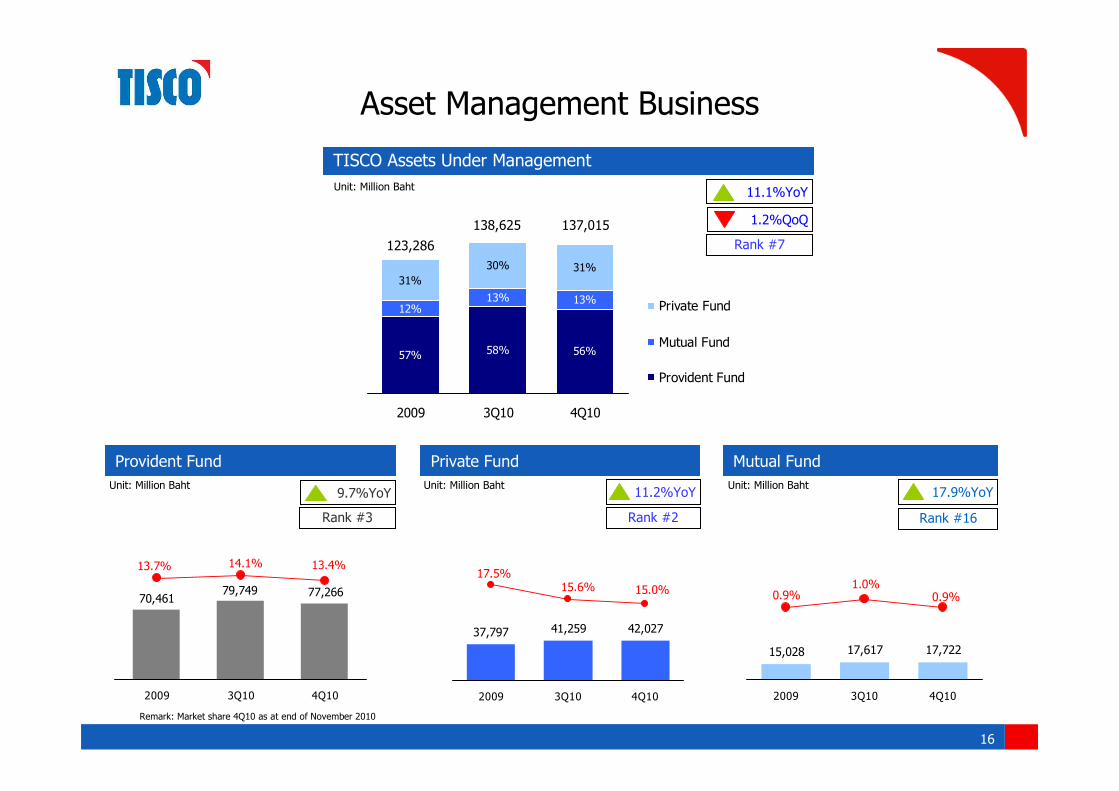
16
57% 58% 56%
13%13%12%
31%30%
31%
2009 3Q10 4Q10
Private Fund
Mutual Fund
Provident Fund
77,26679,74970,461
13.4%14.1%13.7%
2009 3Q10 4Q10
15,028 17,617 17,722
0.9%1.0%
0.9%
2009 3Q10 4Q10
37,797 41,259 42,027
15.0%15.6%17.5%
2009 3Q10 4Q10
11.1%YoY
Rank #3
9.7%YoY
Provident Fund
Rank #2
11.2%YoY
Private Fund
Rank #16
17.9%YoY
Mutual Fund
Rank #7
Unit: Million Baht Unit: Million Baht Unit: Million Baht
TISCO Assets Under Management
Asset Management Business
Unit: Million Baht
123,286
138,625 1.2%QoQ
Remark: Market share 4Q10 as at end of November 2010
137,015

17
TISCO Trading Volume and Market Share
Remark: Market share excluded brokers’ proprietary trading
219,379
63,39860,023
333,211
101,738 108,053
2.7%
2.7%2.6%2.8%2.9%
2.9%
2009 2010 1Q10 2Q10 3Q10 4Q10
TISCO Volume (Million Baht) Market share (%)
TISCO Trading Volume by Customer
27% 31% 31% 30% 32% 32%
24% 20% 24% 23% 16% 19%
49% 49% 45% 47% 51% 49%
2009 2010 1Q10 2Q10 3Q10 4Q10
Local Institution Foreign Institution Retail Investors
Brokerage Business

18
Operating Expenses
Unit: Million Baht 4Q09 3Q10 4Q10 %QoQ %YoY 2009 2010 %YoY
Personnel expenses 549 722 603 (16.4) 10.0 2,055 2,760 34.3
Premises & equipment expenses 180 171 191 11.6 6.1 699 707 1.1
Taxes & duties 30 42 41 (2.4) 35.5 118 154 31.3
Fees & service expenses 84 83 83 (1.0) (2.2) 334 359 7.4
Directors’ remuneration 2 3 3 (0.3) 25.7 8 9 17.5
Other expenses 390 246 276 12.3 (29.2) 1,247 999 (19.9)
Total 1,235 1,266 1,196 (5.5) (3.2) 4,461 4,989 11.8
Cost to Income Ratio
43.1%42.7%45.0%
50.4% 48.5%
2009 2010 4Q09 3Q10 4Q10
Cost Structure
Premises &
Equipments,
14.2%
Personal
Expenses,
55.3%
Others,
20.0%Directors'
Remunerati
on, 0.2%
Fee &
Services,
7.2%
Taxes &
Duties, 3.1%

19
Capital Adequacy
16,22714,909
16,38116,129
10,386 10,837
13,758
15.4%15.2%
16.6%17.0%
11.7%11.9%
16.7%
11.4%12.3%
13.5%
11.6% 11.2%
14.5%
14.8%
2007 2008 2009* 1Q10 2Q10 3Q10 4Q10
Capital Base (Million Baht)
BIS Ratio (%)
Tier I (%)
Capital Adequacy Ratio
Risk-Based Capital Allocation
Remark: *Upgraded from Basel II – SA to Basel II – IRB Approach in December 2009
Wholesale
Lending
19.5%
Retail Lending
32.3%
SME Lending
10.0%
Listed Equity
0.3%
FX
0.1%
Property
0.1%
Non-Listed
Equity
3.0% Derivatives
0.0%
Fixed-income
0.4%
Banking
Book(Interest
Bearing)
19.1%Operational Risk
Reserve
15.3%
2009 2010
Operational Risk Reserve
12.0%
Banking Book(Interest
Bearing)24.3%
Fixed-income1.3%
Derivatives0.0%
Non-Listed Equity3.6%
Property0.3%
FX0.2%
Listed Equity7.8%
SME Lending4.2%
Retail Lending35.9%
Wholesale Lending10.5%

20
I. 2010 Performance Highlights
II. Financial Results 2010
III. Appendix
Agenda

21
Awards & Recognitions in 2010
“Best Asset Management Company Award”
- SET Awards 2010
“Best Bank in Thai Baht Corporate Bonds 2010”
- The Asset 2010
“Best Domestic Equity House in Thailand”
- Asiamoney Award 2010
“Best Equity Fund Group - 3 Years”
- Lipper Fund Awards 2010
“Excellence CG Scoring”
- Corporate Governance Report of Thai Listed Companies 2010
22
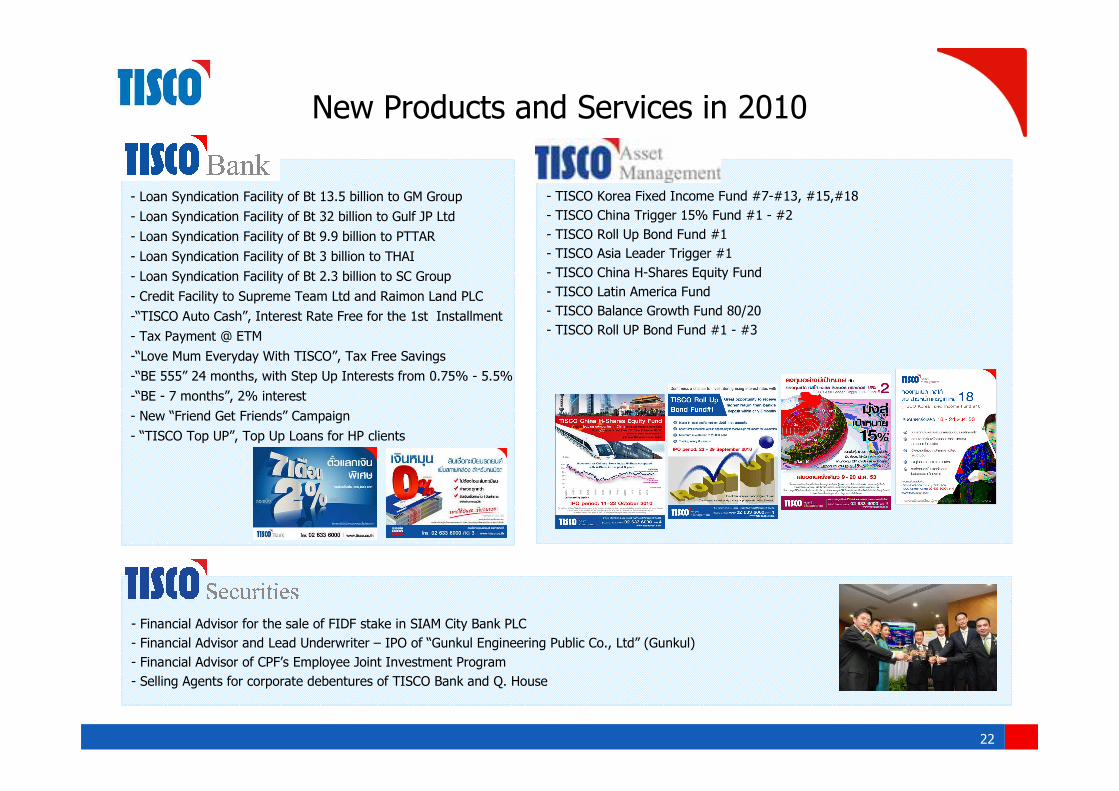
New Products and Services in 2010
- Loan Syndication Facility of Bt 13.5 billion to GM Group
- Loan Syndication Facility of Bt 32 billion to Gulf JP Ltd
- Loan Syndication Facility of Bt 9.9 billion to PTTAR
- Loan Syndication Facility of Bt 3 billion to THAI
- Loan Syndication Facility of Bt 2.3 billion to SC Group
- Credit Facility to Supreme Team Ltd and Raimon Land PLC
-“TISCO Auto Cash”, Interest Rate Free for the 1st Installment
- Tax Payment @ ETM
-“Love Mum Everyday With TISCO”, Tax Free Savings
-“BE 555” 24 months, with Step Up Interests from 0.75% - 5.5%
-“BE - 7 months”, 2% interest
- New “Friend Get Friends” Campaign
- “TISCO Top UP”, Top Up Loans for HP clients
- Financial Advisor for the sale of FIDF stake in SIAM City Bank PLC
- Financial Advisor and Lead Underwriter – IPO of “Gunkul Engineering Public Co., Ltd” (Gunkul)
- Financial Advisor of CPF’s Employee Joint Investment Program
- Selling Agents for corporate debentures of TISCO Bank and Q. House
- TISCO Korea Fixed Income Fund #7-#13, #15,#18
- TISCO China Trigger 15% Fund #1 - #2
- TISCO Roll Up Bond Fund #1
- TISCO Asia Leader Trigger #1
- TISCO China H-Shares Equity Fund
- TISCO Latin America Fund
- TISCO Balance Growth Fund 80/20
- TISCO Roll UP Bond Fund #1 - #3
23
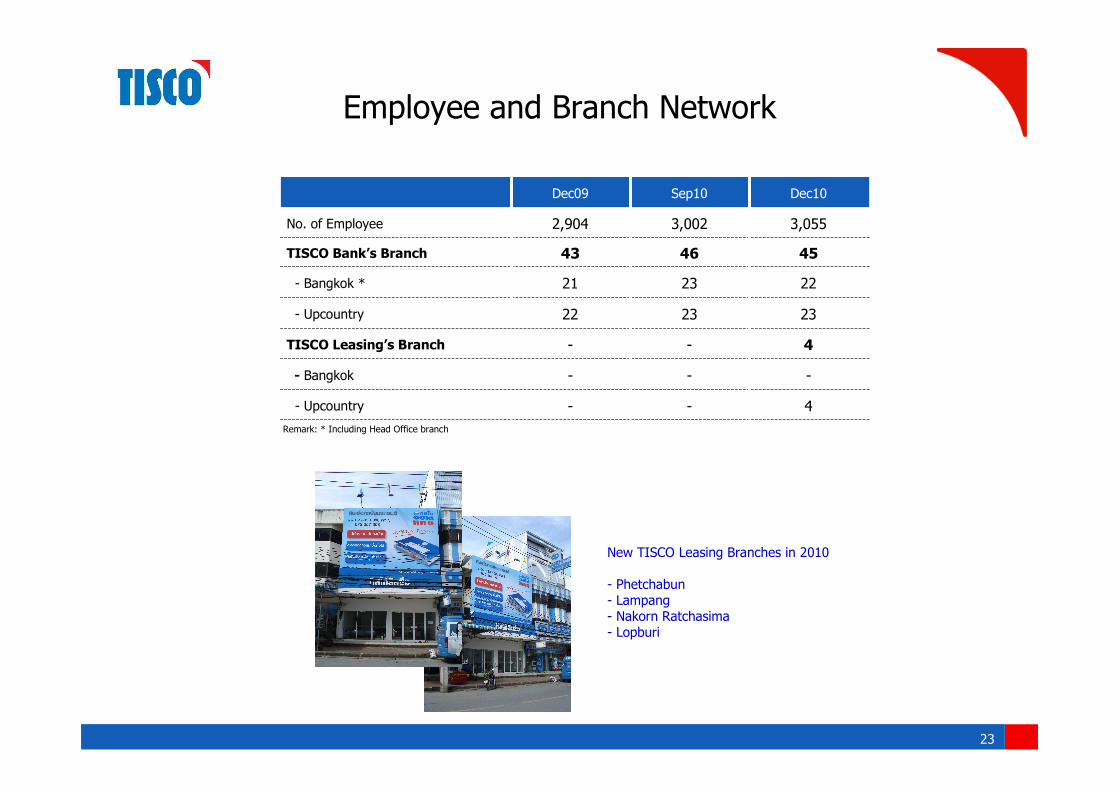
Employee and Branch Network
-
-
-
23
23
46
3,002
Sep10
-
-
-
22
21
43
2,904
Dec09
4- Upcountry
-- Bangkok
4TISCO Leasing’s Branch
23
22
45
3,055
Dec10
No. of Employee
TISCO Bank’s Branch
- Bangkok *
- Upcountry
Remark: * Including Head Office branch
New TISCO Leasing Branches in 2010
- Phetchabun- Lampang- Nakorn Ratchasima- Lopburi
24
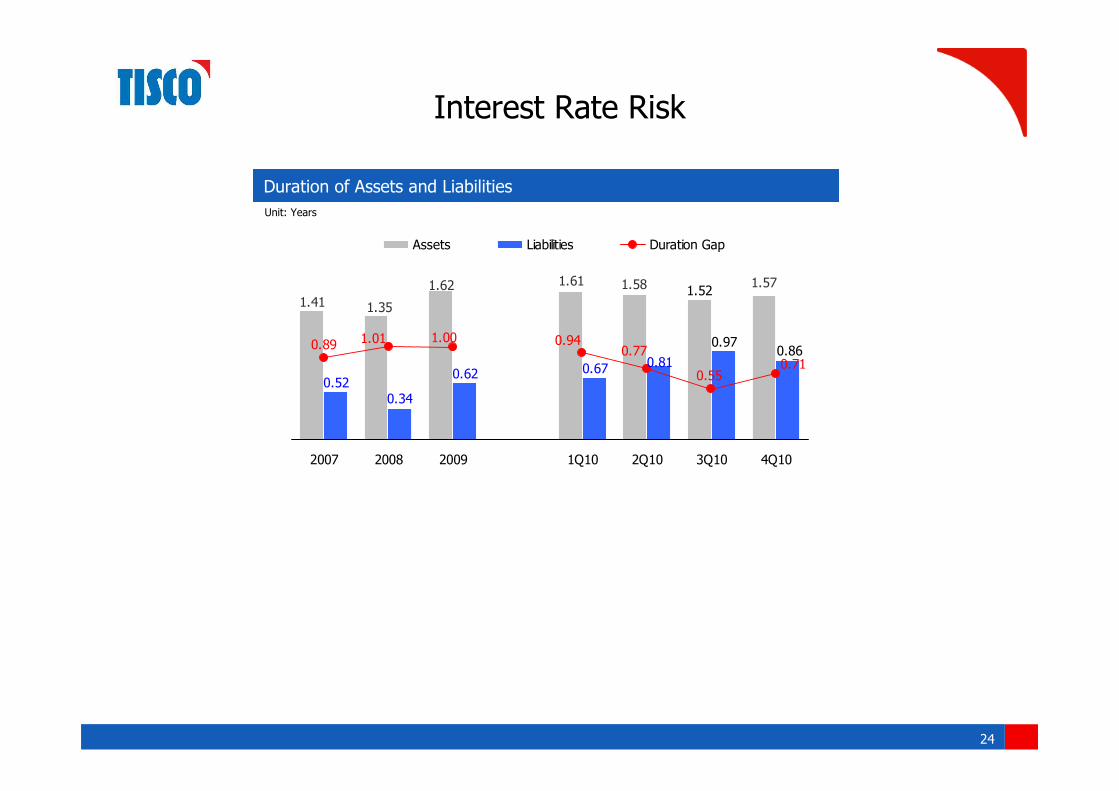
Interest Rate Risk
Duration of Assets and Liabilities
1.571.611.62
1.351.41
1.58 1.52
0.62
0.860.97
0.81
0.520.34
0.67
0.941.001.010.89
0.55
0.770.71
2007 2008 2009 1Q10 2Q10 3Q10 4Q10
Assets Liabilities Duration Gap
Unit: Years

25
Investor Relations
TISCO Financial Group Public Company Limited
48/2 TISCO Tower, North Sathorn Road
Silom, Bangrak, Bangkok 10500
Thailand
Tel: +66-2-633-6868
Fax: +66-2-633-6855
Email: [email protected]
Website: www.tisco.co.th