tip-enhanced optical spectroscopy
TRANSCRIPT
10.1098/rsta.2003.1348
Tip-enhanced optical spectroscopy
By Achim Hartschuh, Michael R. Beversluis,
Alexandre Bouhelier and Lukas Novotny
The Institute of Optics, University of Rochester,Rochester, NY 14627, USA ([email protected])
Published online 13 February 2004
Spectroscopic methods with high spatial resolution are essential for understandingthe physical and chemical properties of nanoscale materials including biological pro-teins, quantum structures and nanocomposite materials. In this paper, we describemicroscopic techniques which rely on the enhanced electric field near a sharp, laser-irradiated metal tip. This confined light-source can be used for the excitation ofvarious optical interactions such as two-photon excited fluorescence or Raman scat-tering. We study the properties of the enhanced fields and demonstrate fluorescenceand Raman imaging with sub-20 nm resolution.
Keywords: near-field optics; Raman spectroscopy;fluorescence imaging; second-harmonic generation
1. Introduction
The general aim of near-field optical microscopy is to extend spatial optical resolutionbeyond the diffraction limit (Lewis et al. 1984; Pohl et al. 1984). The introduction ofthe aperture probe (Betzig & Trautman 1992) for near-field microscopy has allowedfluorescence imaging with sub-diffraction resolution and has stimulated interests inmany disciplines, especially the material and biological sciences (see, for example,Dunn 1999). The widely adopted aperture approach is based on an aluminium-coatedfibre tip of which the foremost end is left uncoated to form a small aperture. Unfor-tunately, only a tiny fraction (up to 10−4 for a 100 nm aperture) of the light coupledinto the fibre is emitted by the aperture because of the cut-off of propagating wave-guide modes (Novotny & Pohl 1995).
The use of laser-illuminated metal tips for near-field imaging has been discussedby many groups. In general, two different types can be distinguished.
Scattering-type microscopy. Here the tip locally perturbs the fields near a sam-ple surface (see, for example, Knoll & Keilmann 1999). The response to this per-turbation is detected in the far-field at the same frequency of the incident lightonly, and contains both near-field and far-field contributions.
Tip-enhanced microscopy (Wessel 1985). Locally enhanced fields at laser illu-minated metal structures are used to increase the spectroscopic response of thesystem studied within a small sample volume (e.g. Hartschuh et al. 2003; Hayazawa
One contribution of 13 to a Theme ‘Nano-optics and near-field microscopy’.
Phil. Trans. R. Soc. Lond. A (2004) 362, 807–819807
c© 2004 The Royal Society
Dow
nloa
ded
from
http
s://r
oyal
soci
etyp
ublis
hing
.org
/ on
18 J
anua
ry 2
022

808 A. Hartschuh, M. R. Beversluis, A. Bouhelier and L. Novotny
et al. 2001; Sanchez et al. 1999; Stockle et al. 2000). The flexibility of the techniqueallows the study of a variety of spectroscopic signals, including local fluorescenceor Raman spectra, as well as time-resolved measurements such as fluorescencetransients.
Section 2 contains a brief theoretical description of electric field enhancement ata metal tip. Using this information, the experimental requirements and expectedproperties of the fields are discussed. In the § 3, the general experimental set-up isintroduced. In the following three sections, applications of tip-enhanced spectroscopyare demonstrated: second-harmonic generation, two-photon excited fluorescence andRaman scattering.
2. Field-enhancement at a metal tip
Field enhancement near nanoscale metal structures plays a central role in opticalphenomena such as surface-enhanced Raman scattering (SERS), second-harmonic(SH) generation and near-field microscopy. The enhancement originates from a com-bination of the electrostatic lightning-rod effect, which is due to the geometric singu-larity of sharply pointed structures, and localized surface plasmon resonances whichdepend sensitively on the excitation wavelength. The incident light drives the freeelectrons in the metal along the direction of polarization. While the charge densityis zero inside the metal at any instant of time, charges accumulate on the surface ofthe metal. When the incident polarization is perpendicular to the tip axis, diamet-rically opposed points on the tip surface have opposite charges. As a consequence,the foremost end of the tip remains uncharged and no field enhancement is achieved.On the other hand, when the incident polarization is parallel to the tip axis, theinduced surface charge density is almost rotationally symmetric and has the highestamplitude at the end of the tip (Larsen & Metiu 2001; Martin et al. 2001; Novotnyet al. 1998).
The calculated field distribution [|Elocal(r, ω)|2] within a plane parallel to the tipaxis near a sharp gold tip located above a glass substrate and irradiated by an on-axis focused Hermite Gaussian (1,0) laser mode is presented in figure 1a. The figuredemonstrates that the enhanced field is confined to the tip apex (diameter 20 nm) inall three dimensions. The illuminated tip thus represents a nanoscale light source. Themaximum enhancement of the electric field intensity M = |Elocal(r, ω)|2/|Ein(r, ω)|2calculated for a solid gold tip with a diameter of 10 nm at an excitation wavelengthof 830 nm is around 250.
To establish a strong field enhancement at the tip, the electric field of the excitinglaser beam needs to be polarized along the tip axis. The influence of tip shape andmaterial on the field enhancement has been discussed in a series of publications withthe aim to find the optimum tip (Krug et al. 2002; Martin et al. 2001).
3. Experimental set-up
The experimental set-up is based on an inverted optical microscope with an x, y scanstage for raster scanning a transparent sample. The light source for SH and two-photon excitation is a mode-locked Ti-sapphire laser providing 100 fs pulses tunablebetween 720 and 960 nm. For Raman experiments a continuous-wave laser at 633 nm
Phil. Trans. R. Soc. Lond. A (2004)
Dow
nloa
ded
from
http
s://r
oyal
soci
etyp
ublis
hing
.org
/ on
18 J
anua
ry 2
022

Tip-enhanced optical spectroscopy 809
control electronics
spectrograph
avalanche photodiode cooled CCD
inverted microscope
probe head
data display
filterfilter
filter
laser
1
20 nm
2
1 2
4
0.5
1
2
2
(a) (b)
λ2λ1
Figure 1. (a) Calculated field distribution [|Elocal(r, ω)|2] near a gold tip located above a glasssubstrate and irradiated by an on-axis focused Hermite Gaussian (1,0) laser mode. The contourlines scale by a factor of two. (b) Schematic of the experimental set-up. A sharp metal tip isscanned through a tightly focused laser beam. The optical signal is detected either by an APDor by a combination of spectrograph and a CCD.
is used. The laser beam is reflected by a dichroic beam splitter and focused bya high-numerical-aperture (high-NA) objective (1.4 NA) on the sample surface. Asharp gold or silver tip is positioned near the focus of the beam and maintainedabove the sample surface at a distance of ca. 1–2 nm by means of a sensitive shear-force feedback mechanism (Karrai & Grober 1995). The optical signal is collectedwith the same objective, transmitted by the beam splitter and filtered by a long orbandpass filter to remove the fundamental laser light. The signal is detected eitherby a combination of a spectrograph and a cooled charge-coupled device (CCD) or bya narrow bandpass filter followed by a single-photon counting avalanche photodiode(APD). A near-field optical image is established by raster scanning the sample andsimultaneously recording the optical signal. Sharp gold and silver tips are producedby electrochemical etching followed by focused ion beam milling (FIB) in the caseof silver. SEM images of the tips are taken before and after scanning to ensurewell-defined tip shapes.
To establish a strong field enhancement at the tip, the electric field of the excitinglaser beam needs to be polarized along the tip axis (see § 2). To achieve this conditionin our on-axis illumination scheme, we displace the tip from the centre of the beam inthe direction of polarization into one of the two longitudinal field lobes characteristicfor strongly focused Gaussian beams or we use higher-order laser modes such as theHermite Gaussian (1,0) mode or the radially polarized mode (Novotny et al. 1998;Quabis et al. 2000) with strong longitudinal fields in the centre of the focus.
4. Second-harmonic generation
Second-harmonic generation (SHG) in gold has been studied extensively in the con-text of near-field optical microscopy (Bozhevolnyi & Lozovski 2002; Novotny et al.1998; Smolyaninov et al. 2001; Zayats et al. 2000). In most of these investigations,
Phil. Trans. R. Soc. Lond. A (2004)
Dow
nloa
ded
from
http
s://r
oyal
soci
etyp
ublis
hing
.org
/ on
18 J
anua
ry 2
022

810 A. Hartschuh, M. R. Beversluis, A. Bouhelier and L. Novotny
(nm)
inte
nsity
(ar
b. u
nits
)
(a)
tip–sample distance (nm)
(b)3
0
2
1
350 400 450 500 550 600 650 700
1
00 10 20 30 40 50
λ
inte
nsity
(ar
b. u
nits
)
Figure 2. (a) Spectrum detected for a gold tip after fs-pulse excitation at 860 nm by the longi-tudinal field of a tightly focused Gaussian laser beam. A huge second-harmonic peak at 430 nmand a weak broadband continuum are observed. (b) Evolution of the second-harmonic intensityas a function of tip–sample separation (circles). The solid line represents an exponential fit witha decay length of 25 nm.
thin metallic films were excited by a femtosecond laser pulse coupled to a near-field optical probe. These studies revealed that the generation of the SH light is notdistributed homogeneously over the film surface but arises mainly from randomlylocated confined regions (Bozhevolnyi et al. 2003). The increased SH responses ofthese regions were found to correlate with large electromagnetic field enhancementmainly originating from local excitation of resonant surface plasmons.
In this section, the direct connection between field enhancement and SHG isdemonstrated experimentally using sharp gold tips with well-defined sizes and shapes.Furthermore, the observed SH intensity can be used to quantify the field enhance-ment achieved in the experiment. We show that the generation of SH light is confinedto the tip apex and discuss the applicability of the tip-controlled SHG as a nanoscalelight source.
In our experiment, a sharp gold tip is placed in the focal region of a diffraction-limited femtosecond laser beam with a wavelength of 860 nm (see figure 1b). The tipis positioned into one of the two longitudinal field lobes of a focused Gaussian beamto maximize the expected field enhancement effect (Bouhelier et al. 2003b). Figure 2ashows a typical emission spectrum of a gold tip. The spectrum is dominated by asharp peak at 430 nm (twice the excitation frequency) caused by SHG at the tip.Additionally, a weak, broadband emission continuum is observed which is discussedelsewhere (Beversluis et al. 2003).
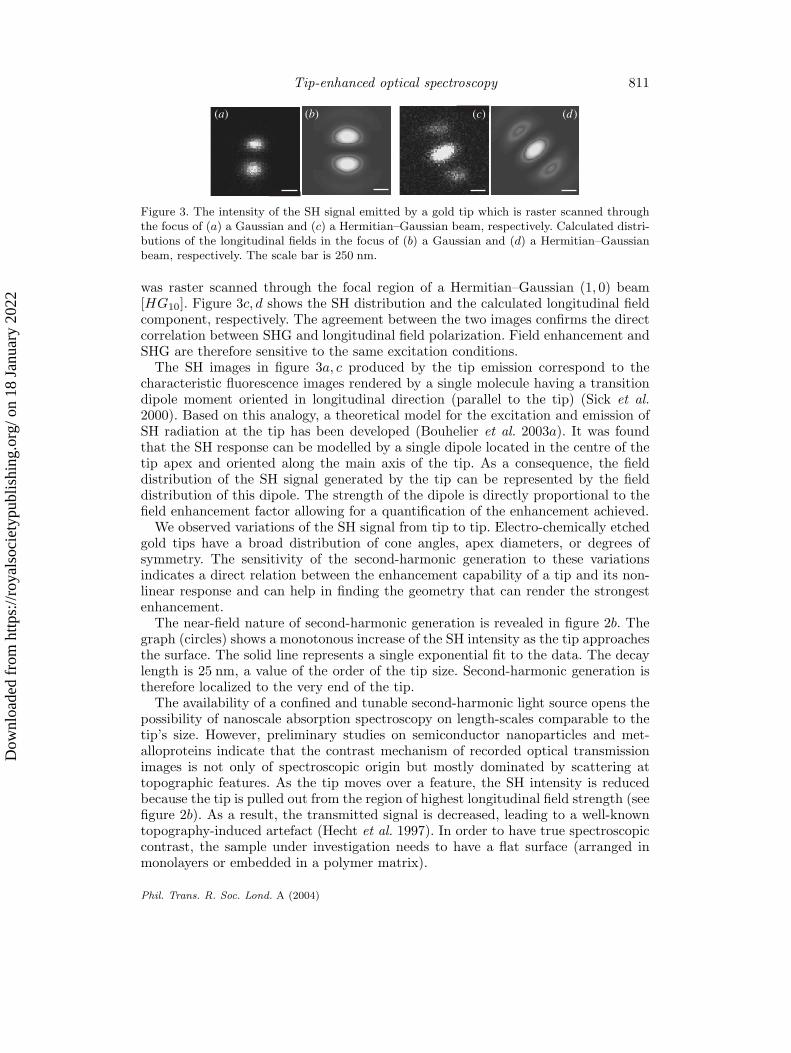
As discussed in § 2, a strong field enhancement is established only for light polar-ized parallel to the tip axis (longitudinal fields). Since efficient SHG requires fieldenhancement, the SH intensity should also be sensitive to this field polarization. Fig-ure 3a shows the intensity of the SH signal emitted by a gold tip which is rasterscanned through the focal spot of a Gaussian laser beam. The highest intensitiesare located in two equally bright spots oriented parallel to the incident polarizationdirection (vertical in the figure). Figure 3b represents the calculated longitudinal fielddistribution in a focused Gaussian beam using the experimental parameters. Heretoo, the intensity is confined in a two-lobe region. The similarity between figure 3aand figure 3b indicates that the SH signal is generated only when the tip is excitedby fields polarized along its axis. To further confirm this result, the same gold tip
Phil. Trans. R. Soc. Lond. A (2004)
Dow
nloa
ded
from
http
s://r
oyal
soci
etyp
ublis
hing
.org
/ on
18 J
anua
ry 2
022
Tip-enhanced optical spectroscopy 811
(a) (b) (c) (d)
Figure 3. The intensity of the SH signal emitted by a gold tip which is raster scanned throughthe focus of (a) a Gaussian and (c) a Hermitian–Gaussian beam, respectively. Calculated distri-butions of the longitudinal fields in the focus of (b) a Gaussian and (d) a Hermitian–Gaussianbeam, respectively. The scale bar is 250 nm.
was raster scanned through the focal region of a Hermitian–Gaussian (1, 0) beam[HG10]. Figure 3c, d shows the SH distribution and the calculated longitudinal fieldcomponent, respectively. The agreement between the two images confirms the directcorrelation between SHG and longitudinal field polarization. Field enhancement andSHG are therefore sensitive to the same excitation conditions.
The SH images in figure 3a, c produced by the tip emission correspond to thecharacteristic fluorescence images rendered by a single molecule having a transitiondipole moment oriented in longitudinal direction (parallel to the tip) (Sick et al.2000). Based on this analogy, a theoretical model for the excitation and emission ofSH radiation at the tip has been developed (Bouhelier et al. 2003a). It was foundthat the SH response can be modelled by a single dipole located in the centre of thetip apex and oriented along the main axis of the tip. As a consequence, the fielddistribution of the SH signal generated by the tip can be represented by the fielddistribution of this dipole. The strength of the dipole is directly proportional to thefield enhancement factor allowing for a quantification of the enhancement achieved.
We observed variations of the SH signal from tip to tip. Electro-chemically etchedgold tips have a broad distribution of cone angles, apex diameters, or degrees ofsymmetry. The sensitivity of the second-harmonic generation to these variationsindicates a direct relation between the enhancement capability of a tip and its non-linear response and can help in finding the geometry that can render the strongestenhancement.
The near-field nature of second-harmonic generation is revealed in figure 2b. Thegraph (circles) shows a monotonous increase of the SH intensity as the tip approachesthe surface. The solid line represents a single exponential fit to the data. The decaylength is 25 nm, a value of the order of the tip size. Second-harmonic generation istherefore localized to the very end of the tip.
The availability of a confined and tunable second-harmonic light source opens thepossibility of nanoscale absorption spectroscopy on length-scales comparable to thetip’s size. However, preliminary studies on semiconductor nanoparticles and met-alloproteins indicate that the contrast mechanism of recorded optical transmissionimages is not only of spectroscopic origin but mostly dominated by scattering attopographic features. As the tip moves over a feature, the SH intensity is reducedbecause the tip is pulled out from the region of highest longitudinal field strength (seefigure 2b). As a result, the transmitted signal is decreased, leading to a well-knowntopography-induced artefact (Hecht et al. 1997). In order to have true spectroscopiccontrast, the sample under investigation needs to have a flat surface (arranged inmonolayers or embedded in a polymer matrix).
Phil. Trans. R. Soc. Lond. A (2004)
Dow
nloa
ded
from
http
s://r
oyal
soci
etyp
ublis
hing
.org
/ on
18 J
anua
ry 2
022

812 A. Hartschuh, M. R. Beversluis, A. Bouhelier and L. Novotny
5. Two-photon excited fluorescence
Fluorescence microscopy is a valuable technique used extensively in biology andmedical research. However, the length-scale of many biological systems of interest,such as single proteins, is of the order of 10 nm. This is far below the diffraction limitfor visible wavelengths, and even beyond the reach of aperture-type near-field opticalmicroscopes. Because the spatial resolution of tip-enhanced techniques is limited onlyby the tip size, optical spectroscopy of single proteins seems to be achievable.
A key issue in near-field fluorescence imaging with metal tips is the rejection of thefar-field background signal from the entire illuminated area. In order to enhance thenear-field contrast, we use two-photon excitation of fluorescence. Since two-photonexcitation is a nonlinear process with quadratic dependence on excitation intensity,the detected fluorescence signal becomes proportional to the square of the intensityenhancement factor M2 (Sanchez et al. 1999).
The flux of fluorescence photons Φfl upon laser illumination at frequency ωI andintensity II can be calculated using the two-photon absorption cross-section of thesample σ2ph(ωI) and the fluorescence quantum yield of the emitter in the presenceof the tip Qfl:
Φfl =I2I
�2ω2Iσ2phQflM2. (5.1)
The high peak intensities required for a multi-photon process can be provided byultrafast laser systems with pulse widths in the range of hundreds of femtoseconds(full width, half-maximum, FWHM). Higher-order excitation processes are possibletoo, however, photodamage of the sample at high excitation densities has to beconsidered.
Near-field fluorescence imaging with 20 nm resolution of two different materialswas first reported by (Sanchez et al. 1999) and our group continued the studyof J-aggregates of pseudoisocyanine (PIC) dye. Figure 4 shows the simultaneouslyrecorded near-field image and the topographic shear-force image of PIC J-aggregatesembedded in a polyvinyl siloxane (PVS) film. The optical image is formed by collect-ing the fluorescence signal after non-resonant excitation at 830 nm using an appro-priate bandpass filter (transmission between 550 and 750 nm) followed by an APD.In both images, characteristic one-dimensional strands of J-aggregates are observed,confirming a close correlation between topographic and optical image. The cross-section shown in figure 4d features a width of ca. 25 nm, demonstrating clear sub-diffraction resolution.
While the two images in figure 4 are similar, it has to be emphasized that the opti-cal image contains far more information than the topographic image. By selectingmultiple spectral detection ranges, different emitting species with different fluor-escence spectra can be imaged simultaneously, offering a wealth of spectroscopicinformation.
More precisely, the image formed by fluorescence microscopy not only shows thefluorescence properties but a combination of both two-photon absorption cross-section and fluorescence properties of the sample. In fact, because of the fast energytransfer in J-aggregates, the detected signal can originate from a location displacedfrom the position of excitation.
Furthermore, the pulsed excitation of the sample offers the possibility for time-resolved fluorescence measurements. Using time-correlated single photon counting
Phil. Trans. R. Soc. Lond. A (2004)
Dow
nloa
ded
from
http
s://r
oyal
soci
etyp
ublis
hing
.org
/ on
18 J
anua
ry 2
022

Tip-enhanced optical spectroscopy 813
200 400 600 800 1000
10
20
30
0
0
topo
grap
hy (
nm)
distance (nm)
90
100
110
80
phot
on c
ount
s (k
Hz)
30000 1000 2000distance (nm)
topography
fluorescence
(c)
(d)
(a)
(b)
Figure 4. Simultaneous (a) topographic image and (b) near-field two-photon excited fluorescenceimage of J-aggregates of PIC dye in a PVS film on a glass substrate. Cross-sections along thedashed white lines indicate that the optical image (d) has slightly better resolution than thetopographic image (c) (FWHM of 25 nm against 30 nm).
0 10 20 30 40 50
0.2
0.4
0.6
0.8
norm
. int
ensi
ty
tip–sample distance (nm)
Figure 5. Distance dependence of the two-photon excited fluorescencefrom J-aggregates after femtosecond excitation at 833 nm.
(TCSPC), the combination of near-field optics and ultrafast spectroscopy is readilyachieved. The observation of photo-induced processes, such as charge transfer, energytransfer or isomerization reactions on the nanoscale is feasible.
Phil. Trans. R. Soc. Lond. A (2004)
Dow
nloa
ded
from
http
s://r
oyal
soci
etyp
ublis
hing
.org
/ on
18 J
anua
ry 2
022

814 A. Hartschuh, M. R. Beversluis, A. Bouhelier and L. Novotny
The optical resolution apparent in figure 4 shows that the enhanced field is laterallyconfined to the size of the metal tip. To demonstrate the confinement of the enhancedfields in the longitudinal direction, the tip is positioned above a J-aggregate and thefluorescence intensity is recorded as a function of tip–sample distance, d. Accordingto equation (5.1), the signal strength is expected to scale with the fourth powerof the enhanced field. The latter can be approximated well by the field of a singledipole oriented along the tip axis and thus in the near-field it can be expected thatthe experimental signal scales with d−12, with d being the distance between dipoleorigin and sample surface. This dependence is verified in our experiments if one takesinto account that the tip–sample distance equals (d−r0), with r0 being the tip radius(figure 5).
Because of the small separation between emitter and metal tip (ca. 1–2 nm), non-radiative energy transfer from the electronically excited molecule to the metal hasto be taken into account. This process would represent an additional relaxationpathway and would reduce the number of detected fluorescence photons. While thetheory of energy transfer between molecules and flat metal interfaces is well under-stood in the framework of phenomenological classical theory (Barnes 1998; Chance etal. 1978), nanometre-sized objects are more difficult to describe than flat interfaces.For extended silver interfaces, the lifetime of a molecule on top of the interface isreduced by more than two orders of magnitude compared with the lifetime in freespace. For a sharp metal tip, the quenching effect can be expected to be smallerbecause the interaction area is reduced. Furthermore, although the excited-state life-time of a molecule is reduced close to metal nanostructures, the balance betweenradiative and non-radiative decay rates depends sensitively on the particular geome-try. The measured distance dependence shown in figure 5 follows the expected d−12
dependence and gives no indication of a strong quenching effect. Of course, quench-ing of J-aggregates is strongly reduced because of the fast excitonic delocalization ofthe excitation energy (Sanchez et al. 1999).
6. Raman scattering
Fluorescence imaging requires a high-fluorescence quantum yield of the system stud-ied or artificial labelling with fluorophores. Furthermore, fluorescence spectra oforganic molecules are often broad and featureless, impeding their clear identificationwithin complex systems. On the other hand, Raman scattering probes the uniquevibrational spectrum of the sample and reflects its chemical composition and molec-ular structure directly. The main drawback of Raman scattering is the extremely lowscattering cross-section, which is typically 14 orders of magnitude smaller than thecross-section of fluorescence. SERS, induced by nanometre-sized metal structures,has been shown to provide enormous enhancement factors of up to 1015, allowingfor Raman spectroscopy even on the single-molecule level (see, for example, Nie& Emory 1997). The strongest contribution to SERS is of electromagnetic origin,caused by the enhancement of the local field EL with respect to the incident fieldEI. For the present studies, we do not expect significant contributions from chemicaleffects based on charge-transfer processes between scatterer and metal or overlappingelectron wave functions due to the large tip–sample separation of more than 1 nm.
The electromagnetic enhancement factor Mi is defined as the ratio between themeasured Raman cross-section in the presence and in the absence of the metal surface
Phil. Trans. R. Soc. Lond. A (2004)
Dow
nloa
ded
from
http
s://r
oyal
soci
etyp
ublis
hing
.org
/ on
18 J
anua
ry 2
022
Tip-enhanced optical spectroscopy 815
for each scatterer i. The integrated photon flux ΦRaman is a linear function of theintensity of the incident laser light II at frequency ωI and results from the sum of theRaman scattering cross-sections σR
i of all scatterers within the detection volume:
ΦRaman =II
�ωI
N∑i=1
σRi Mi. (6.1)
The electromagnetic enhancement Mi is caused by enhancement of both the incidentfield EI at ωI and the scattered field EI at ωI − ων , where ων is the vibrationalfrequency, and can be expressed as the product with the total local electric field EL,
Mi =[EL(ωI)EI(ωI)
]2[EL(ωI − ων)EI(ωI − ων)
]2
≈[EL(ωI)EI(ωI)
]4
, (6.2)
where we used ων � ωI.Enhancement factors reaching up to 12 orders of magnitude are reported for par-
ticular multiple-particle configurations involving interstitial sites between particlesor outside sharp surface protrusions (Xu et al. 2000). For a single spherical particle,M is supposed to be much lower, in the range 100–1000. Near-field Raman scatter-ing induced by a laser-irradiated metal tip has been experimentally demonstrated inStockle et al. (2000), Nieman et al. (2001), Hayazawa et al. (2002) and Hartschuhet al. (2003). In this section, we present near-field Raman imaging and spectroscopyon single-walled carbon nanotubes (SWNTs). The three major advantages of themethod are demonstrated: high spatial resolution, signal enhancement (enhancedsensitivity) and chemical specificity.
SWNTs are highly elongated tubular graphitic molecules, which have been thefocus of intense interest due to a large variety of potential technological applications.The unique properties of SWNTs arise from their particular one-dimensional struc-ture, which is directly linked to the characteristic Raman bands. Raman scatteringof SWNTs has been studied intensively in the literature (see, for example, Dues-berg et al. 2000; Jorio et al. 2001) and Raman enhancements of up to 1012 havebeen reported for tubes in contact with fractal silver colloidal clusters (Kneipp et al.2000).
In figure 6a a near-field Raman image of SWNTs on glass is shown togetherwith the simultaneously acquired topography image of the same sample area infigure 6b. Raman images were acquired by detecting the intensity of the G bandaround 1600 cm−1 after laser excitation at 633 nm using a radially polarized lasermode while raster scanning the sample. The spatial resolution can be determinedfrom the width of the signals presented as line scans in figure 6c, d to be ca. 20 nm.The sharpest images observed so far feature an optical resolution of ca. 12 nm, lim-ited by the tip diameter. The height of the observed SWNT is ca. 1 nm, as can beseen in figure 6d.
Raman spectra detected on top of an SWNT in the presence of the tip and withouttip is presented in figure 7a. The signal enhancement induced by the tip can beestimated by comparison of the integrated intensities of the observed Raman band.In the present example, the intensity of the G band of the SWNT between 1500and 1650 cm−1 is approximately 12000 (background subtracted). In absence of thetip, the signal is much weaker (up to 100). From figure 7a it is clear that, without
Phil. Trans. R. Soc. Lond. A (2004)
Dow
nloa
ded
from
http
s://r
oyal
soci
etyp
ublis
hing
.org
/ on
18 J
anua
ry 2
022

816 A. Hartschuh, M. R. Beversluis, A. Bouhelier and L. Novotny
Figure 6. Simultaneous (a) near-field Raman image and (b) topographic image of SWNTs onglass. Scan area, 2 × 1 µm2. The Raman image is acquired by detecting the intensity of theG band upon laser excitation at 633 nm. The dark regions in the topography image are causedsteps within the glass. (c) Cross-section taken along the indicated dashed line in the Ramanimage. (d) Cross-section taken along the indicated dashed line in the topographic image. Theheight of the individual tube is ca. 1.0 nm. Vertical units are photon counts per second for (c)and nanometres for (d).
1000 20000
100
200
300
400
phot
on c
ount
s (s
−1)
Raman shift (cm−1)0 5 10 15 20
0
1
2
3
phot
on c
ount
s
tip–sample distance (nm)
(a)
Figure 7. Tip-enhanced Raman spectra of SWNTs. (a) Spectra detected with tip on top of anSWNT (solid line) and with tip retracted by 2 µm (dashed line). The Raman signal of the radialbreathing mode (RBM) is marked. Both spectra are on top of a broad background which iscaused by scattering from cover glass and the immersion oil (also detected in the absence ofSWNTs). (b) Dependence of the Raman scattering strength of the G band on the longitudinalseparation between a single SWNT and the tip for small distances of less than 20 nm. The greyline is a model curve using a d−12 dependency.
the enhancement provided by the tip, the detection of the SWNT would have beenimpossible.
For an evaluation of the enhancement factor, the different areas probed by near-field and far-field components must be taken into account. The length of the SWNT(width w ≈ 1 nm) is larger than the diameter of the focus (f = 300 nm), resulting
Phil. Trans. R. Soc. Lond. A (2004)
Dow
nloa
ded
from
http
s://r
oyal
soci
etyp
ublis
hing
.org
/ on
18 J
anua
ry 2
022

Tip-enhanced optical spectroscopy 817
in a probed area of approximately fw = 1 nm × 300 nm = 300 nm2. A much smallerarea is probed in the near-field, i.e. an area defined by the width of the near-fieldspot (15 nm) and the tube diameter (ca. 1 nm). Normalizing the measured signals infigure 7a with the ratio of the detected areas yields an enhancement factor of M ≈2400. Since M scales approximately with the fourth power of the field enhancement,the locally enhanced field is roughly seven times stronger than the incident field.
Potential modifications of the Raman lines or changes in their relative amplitudescaused by the tip have not been observed so far, but would be difficult to distinguish.Far-field spectra arise from a superposition of all Raman signals within the confocaldetection volume whereas near-field spectra are sensitive to local variations, such asstructural defects. Any comparison between near-field and far-field spectra has todistinguish between possible modifications caused by the tip and local fluctuationsof the Raman signals caused by structural variations.
The chemical specificity of the near-field Raman method was used by (Hartschuhet al. 2003) to distinguish between SWNTs and humidity related water contam-inations on the sample surface. This specificity can be used to detect nanotubestructure and to distinguish between SWNTs of different types. The spectral posi-tion of the radial breathing mode peak in figure 7 of νRBM = 199.0 cm−1 matchesthe calculated value for a metallic SWNT with structural parameters (14, 2), whichrenders νRBM = 198.9 cm−1 and a diameter of d = 1.2 nm (Bachilo et al. 2002)(d = 223.5 nm/(νRBM − 12.5 cm−1)).
According to equation (6.2), the signal strength is expected to scale with the fourthpower of the enhanced field. If we approximate the enhanced field by the field of asingle dipole oriented along the tip axis, a distance dependence of d−12 is expected asfor the two-photon excitation of fluorescence in § 5. The Raman scattering strengthrecorded as a function of tip–sample distance d shown in figure 7 can be well describedusing a d−12 dependence (grey line in figure 7).
7. Outlook
The spatial resolution achieved in tip-enhanced near-field microscopy and spec-troscopy is generally superior to aperture-based techniques. The field confinement isdefined by the sharpness of the tip and the field distribution is approximated rea-sonably well by the field of a dipole oriented in direction of tip axis and located inthe centre of the tip apex. It is likely that the tip enhancement technique will pro-vide resolutions better than 10 nm, a length-scale comparable to biological proteinsand semiconductor quantum structures. To become a routine technique, the fieldenhancement needs to be improved using favourable tip materials and geometries.In analogy to antenna theory, a finite tip size (e.g. λ/2) is expected to provide muchhigher enhancement. It is also desirable to reduce the far-field interaction area withthe sample surface and to combine, for example, an aperture near-field probe with afinite-sized metal tip (Frey et al. 2003). To clarify the trade-off between enhancementand quenching, dedicated experiments on single molecules are necessary. These stud-ies require the simultaneous measurements of fluorescence yield and lifetime, and theinvestigation of orientational and polarization properties (Novotny 1996). Applied toRaman scattering, the tip-enhancement technique has great potential for clarifyingopen questions in SERS.
Phil. Trans. R. Soc. Lond. A (2004)
Dow
nloa
ded
from
http
s://r
oyal
soci
etyp
ublis
hing
.org
/ on
18 J
anua
ry 2
022

818 A. Hartschuh, M. R. Beversluis, A. Bouhelier and L. Novotny
The authors acknowledge stimulating discussions with Todd D. Krauss, Neil Anderson, X. Sun-ney Xie and Erik J. Sanchez. This work was funded by the US Department of Energy (grant DE-FG02-01ER15204), the National Science Foundation (grants DMR-0078939 and BES-0086368),and partly by the Swiss National Science Foundation through a postdoctoral fellowship to A.B.
References
Bachilo, S. M., Strano, M. S., Kittrell, C., Hauge, R. H., Smalley, R. E. & Weisman, R. B. 2002Structure-assigned optical spectra of single-walled carbon nanotubes. Science 298, 2361–2366.
Barnes, W. L. 1998 Fluorescence near interfaces: the role of photonic mode density. J. Mod.Opt. 45, 661–669.
Betzig, E. & Trautman, J. K. 1992 Near-field optics: microscopy, spectroscopy, and surfacemodification beyond the diffraction limit. Science 257, 189–195.
Beversluis, M. R., Bouhelier, A. & Novotny, L. 2003 Continuum generation from single goldnanostructures through near-field mediated intraband transitions. Phys. Rev. B68, 115433.
Bouhelier, A., Beversluis, M., Hartschuh, A. & Novotny, L. 2003a Near-field second-harmonicgeneration induced by local field enhancement. Phys. Rev. Lett. 90, 013903.
Bouhelier, A., Beversluis, M. R. & Novotny, L. 2003b Near-field scattering of longitudinal fields.Appl. Phys. Lett. 82, 4596–4598.
Bozhevolnyi, S. I. & Lozovski, V. Z. 2002 Second-harmonic scanning optical microscopy ofindividual nanostructures. Phys. Rev. B65, 235420.
Bozhevolnyi, S. I., Beerman, J. & Coello, V. 2003 Direct observation of localized second-harmonicenhancement in random metal nanostructures. Phys. Rev. Lett. 90, 197403.
Chance, R. R., Prock, A. & Silbey, R. 1978 Molecular fluorescence and energy transfer nearinterfaces. In Advances in chemical physics (ed. I. Progogine & S. A. Rice), vol. 37, pp. 1–65.Wiley.
Duesberg, G. S., Loa, I., Burghard, M., Syassen, K. & Roth, S. 2000 Polarized Raman spec-troscopy on isolated single-wall carbon nanotubes. Phys. Rev. Lett. 85, 5436–5439.
Dunn, B. 1999 Near-field scanning optical microscopy. Chem. Rev. 99, 2891–2928.Frey, H. G., Keilmann, F., Kriele, A. & Guckenberger, R. 2003 Enhancing the resolution of
scanning near-field optical microscopy by a metal tip grown on an aperture probe. Appl.Phys. Lett. 81, 5030–5032.
Hartschuh, A., Sanchez, E. J., Sunney, X. S. & Novotny, L. 2003 High-resolution near-fieldRaman microscopy of single-walled carbon nanotubes. Phys. Rev. Lett. 90, 095503.
Hayazawa, N., Inouye, Y., Sekkat, Z. & Kawata, S. 2001 Near-field Raman scattering enhancedby a metallized tip. Chem. Phys. Lett. 335, 369–374.
Hayazawa, N., Inouye, Y., Sekkat, Z. & Kawata, S. 2002 Near-field Raman imaging of organicmolecules by an apertureless metallic probe scanning optical microscope. J. Chem. Phys. 117,1296–1301.
Hecht, B., Bielefelt, H., Inouye, Y., Pohl, D. W. & Novotny, L. 1997 Facts and artifacts innear-field optical microscopy. J. Appl. Phys. 81, 2492–2498.
Jorio, A., Saito, R., Hafner, J. H., Lieber, C. M., Hunter, M., McClure, T., Dresselhaus, G.& Dresselhaus, M. S. 2001 Structural (n, m) determination of isolated single-wall carbonnanotubes by resonant Raman scattering. Phys. Rev. Lett. 86, 1118–1121.
Karrai, K. & Grober, R. D. 1995 Piezoelectric tip–sample distance control for near field opticalmicroscopes. Appl. Phys. Lett. 66, 1842–1844.
Kneipp, K. (and 10 others) 2000 Surface-enhanced and normal Stokes and anti-Stokes Ramanspectroscopy of single-walled carbon nanotubes. Phys. Rev. Lett. 84, 3470–3473.
Knoll, B. & Keilmann, F. 1999 Near-field probing of vibrational absorption for chemical micro-scopy. Nature 399, 134–136.
Phil. Trans. R. Soc. Lond. A (2004)
Dow
nloa
ded
from
http
s://r
oyal
soci
etyp
ublis
hing
.org
/ on
18 J
anua
ry 2
022

Tip-enhanced optical spectroscopy 819
Krug, J. T. I., Sanchez, E. J. & Xie, X. S. 2002 Design of near-field probes with optimal fieldenhancement by finite difference time domain electromagnetic simulation. J. Chem. Phys.116, 10 895–10 901.
Larsen, R. E. & Metiu, H. 2001 Resolution and polarization in apertureless near-field microscopy.J. Chem. Phys. 114, 6851–6860.
Lewis, A., Isaacson, M., Harootunian, A. & Muray, A. 1984 Development of a 500 A resolutionlight microscope. Ultramicroscopy 13, 227–231.
Martin, Y. C., Hamann, H. F. & Wickramasinghe, H. K. 2001 Strength of the electric field inapertureless near-field optical microscopy. J. Appl. Phys. 89, 5774–5778.
Nie, S. & Emory, S. R. 1997 Probing single molecules and single nanoparticles by surface-enhanced Raman scattering. Science 275, 1102–1106.
Nieman, L. T., Krampert, G. M. & Martinez, R. E. 2001 An apertureless near-field scanningoptical microscope and its application to surface-enhanced Raman spectroscopy and multi-photon fluorescence imaging. Rev. Scient. Instrum. 72, 1691–1699.
Novotny, L. 1996 Single molecule fluorescence in inhomogeneous environments. Appl. Phys. Lett.69, 3806–3808.
Novotny, L. & Pohl, D. W. 1995 Light propagation in scanning near-field optical microscopy.NATO Adv. Stud. Inst. E184, 21–33.
Novotny, L., Sanchez, E. J. & Xie, X. S. 1998 Near-field optical imaging using metal tips illu-minated by higher-order Hermite–Gaussian beams. Ultramicroscopy 71, 21–29.
Pohl, D. W., Denk, W. & Lanz, M. 1984 Optical stethoscopy: image recording with resolutionλ/20. Appl. Phys. Lett. 44, 651–653.
Quabis, S., Dorn, R., Glockl, O., Eberler, M. & Leuchs, G. 2000 Focusing light to a tighter spot.Opt. Commun. 179, 1–4.
Sanchez, E. J., Novotny, L. & Xie, X. S. 1999 Near-field fluorescence microscopy based on two-photon excitation with metal tips. Phys. Rev. Lett. 82, 4014–4017.
Sick, B., Hecht, B. & Novotny, L. 2000 Orientational imaging of single molecules by annularillumination. Phys. Rev. Lett. 85, 4482–4485.
Smolyaninov, I. I., Liang, H. Y., Lee, C. H. & Davis, C. C. 2001 Local crystal analysis usingnear-field second harmonic microscopy: application to thin ferroelectric films. J. Appl. Phys.89, 206–211.
Stockle, S. M., Suh, Y. D., Deckert, V. & Zenobi, R. 2000 Nanoscale chemical analysis bytip-enhanced Raman spectroscopy. Chem. Phys. Lett. 318, 131–136.
Wessel, J. 1985 Surface enhanced optical microscopy. J. Opt. Soc. Am. B2, 1538–1540.Xu, H., Aizpurua, J., Kall, M. & Apell, P. 2000 Electromagnetic contributions to single-molecule
sensitivity in surface-enhanced Raman scattering. Phys. Rev. E62, 4318–4324.Zayats, A. V., Kalkbrenner, T., Sandoghdar, V. & Mlynek, J. 2000 Second-harmonic generation
from individual surface defects under local excitation. Phys. Rev. B61, 4545–4548.
Phil. Trans. R. Soc. Lond. A (2004)
Dow
nloa
ded
from
http
s://r
oyal
soci
etyp
ublis
hing
.org
/ on
18 J
anua
ry 2
022