tio2 photocatalyst for removal of volatile organic …...1 tio2 photocatalyst for removal of...
TRANSCRIPT

Accepted Manuscript
Review
TiO2 photocatalyst for removal of volatile organic compounds in gas phase – Areview
Zahra Shayegan, Chang-Seo Lee, Fariborz Haghighat
PII: S1385-8947(17)31652-2DOI: https://doi.org/10.1016/j.cej.2017.09.153Reference: CEJ 17738
To appear in: Chemical Engineering Journal
Received Date: 16 August 2017Revised Date: 22 September 2017Accepted Date: 24 September 2017
Please cite this article as: Z. Shayegan, C-S. Lee, F. Haghighat, TiO2 photocatalyst for removal of volatile organiccompounds in gas phase – A review, Chemical Engineering Journal (2017), doi: https://doi.org/10.1016/j.cej.2017.09.153
This is a PDF file of an unedited manuscript that has been accepted for publication. As a service to our customerswe are providing this early version of the manuscript. The manuscript will undergo copyediting, typesetting, andreview of the resulting proof before it is published in its final form. Please note that during the production processerrors may be discovered which could affect the content, and all legal disclaimers that apply to the journal pertain.

1
TiO2 photocatalyst for removal of volatile organic compounds in gas phase – A review
Zahra Shayegan, Chang-Seo Lee and Fariborz Haghighat*
Department of Building, Civil and Environmental Engineering Concordia University, Montreal, Quebec, H3G 1M8 CANADA
Abstract
Heterogeneous photocatalytic oxidation process (PCO) is a promising technology for removing
indoor volatile organic compounds (VOCs) contaminants. Titanium dioxide (TiO2) has been
regarded as the most suitable photocatalyst for its cost effectiveness, high stability and great
capability to degrade various VOCs. However, no TiO2-based photocatalysts completely satisfy
all practical requirements given photoexcited charge carriers’ short lifetime and a wide band gap
requiring ultraviolet (UV) radiation. Strategies for improving TiO2 photocatalyst activities by
doping with different metal and/or non-metal ions and by coupling with other semiconductors
have been examined and reported. These techniques can improve PCO performance through the
following mechanisms: i) by introducing an electron capturing level in the band gap that would
generate some defects in the TiO2 lattice and help capture charge carriers; ii) by slowing down
the charge carrier recombination rate and increasing VOCs degradation. This paper reports the
outcomes of a comprehensive literature review of TiO2 modification techniques that include
approaches for overcoming the inherent TiO2 limitations and improving the photocatalytic
degradation of VOCs. Accordingly, it focuses on the recent development of modified-TiO2 used
for degrading gas phase pollutants in ambient conditions. Modification techniques, such as metal
and non-metal doping, co-doping, and the heterojunction of TiO2 with other semiconductors, are
reviewed. A brief introduction on the basics of photocatalysis and the effects of controlling
parameters is presented, followed by a discussion about TiO2 photocatalyst modification for gas
phase applications. The reported experimental results obtained with PCO for eliminating VOCs
are also compiled and evaluated.
Keywords: Volatile organic compounds (VOCs), Photocatalytic oxidation (PCO), Titanium
dioxide (TiO2), TiO2 modification, Doping, Composite.
* Corresponding Author: [email protected]
2
Contents
1. Introduction .........................................................................................................................3
2. Basic principles of photocatalytic oxidation process .............................................................4
3. Issues in VOCs photocatalytic oxidation ..............................................................................6
4. Factors affecting PCO performance ......................................................................................6
4.1. Relative humidity (RH) .................................................................................................6
4.2. Airflow rate ..................................................................................................................7
4.3. UV light intensity and type............................................................................................8
4.4. Inlet contaminant concentration ....................................................................................9
4.5. Effect of doping ............................................................................................................9
5. Different types of TiO2 doping ........................................................................................... 10
5.1. Metal doping TiO2 ...................................................................................................... 10
5.1.1. Noble metal and rare earth metal .......................................................................... 11
5.1.2. Transition metal ................................................................................................... 12
5.2. Non-metal doping TiO2 ............................................................................................... 15
5.2.1. N-doped ............................................................................................................... 16
5.2.2. C-doped ............................................................................................................... 17
5.2.3. S-doped ............................................................................................................... 17
5.3. Co-doping TiO2 .......................................................................................................... 18
5.3.1. Metals co-doped................................................................................................... 18
5.3.2. Non-metals co-doped ........................................................................................... 19
5.3.3. Metal and non-metal co-doped ............................................................................. 20
5.4. Composite semiconductors .......................................................................................... 21
6. Challenges ......................................................................................................................... 23
6.1. Limitation of doping ................................................................................................... 23
6.1.1. Limitations of metal doping ................................................................................. 23
6.1.2. Limitation of non-metal doping ............................................................................ 24
6.2. Stabilization by support structure ................................................................................ 24
6.3. Application in industrial, civil and building construction ............................................. 26
7. Conclusion ......................................................................................................................... 27
References ................................................................................................................................ 28

3
1. Introduction
Volatile organic compounds (VOCs) are a major group of biogenic/anthropogenic indoor air
pollutants with several proven adverse health effects [1]. VOCs are not only hazardous
compounds, but also participate in undesirable mechanisms with harmful by-products, including
organic compounds, ozone, and secondary organic aerosols [2]. To solve this problem, several
air purification techniques have been proposed for VOCs removal [3, 4]. Based on the literature,
photocatalyst oxidation (PCO) is a promising VOCs removal method [5, 6].
In PCO, VOCs destruction is conducted by using photocatalysts and UV light at ambient
temperature [7, 8]. Common photocatalysts (semiconductor materials) used in PCO are TiO2,
ZnO, WO3, ZnS, and CdS [9, 10]. Up to now, the application of titanium dioxide (TiO2) for
photodegradation of organic contaminates [11-13] as well as batteries and solar cells [14-17] has
generated significant attention due to its unique characteristics and environmental friendliness.
Additionally, this option is attractive given TiO2 low cost, simple preparation, high stability, and
great capability to degrade various VOCs pollutants [18-20]. Despite its merits, there are some
drawbacks, including the large band gap and high charge carrier recombination rate, which
restrict its application under visible light or natural solar light irradiation. Given the wide band
gap, the electron from TiO2 valence band can only be activated under ultraviolet (UV) radiation.
Furthermore, the quick recombination of photogenerated electrons and holes reduces photonic
efficiency and consequently PCO efficiency as well. Therefore, it is imperative to develop highly
efficient photocatalysts that separate charge carriers, slow down their recombination rate, and
can also be excited under visible irradiation.
Moreover, to enhance the quantum yield of TiO2 under visible light irradiation, two obstacles
must be overcome—the generation of photoexcited charge carriers must be enhanced, and the
separation efficiency of these photogenerated charge carriers improved [21-24].
Significant efforts have been made to overcome the aforementioned disadvantages via various
strategies such as metal or non-metal doping, co-doping, and coupling with other
semiconductors. These techniques seem effective for increasing the lifetime of the photoexcited
pairs of charge carriers and for shifting the band gap absorption edges to the visible range of
irradiation light [22, 25, 26]. Based on our knowledge, despite considerable reported research on
modifying TiO2-based photocatalysts, there is a lack of a comprehensive review regarding the
4
effect of modifying TiO2 by dopants on the removal performance of VOCs in PCO processes in
the gas phase. Here, we have provided a comprehensive literature review of TiO2 modification to
present the approaches required for overcoming the inherent TiO2 limitations and improving the
photocatalytic degradation of VOCs. Accordingly, this paper discusses modification techniques.
Such techniques include using metal and non-metal dopants, co-doped ions, and composite TiO2
with other semiconductors for photocatalytic degradation of pollutants in the gas phase. This
paper also summarizes the effects of controlling parameters such as relative humidity, air flow
rate, UV light, and initial contaminate concentration on VOCs decomposition with TiO2
photocatalysts.
2. Basic principles of photocatalytic oxidation process
Photocatalyst reactions begin when an electron is stimulated with light energy equal to or greater
than the semiconductor’s band gap (Fig. 1) [27]. Transferring a photoexcited electron from the
valence band (VB) to the conduction band (CB) leaves a hole in the latter, which can be a
powerful oxidizing agent. Consequently, electron and hole pairs (e-/h+) are produced [28-30].
These
pairs can be generated in femtoseconds (fs). Afterwards, photoexcited charge carriers can be
trapped within picoseconds (ps) (shallow trap) or nanoseconds (ns) (deep trap) [31]. The hole
and electron can recombine in a few tens of nanoseconds [32, 33].
(Figure 1)
Environmental applications of semiconductor photocatalysts are directly related to the interfacial
charge transfer mechanism between the semiconductor surface and organic compounds.
Furthermore, the mechanism and time scale of interfacial charge transfers and recombination
charge carriers could be affected by the interface structure [34, 35]. Moreover, trapped
photoexcited holes and electrons exist for nanoseconds and microseconds (µs), respectively [32,
33]. Interfacial charge transfers might oxidize or reduce pollutants directly or produce reactive
oxidants like hydroxyl radicals and superoxides [36, 37]. For TiO2, UV light (about 3% of solar
radiation) is a common energy source for PCO because of its wide band gap [38].

5
The minimum band gap energy required for a photon to generate charge carriers over a TiO2
semiconductor (anatase phase) is 3.2 eV. This is equivalent to the absorption of a 388 nm
wavelength photon. Therefore, TiO2 photoactivation occurs in λ < 388 nm, near the UV region
[9, 28]. Recently, some researchers have modified TiO2 to enhance its photoactivity under visible
light irradiation [39, 40]. Several studies reported that TiO2 crystalline form affects its
photocatalytic activity [41-43]. TiO2 has three stable polymorphs—anatase (Eg = 3.2 eV), rutile
(Eg = 3.02 eV), and brookite (Eg = 3.14 eV) [10, 44]. For PCO, the anatase performs better than
the rutile because its conduction band location drives conjugate reactions involving electrons
more efficiently[45]. Combining the rutile and anatase phases has been recommended for
increasing TiO2 photocatalytic activity [27, 43]. Given these facts, Degussa P25 TiO2, composed
of 75% anatase and 25% rutile, is a commonly-used commercial catalyst [27].
To reduce the recombination rate, it is essential that electron acceptors and photogenerated
electrons react [46]. When appropriate surface electron acceptors or a surface defect state are
absent, and thus unavailable to trap these charge carriers, electrons and holes pair in a few
nanoseconds, reducing the efficiency of photocatalytic degradation. It is reported that the anatase
conduction band edge exceeds the rutile by 0.2 eV. This difference facilitates the electron
transfer via an electron bridge [47]. As a result, the electron based on the anatase conduction
band jumps to the less positive rutile part, thereby reducing the recombination rate of electrons
and the formation of positive holes in the anatase site [41, 48].
Using nanocatalysts helps produced electrons reach the surface and react with electron
acceptors in a shorter transfer distance. Therefore, the nanostructure recombination rate is lower
than the microstructure [46]. Different TiO2 nanostructure materials such as nanorods,
nanofibers, nanospheres, nanosheets, and nanotubes have been produced in the nanostructure,
which proves its efficiency [49]. It is proven that various parameters, such as crystallite size,
specific surface area, pore structure, pore volume, and crystalline phases, have significant effects
on photocatalytic performance [50]. The nano-sized catalyst high surface area and high surface
density improves catalyst performance and photoactivity [49, 51].
In general, several factors influence PCO efficiency, such as humidity, flow rate, the initial
concentration of contaminant, the characteristics of the photocatalyst, light source, etc. [7, 8].
The effects of above-mentioned parameters are reviewed briefly in Section 4.

6
3. Issues in VOCs photocatalytic oxidation
For key reactions involved in photocatalytic oxidation, see Table 1. Equation 1 (Photoexcitation)
explains TiO2 activation by UV light [10, 52]. The HOO• in Eq. (5) is an electron acceptor that
produces hydrogen peroxide (H2O2). This generates H2O2 as an oxidizing agent and decreases
the recombination rate of electrons and holes by capturing photo-induced electrons, thereby
enhancing PCO efficiency (Eqs. (6-7)). Reduction and oxidation reactions can both occur on the
surface of the photoexcited semiconductor. The main oxidant species for degrading VOCs are
hydroxyl radicals produced by oxidizing adsorbed water or adsorbed���. The final results of
total mineralization of hydrocarbon compounds by PCO are CO2 and H2O [10, 40].
(Table 1)
Photocatalytic oxidation of VOCs includes several processes such as the formation and
recombination of electrons and holes, the adsorption of VOCs, chemical degradation, and the
desorption of products or intermediates [20]. Moreover, photogenerated electrons and holes may
take several pathways. They may recombine on the surface or in the bulk of the semiconductor;
electron acceptors may be reduced by electrons; electron donors could be oxidized by holes.
Photogenerated electrons and holes could react with O2 and H2O to produce reactive oxygen
species (ROS) [27]. As mentioned above, most holes are then consumed by reacting directly with
adsorbed organic materials or adsorbed water molecules [50]. In some PCO reactions, partial
mineralization of parent pollutants can generate some by-products. These intermediates can
occupy the catalyst active site and decrease catalyst photoactivity [53].
4. Factors affecting PCO performance
This paper briefly reviews the effects of relative humidity, airflow rate, UV light, and the initial
contaminate concentration of VOCs photodegradation. These parameters were also reviewed by
Mamaghani [54].
4.1. Relative humidity (RH)
In PCO, the presence of water vapor can be both beneficial and detrimental. Water molecules
contribute to photocatalytic oxidation process both as competitive adsorbents and resources for

7
hydroxyl radicals. The resulting hydroxyl radicals are key players in the oxidation process (Eq.
2). In addition, water vapors can be adsorbed on TiO2 active sites. This reduces the adsorption of
VOCs compounds. Therefore, it is clear that changes in relative humidity (RH) can significantly
impact photocatalytic oxidation efficiency [10, 52, 55-59]. Water makes photocatalytic
degradation more efficient for some contaminants, like benzene and toluene [56]. In other words,
complete mineralization of some pollutants to CO2 is impossible without water vapor. However,
excessive water concentration causes the adsorption of water molecules on the active sites of the
catalyst surface and decreases the reaction rate [7, 53, 60, 61]. There are few studies on the effect
of relative humidity on doped TiO2 for gas phase pollutants [39, 62-65]. Earlier studies focused
only on the effect of relative humidity on the reaction mechanism of different pollutants. Doped
TiO2 performance with different amounts of dopants in humid conditions has not been
thoroughly investigated. Doped TiO2 could improve photocatalytic efficiency more than
undoped TiO2 in the same humidity. Additionally, the doped TiO2 catalyst could reduce
competition between target compound and water adsorption since the increased separation of
electrons and holes produces more oxidizing agents.
4.2. Airflow rate
The airflow rate is a key factor for the photocatalytic oxidation of VOCs. Generally, increasing
the airflow rate has two adversary effects. First, reducing residence time during PCO decreases
pollutants photodegradation efficiency. Second, increasing the mass transfer rate between the
contaminants and catalyst improves the conversion rate [41, 66-68]. Therefore, decreasing the
airflow rate increases residence time and gives more VOCs contaminants the chance of being
adsorbed on the surface of the catalyst. More adsorbed molecules react with hydroxyl radicals or
photo-induced holes and then degrade [7]. According to Han et al. [66] and Yang et al. [67], an
increase in flow rate causes a higher mass transfer and a smaller concentration gradient between
the bulk and the catalyst surface in laminar regimes. In transitional conditions, the oxidation rate
depends on both gas-phase mass transfer rates and surface reactions. It has been reported that the
effect of airflow rate on VOCs removal falls under three distinct regimes. [56]. In low airflow
rates, increasing the airflow rate enhances VOCs removal. This demonstrates that mass transfer
to the catalyst surface limits VOCs elimination. In intermediate airflow rates, flow rate variation
has no considerable effect on VOCs removal. This means that surface reaction kinetics is the
controlling stage. Finally, in high airflow rates, an increased airflow rate decreases the residence

8
time for transferring VOCs contaminants from the gas phase to the catalyst surface, thereby
decreasing the VOCs removal rate.
4.3. UV light intensity and type
It is worth noting that light intensity is one crucial factor for influencing VOCs reaction rate.
Generally, photocatalytic oxidation performance enhances when light intensity increases [10,
69]. Augmenting UV light intensity creates more photons, which provide degradation energy [7].
In general, increasing light intensity augments the production of oxidant species. Moreover,
increasing the UV-irradiation intensity heightens photoactivity and consequently enhances the
photocatalytic degradation of VOCs pollutants [7, 9, 10, 70]. However, energy loss resulting
from light reflection, light transmission, or heat is inevitable in PCO. Attempts have been made
to use more energy through different methods such as metal and non-metal ion doping, [9, 71-
73], coupling with other semiconductors [60, 74], and surface modification [73]. The
recombination of charge carriers, and low interfacial charge transfer rates, are responsible for
low quantum yields [29, 75]. The overall quantum yield of light absorbed by photocatalysts or
reactants can be estimated using the following equation:
����� = ����� �������
��������� ������� �������� (9)
where Фoverall is the quantum yield.
Since semiconductors in the heterogeneous medium cannot absorb all refracted irradiation, it is
difficult to determine quantum efficiency [9]. Without charge carrier recombination, quantum
yield could approach the ideal value of one (1) for UV light with a wavelength small enough to
activate the catalyst [76]. VOCs contaminant in the presence of vacuum UV (VUV) lamps can be
degraded by photolysis, radical oxidation, and ozonation [77, 78]. Compared with conventional
PCO under UV light (254 or 365 nm), VUV light can significantly enhance photocatalytic
degradation efficiency. Moreover, by providing a strong oxidation environment and preventing
the generation and accumulation of intermediates, VUV light reduces catalyst deactivation [77,
79, 80]. Despite these benefits, performing PCO with VUV lamps produces ozone (O3)
molecules as a by-product. Ozone is a powerful oxidizing species that can react with VOCs
pollutants and promote photocatalytic efficiency. However, residual ozone can damage the
environment and human health [7, 8, 67, 77, 81].

9
4.4. Inlet contaminant concentration
The lower initial concentration of contaminants increases removal efficiency in all VOCs. This
occurs because the catalyst constant number of active sites has limited adsorption capacity.
Furthermore, by-product formation inhibits VOCs adsorption, especially when initial
contaminant concentration is high. PCO is therefore more appropriate for photodegrading
contaminants in low concentration [7, 82]. The latter can also affect the photocatalyst quantum
yield. In fact, when the contaminant is highly concentrated, TiO2 surface becomes saturated and
quantum yield diminishes due to the shielding effect of the contaminant on the catalyst surface
[9]. A high concentration of contaminants can also reduce quantum yield by absorbing or
scattering light and thus prevent light absorption by the catalyst. Catalyst saturation and
competition between adsorbed compounds are higher when inlet contaminants concentration
increases [41].
Table 2 provides an overview of TiO2-based photocatalytic oxidation of various VOCs
contaminants and summarizes key operating parameters (e.g. temperature, RH, flow rate, lamp
type, and light intensity), maximum conversion, and the main remarks of various studies on
VOCs photocatalytic degradation. Accordingly, different types of VOCs, such as alkane, alkene,
alcohol, aromatics, ketone, and aldehyde are considered. As Table 2 shows, most studies used
UV lamps for all experiments and initial contaminant concentrations were in the range of ppm.
One important concern regarding VOCs removal by PCO is the formation of hazardous by-
products. Consequently, it is important to modify TiO2 for VOCs elimination efficiency. Its
modification lessens by-product formation, permits the use of TiO2 under visible light irradiation
and allows the removal of indoors contaminants within the range of ppb.
(Table 2)
4.5. Effect of doping
As stated before, TiO2 photocatalytic efficiency for environmental applications is limited
because of charge carriers high recombination rate. TiO2 photocatalytic activation is also limited
under visible light given its wide band gap [86].

10
Some promising technologies for modifying TiO2 that can improve environmental pollutants
degradation have been proposed. Techniques include doping TiO2 with metal or non-metal
dopants, co-doping TiO2 with different elements, and coupling TiO2 with semiconductors with
lower band gap energy. These modifications increase charge separation and shift the light
absorption range towards visible light [22]. Generally, an appropriate amount of dopants reduces
the band gap and consequently allows light absorption at a higher wavelength [48, 71].
Both metal and non-metal doping methods change TiO2 electronic structure by inducing new
doping levels inside its band gap. The doping levels inside TiO2 band gap can absorb photons in
the visible range, expanding the light absorption range by accepting photogenerated electrons
from TiO2 valence band. This reduces charge carriers recombination rate [23, 87].
See Table 3 for a summary of some preparation methods and a characterization analysis of
modified catalysts available in the literature. Among preparation methods reported, the sol-gel
technique is the most widely used for its ability to synthesize at ambient temperature and
pressure. It also provides good adherence to different substrate shapes [59]. In addition, this
process is simple and can control the particle size, shape, properties and product chemical
composition [10, 88, 89]. Moreover, it can provide TiO2 appropriate textural properties,
including a highly specific surface area and a porous structure—characteristics that enhance
photocatalytic efficiency [88].
(Table 3)
5. Different types of TiO2 doping
5.1. Metal doping TiO2
Metal doping is used for introducing additional states in the TiO2 band gap [92]. With less
energy transitions required, these impurity levels cause visible light absorption [107]. TiO2 band
gap impurity levels are induced by substituting metal ions for Ti4+, closest to the conduction
band. As Fig. 1 shows, electrons can be transferred from the TiO2 conduction band to doping
states, or can be excited from TiO2 valence band to doping states by photons with energy less
than 3.2 eV. In addition, metal doping could improve electron trapping by reducing the electron
and hole recombination rate [108-110]. The resulting photocatalytic activity and dopant states
energy levels strongly depend on several factors, including the dopant chemical nature, its

11
concentration, and thermal treatment during photocatalyst preparation [107]. It is evident that
each cationic dopant presents individual effects on photoactivity. Therefore, the resulting impact
may vary depending on the catalyst preparation method or reaction conditions [111]. In general,
the preparation method for doped catalysts creates different crystal properties and changes
photocatalyst morphology [93, 112]. The different kinds of metal dopants—noble metals, rare
earth metals, and transition metals—and their limitations are reviewed in the following sections.
5.1.1. Noble metal and rare earth metal
Noble metals, such as palladium (Pd) [113], platinum (Pt) [91, 94], silver (Ag) [114],
ruthenium (Ru) [95], and iridium (Ir) [96], expand TiO2 light absorption range to visible light.
Unlike most base metals, noble metals are highly resistant to oxidation and corrosion in humid
air. In the presence of noble metals, charge carriers recombination decreases, which causes
photoactivity on the surface of catalyst to increase [91]. Doping noble metal nanoparticles into
TiO2 lattice effectively retards charge carriers recombination as a result of the Schottky barrier
formed at the interface of metal-semiconductor (TiO2) junction. Reducing the electron and hole
recombination rate enhances catalysts photoactivity [91, 115]. In fact, the metal nanoparticles
form an intermediary for trapping and transferring photogenerated electrons from the TiO2
surface to electron acceptors [115].
Rare earth metals are a group of 17 chemical elements, including scandium (Sc), yttrium (Y),
and 15 lanthanides, in the periodic table. These metals, having incomplete 4f and empty 5d
orbitals, could promote catalysis. It has been reported that incorporating rare earth metal ions
into TiO2 lattice could enhance the adsorption of organic pollutants on the catalyst surface, and
thus improve TiO2 photoactivity [116].
Doped TiO2 photocatalysts with rare earth cations can enhance photocatalysis by increasing
light absorption along with modifications of the phase structure, surface area, and surface
morphology. Additionally, during the synthesizing process, doping with rare earth ions inhibits
the transition from the anatase phase to the rutile phase [117]. Burns et al [26] described that
substitutional incorporation of neodymium ion dopants distorts the TiO2 lattice because Nd3+
ionic radius (0.983 Å) is significantly larger than Ti4+ ion (0.605 Å). Li et al. [118] argued that
Nd3+ ions could not enter in the TiO2 lattice and replace Ti4+ ions; by contrast, Ti4+ ions replace
lanthanide ions in the lanthanide oxides lattice on the Ln3+-TiO2 interface, producing a Ti-O-Ln

12
bond. Consequently, TiO2 lattice crystallite size decreases, causing some defects in TiO2. As a
result, finding an optimum amount of dopants is critical for obtaining an appropriate number of
defects level.
Recently, doping with metals from the lanthanide group (especially Ce-doped TiO2) has
become an attractive approach. According to Xiao et al. [119], mesoporous Ce-doped TiO2 has a
high surface area, high thermal stability in the anatase phase, and better adsorption capacity for
VOCs, which could improve contaminants adsorption on the photocatalyst surface. Korologos et
al. [113] studied benzene, toluene, ethylbenzene, and xylene (BTEX) PCO in the gas phase using
TiO2-based photocatalysts. They investigated the effects of different dopants (0.25% (w/w) Pt,
Fe, and Ce) on photocatalytic performance. The results illustrated that P25/Ce photocatalyst was
the most effective catalyst for benzene and ethylbenzene degradation, and showed comparable
performance to the P25 for toluene and m-xylene photocatalytic oxidation.
5.1.2. Transition metal
Researchers have investigated the effects of transition metals such as manganese (Mn) [62],
iron (Fe) [73, 86, 90], copper (Cu) [63, 110], vanadium (V) [109], and nickel (Ni) [21] on
reducing band gap, decreasing electron and hole recombination rate, and using visible light [10,
90]. The type and amount of transition metals are two decisive parameters for PCO. If the
amount of metal dopants remains at an optimum level, dopants can increase the separation of
electrons and holes by acting as a charge carrier bridge. However, beyond their optimum value,
dopants may distort the catalyst crystallinity and act as a recombination center, reducing PCO
efficiency [10, 90]. Therefore, further research is needed to determine the optimal type and
concentration of dopant. Fig. 2 compares the influence of different amounts of several metal ions
on VOCs conversion, and shows that an optimum concentration of dopants enhances pollutants
conversion.
(Figure 2)
Moreover, the photocatalyst surface sites can also be occupied by metal ion dopants, which
alter the TiO2 surface properties depending on dopant type and concentration [63, 109].
Iron. Iron (Fe)-doped TiO2 is the most popular transition metal-functionalized photocatalyst.
Doping Fe into TiO2 structure decreases electron and hole recombination and reduces band gaps

13
(Fig. 3). Figure 3 demonstrates that Fe doping narrows the band gap and expands light
absorption into the visible range [90]. In addition, iron is much cheaper than noble metals such as
Pd, Pt, Ag, Au, and Rh, which explains its widespread use [86]. The main reason for promoting
Fe-doped TiO2 as a catalyst is that the Fe3+/Fe2+ reduction process enhances charge carrier
separation [120]. Fe3+ accepts the photoexcited electron, transfers it to the oxygen molecule, and
thus produces superoxide [120]. In addition, the radius of Fe3+ (0.64 Å) and Ti4+ (0.68 Å) is
similar, which eases Fe3+ ion incorporation into TiO2 crystal lattice [87, 121]. As a result, Fe ions
are distributed uniformly in TiO2 lattice interstices, which creates defects in TiO2 structure [121].
The following reactions demonstrated that Fe3+ would operate as an electron and hole trap [86,
120]:
���� + �� → �� � (10)
�� � + � →���� + � � (11)
���� + ℎ� → ��"� (12)
Therefore, the charge carriers recombination decreases and TiO2 photoactivity enhances.
(Figure 3)
Yang et al. [86] studied iron-doped TiO2 for BTEX photodegradation on glass fiber (GF). GF-
Fe-TiO2 composites (at different Fe-to-Ti ratios) showed higher photocatalytic activity for BTEX
compared to GF-TiO2 (as a reference) under visible light irradiation [86]. Tieng et al. [90]
reported that Fe3+ ions could be trapping sites for both photogenerated conduction band electrons
and valence band holes. Consequently, the photogenerated charge carriers could be separated
more easily and protected for a longer time. As a result, adsorbed species redox reaction occurs
more efficiently.
Fig. 2 shows the effect of different amounts of Fe ions in toluene photodegradation [86, 120,
122]. As this figure demonstrates, the optimal amount of Fe ion is around 0.01 wt.%. Increasing
the amount of Fe dopant facilitates the transformation of anatase into rutile and increases the
rutile phase [121].
Nickel. When Ni is added to the TiO2 structure, it traps photogenerated electrons and separates
charge carriers, like an electron acceptor. As a result, Ni2+ ions could improve TiO2 photoactivity
[123]. Tseng et al. [64] pointed out that the efficient separation of photogenerated electron and
hole pairs depends on the concentration of dopant. In contrast, the dopant may become the

14
recombination center for photogenerated electrons and holes. In low dopant concentration,
doped-Ni2+ separates charge carriers by trapping electrons. This increases the likelihood of a hole
and VOCs reaction. However, in high dopant concentration, doped-Ni2+ acts as recombination
center preventing hole formation [64]. According to the following equation, Ni+ could transfer
electrons to the adsorbed O2 on the surface of TiO2 (Eq. 15) and react with Ti4+ (Eq. 16) to create
an interfacial electron transfer [64].
#$� + ℎ% → ���� + ℎ&�
� (13)
'$ � + ���� → '$� (14)
'$� +� (���) → '$ � + � � (15)
'$� + #$"� → '$ � + #$�� (16)
#$�� + � (���) → #$"� + � � (17)
Other transition metals. Huang et al. [79] reported benzene degradation on TiO2 catalysts with
different metal dopants. According to their results, the BET surface area decreased as transition
metals (Mn, Co, Cu, Ni, and Fe) were doped in TiO2 lattice. Transition metals might block TiO2
pores or cause the particle size to grow, and thus eventually decrease the surface area.
Pham et al. [63] studied benzene photodegradation under visible light on Cu-doped TiO2, which
was supported on porous polyurethane (PU). According to their XPS results, Cu dopants could
be substituted by Ti4+ ions and generate some defect levels on the TiO2 lattice by forming Cu-O-
Ti bonds. Cu-doping TiO2 improved charge carriers generation. This was possible due to the
production of copper oxides (Cu2O and CuO), which blend with TiO2 on the photocatalyst
surface. Because these copper oxides possess semiconductor properties, they could generate a
number of electron and hole pairs under visible light and enhance the photocatalytic degradation
of benzene.
Pham et al. [109] investigated toluene degradation on the surface of V-doped TiO2/PU
photocatalysts. The photocatalyst surface in the presence of water vapor could be hydroxylated
and form Ti-OH or V-OH bonds. This can happen through the reaction between water and some
cations on a photocatalyst surface, including Ti3+, Ti4+, V4+, and V5+ ions.
As presented in Table 4, a cation-doped TiO2 photocatalyst exhibits enhanced photocatalytic
degradation performance compared to that of pure TiO2 or commercial P25 under both UV and
visible light. Accordingly, P25 and undoped TiO2 have no photoactivity under visible light. In

15
addition, it is obvious that by increasing the small amount of cation dopants, light absorption in
the visible range enhances. Furthermore, all cation-doped catalysts exhibited higher
photocatalytic efficiency under UV light than under visible light.
(Table 4)
5.2. Non-metal doping TiO2
Some other researchers have shown that TiO2 band gap narrowing can be improved by using
non-metal (anion) dopants rather than cations [39, 101]. Various studies show that doping TiO2
with anionic non-metals—nitrogen (N) [19, 24, 39, 71, 106, 120], carbon (C) [38, 97-99], sulfur
(S) [65, 101], boron (B) [23], and fluorine (F) [100]—gives promising results. In non-metal
doping, dopant states are near the valence band edge and do not act as charge carriers. Therefore,
their role as recombination centers might be minimized [126]. Consequently, anion dopants
might be more appropriate than cation dopants for expanding TiO2 light absorption range into the
visible region. As Fig. 1 illustrates, impurity levels caused by doping non-metal dopants into
TiO2 lattice are close to the valence band. For an anion-doped TiO2, the dopants substitute for
oxygen (O2) in the TiO2 lattice. This expands its light absorption range and narrows the band gap
with non-metal dopants p-orbitals (Fig. 1) [10].
Table 5 summarizes a number of anion-doped TiO2 photocatalysts synthesized to enhance TiO2
photocatalytic degradation performance. Accordingly, different non-metal elements were
considered. Improvements in photocatalytic degradation were observed after adding a small
amount of anion dopants. As Table 5 shows, neither undoped TiO2 or P25 excite under visible
light, like in the cation-doping method. Non-metal dopants could change TiO2 morphology, and
increase its photoactivity performance in PCO [71, 72]. In addition, doping with non-metal
anions affects the semiconductor electronic structure [25].
Some researchers have reported that thermal treatment during catalyst synthesis caused changes
in the catalyst specific surface area and pore volume, which decreased as temperature rose [72,
98]. A number of studies considered the preparation of non-metal-doping TiO2 by physical or
chemical methods, including sol-gel, hydrothermal, hydrolysis, and microemulsion. Table 3

16
summarizes some of these methods. As this table illustrates, non-metal doped TiO2 powders are
synthesized by applying different preparation methods and precursors.
C- and N-doped TiO2 nanomaterials have been demonstrated to have superior photocatalytic
activity under visible light irradiation compared to other anion dopants [126]. In the following
sections C-, N-, and S- doped TiO2 along with non-metal doping drawbacks are reviewed.
5.2.1. N-doped
The N-doped TiO2 has received significant attention because it can narrow the TiO2 band gap
and accelerate the charge carrier transfer process [127]. Furthermore, N-doped TiO2 changes the
hardness, refraction index, electrical conductivity, elastic modulus, and photocatalytic activity in
the visible light region [10, 71, 106]. Nitrogen has a low ionization potential and an atomic
radius comparable to oxygen, meaning N can easily enter the TiO2 lattice [128]. According to the
literature, a general theory suggests that incorporating non-metal dopants with lower
electronegativity than oxygen in the TiO2 lattice shifts 2p-orbital levels of the valence band
upward and results in narrower band gap. However, metal doping leads to additional energy
states inside the band gap itself (Fig. 4a) [127, 128].
According to Pandian et al. research [128] on electronic band structures for N-doped TiO2, the
highest localized state (acceptor levels) with substitutional nitrogen is 0.14 eV (above the
valence band) and 0.73 eV for interstitial nitrogen (Fig. 4a). The substitutional nitrogen is
created by mixing N2p orbitals with TiO2 O2p orbitals. If the latter produces states above the
valence band and narrows the band gap, the former correlated interaction between N2p and Ti3d
orbitals forms the mid-gap level of N–O states [88, 128]. One problem of N-doping is the
significant energy shift in the valence band gap edge occurring in low concentrations of nitrogen.
This indicates that, to extend light absorption and improve photocatalytic activity, it is essential
to choose the appropriate preparation techniques for N-doped TiO2 [71]. Albrbar et al. [88]
reported that nitrogen can be incorporated in the TiO2 lattice structure as a N3- anion
interstitially, or by substituting O2- anions [88]. According to Zeng et al. [19] XPS results for N-
TiO2, three peaks are identified for N1s: 396.1 eV, 400 eV, and 403.6 eV. The first N1s peak
(396.1 eV) is attributed to the substitutional nitrogen dopant since the 395.6 eV is characteristic
of N3− corresponding to the Ti-N bond. The second peak (400 eV) at high binding energies is

17
attributed to interstitial nitrogen dopants, and the third one (403.6 eV) is usually defined as NOx
species. This indicates the successful incorporation of nitrogen into the TiO2 lattice [19].
5.2.2. C-doped
C-doped TiO2 can significantly stabilize anatase TiO2 and enhance the adsorption of organic
contaminants on the catalyst surface. It also increases TiO2 conductivity, which accelerates the
charge transfer from inside TiO2 structure to the surface to participate in oxidation reactions [98,
99]. Di Valentin et al. [129] studied how replacing oxygen sites with carbon, or putting carbon
into the interstitial sites of TiO2 lattice, enhances visible light absorption. There is a debate
around carbon-doped TiO2 similar to that around nitrogen doping on whether the doped type of
carbon is substitutional or interstitial. Furthermore, the band gap can also be narrowed with
residual carbon-containing species. These have a complex composition given the partial removal
of organic compounds in the calcination procedure [126].
As Fig. 4b demonstrates and according to Khalilzade et al. [130], C-doped TiO2 mid-gap band
position shifts upward when carbon concentration increases, which shows a high oxidative
potential for photogenerated holes. The new electronic level above TiO2 valence band was
responsible for narrowing C-doped TiO2 band gap and visible light photoactivity. Wang et al.
[99] studied C-doped TiO2 at different calcination temperatures. They pointed out that C-doping
added the deepest states to the band gap compared with N and S-doping (Fig. 4).
Choosing an appropriate method for catalyst preparation is critical for reducing the number of
TiO2 lattice defects. The latter act as great recombination centers for charge carriers and limit the
visible light photocatalytic efficiency [98]. Different C-doped TiO2 preparation methods can be
seen in Table 3.
5.2.3. S-doped
S-doped TiO2 has been investigated extensively in environmental (air and water pollution) uses
[101, 131]. Introducing S into the TiO2 lattice narrows the band gap. Mixing S3p states with O2p
of TiO2 valence band was demonstrated to help increase the valence band width, and narrow the
band gap too (Fig. 4c) [131]. S dopant ions can be incorporated into the TiO2 lattice either as a
S2- anion. In S-doping, S2- is replaced with lattice oxygen (O2), or as a cation, where S4+/S6+
substitutes Ti4+. [88, 132]. Ma et al. [131] reported that Ti4+ ion atomic radius (0.64 Å) is
relatively greater than S6+ ion (0.29 Å). Therefore, in S-doped TiO2 catalyst when S6+ substitutes

18
Ti4+ might decrease the catalyst crystal size. Jo et al. [65] reported that TEM images for S-doped
TiO2 show less agglomeration than those of TiO2 Degussa (un-doped). Furthermore, SEM
images of both catalysts illustrate that S-doped TiO2 crystalline particle was smaller than
undoped TiO2 or Degussa P25 [65]. According to Yu et al. [133], doping TiO2 with anionic S
could be more difficult than with cationic ones given the different ionic radius of S2- (1.7 Å),
which is significantly larger than that of O2- (1.22 Å). Consequently, Ti-S bonding requires
larger formation energy than Ti-O bonding. Ti4+ is therefore replaced with S6+ as this union has
chemical advantages over O2- substitution by S2-. As Fig. 4c explains, by substituting Ti4+ with
S6+, S3s orbitals create states above the O2p orbitals of TiO2 valence band, and S3p orbitals
contribute to lowering TiO2 conduction [131]. The ionic form of sulfur dopant depends on the
preparation routes and sulfur source. For instance, the anionic form of S dopant was produced
when TiS2 was used as the source. In that case, S in TiS2 was oxidized and the residual sulfur
remains as S2- [133].
(Figure 4)
(Table 5)
5.3. Co-doping TiO2
Some researchers have focused on co-doping as one way to compensate for the drawbacks of
single-doped TiO2. This approach is explained in detail in the following sections. Various studies
have performed TiO2 co-doping by combining metal/non-metal and non-metal/non-metal dopants
discussed below. However, few studies have considered metal/metal TiO2 co-doping [108].
5.3.1. Metals co-doped
The physiochemical properties and doping mechanism of combining two different metals to co-
dope TiO2 have not been thoroughly investigated. Pham et al. [108] studied hexane and butyl
acetate photodegradation on Ag/V co-doped TiO2 deposited on polyurethane. According to their
report, Ag+ ions radius (1.26 Å) is much bigger than Ti4+ ions. In the case of V-doped TiO2, due
to the similar radii of V4+ (0.72 Å) and Ti4+ (0.74 Å) ions, vanadium was incorporated more
easily into the TiO2 lattice. V4+ ions could therefore substitute Ti4+ ions to form Ti-O-V bonds in

19
the TiO2 lattice. Ag and V were incorporated into the co-doped TiO2, which formed Ti3+.
Consequently, the Ti3+/Ti4+ ratio of the Ag-V co-doped TiO2 was higher than that of a single V
or Ag-doped photocatalyst. This indicates that compared to single doping, Ag-V co-doped TiO2
enhanced dopants incorporation, therefore increasing oxygen vacancies (or Ti3+ formation).
In other words, incorporating metal dopants produced oxygen vacancies in the TiO2 lattice,
reducing Ti4+ into Ti3+. Moreover, the Ag and V co-doping TiO2 could prevent the aggregation
of Ag, Ag2O, and V2O5, creating uniformly distributed particles on the surface of TiO2 in the Ag-
V co-doped TiO2/PU photocatalysts. Additionally, in Ag and V co-doping TiO2, vanadium
increased the internal electron transfer in the TiO2 lattice and silver enhanced internal electron
transfer in the Ag2O. Vanadium also improved exterior electron transfer between Ag2O and TiO2
[108]. Zhang et al. [134] reported that adding alkali metals ions (Li+, Na+, and K+) to Pt/TiO2
catalysts caused more atomically dispersed Pt species; improved the H2O and O2 activation
efficiently; and promoted catalysts performance in HCHO oxidation. In another study on HCHO
oxidation, Zhang et al. [135] found that Na addition also had a visible promoting effect on
Pd/TiO2 catalysts due to the good dispersion of Pd species.
5.3.2. Non-metals co-doped
Non-metals co-doped TiO2 has been studied extensively [72, 120, 136]. The S-N co-doped
TiO2 exhibited strong absorption ability in both UV and visible light regions [10]. According to
the XPS spectra of N, S and C tri-doped TiO2 (NSC-TiO2) in Lei et al. [136] research, N was
assigned to the Ti-O-N and Ti-N bonds; S was mostly attributed to the Ti-O-S bond; and C was
ascribed to the Ti-O-C bonds in the NSC-TiO2 catalyst. In addition, results showed that co-
doping and calcination temperature affects the catalyst microstructure and crystallite size. Li et
al. [137] studied the degradation of gaseous acetaldehyde, toluene, and trichloroethylene in N
and F-co-doped TiO2 photocatalytic process. They found that co-doping nitrogen and fluorine
has a synergetic effect. N doping enhanced visible light absorption, photocatalytic activity, and
the formation of superoxide (O2• ˗) radicals through the oxygen vacancies sites. F-doping formed
new active sites and hydroxyl radicals (OH•).
Non-metals can be introduced into the TiO2 lattice by applying various precursors and
preparation methods (Table 3). In C and S co-doped or S-doped TiO2, thiourea is generally used

20
as a non-metal doping source [72]. In the initial thermal treatment of catalyst preparation,
thiourea was first decomposed by increasing the temperature. This temperature increase released
N-containing gas, which can interact with Ti and O atoms to produce N dopants into the TiO2
lattice. During the thermal treatment, many oxygen vacancies are produced and N-containing gas
can easily enter the vacancies [72]. The formation of oxygen vacancies in N-doping TiO2
happens because two nitrogen atoms should replace with three oxygen atoms to maintain electro
neutrality, and so produce an oxygen vacancy in the TiO2 crystal lattice. Furthermore, superoxide
radicals (O2• ˗ ) that require oxygen vacancy sites form [137].
5.3.3. Metal and non-metal co-doped
Dopant components in the TiO2 lattice, including metal and non-metal, produce doping energy
levels in the TiO2 band gap that improve visible light absorption and result in higher
photocatalytic performance (Fig. 5). Furthermore, metal components prefer to substitute for the
Ti site in the TiO2 lattice to create the dopant level near the conduction band. Non-metal
components can potentially form new levels closest to the valence band that reduce the band gap
and cause visible light absorption. Therefore, both metal and non-metal ion co-doping enhance
photocatalytic activity [120, 138]. The synergistic effects between metal and non-metal dopants
improve electron and hole separation, enhancing TiO2 photocatalytic activity under visible light
[120, 138].
(Figure 5)
It has also been reported that TiO2 photoactivity when doped with nitrogen or sulfur can be
improved by adding Fe(III) as a co-dopant [23]. N-Fe co-doped TiO2 was studied by Dong et al.
[120] in order to modify N-TiO2 surface by Fe-ions. The results illustrated that a small amount of
Fe-ions (0.02 wt.%) added to N-TiO2 nanocrystal improved the catalyst photoactivity under
visible and UV irradiation. It also improved augmented photodegradation efficiency to 97%. In
addition, Fe-ions modification can also improve N-doped TiO2 stability. In other words, N-doped
photocatalyst instability by nitrogen loss happens when the photogenerated hole oxidizes the
catalyst lattice nitrogen and gradually leads to deactivation. However, the lattice nitrogen was
relatively stable due to Fe-ions surface modification in Fe/N-doped TiO2 [120]. Li et al. [138]
studied the C, Mo co-doped TiO2 and reported that after Mo-doping TiO2, the doping energy
level was 0.4 eV. This level was extremely positive compared to the TiO2 conduction band.

21
Consequently, the valence band electrons could be excited to the Mo6+/Mo5+ doping energy level
under visible irradiation. Li et al. [138] also argued that the recombination rate in C, Mo co-
doped TiO2 is lower than that of Mo-doped TiO2.
Table 6 summarizes a number of co-doped TiO2 photocatalysts synthesized to improve TiO2
photocatalytic degradation performance. Different types of co-doped TiO2 catalysts, including
non-metal/non-metal, metal/metal, and metal/non-metal performance in the PCO of gas phase
pollution and their operating parameters, are reviewed in Table 6.
(Table 6)
5.4. Composite semiconductors
One effective technique for improving TiO2 photoactivity is coupling it with other
semiconductors that generally have lower band gap energy. As a result, TiO2 photoactivation
expands to the visible region. Coupling catalysts are applied to accelerate electron and hole
separation [36]. These semiconductors include WO3 [106], SiO2 [37], SnO2 [21, 22, 55], MnCO3
[139], CdS [140], Ag3VO4 [36], ZnO [141], and porous material with a large surface area (e.g.
activated carbon) [10]. As illustrated in Table 7, semiconductors coupled with TiO2 performed
an enhanced photocatalytic degradation compared pure TiO2. Different metal/non-metal doped
with semiconductor composites are considered for improving TiO2 photoactivity.
Among the different semiconductors reviewed, SnO2 is interesting for having lattice parameters
and a tetragonal structure similar to TiO2. As Fig. 6a shows [21, 22, 142], in the TiO2 and SnO2
heterojunction, TiO2 photogenerated electrons move to SnO2 conduction band while holes
transfer in the reverse direction, thereby separating charge carriers and suppressing
recombination as a result [21, 22]. Substituting Sn (SnO2) for Ti (TiO2 lattice) can only cause a
blue shift in TiO2 light absorption spectra since SnO2 band gap is larger than TiO2.
Consequently, to obtain visible light photoactivity, there should be a surface coupling between
the two semiconductors [21].
Liu et al. [140] studied the degradation of benzene on CdS-TiO2, which was supported on fiber
glass cloth. TiO2 and CdS can be excited under UV-vis irradiation to produce electron and hole
pairs (Eq. 18). According to the electronic structure of mentioned semiconductor, the TiO2

22
conduction band is more positive than that of CdS nanoparticles, which leads to the formation of
a local electric field (Fig. 6b) [140, 142]. As a result, photogenerated electrons could transfer
from CdS nanoparticles conduction band to the TiO2, while the photogenerated holes in the TiO2
semiconductors valence band accumulate in the CdS valence band to create a hole center (Eq.
19). Consequently, the recombination rate of charge carriers can be reduced effectively. For
visible light illumination, only CdS nanoparticles can be excited and photogenerated electrons
moved to the TiO2 conduction band (Eqs. 20 and 21) [140].
*+, − #$� ./�0��1�23�4555555556 *+,(�� + ℎ�) −#$� (�
� + ℎ�) (18)
*+,(�� + ℎ�) − #$� (�� + ℎ�) → *+,(ℎ�) − #$� (�
�) (19)
*+, − #$� /����1�1�23�4555555556 *+,(�� + ℎ�) −#$� (20)
*+,(�� + ℎ�) − #$� → *+,(ℎ�) − #$� (��) (21)
Some studies have also focused on TiO2/SiO2 composite [37, 143-145]. Yu et al. [143] argued
that in TiO2/SiO2 composite thin films, increasing SiO2 percentages augments the surface
hydroxyl. Consequently, the growth in surface hydroxyl content will trap more holes in the
valence band and prevent charge carriers from recombining. In addition, TiO2/SiO2 photoactivity
increased when SiO2 was less than 5 mol% and decreased when higher than 10 mol%. Zou et al.
[145] claimed that TiO2/SiO2 composite pellet shape had a higher adsorption capacity than thin
film. Consequently, they acted as both photocatalyst and adsorbent. Zhan et al. [37] reported that
in TiO2/SiO2 composites, increasing the doped silica molar ratio enhances the surface area of
composite fibers. The larger surface area increases photocatalytic degradation efficiency. By
contrast, the Ti–O–Si bond came out and resulted in lots of chemical defects on the surface of
SiO2 doped TiO2 fibers, which can also enhance the oxidation rate. However, an excessive
amount of high silica ratio recombines charge carriers and decreases the degradation rate [37].
Lee et al. [106] investigated the N-doped TiO2/WO3 composites photocatalytic degradation
efficiency. The catalyst photoactivity enhanced with an increase in WO3 loading from 0.5% to
4.0%. However, an additional increase in WO3 loading to 6.0% reduced photocatalytic
efficiency. Fig. 6c shows the electronic structure of composite WO3-TiO2, and demonstrates that
electron and hole pairs could move between these semiconductors bands [106, 142].
As seen in Fig. 6d [146] and according to Ferrari-Lima et al. [105], the heterojunction of TiO2
and ZnO semiconductors (which have similar a band gap), creates synergic effects, decreases the
recombination rate, and increases charge carriers lifetime. For TiO2-ZnO, the electron transfers

23
from ZnO conduction band to that of TiO2, and the hole transfers from TiO2 valence band to that
of ZnO. As a result, the recombination rate of electron–hole pair decreases, and the charge
carrier lifetime increases [105, 146, 147].
(Figure 6)
(Table 7)
6. Challenges
6.1. Limitation of doping
6.1.1. Limitations of metal doping
As pointed out earlier, metal doping TiO2 impacts photocatalysis performance positively.
However, earlier research has shown that doping TiO2 with metal ions may have considerable
drawbacks. Transition metals might cause partial blockage on TiO2 porous surface sites [119] or
cause the growth of particles. This would decrease the specific surface area and PCO
performance subsequently [79]. As Table 4 and Yang et al. research [86] show, BTEX
degradations on Fe-doped TiO2 decreased under UV light because of a probable blockage, and
therefore decreased in surface area. In addition, Korologos et al. [113] reported that benzene,
toluene, and m-xylene degradation was not efficient in Fe/P25 and Pt/P25 under UV light
irradiation.
Additionally, metal-doped TiO2 catalysts have shown thermal instability [127, 128] and photo-
corrosion [39]. Metal dopants may act as recombination centers, encouraging the recombination
of photogenerated charge carriers [39, 87, 127]. When metal loading concentration is beyond
optimum value, electron transfer from TiO2 to metal dopants could deform the potential field in
TiO2 particles and charge metal centers negatively. This would draw a portion of holes near the
metal—TiO2 junction (especially for highly doped catalysts), and heighten the recombination
rate. The deposited metal could also shield from photon absorption, which is detrimental to
photocatalytic activity [148]. Sun et al. [73] reported that, for Fe-doped TiO2, the separation and
transportation efficiency of charge carriers enhanced when Fe3+ doping was increased from 0.1%
to 0.7%, and significantly decreased when increased from 0.7% to 1.5%.

24
Moreover, although noble metals and rare earth metals could efficiently improve PCO, the cost-
effectiveness required for industrial uses usually leads to more economical transitions or non-
metals dopants being chosen.
6.1.2. Limitation of non-metal doping
Despite non-metal-doped TiO2 photocatalytic performance with visible light, the photocatalyst
presents some disadvantages. Doping non-metal dopants into the TiO2 lattice causes oxygen
vacancies to form in the bulk, which may become an important recombination center for charge
carries. These defects limit visible light photocatalysis efficiency significantly [98]. The catalyst
preparation method is one key parameter that should be considered for photocatalytic uses.
Additionally, the doping procedure of non-metal dopants requires thermal treatment at high
temperatures (400-850 ºC) or a long preparation time requiring high energy (see Table 3).
Moreover, using toxic, expensive, or unstable precursors and the formation of undesirable
gaseous by-products during the synthesizing process makes the preparation process costly and
hinders large-scale production [38, 98]. Furthermore, the content of non-metal dopants would
decrease during the annealing process and reduce visible-light photoactivity [149].
6.2. Stabilization by support structure
Catalyst immobilization is one key factor for heterogeneous PCO efficient removal of indoor
air pollutants. Applying an effective coating method and substrate type, two critical parameters
in catalyst immobilization, is important. Appropriate substrates should have stable physical and
chemical properties in photochemical oxidation reactions. In addition, the substrate should
provide a large surface area for the catalyst to coat on. Other essential properties of the substrate
are: sufficient adhesion of the TiO2 particles; resistance against sintering temperatures; and a
strong absorbance affinity with contaminants. Different materials, such as activated carbon fibers
[84], glass [65, 113], various polymeric materials [63, 108, 109], zeolites [150], fiberglass fiber
[61, 81], carbon cloth fiber [61, 81], stainless steel [151], carbon nanotube [152], carbonized
cotton fibers [59], and glass fibers (GFs) [86] have been used as support.
Glass and silica substrates are among the widest used materials because they are transparent.
Activated carbon has high porosity, which creates a high specific surface area and enhances
photocatalyst activity. Carbonized cotton fibers (CCFs) are an alternative support for TiO2. CCFs

25
have great corrosion and temperature resistance, high conductivity, and strength. In addition,
glass fibers (GFs) are flexible and easier to handle than other supports [59, 86].
Pham et al. [109] considered gaseous toluene degradation on V-doped TiO2. Porous
polyurethane (PU) was used as a support for immobilizing the photocatalyst and so increases its
adsorption ability to remove toluene under visible light irradiation. In another study [63], they
used PU as a substrate for Cu doped TiO2 for benzene degradation. Immobilized on a porous
support, Cu–TiO2 showed improvement in both adsorption capacity and photocatalytic oxidation
for benzene removal. Jo et al. [101] studied the aluminum sheet-based S-doped TiO2 for BTEX
photodegradation. Aluminum is considered a flexible low-cost substrate. Yang et al. [86] stated
that stabilizing the nanocatalyst on the substrate in air purification system is essential. They
considered BTEX photodegradation on Fe-doped TiO2, which supported on the glass fiber. They
examined the applicability of glass fiber supported photocatalyst for eliminating VOCs under
visible and UV light irradiation. Zhong et al. [7] studied the photocatalytic oxidation process of
TiO2 coated on fiberglass fibers (FGFs) and carbon cloth fibers (CCFs). In this study, the
photolysis effects under vacuum ultraviolet (VUV) and ultraviolet (UVC) irradiation for a
different kind of VOCs were investigated in a pilot duct system. The single-pass removal
efficiency of considered compounds showed the following sequence: TiO2/CCFs+VUV >
TiO2/FGFs+VUV > TiO2/FGFs+UVC. According to their results, coating nano-TiO2 particles on
the CCFs provided a large surface area that produced high photocatalytic activity. In a different
study, Zhong et al. [61] reported that TiO2 /FGFs catalyst possesses hydrophilic characteristics.
Because of this, the adsorption coefficient for polar VOCs was higher than that of non-polar
VOCs at the same RH level. Moreover, the BET surface area of TiO2/CCFs being higher than
that of TiO2/FGFs led to a greater adsorption capacity [61].
A desirable coating technique should have the following requirements: a) a durable and stable
coating; b) an efficient and appropriate contact between the catalyst and the contaminant; c) be
non-selective for different substrates; and d) be cost-effective and suitable for large-scale
application [153]. Generally, the dip coating and spray coating are used for immobilizing TiO2
on the catalyst support [6, 40, 154]. Dip coating forms a thin and controllable layer, while spray
coating may be used to create a thicker layer [59].

26
6.3. Application in industrial, civil and building construction
General studies considering the PCO for removal of a wide range of VOCs in the gas phase are
reviewed in this paper. However, most reported studies are based on bench-scale operating in
laboratory conditions and there are only a few papers dealing with full-scale or industrial
application of PCO technology [7, 53, 61, 155, 156]. Although, the acceptable efficiency of PCO
is proved in laboratory scales, there are some limitations during the scaling up the system which
are operating in real conditions [157]. For example, the most reported research were done for a
single compound with low airflow rate (in L/min level) and high VOCs concentration (in
hundreds ppm level), which is far from real indoor applications [158]. Consequently, results
from these research may not appropriately accurate and practical for the design of large-scale
application of PCO for removal of VOCs [158].
Despite enormous studies on UV-PCO for removal of VOCs in the laboratory, limited research
has been studied the catalyst deactivation problem, by-product production and moderate removal
efficiency [158]. By-products and intermediates production and their accumulation on the
surface of catalyst may cause the deactivation of catalyst [156, 159]. An additional concern that
restricts full-scale applications of PCO in air purification system is their moderate efficiency,
particularly when they are operating in high flow rate that is more similar to the real application
[158]. Improvement of the catalyst surface characteristics in order to reduce the catalyst
deactivation may address this limitation. The deactivation may be reduced through deferent
strategies: a) expand the light absorption edge into the visible range that more photon could be
used; b) reduce the recombination rate of charge carriers to enhance the quantum yield; c) design
the PCO reactor with the configuration that the maximum light reach to the full surface of
catalyst [158].
The large-scale applications of photocatalytic process were used for air purification and self-
cleaning purposes for the first time in Japan, in middle of the 1990s [157]. One of the most
successful self-cleaning coatings, which are used in the practical applications, is TiO2-based
photocatalytic coating. Many substrates such as window glass for building, concrete for
construction and bridges, metal for traffic infrastructure and architecture, and polymers for

27
outdoor objects have been modified with TiO2-based coating to achieve self-cleaning
performance [160].
Zhong et al. [7] studied different VOCs removal in a pilot-scale application. They considered the
operational parameters such as contaminant concentration, relative humidity, and residence time
quite similar to the real conditions. They also reported the generated by-products for each
compound. He et al. [156] studied the paint plant’s waste gas removal in a pilot-scale system
combined with PCO and biotrickling filtration (BTF). They reported that the combination of
PCO and BTF is efficient for the removal of the high concentration and multicomponent VOCs
from waste gas of paint plant.
7. Conclusion
PCO is a promising technology for air purification that can eliminate indoor air contaminants
effectively at room temperature. PCO degrades hydrocarbon contaminants to carbon dioxide and
water. However, in most cases, some hazardous by-products will inevitably form during PCO.
Various factors such as humidity, light type and intensity, photocatalyst concentration,
contaminant concentration, and flow rate can affect PCO efficiency.
TiO2, the most used semiconductor photocatalysts in PCO, requires UV light irradiation to
activate given its relatively wide band gap. As a result, visible light does not have sufficient
energy to excite the electrons from the valence band to the TiO2 conduction band. Doping TiO2
with metal, non-metal and different composite semiconductors are promising methods for
overcoming its inherent limitations and for enhancing photocatalytic activity under visible light
irradiation. In addition, the effective reduction of electron and hole recombination rate is another
result of doping.
Metal components create the dopant state near the conduction band, however, non-metal
components form the new state closest to the valence band that lower the band gap and expand
the TiO2 light absorption edge. Moreover, the synergistic effects between metal and non-metal
dopants in co-doped TiO2 improve electron and hole separation, followed by enhancing TiO2
photocatalytic activity under visible light. Coupling TiO2 with other semiconductors that
generally have lower band gap energy improves the TiO2 photoactivity, accelerate electron and
hole separation, and expands its light absorption to the visible region.

28
Furthermore, it is essential to find an optimum amount of dopant to increase the separation of
charge carriers and prevent the formation of a recombination center. Additionally, choosing an
appropriate synthesizing or coating method to improve the catalyst features should also be
considered.
References
1. Yu, B.F., et al., Review of research on air-conditioning systems and indoor air quality
control for human health. International Journal of Refrigeration, 2009. 32(1): p. 3-20. 2. Cheng, Y.-H., C.-C. Lin, and S.-C. Hsu, Comparison of conventional and green building
materials in respect of VOC emissions and ozone impact on secondary carbonyl
emissions. Building and Environment, 2015. 87: p. 274-282. 3. Guieysse, B., et al., Biological treatment of indoor air for VOC removal: Potential and
challenges. Biotechnology Advances, 2008. 26(5): p. 398-410. 4. Bahri, M. and F. Haghighat, Plasma-Based Indoor Air Cleaning Technologies: The State
of the Art-Review. CLEAN – Soil, Air, Water, 2014. 42(12): p. 1667-1680. 5. Zhang, G., et al., Synthesis of bicrystalline TiO2 supported sepiolite fibers and their
photocatalytic activity for degradation of gaseous formaldehyde. Applied Clay Science, 2014. 102: p. 231-237.
6. Yang, L., et al., Design consideration of photocatalytic oxidation reactors using TiO2-
coated foam nickels for degrading indoor gaseous formaldehyde. Catalysis Today, 2007. 126(3–4): p. 359-368.
7. Zhong, L., et al., Performance of ultraviolet photocatalytic oxidation for indoor air
applications: Systematic experimental evaluation. Journal of Hazardous Materials, 2013. 261: p. 130-138.
8. Farhanian, D. and F. Haghighat, Photocatalytic oxidation air cleaner: Identification and
quantification of by-products. Building and Environment, 2014. 72: p. 34-43. 9. Gaya, U.I. and A.H. Abdullah, Heterogeneous photocatalytic degradation of organic
contaminants over titanium dioxide: A review of fundamentals, progress and problems. Journal of Photochemistry and Photobiology C: Photochemistry Reviews, 2008. 9(1): p. 1-12.
10. Tseng, T.K., et al., A Review of Photocatalysts Prepared by Sol-Gel Method for VOCs
Removal. International Journal of Molecular Sciences, 2010. 11(6): p. 2336. 11. Ji, J., et al., Mesoporous TiO2 under VUV irradiation: Enhanced photocatalytic oxidation
for VOCs degradation at room temperature. Chemical Engineering Journal, 2017. 327(Supplement C): p. 490-499.
12. Tejasvi, R., M. Sharma, and K. Upadhyay, Passive photo-catalytic destruction of air-
borne VOCs in high traffic areas using TiO2-coated flexible PVC sheet. Chemical Engineering Journal, 2015. 262(Supplement C): p. 875-881.
13. Lopes, F.V.S., et al., Insights into UV-TiO2 photocatalytic degradation of PCE for air
decontamination systems. Chemical Engineering Journal, 2012. 204(Supplement C): p. 244-257.

29
14. Galliano, S., et al., Photoanode/Electrolyte Interface Stability in Aqueous Dye-Sensitized
Solar Cells. Energy Technology, 2017. 5(2): p. 300-311. 15. Bella, F., et al., Unveiling the controversial mechanism of reversible Na storage in TiO2
nanotube arrays: Amorphous versus anatase TiO2. Nano Research, 2017. 10(8): p. 2891-2903.
16. Bella, F., et al., Paper-based quasi-solid dye-sensitized solar cells. Electrochimica Acta, 2017. 237(Supplement C): p. 87-93.
17. Hou, X., et al., Efficient quasi-mesoscopic perovskite solar cells using Li-doped
hierarchical TiO2 as scaffold of scattered distribution. Chemical Engineering Journal, 2017. 330(Supplement C): p. 947-955.
18. Yu, J., et al., Enhancement of Photocatalytic Activity of Mesporous TiO2 Powders by
Hydrothermal Surface Fluorination Treatment. The Journal of Physical Chemistry C, 2009. 113(16): p. 6743-6750.
19. Zeng, L., et al., A modular calcination method to prepare modified N-doped TiO2
nanoparticle with high photocatalytic activity. Applied Catalysis B: Environmental, 2016. 183: p. 308-316.
20. Feng, Y., et al., Improved Catalytic Capability of Mesoporous TiO2 Microspheres and
Photodecomposition of Toluene. ACS Applied Materials & Interfaces, 2010. 2(11): p. 3134-3140.
21. Khan, R. and T.-J. Kim, Preparation and application of visible-light-responsive Ni-doped
and SnO2-coupled TiO2 nanocomposite photocatalysts. Journal of Hazardous Materials, 2009. 163(2–3): p. 1179-1184.
22. Zhao, W., et al., Synthesis, Characterization, and Photocatalytic Properties of
SnO2/Rutile TiO2/Anatase TiO2 Heterojunctions Modified by Pt. The Journal of Physical Chemistry C, 2014. 118(40): p. 23117-23125.
23. Khan, R., et al., Comparative study of the photocatalytic performance of boron–iron Co-
doped and boron-doped TiO2 nanoparticles. Materials Chemistry and Physics, 2008. 112(1): p. 167-172.
24. Bianchi, C.L., et al., N-doped TiO2 from TiCl3 for photodegradation of air pollutants. Catalysis Today, 2009. 144(1–2): p. 31-36.
25. Ferrari-Lima, A.M., et al., Synthesis, characterisation and photocatalytic activity of N-
doped TiO2–Nb2O5 mixed oxides. Catalysis Today, 2015. 254: p. 119-128. 26. Burns, A., et al., Neodymium ion dopant effects on the phase transformation in sol–gel
derived titania nanostructures. Materials Science and Engineering: B, 2004. 111(2–3): p. 150-155.
27. Chen, H., C.E. Nanayakkara, and V.H. Grassian, Titanium Dioxide Photocatalysis in
Atmospheric Chemistry. Chemical Reviews, 2012. 112(11): p. 5919-5948. 28. Dhada, I., P.K. Nagar, and M. Sharma, Challenges of TiO2-Based Photooxidation of
Volatile Organic Compounds: Designing, Coating, and Regenerating Catalyst. Industrial & Engineering Chemistry Research, 2015. 54(20): p. 5381-5387.
29. Sarkar, D., et al., Three Dimensional Ag2O/TiO2 Type-II (p–n) Nanoheterojunctions for
Superior Photocatalytic Activity. ACS Applied Materials & Interfaces, 2013. 5(2): p. 331-337.
30. Vildozo, D., et al., Photocatalytic treatment of indoor air: Optimization of 2-propanol
removal using a response surface methodology (RSM). Applied Catalysis B: Environmental, 2010. 94(3–4): p. 303-310.
30
31. Guo, L., Y. Wang, and H.P. Lu, Combined Single-Molecule Photon-Stamping
Spectroscopy and Femtosecond Transient Absorption Spectroscopy Studies of Interfacial
Electron Transfer Dynamics. Journal of the American Chemical Society, 2010. 132(6): p. 1999-2004.
32. Yamada, Y. and Y. Kanemitsu, Determination of electron and hole lifetimes of rutile and
anatase TiO2 single crystals. Applied Physics Letters, 2012. 101(13): p. 133907. 33. Ozawa, K., et al., Electron–Hole Recombination Time at TiO2 Single-Crystal Surfaces:
Influence of Surface Band Bending. The Journal of Physical Chemistry Letters, 2014. 5(11): p. 1953-1957.
34. Lee, M.H., E. Geva, and B.D. Dunietz, Calculation from First-Principles of Golden Rule
Rate Constants for Photoinduced Subphthalocyanine/Fullerene Interfacial Charge
Transfer and Recombination in Organic Photovoltaic Cells. The Journal of Physical Chemistry C, 2014. 118(18): p. 9780-9789.
35. Mohtasebi, A., et al., Interfacial Charge Transfer between Phenyl-Capped Aniline
Tetramer Films and Iron Oxide Surfaces. The Journal of Physical Chemistry C, 2016. 120(51): p. 29248-29263.
36. Wang, J., et al., Highly Efficient Oxidation of Gaseous Benzene on Novel Ag3VO4/TiO2
Nanocomposite Photocatalysts under Visible and Simulated Solar Light Irradiation. The Journal of Physical Chemistry C, 2012. 116(26): p. 13935-13943.
37. Zhan, S., et al., Rapid degradation of toxic toluene using novel mesoporous SiO2 doped
TiO2 nanofibers. Catalysis Today, 2014. 225: p. 10-17. 38. Dong, F., H. Wang, and Z. Wu, One-Step “Green” Synthetic Approach for Mesoporous
C-Doped Titanium Dioxide with Efficient Visible Light Photocatalytic Activity. The Journal of Physical Chemistry C, 2009. 113(38): p. 16717-16723.
39. Jo, W.-K. and J.-T. Kim, Application of visible-light photocatalysis with nitrogen-doped
or unmodified titanium dioxide for control of indoor-level volatile organic compounds. Journal of Hazardous Materials, 2009. 164(1): p. 360-366.
40. Han, Z., et al., Experimental study on visible-light induced photocatalytic oxidation of
gaseous formaldehyde by polyester fiber supported photocatalysts. Chemical Engineering Journal, 2013. 218: p. 9-18.
41. Hussain, M., N. Russo, and G. Saracco, Photocatalytic abatement of VOCs by novel
optimized TiO2 nanoparticles. Chemical Engineering Journal, 2011. 166(1): p. 138-149. 42. Le Bechec, M., et al., Comparison of kinetics of acetone, heptane and toluene
photocatalytic mineralization over TiO2 microfibers and Quartzel® mats. Applied Catalysis B: Environmental, 2015. 179: p. 78-87.
43. Hussain, M., et al., Synthesis, characterization, and photocatalytic application of novel
TiO2 nanoparticles. Chemical Engineering Journal, 2010. 157(1): p. 45-51. 44. Agatino Di Paola , Marianna Bellardita, and a.L. Palmisano, Brookite, the Least Known
TiO2 Photocatalyst. catalysts, 2013: p. 36-73. 45. Guimaraes, R.R., A.L.A. Parussulo, and K. Araki, Impact of nanoparticles preparation
method on the synergic effect in anatase/rutile mixtures. Electrochimica Acta, 2016. 222(Supplement C): p. 1378-1386.
46. Verbruggen, S.W., TiO2 photocatalysis for the degradation of pollutants in gas phase:
From morphological design to plasmonic enhancement. Journal of Photochemistry and Photobiology C: Photochemistry Reviews, 2015. 24: p. 64-82.
47. Pfeifer, V., et al., Energy Band Alignment between Anatase and Rutile TiO2. The Journal of Physical Chemistry Letters, 2013. 4(23): p. 4182-4187.
31
48. Wang, C. and T. Wu, TiO2 nanoparticles with efficient photocatalytic activity towards
gaseous benzene degradation. Ceramics International, 2015. 41(2, Part B): p. 2836-2839. 49. Bianchi, C.L., et al., Photocatalytic degradation of acetone, acetaldehyde and toluene in
gas-phase: Comparison between nano and micro-sized TiO2. Applied Catalysis B: Environmental, 2014. 146: p. 123-130.
50. Nakata, K. and A. Fujishima, TiO2 photocatalysis: Design and applications. Journal of Photochemistry and Photobiology C: Photochemistry Reviews, 2012. 13(3): p. 169-189.
51. Sun, Q., et al., Influence of calcination temperature on the structural, adsorption and
photocatalytic properties of TiO2 nanoparticles supported on natural zeolite. Powder Technology, 2015. 274: p. 88-97.
52. Aghighi, A. and F. Haghighat, Using physical–chemical properties of reactants to
estimate the performance of photocatalytic oxidation air cleaners. Building and Environment, 2015. 85: p. 114-122.
53. Farhanian, D., et al., Impact of design parameters on the performance of ultraviolet
photocatalytic oxidation air cleaner. Building and Environment, 2013. 66(Supplement C): p. 148-157.
54. Mamaghani, A.H., F. Haghighat, and C.-S. Lee, Photocatalytic oxidation technology for
indoor environment air purification: The state-of-the-art. Applied Catalysis B: Environmental, 2017. 203: p. 247-269.
55. Fresno, F., et al., Photocatalytic degradation of toluene over doped and coupled
(Ti,M)O2 (M = Sn or Zr) nanocrystalline oxides: Influence of the heteroatom distribution
on deactivation. Applied Catalysis B: Environmental, 2008. 84(3–4): p. 598-606. 56. Korologos, C.A., C.J. Philippopoulos, and S.G. Poulopoulos, The effect of water presence
on the photocatalytic oxidation of benzene, toluene, ethylbenzene and m-xylene in the
gas-phase. Atmospheric Environment, 2011. 45(39): p. 7089-7095. 57. Sharmin, R. and M.B. Ray, Application of ultraviolet light-emitting diode photocatalysis
to remove volatile organic compounds from indoor air. Journal of the Air & Waste Management Association, 2012. 62(9): p. 1032-1039.
58. Takeuchi, M., et al., Effect of H2O vapor addition on the photocatalytic oxidation of
ethanol, acetaldehyde and acetic acid in the gas phase on TiO2 semiconductor powders. Applied Catalysis B: Environmental, 2010. 96(1–2): p. 218-223.
59. Wang, B., et al., High photocatalytic activity of immobilized TiO2 nanorods on
carbonized cotton fibers. Journal of Hazardous Materials, 2013. 263, Part 2: p. 659-669. 60. Muñoz-Batista, M.J., et al., Sunlight-driven toluene photo-elimination using CeO2-TiO2
composite systems: A kinetic study. Applied Catalysis B: Environmental, 2013. 140–141: p. 626-635.
61. Zhong, L., C.-S. Lee, and F. Haghighat, Adsorption performance of titanium dioxide
(TiO2) coated air filters for volatile organic compounds. Journal of Hazardous Materials, 2012. 243: p. 340-349.
62. Wu, Y.-T., et al., Enhanced xylene removal by photocatalytic oxidation using fiber-
illuminated honeycomb reactor at ppb level. Journal of Hazardous Materials, 2013. 262: p. 717-725.
63. Pham, T.-D., B.-K. Lee, and C.-H. Lee, The advanced removal of benzene from aerosols
by photocatalytic oxidation and adsorption of Cu–TiO2/PU under visible light
irradiation. Applied Catalysis B: Environmental, 2016. 182: p. 172-183.

32
64. Tseng, H.-H., et al., Degradation of xylene vapor over Ni-doped TiO2 photocatalysts
prepared by polyol-mediated synthesis. Chemical Engineering Journal, 2009. 150(1): p. 160-167.
65. Jo, W.-K. and J.-T. Kim, Decomposition of gas-phase aromatic hydrocarbons by
applying an annular-type reactor coated with sulfur-doped photocatalyst under visible-
light irradiation. Journal of Chemical Technology & Biotechnology, 2010. 85(4): p. 485-492.
66. Han, Z., et al., Experimental study on visible-light induced photocatalytic oxidation of
gaseous formaldehyde by polyester fiber supported photocatalysts. Chemical Engineering Journal, 2013. 218(Supplement C): p. 9-18.
67. Yang, L., et al., Degradation of indoor gaseous formaldehyde by hybrid VUV and
TiO2/UV processes. Separation and Purification Technology, 2007. 54(2): p. 204-211. 68. da Costa Filho, B.M., et al., Intensification of heterogeneous TiO2 photocatalysis using
an innovative micro-meso-structured-photoreactor for n-decane oxidation at gas phase. Chemical Engineering Journal, 2017. 310(Part 2): p. 331-341.
69. Zhu, X., et al., Inherent rate constants and humidity impact factors of anatase TiO2 film
in photocatalytic removal of formaldehyde from air. Chemical Engineering Journal, 2015. 279: p. 897-903.
70. El-Roz, M., et al., New Operando IR Technique to Study the Photocatalytic Activity and
Selectivity of TiO2 Nanotubes in Air Purification: Influence of Temperature, UV
Intensity, and VOC Concentration. The Journal of Physical Chemistry C, 2012. 116(24): p. 13252-13263.
71. Daghrir, R., P. Drogui, and D. Robert, Modified TiO2 For Environmental Photocatalytic
Applications: A Review. Industrial & Engineering Chemistry Research, 2013. 52(10): p. 3581-3599.
72. Fan, D., Z. Weirong, and W. Zhongbiao, Characterization and photocatalytic activities of
C, N and S co-doped TiO 2 with 1D nanostructure prepared by the nano-confinement
effect. Nanotechnology, 2008. 19(36): p. 365607. 73. Sun, S., et al., Photocatalytic degradation of gaseous toluene on Fe-TiO2 under visible
light irradiation: A study on the structure, activity and deactivation mechanism. Applied Surface Science, 2012. 258(12): p. 5031-5037.
74. Pinho, L., M. Rojas, and M.J. Mosquera, Ag–SiO2–TiO2 nanocomposite coatings with
enhanced photoactivity for self-cleaning application on building materials. Applied Catalysis B: Environmental, 2015. 178: p. 144-154.
75. Liu, B. and X. Zhao, A kinetic model for evaluating the dependence of the quantum yield
of nano-TiO2 based photocatalysis on light intensity, grain size, carrier lifetime, and
minority carrier diffusion coefficient: Indirect interfacial charge transfer. Electrochimica Acta, 2010. 55(12): p. 4062-4070.
76. Salvadó-Estivill, I., D.M. Hargreaves, and G. Li Puma, Evaluation of the Intrinsic
Photocatalytic Oxidation Kinetics of Indoor Air Pollutants. Environmental Science & Technology, 2007. 41(6): p. 2028-2035.
77. Huang, H., et al., Photocatalytic Oxidation of Gaseous Benzene under VUV Irradiation
over TiO2/Zeolites Catalysts. Catalysis Today, 2017. 281, Part 3: p. 649-655. 78. Huang, H., et al., Photocatalytic destruction of air pollutants with vacuum ultraviolet
(VUV) irradiation. Catalysis Today, 2011. 175(1): p. 310-315.

33
79. Huang, H., et al., Enhanced degradation of gaseous benzene under vacuum ultraviolet
(VUV) irradiation over TiO2 modified by transition metals. Chemical Engineering Journal, 2015. 259: p. 534-541.
80. Huang, H. and W. Li, Destruction of toluene by ozone-enhanced photocatalysis:
Performance and mechanism. Applied Catalysis B: Environmental, 2011. 102(3–4): p. 449-453.
81. Zhong, L., F. Haghighat, and C.-S. Lee, Ultraviolet photocatalytic oxidation for indoor
environment applications: Experimental validation of the model. Building and Environment, 2013. 62: p. 155-166.
82. Moulis, F. and J. Krýsa, Photocatalytic degradation of several VOCs (n-hexane, n-butyl
acetate and toluene) on TiO2 layer in a closed-loop reactor. Catalysis Today, 2013. 209: p. 153-158.
83. Abbas, N., et al., Studies on the activity and deactivation of novel optimized TiO2
nanoparticles for the abatement of VOCs. Chemical Engineering Journal, 2011. 175: p. 330-340.
84. Guo, T., et al., Influence of relative humidity on the photocatalytic oxidation (PCO) of
toluene by TiO2 loaded on activated carbon fibers: PCO rate and intermediates
accumulation. Applied Catalysis B: Environmental, 2008. 79(2): p. 171-178. 85. Boulamanti, A.K., C.A. Korologos, and C.J. Philippopoulos, The rate of photocatalytic
oxidation of aromatic volatile organic compounds in the gas-phase. Atmospheric Environment, 2008. 42(34): p. 7844-7850.
86. Yang, S.-B., et al., Iron-functionalized titanium dioxide on flexible glass fibers for
photocatalysis of benzene, toluene, ethylbenzene, and o-xylene (BTEX) under visible- or
ultraviolet-light irradiation. Journal of the Air & Waste Management Association, 2015. 65(3): p. 365-373.
87. Christoforidis, K.C., S.J.A. Figueroa, and M. Fernández-García, Iron–sulfur codoped
TiO2 anatase nano-materials: UV and sunlight activity for toluene degradation. Applied Catalysis B: Environmental, 2012. 117–118: p. 310-316.
88. Albrbar, A.J., et al., Visible-light active mesoporous, nanocrystalline N,S-doped and co-
doped titania photocatalysts synthesized by non-hydrolytic sol-gel route. Ceramics International, 2016. 42(15): p. 16718-16728.
89. Chu, S.-Z., et al., Fabrication and Photocatalytic Characterizations of Ordered
Nanoporous X-Doped (X = N, C, S, Ru, Te, and Si) TiO2/Al2O3 Films on ITO/Glass. Langmuir, 2005. 21(17): p. 8035-8041.
90. Tieng, S., A. Kanaev, and K. Chhor, New homogeneously doped Fe(III)–TiO2
photocatalyst for gaseous pollutant degradation. Applied Catalysis A: General, 2011. 399(1–2): p. 191-197.
91. Murcia, J.J., et al., Ethanol partial photoxidation on Pt/TiO2 catalysts as green route for
acetaldehyde synthesis. Catalysis Today, 2012. 196(1): p. 101-109. 92. Barakat, T., et al., Total oxidation of toluene over noble metal based Ce, Fe and Ni doped
titanium oxides. Applied Catalysis B: Environmental, 2014. 146: p. 138-146. 93. Huang, H. and D.Y.C. Leung, Complete elimination of indoor formaldehyde over
supported Pt catalysts with extremely low Pt content at ambient temperature. Journal of Catalysis, 2011. 280(1): p. 60-67.
94. Murcia, J.J., et al., Cyclohexane photocatalytic oxidation on Pt/TiO2 catalysts. Catalysis Today, 2013. 209: p. 164-169.

34
95. Houšková, V., et al., Efficient gas phase photodecomposition of acetone by Ru-doped
Titania. Applied Catalysis B: Environmental, 2009. 89(3–4): p. 613-619. 96. Menéndez-Flores, V.M. and T. Ohno, High visible-light active Ir-doped-TiO2 brookite
photocatalyst synthesized by hydrothermal microwave-assisted process. Catalysis Today, 2014. 230: p. 214-220.
97. Kim, M.-S., et al., Preparation of porous carbon-doped TiO2 film by sol–gel method and
its application for the removal of gaseous toluene in the optical fiber reactor. Journal of Industrial and Engineering Chemistry, 2011. 17(2): p. 223-228.
98. Dong, F., et al., Enhancement of the Visible Light Photocatalytic Activity of C-Doped
TiO2 Nanomaterials Prepared by a Green Synthetic Approach. The Journal of Physical Chemistry C, 2011. 115(27): p. 13285-13292.
99. Wang, H., Z. Wu, and Y. Liu, A Simple Two-Step Template Approach for Preparing
Carbon-Doped Mesoporous TiO2 Hollow Microspheres. The Journal of Physical Chemistry C, 2009. 113(30): p. 13317-13324.
100. Khalilzadeh, A. and S. Fatemi, Spouted bed reactor for VOC removal by modified nano-
TiO2 photocatalytic particles. Chemical Engineering Research and Design, 2016. 115,
Part A: p. 241-250. 101. Jo, W.-K. and H.-J. Kang, Aluminum sheet-based S-doped TiO2 for photocatalytic
decomposition of toxic organic vapors. Chinese Journal of Catalysis, 2014. 35(7): p. 1189-1195.
102. Nishijima, K., et al., Development of an S-doped titania nanotube (TNT) site-selectively
loaded with iron(III) oxide and its photocatalytic activities. Applied Catalysis B: Environmental, 2008. 84(3–4): p. 584-590.
103. Li, Y., C. Zhang, and H. He, Significant enhancement in activity of Pd/TiO2 catalyst for
formaldehyde oxidation by Na addition. Catalysis Today, 2017. 281, Part 3: p. 412-417. 104. Zhou, M. and J. Yu, Preparation and enhanced daylight-induced photocatalytic activity
of C,N,S-tridoped titanium dioxide powders. Journal of Hazardous Materials, 2008. 152(3): p. 1229-1236.
105. Ferrari-Lima, A.M., et al., Photodegradation of benzene, toluene and xylenes under
visible light applying N-doped mixed TiO2 and ZnO catalysts. Catalysis Today, 2015. 241, Part A: p. 40-46.
106. Lee, J.Y. and W.-K. Jo, Heterojunction-based two-dimensional N-doped TiO2/WO3
composite architectures for photocatalytic treatment of hazardous organic vapor. Journal of Hazardous Materials, 2016. 314: p. 22-31.
107. Vargas Hernández, J., et al., Effects of metal doping (Cu, Ag, Eu) on the electronic and
optical behavior of nanostructured TiO2. Journal of Alloys and Compounds, 2017. 710: p. 355-363.
108. Pham, T.-D. and B.-K. Lee, Selective removal of polar VOCs by novel photocatalytic
activity of metals co-doped TiO2/PU under visible light. Chemical Engineering Journal, 2017. 307: p. 63-73.
109. Pham, T.-D. and B.-K. Lee, Novel adsorption and photocatalytic oxidation for removal of
gaseous toluene by V-doped TiO2/PU under visible light. Journal of Hazardous Materials, 2015. 300: p. 493-503.
110. Stucchi, M., et al., Copper NPs decorated titania: A novel synthesis by high energy US
with a study of the photocatalytic activity under visible light. Ultrasonics Sonochemistry, 2016. 31: p. 295-301.

35
111. Choi, J., H. Park, and M.R. Hoffmann, Effects of Single Metal-Ion Doping on the Visible-
Light Photoreactivity of TiO2. The Journal of Physical Chemistry C, 2010. 114(2): p. 783-792.
112. Shao, G.N., et al., Investigation of the influence of vanadium, iron and nickel dopants on
the morphology, and crystal structure and photocatalytic properties of titanium dioxide
based nanopowders. Journal of Colloid and Interface Science, 2016. 474: p. 179-189. 113. Korologos, C.A., et al., Photocatalytic oxidation of benzene, toluene, ethylbenzene and
m-xylene in the gas-phase over TiO2-based catalysts. Journal of Photochemistry and Photobiology A: Chemistry, 2012. 244: p. 24-31.
114. Li, X., et al., Photocatalytic degradation of gaseous toluene over Ag-doping TiO2
nanotube powder prepared by anodization coupled with impregnation method. Chemosphere, 2011. 83(5): p. 674-679.
115. Mogal, S.I., et al., Single-Step Synthesis of Silver-Doped Titanium Dioxide: Influence of
Silver on Structural, Textural, and Photocatalytic Properties. Industrial & Engineering Chemistry Research, 2014. 53(14): p. 5749-5758.
116. Cheng, Z., et al., Synthesis, characterization, and photocatalytic activity of porous La–N–
co-doped TiO2 nanotubes for gaseous chlorobenzene oxidation. Journal of Environmental Sciences, 2016. 46(Supplement C): p. 203-213.
117. Yurtsever, H.A. and M. Çiftçioğlu, The effect of rare earth element doping on the
microstructural evolution of sol-gel titania powders. Journal of Alloys and Compounds, 2017. 695: p. 1336-1353.
118. Li, F.B., et al., Enhanced photocatalytic degradation of VOCs using Ln3+–TiO2
catalysts for indoor air purification. Chemosphere, 2005. 59(6): p. 787-800. 119. Xiao, J., et al., Preparation, phase transformation and photocatalytic activities of cerium-
doped mesoporous titania nanoparticles. Journal of Solid State Chemistry, 2006. 179(4): p. 1161-1170.
120. Dong, F., et al., Marked enhancement of photocatalytic activity and photochemical
stability of N–doped TiO2 nanocrystals by Fe3+/Fe2+ surface modification. Journal of Colloid and Interface Science, 2010. 343(1): p. 200-208.
121. Hung, W.-C., et al., Synthesis and characterization of TiO2 and Fe/TiO2 nanoparticles
and their performance for photocatalytic degradation of 1,2-dichloroethane. Applied Surface Science, 2008. 255(5, Part 1): p. 2205-2213.
122. Chun, H.-H., J.Y. Lee, and W.-K. Jo, Photocatalysis of low-concentration gaseous
organic pollutants over electrospun iron-doped titanium dioxide nanofibers. Solid State Sciences, 2013. 25: p. 103-109.
123. Yu, H., et al., Photocatalytic activity of TiO2 thin film non-uniformly doped by Ni. Materials Chemistry and Physics, 2006. 97(1): p. 59-63.
124. Tobaldi, D.M., et al., Visible light activated photocatalytic behaviour of rare earth
modified commercial TiO2. Materials Research Bulletin, 2014. 50: p. 183-190. 125. Inturi, S.N.R., et al., Visible-light-induced photodegradation of gas phase acetonitrile
using aerosol-made transition metal (V, Cr, Fe, Co, Mn, Mo, Ni, Cu, Y, Ce, and Zr)
doped TiO2. Applied Catalysis B: Environmental, 2014. 144: p. 333-342. 126. Chen, D., et al., Carbon and Nitrogen Co-doped TiO2 with Enhanced Visible-Light
Photocatalytic Activity. Industrial & Engineering Chemistry Research, 2007. 46(9): p. 2741-2746.
127. Burda, C., et al., Enhanced Nitrogen Doping in TiO2 Nanoparticles. Nano Letters, 2003. 3(8): p. 1049-1051.

36
128. Pandian, R., et al., Types of nitrogen incorporation in reactively sputtered titania thin
films: Influence on UV–visible, photocatalytic and photoconduction properties. Thin Solid Films, 2016. 616: p. 466-476.
129. Di Valentin, C., G. Pacchioni, and A. Selloni, Theory of Carbon Doping of Titanium
Dioxide. Chemistry of Materials, 2005. 17(26): p. 6656-6665. 130. Kavitha, R. and L.G. Devi, Synergistic effect between carbon dopant in titania lattice and
surface carbonaceous species for enhancing the visible light photocatalysis. Journal of Environmental Chemical Engineering, 2014. 2(2): p. 857-867.
131. Ma, D., et al., Fabrication and photocatalytic properties of cationic and anionic S-doped
TiO2 nanofibers by electrospinning. Applied Catalysis B: Environmental, 2014. 147: p. 49-57.
132. Ohno, T., et al., Preparation of S-doped TiO2 photocatalysts and their photocatalytic
activities under visible light. Applied Catalysis A: General, 2004. 265(1): p. 115-121. 133. Yu, J.C., et al., Efficient Visible-Light-Induced Photocatalytic Disinfection on Sulfur-
Doped Nanocrystalline Titania. Environmental Science & Technology, 2005. 39(4): p. 1175-1179.
134. Zhang, C., et al., Alkali-Metal-Promoted Pt/TiO2 Opens a More Efficient Pathway to
Formaldehyde Oxidation at Ambient Temperatures. Angewandte Chemie International Edition, 2012. 51(38): p. 9628-9632.
135. Zhang, C., et al., Sodium-Promoted Pd/TiO2 for Catalytic Oxidation of Formaldehyde at
Ambient Temperature. Environmental Science & Technology, 2014. 48(10): p. 5816-5822.
136. Lei, X.F., et al., Effect of calcination temperature on the structure and visible-light
photocatalytic activities of (N, S and C) co-doped TiO2 nano-materials. Applied Surface Science, 2015. 332: p. 172-180.
137. Li, D., et al., Visible-light-driven nitrogen-doped TiO2 photocatalysts: effect of nitrogen
precursors on their photocatalysis for decomposition of gas-phase organic pollutants. Materials Science and Engineering: B, 2005. 117(1): p. 67-75.
138. Li, Y.-F., et al., Mechanistic Study of Codoped Titania with Nonmetal and Metal Ions: A
Case of C + Mo Codoped TiO2. ACS Catalysis, 2012. 2(3): p. 391-398. 139. Feng, C., et al., Visible light photocatalytic behavior of manganese carbonate/titanium
dioxide nanocomposites based on photoinduced interfacial charge transfer. Materials Letters, 2015. 155: p. 23-26.
140. Liu, Z., et al., Photocatalytic degradation of gaseous benzene with CdS-sensitized TiO2
film coated on fiberglass cloth. Journal of Molecular Catalysis A: Chemical, 2012. 363–
364: p. 159-165. 141. Gholami, M., et al., Comparison of Benzene & Toluene removal from synthetic polluted
air with use of Nano photocatalyticTiO2/ ZNO process. Journal of Environmental Health Science and Engineering, 2014. 12(1): p. 45.
142. Xu, Y. and M.A.A. Schoonen, The absolute energy positions of conduction and valence
bands of selected semiconducting minerals. American Mineralogist, 2000. 85(3-4): p. 543-556.
143. Yu, J., J.C. Yu, and X. Zhao, The Effect of SiO2 Addition on the Grain Size and
Photocatalytic Activity of TiO2 Thin Films. Journal of Sol-Gel Science and Technology, 2002. 24(2): p. 95-103.
144. Guan, K., Relationship between photocatalytic activity, hydrophilicity and self-cleaning
effect of TiO2/SiO2 films. Surface and Coatings Technology, 2005. 191(2–3): p. 155-160.
37
145. Zou, L., et al., Removal of VOCs by photocatalysis process using adsorption enhanced
TiO2–SiO2 catalyst. Chemical Engineering and Processing: Process Intensification, 2006. 45(11): p. 959-964.
146. Li, X., J. Yu, and M. Jaroniec, Hierarchical photocatalysts. Chemical Society Reviews, 2016. 45(9): p. 2603-2636.
147. Liu, R., et al., Fabrication of TiO2/ZnO composite nanofibers by electrospinning and
their photocatalytic property. Materials Chemistry and Physics, 2010. 121(3): p. 432-439.
148. Gomathi Devi, L. and R. Kavitha, A review on plasmonic metalTiO2 composite for
generation, trapping, storing and dynamic vectorial transfer of photogenerated electrons
across the Schottky junction in a photocatalytic system. Applied Surface Science, 2016. 360, Part B: p. 601-622.
149. Chen, Q., et al., Visible-light-activated Ce–Si co-doped TiO2 photocatalyst. Applied Surface Science, 2009. 255(18): p. 7918-7924.
150. Yuan, J., et al., Ozone-assisted photocatalytic degradation of gaseous acetaldehyde on
TiO2/M-ZSM-5 (M = Zn, Cu, Mn). Catalysis Today, 2013. 201: p. 182-188. 151. Cao, S., et al., Highly antibacterial activity of N-doped TiO2 thin films coated on
stainless steel brackets under visible light irradiation. Applied Surface Science, 2014. 309: p. 119-127.
152. Daram, P., et al., Microstructure and photocatalytic activities of thermal sprayed titanium
dioxide/carbon nanotubes composite coatings. Surface and Coatings Technology, 2016. 306, Part A: p. 290-294.
153. Han, Z., et al., Preparation of TiO2-Coated Polyester Fiber Filter by Spray-Coating and
Its Photocatalytic Degradation of Gaseous Formaldehyde. Aerosol and Air Quality Research, 2012. 12: p. 1327–1335.
154. Aghighi, A. and F. Haghighat, Evaluation of nano-titanium dioxide (TiO2) catalysts for
ultraviolet photocatalytic oxidation air cleaning devices. Journal of Environmental Chemical Engineering, 2015. 3(3): p. 1622-1629.
155. Monteiro, R.A.R., et al., Evaluation of a solar/UV annular pilot scale reactor for 24h
continuous photocatalytic oxidation of n-decane. Chemical Engineering Journal, 2015. 280(Supplement C): p. 409-416.
156. He, Z., et al., Treatment of organic waste gas in a paint plant by combined technique of
biotrickling filtration with photocatalytic oxidation. Chemical Engineering Journal, 2012. 200(Supplement C): p. 645-653.
157. Hüsken, G., M. Hunger, and H.J.H. Brouwers, Experimental study of photocatalytic
concrete products for air purification. Building and Environment, 2009. 44(12): p. 2463-2474.
158. Zhong, L. and F. Haghighat, Photocatalytic air cleaners and materials technologies –
Abilities and limitations. Building and Environment, 2015. 91: p. 191-203. 159. Krichevskaya, M., et al., Gas-phase photocatalytic oxidation of refractory VOCs
mixtures: Through the net of process limitations. Catalysis Today, 2017. 280(Part 1): p. 93-98.
160. Xu, F., et al., Preparation of photocatalytic TiO2-based self-cleaning coatings for
painted surface without interlayer. Progress in Organic Coatings, 2017. 113(Supplement C): p. 15-24.

38

39
Highlights
• The limitations of the TiO2-based photocatalyst for photocatalytic degradation of VOCs are
reviewed.
• The approaches for modifying TiO2-based photocatalyst to improve the performance of
photodegradation of VOCs are discussed.
• Applications of TiO2 and modified-TiO2 photocatalysts for VOCs removal in the gas phase
are summarized.
• Fundamental of metal and non-metal doped TiO2, co-doped TiO2, and composite TiO2 with
other semiconductors are considered.
• The effects of key controlling parameters on PCO efficiency are reviewed.
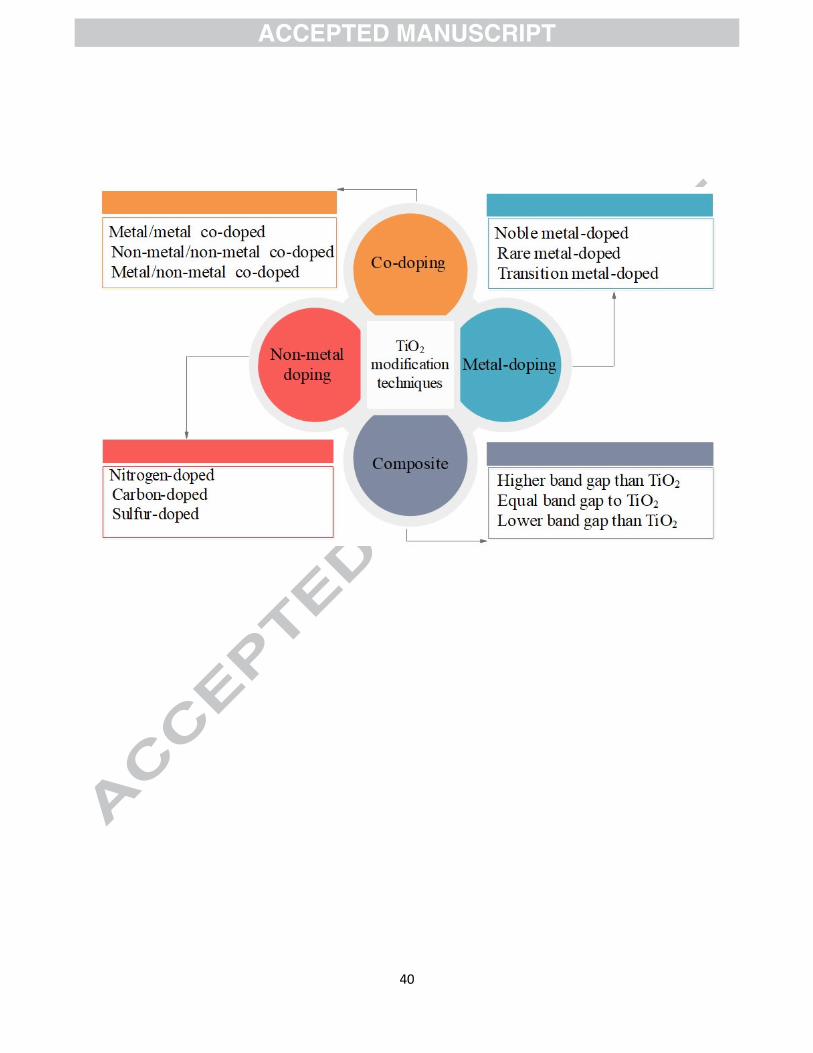
40

41
Figure 1. Basic principle of PCO for removal of VOCs.
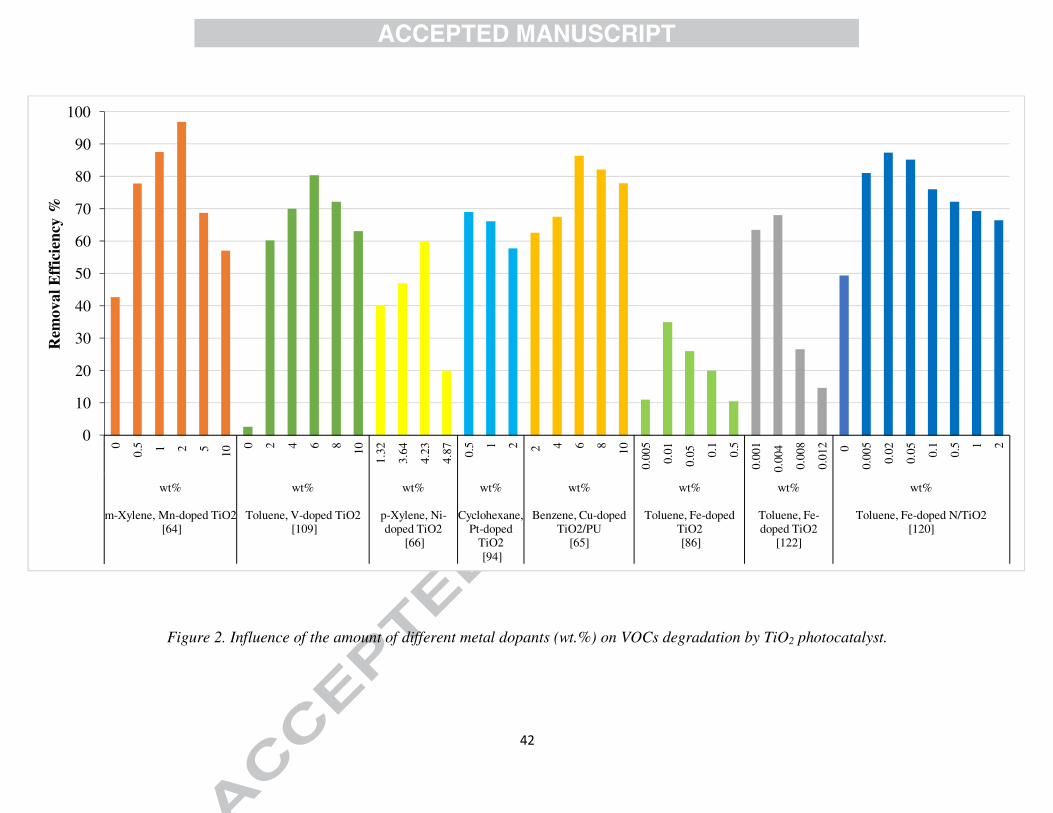
42
0
10
20
30
40
50
60
70
80
90
1000
0.5 1 2 5 10 0 2 4 6 8 10
1.32
3.64
4.23
4.87 0.
5 1 2 2 4 6 8 10
0.00
5
0.01
0.05
0.1
0.5
0.00
1
0.00
4
0.00
8
0.01
2 0
0.00
5
0.02
0.05 0.
1
0.5 1 2
wt%
m-Xylene, Mn-doped TiO2[64]
wt%
Toluene, V-doped TiO2[109]
wt%
p-Xylene, Ni-doped TiO2
[66]
wt%
Cyclohexane, Pt-doped
TiO2[94]
wt%
Benzene, Cu-doped TiO2/PU
[65]
wt%
Toluene, Fe-doped TiO2[86]
wt%
Toluene, Fe-doped TiO2
[122]
wt%
Toluene, Fe-doped N/TiO2 [120]
Rem
oval
Eff
icie
ncy
%
Figure 2. Influence of the amount of different metal dopants (wt.%) on VOCs degradation by TiO2 photocatalyst.

43
Figure 3. Schematic energy level of Fe (transition metal) doping TiO2.

44
Figure 4. Schematic energy level of (a) N-doped TiO2, (b) C-doped TiO2, (c) S-doped TiO2.
Figure 5. Schematic energy level of metal and non-metal doped TiO2.

45
Figure 6. Figure 6. Schematic energy level of TiO2 composite (a) SnO2 (data extracted from [21, 22,
142]), (b) CdS (data extracted from [140, 142]), (c) WO3 (data extracted from [106, 142]), (d) ZnO (data
extracted from [146]).

46
Table 1. The reactions involved in the TiO2 photocatalytic oxidation process for the degradation
of VOC pollutants.
Reactions Eq. No.
Photoexcitation: 789: + ;< → ;� + =� 1
Oxidation reaction:9>� + ;� → 9>• 2
Reduction reaction: 9:(@AB) + =� → 9:(@AB)� 3
Ionization of water:>:9 → 9>� + >� 4
Protonation of superoxide:9:•� + >� → >99• 5
electron scavenger: >99• + =� → >99� 6
Formation of H2O2: >99� + >� → >:9: 7
9>• + CDEEFG@HG +9:� → CIDAFJGB(K9:, >:9, =GJ. ) 8
*whereℎ� and �� are hole and electron, respectively.

47
Table 2. Overview of photocatalytic degradation of VOCs over TiO2 in various conditions.
Contaminant (concentration)
Photocatalyst Experimental
conditions Conversion By-products
Remarks
Ref.
Hexane, Octane, Ethanol, 1-
Butanol, Toluene, p-Xylene, Methyl
ethyl ketone (MEK) and
Acetone (0.25, 0.5, and 1
ppm)
TiO2; Support:
FGFs and CCFs
T= 20-25 ºC; RH= 15-45%; AFR= 41–255
m3/h; Lamps: UVC and
VUV; Intensity= 1.6-4.3
mWcm-2
TiO2/CCFs-VUV and 500 ppb; Hexane: 14%; Octane: 15% ; Ethanol: 34% ;
1-Butanol: 41%; Toluene: 20% ; p-Xylene: 22%;
MEK: 29%; and
Acetone: 25%.
TiO2/FGFs or CCFs+VUV: • Hexane: formaldehyde, acetaldehyde, 2-
butenal, propanal, butanal, tolualdehyde, and hexanal.
• Octane: formaldehyde, acetaldehyde, acetone, propanal, butanal and pentanal
• Ethanol: formaldehyde, acetaldehyde, 2-butenal, and propanal.
• 1-Butanol: formaldehyde, acetaldehyde, 2-butenal, propanal, and butanal.
• Toluene: formaldehyde, acetaldehyde, acetone, 2-butenal, butanal, and benzaldehyde.
• MEK: formaldehyde, acetaldehyde, acetone, and hexanal.
• Acetone: formaldehyde and acetaldehyde.
• Single-pass removal efficiency was varied as: TiO2/CCFs+VUV>TiO2/FGFs+VUV>TiO2/FGFs+UVC.
• The lower initial concentrations led to the higher conversion efficiencies.
[7]
Ethylene, Propylene, and
Toluene (200 ppm)
TiO2 (TNPs )
T=25 ºC; RH=60%;
RT=220 min; Lamps=
Combination of UVA (13.6 W) and
UVB (3 W)
Ethylene: about 73%; Propylene: about 37%;
and Toluene: about 61%
For Propylene: • polyethylene and polypropylene
• Calcination at 400 ºC for 3 h were the optimum calcination temperature and time for TNP catalyst
• The surface area of the optimized photocatalyst was 3 times higher than Degussa P25 catalyst (53 m2/g).
• An increase in calcination time from 1 to 3 h enhanced the surface area as a result of the absence of impurities and water molecules.
• The required surface area for the total adsorbed of toluene is 19.425 m2/g which is higher than the available 15 m2/g. This means multilayer adsorption happened during the tested conditions.
[41]

48
Ethylene, Propylene, and
Toluene (200 ppm)
TiO2 (TNPs)
T=20 to 80 ºC; AFR=100 mL/min;
Lamps: Combination of
UVA (13.6 W) and UVB (3 W)
Ethylene: 66.3%; Propylene: 80.4%;
and Toluene: 46%
For Ethylene: • polyethylene and polypropylene.
For propylene:
• polyethylene and polypropylene.
For Toluene: • NA
• Calcination at 400 ºC for 3 h were the optimum calcination temperature and time for TNP catalyst
• The commercial Degussa P25 showed the lower conversion efficiencies than TNPs.
• The highest conversion was achieved at 20 ºC. Moreover, by increasing the temperature from 20 to 80 ºC, the conversion was decreased.
• In the absence of water vapor, the photocatalytic degradation of toluene did not occur.
• The toluene illustrated the maximum adsorption capacity on TNP.
[83]
Ethanol (0.25, 0.5, and 1
ppm)
TiO2; Support:
FGFs and CCFs
T=23 ºC; RH=15-30%;
Lamp: UVC (18.4 W);
Intensity= 29-39 mWcm-2
17-38% for FGFs+UVC; 19-43% for FGFs+VUV;
and 31-53% for CCFs+VUV
NA
• TiO2/FGFs indicated that for the polar VOCs, the adsorption coefficients were roughly one order of magnitude higher than nonpolar VOCs for a specific RH level.
• TiO2/FGFs filter showed higher adsorption capacity for polar VOCs.
• TiO2/CCFs was better than TiO2/FGFs in the case of BET surface area, adsorption capacity, resistance against water vapor and photocatalytic activity.
[61]
Toluene (400 ppmv)
Evonik P25, Cristal PC105,
Kronos 1077, and Cristal AT-1; Support: Flat
glass disk
T=250 ºC; RH=40%; Lamp: Iron
halogenide lamp (500 W);
Intensity = 3 mWcm-2
52% (after 6 hr) for P25; 50% (after 6 hr) for PC105; 46% (after 6 hr) for Kronos
1077; and
46% (after 6 hr) for Cristal AT-1
• P-cresol, hydroquinone, benzoic acid, benzaldehyde, benzyl Alcohol, and carbon dioxide.
• Evonik P25 and Cristal PC105 presented high photocatalytic efficiencies and performance within the shorter reaction time.
• Micro-sized catalyst shown a higher hydrophilicity/ hydrophobicity ratio
[49]
Toluene (NA)
Nano TiO2 (Degussa P25); Support: ACFs
T= 25±0.5 ºC; RH=15, 30, 45, and
60%; Lamp: UV (15 W
254 nm)
14.2% (RH=60%)
Detected intermediate: • Benzaldehyde (about 74-89%),
benzyl alcohol (about 9-19%), benzoic acid (about 1%), 2-methyl, p-benzoquinone (about 1-3%) and cresol (about 1-2%)
• The BET surface area of the original ACFs and TiO2/ACF were 1215.4 and 999.6 m2/g, respectively.
• Increasing the RH from 15 to 60 % caused increasing in oxidation conversion from 9.5 to 14.2 %.
• Accumulation rate of benzyl alcohol increased with the increase of RH, however, accumulation rate of benzaldehyde decreased.
[84]

49
• The conversion rate of toluene followed the first-order reaction mechanism.
Benzene (3.3±0.2 ppmv),
Toluene (9.5±0.5 ppmv),
Ethylbenzene (9.5±0.5 ppmv),
and m-Xylene
(15±1 ppmv)
TiO2; Support: Glass;
Coating method: Dip coating
T=NA; RH= 0-35230
ppmv; RT=18-145 s;
Lamp: UVC (18 W)
At different RH Benzene: 56-100% (RT~116 s),
Toluene: 64-98% (RT~74 s), Ethylbenzene: 65-98% (RT~42
s) and
m-Xylene: 68-95% (RT~62 s)
• No by-products were detected above the detection limit (150 ppbv) and CO2 was the only detected product.
• No conversion of BTEX neither in the case of photolysis (UV irradiation without catalyst) nor catalysis (catalyst without UV irradiation) was observed.
• The PCO of toluene and benzene were improved by increasing the water vapor concentration up to the optimum amount, however, the conversions were slightly decreased at more than that concentration.
• The increase in residence time led to increase in the conversion.
[56]
Benzene (21.2 ppmv),
Toluene (8.57 ppmv), Ethylbenzene (19 ppmv), m-Xylene
(10.20 ppmv), o-Xylene
(7.53 ppmv), and p-Xylene
(23.58 ppmv)
TiO2
T= 50 ± 2 ºC; RH=No humidity;
Lamp: Low-pressure Hg (12 W)
Benzene: 82%; Toluene: 97%;
Ethylbenzene:83%; m-Xylene: 92%; o-Xylene: 85%
and p-Xylene: 98%
• No gas-phase intermediates were detected in the case of benzene, toluene, and ethylbenzene.
• Ethylbenzene was produced as by-product in high concentration for m-Xylene while in the case of o,p-Xylene was produced in low concentration.
• Adsorption on the catalyst surface for aromatic compounds was in the following order: Toluene>m-Xylene>p-Xylene>o-Xylene>Benzene> Ethylbenzene
•
[85]
Benzene (~47 ppm),
Toluene (~42 ppm),
Ethylbenzene (~39 ppm),
p,m-Xylene (~41ppm),
and o-Xylene (~27 ppm)
TiO2; Support: glass
T= 30.1 ± 0.7 ºC; RH=42.2 ± 3.2%; RT= 7.0 ± 0.25
min; Lamps: UVC
(8,11,16 W, 254 nm)
Benzene: 82.8%; Toluene: 35.8%;
Ethylbenzene: 97.9%; p,m-Xylene: 58.9%
and o-Xylene: 67%
• High formation of intermediates for toluene degradation such as benzaldehyde and benzoic acid led to decrease degradation rate constant much faster than the other considered VOCs.
• The particle size of TiO2 was 10.2±1.43 nm and uniformly dispersed on the surface of the catalyst.
• By decreasing the particle size specifically under the 30 nm, the photocatalytic activity of TiO2 and the number of active surface sites increased.
• The BET surface area of the catalyst powder was 9 m2/g.
[28]
Benzene (25ppmv)
TiO2; Support: Zeolite
(ZSM-5 with Si/Al of 200 and 470, MCM-41);
T= NA; RH=50%;
AFR= 1 L/min; Lamps: Two VUV (4 W), Two UVC
100% for TiO2/ZSM-5 (250 min) and 95% (360 min)
100% for TiO2/MCM-41 (180
min) and 87% (360 min)
NA
• No considerable rutile phase was detected in the XRD pattern of TiO2/MCM-41. However, the small diffraction peak of rutile phase was observed on TiO2/ZSM-5 (200) and TiO2/ZSM-5 (470).
[77]

50
(4 W, 254 nm)
• The stable benzene degradation efficiency for the various catalysts followed the order: TiO2/ZSM-5(200)>TiO2/ZSM-5(470)>TiO2/MCM–41>P25.
• TiO2/ZSM-5(200) displayed the highest CO2 concentration which is represented that it was a reliable catalyst for ozone degradation.
• All the supported TiO2 catalysts demonstrated higher photoactivity for benzene removal.
Acetone and Acetaldehyde (400 ppmv)
Evonik P25, Cristal PC105,
Kronos 1077, and Cristal AT-1; Support: Flat
glass disk
T=250 ºC; RH=40%; Lamp: Iron
halogenide lamp (500 W);
Intensity= 3 mWcm-2
Acetone: 100% (after 70 min) for P25,
100% (after 60 min) for PC105, 100% (after 90 min) for Kronos
1077, and 49% (after 120 min) for
Cristal AT-1 Acetaldehyde:
100% (after 60min) for P25, 100% (after 50min) for PC105, 100% (after 70min) for Kronos
1077, and 46% (after 120 min) for Cristal
AT-1
Acetone: • No by-product in the case of Evonik
P25, Cristal PC105 and Kronos 1077.
• By-products for Cristal AT-1 were acetaldehyde, acetic acid, formaldehyde, formic acid, and carbon dioxide.
Acetaldehyde: • No by-product in the case of Evonik
P25, Cristal PC105 and Kronos 1077.
• Evonik P25 and PC105 presented high photocatalytic efficiency and performance within the shorter reaction time.
• Micro-sized catalyst had a higher hydrophilicity/ hydrophobicity ratio.
[49]
T: Temperature
RH: Relative Humidity
AFR: Air Flow Rate
RT: Residence Time
NA: Not Available
TNP: Titanium nanoparticle
FGFs: Fiberglass fibers
CCFs: Carbon cloth fibers
ACFs: Activated carbon fibers
Table 3. Common preparation method of modified TiO2 photocatalyst for PCO.
Synthesize Method
Photocatalyst Precursor Dopant/source Ratio (dopant/ TiO2) Treatment
Temp./Duration Cal. Temp./
Duration Ref.
Metal Sol-gel Mn-doped, Tetra butyl titanate Mn, Cu, Co, Ni, and Fe 1% 120 ºC /6 h 550 ºC /4 h [79]

51
doping Cu-doped, Co-doped, Fe-doped, Ni-doped
/Acetate of transition metals
Fe-doped Tetra butyl titanium Fe/ Iron (III) nitrate Fe/Ti atomic ratio:
0.1% to 1.5% 80 ºC /48 h 480 ºC /3 h [73]
Fe-doped Tetra-n-butyl
titanium Fe/ Iron (III) nitrate
Fe/Ti ratios: 0.005, 0.01, 0.05, 0.1,
and 0.5 Room Temp. /3 h 400 ºC /1 h [86]
Fe-doped Titanium tetraiso-propoxide
Fe/ Iron (III) acetylacetonate
Fe/Ti molar ratios: 0.001
to 0.1% 350–450 ºC /4 h NA [90]
Pt-doped Titanium
tetraisopropoxide Pt/ Hexachloroplatinic
acid 0.5 and 1 wt.% 110 ºC / overnight 650 ºC /2 h [91]
Ni-doped Titanium butoxide Ni/ Nickel (II) chloride 0.1, 0.3, and 0.5 wt.% 110 ºC /12 h 500 ºC /5 h [21]
Hydrothermal Ce-doped, Fe-doped, Ni-doped
Tetra butyl titanate Ce/ Cerium (III) nitrate
Fe/ Iron (III) nitrate Ni/ Ni (II) nitrate
0.5 and 5 wt.% 80 ºC /24 h 500 ºC /2 h [92]
Impregnation Mn-doped
Titanium (IV) butoxide
Mn/ Manganese nitrate 0.5 to 10 wt.% 80 ºC / overnight 500 ºC /3 h [62]
Pt-doped P25 Degussa Pt/ Chloroplatinic acid 0.1 and 1 wt.% 120 ºC /4 h 400 ºC /4 h [93]
Hydrolysis Pt-doped
Titanium tetraiso-propoxide
Pt/ Chloroplatinic acid 0.5, 1 and 2 wt.% NA 650 ºC /2 h [94]
Ru-doped Titanium oxosulphate Ru/ Ruthenium
chloride 0.005, 0.01, 0.05, 0.1, 0.25, 0.5, and 0.75 g
100 ºC /8 h 600 ºC /2 h [95]
Thermal assisted
microwave Ir-doped
Titanium (IV) ethoxide
Ir/ Iridium (III) chloride
0.25, 0.5, 0.75, and 1.5 wt.%
60 ºC /24 h 200 ºC /7
min. 500 W
[96]
Non-metal
doping
Sol-gel B-doped Titanium butoxide B/ Boric acid 1, 3, and 5 wt.% 110 ºC /12 h 500 ºC /5h [23]
C-doped Tetra-titanium-isopropoxide
C/ Carbon particle NA Room Temp. /12 h 400 ºC /1 h [97]
Hydrothermal
C-doped Titanium (IV) Sulfate C/ Glaucous
C/Ti molar ratio: 3:50,
1:50, and 1:150
160 ºC /12 h NA [38]
C-doped Titanium (IV) Sulfate C/ Sucrose 1:25 180 ºC /12 h NA [98]
C-doped Ammonium hexafluorotitanate
C/ Glaucous NA 180 ºC /24 h 500 ºC [99]
N-doped Tetra butyl titanate N/ ammonia NA NA 600 ºC /2 h [19]

52
Thermal treatment
N-doped P25 powder N/ Ammonium
hydroxide NA NA 400 ºC /3 h [100]
Microemulsion S-doped Titanium (IV) isopropoxide
S/ Ammonium sulfate S/Ti molar ratio:
1, 5, and 20% 110 ºC /24 h 600 ºC /2 h [87]
Hydrolysis S-doped Degussa P25 S/ Thiourea Si/Ti ratio: 0.2, 0.4,
0.8, and 1.6 85 ºC /20 h 450 ºC /4 h [101]
Impregnation F-doped P25 powder F/ ammonium fluoride mass ratios of 0.3
NH4F/ TiO2 85 ºC /8 h
500 ºC /3 h [100]
Solvothermal S-doped Titanium
isopropoxide S/Thiourea molar ratio Ti/S of 1:4
Room Temp. /2 days
350 ºC [102]
Co- doping
Sol-gel
B, Fe co-doped Titanium butoxide B/ Boric acid Fe/ Iron (III)
acetylacetonate
B: 3 wt.% Fe:0.5, 1, 3, and 5
wt.% 110 ºC /12 h 500 ºC /5 h [23]
F,N co-doped Titanium
tetraisopropoxide
F/ ammonium fluoride N/ ammonium
hydroxide NA
85 ºC /8 h
500 ºC /3 h [100]
Impregnation Na-doped Pd/TiO2
Degussa P25 Pd/ Palladium (II)
nitrate Na/ Sodium nitrate
Pd:1 wt.% Na: 1, 2, 4, and 8 wt.%
110 ºC / overnight 400 ºC /2 h [103]
Microemulsion Fe, S co-doped Titanium (IV) isopropoxide
S/ Ammonium sulfate Fe/ Iron(III) nitrate
S/Ti molar ratio:1, 5, and 20%
Fe/Ti molar ratio:1.5% 110 ºC /24 h 600 ºC /2 h [87]
Hydrolysis C, N, and S tri-
doped Titanium
isopropoxide Thiourea
molar ratio of thiourea to TiO2 is 0, 1, 2, 3 and
6 80 ºC /10 h 500 ºC /3 h [104]
Composite
Sol-gel
N doped TiO2-Nb2O5 composit
Titanium isopropoxide
N/ Ammonium hydroxide
Nb2O5/ potassium niobate
N: 0.49 at.% TiO2: 50 wt.%
Nb2O5: 50 wt.% 80 ºC
380 and 500 ºC /5 h
[25]
SiO2 -TiO2
Composite Titanium n-butyloxide
Si/ Tetraethoxysilane (TEOS)
Si/Ti molar ratio:1:100, 5:100, 10:100, 15:100,
and 20:100 130 ºC /8 h 500 ºC [37]
ZnO-TiO2 Composite
Titanium isopropoxide
ZnO/ Zinc acetate 50 wt % of ZnO and 50 wt.% of TiO2
80 ºC /48 h 380 and 500 ºC /5 h
[105]
Impregnation
Ni–TiO2–SnO2 Titanium butoxide Ni/ Nickel (II) chloride
SnO2/ Triphenyltin hydroxide
Ni: 0.1, 0.3, and 0.5 wt.%
Room Temp/24 h 500 ºC /5 h [21]
N-TiO2/WO3 Titanium
tetraisopropoxide
N/Urea WO3/ Ammonium
paratungstate
N/ WO3/ TiO2
compositions: 2.5/ 0.5/ 100, 2.5/1.0/
110 ºC /2 h 350 ºC /2 h [106]

53
pentahydrate 100, 2.5/2.0/ 100, 2.5/4.0/ 100, and
2.5/6.0/ 100
Cal.: Calcination;
Temp.: Temperature;
NA: Not Available.
Table 4. Summary of the common noble and transition metal dopants in the TiO2 photocatalyst with their operated photocatalytic
conditions and maximum efficiencies.
Contaminant (Concentrati
on) Photocatalyst Dopant
Experimental condition
Efficiency before doping
Efficiency after doping Band gap Remarks
Ref.
BTEX (0-22 ppmv)
Pt- doped P25, Fe-doped P25, Ce-doped P25; Support: glass; Method: Wet impregnation
Pt, Fe, and Ce: 0.25 % (w/w)
RT=11.5±0.5 s;
Lamp: Low-pressure Hg, UVC, 11 W (253.7 nm)
Benzene: 10-28%;
Toluene: 2-
12%;
Ethylbenzene: 4-59%;
and m-Xylene:
6-87%
Benzene: 4.6-6.5% for Pt/P25, 4.6-12% for Fe/P25,
and 17-79% for Ce/P25; Toluene:
3-9% for Pt/P25, 2.7-6% for Fe/P25,
and 3-9% for Ce/P25;
Ethylbenzene: 15-89% for Pt/P25, 5-80% for Fe/P25,
and 10-92% for Ce/P25;
m-Xylene: 9-83% for Pt/P25, 6-81% for Fe/P25,
and 9-86% for Ce/P25
NA
• In the case of PCO of benzene, only Ce/P25 catalyst was efficient.
• PCO rates over P25/Ce were higher by a factor of 1.5-10 than those over P25.
• For PCO of toluene, P25 catalyst proved to be the most active.
• For PCO of ethylbenzene, all doped catalysts followed the same trend.
• For all ethylbenzene concentration range, the P25/Ce catalyst was superior to others.
• In the case of m-xylene, there was no catalyst superior to the others at all concentration range.
• The PCO conversions of ethylbenzene and m-xylene indicated a great dependence on the initial concentration of the target compound.
[113]
BTEX (0.1 ppm)
Fe-doped TiO2; Support: Glass
Fiber; Synthesize
method: Sol-gel;
Fe-to Ti ratio: 0.005, 0.01,
0.05, 0.1, and 0.5
T=NA; RH=45%;
AFR=1 L/min;
Lamp: UVA-visible
Under
visible light: 0% for
Benzene; 5% for
Visible light and 0.01-GF-Fe-TiO2
Benzene: 4%; Toluene: 33%;
Ethylbenzene: 51% and
NA
• The calculated diameter of TiO2 crystal was 21.5 nm which was similar to the calculated diameters of the Fe-TiO2 composites (20.9−21.7 nm).
• The GF-Fe-TiO2 composites showed higher photocatalytic activity for BTEX rather than the GF-TiO2 (reference) photocatalyst.
[86]

54
Coating method:
Dip-coating
(daylight and black light
lamp); Visible light intensity=
2.7 mWcm-2 and
UV light intensity=
0.4 mWcm-2
Toluene; 16% for
Ethylbenzene and
29% for o-Xylene
Under UV
light: 68% for Benzene, 90% for Toluene, 96% for
Ethylbenzene, and
97% for o-Xylene
o-Xylene: 74%
UV light and 0.5-GF-Fe-TiO2
Benzene: 15%; Toluene: 63%;
Ethylbenzene:79% and
o-Xylene: 86%
• The photocatalytic activities of BTEX for GF-Fe-TiO2 under visible light reduced gradually by increasing the Fe-to-Ti ratio from 0.01 to 0.50.
• The BTEX photocatalytic efficiencies of GF-Fe-TiO2 under UV were lower than those obtained for GF-TiO2.
• The GF-TiO2 photocatalyst demonstrates an absorption edge at λ ≈ 410 nm.
Benzene (50 ppmv)
R-doped TiO2
(R: Mn, Co, Cu, Fe, and Ni),
undoped TiO2 and P25;
Synthesize method: Sol-gel
Mn, Co, Cu, Fe,
and Ni
1wt.%
T=NA; RH=50%;
AFR=1 L/min;
RT=30 s; Lamps:
UVC and VUV, 4 W
45.7% for undoped
TiO2
and 50.2% for P25
58% for Mn/TiO2; 51.5% for Co/TiO2; 50.9% for Cu/TiO2; 45.3% for Fe/TiO2
and 50.3% for Ni/TiO2
(Under VUV)
NA
• BET surface area of pure TiO2 was 96.6 m2/g while it declined to less than 50 m2/g for all doped catalysts.
• It is possible that the presence of transition metals blocked the pores of TiO2 and increase the growing of particles which lead to the reduction of specific surface area.
[79]
Benzene (100 ppm)
Cu-doped TiO2; Support: Porous
polyurethane (PU)
Cu: 2, 4, 6, 8, and 10 wt.%
T= NA; RH=40, 60,
80%; AFR= 100 mL/min;
Lamps= two 20 W light bulbs (400-700 nm);
Intensity= 50 mWcm-2
NA 86.3% for 6 wt.%-
Cu-TiO2/PU
3.20 eV for TiO2/PU; 3.05 eV for 2 wt.% -Cu-
TiO2/PU; 2.92 eV for 4 wt.% -Cu-
TiO2/PU; 2.85 eV for 6 wt.% -Cu-
TiO2/PU; 2.79 eV for 8 wt.% -Cu-
TiO2/PU and 2.75 eV for 10 wt.%-Cu-
TiO2/PU
• Optimal humidity conditions for the photocatalytic oxidation of benzene in Cu–TiO2/PU photocatalyst, was 60% RH.
• Water molecules played an important role in the photocatalytic oxidation process of benzene.
• The Cu+/Cu2+ ratios, the benzene removal efficiency and the degree of mineralization enhanced with the increase in the Cu/TiO2 ratios reached up to 6 wt%, and then gradually decreased with the further increase in ratios (8 and 10 wt%).
[63]
Toluene (370 ppmv)
Fe-doped TiO2; Support: glass
fiber;
Fe (Fe/Ti atom
T=Room temperature; RH=60%;
Efficiency NA
Efficiency NA
40-96.5%
3.18 eV for 0.1%-Fe-TiO2;
• No degradation of toluene was observed on the surface of the catalyst in absence of irradiation.
• Only about 5.8% of the toluene was converted [73]
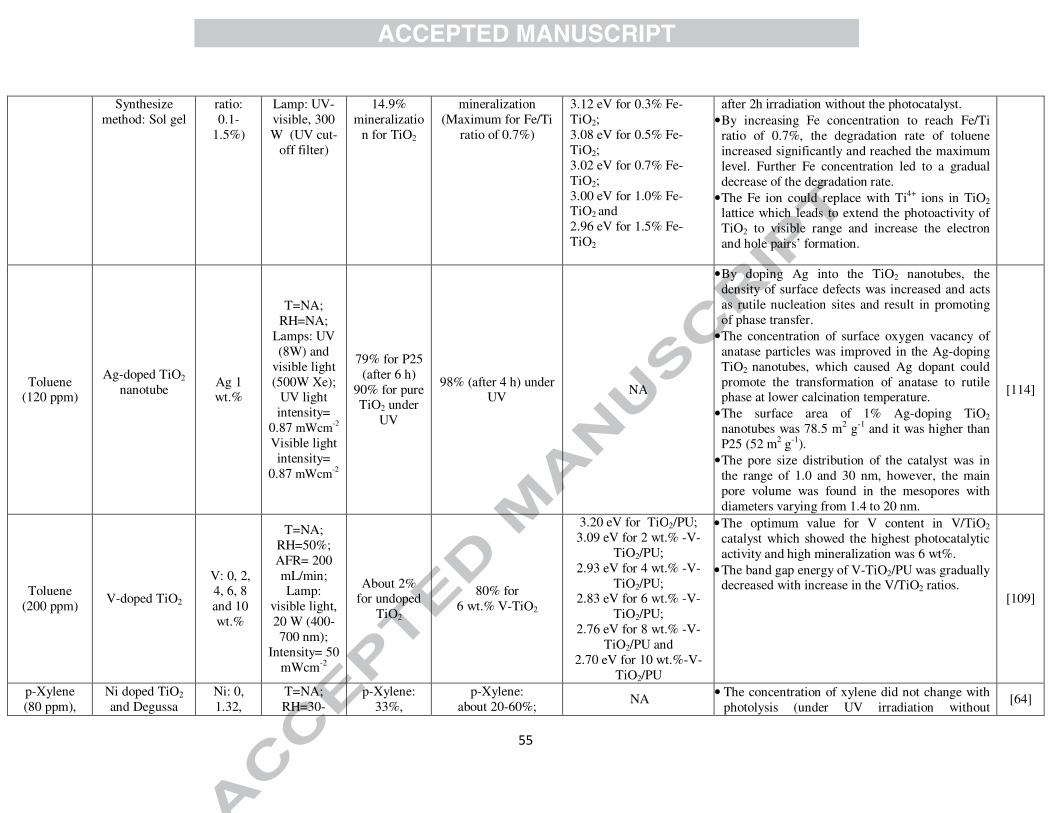
55
Synthesize method: Sol gel
ratio: 0.1-
1.5%)
Lamp: UV-visible, 300 W (UV cut-
off filter)
14.9% mineralizatio
n for TiO2
mineralization (Maximum for Fe/Ti
ratio of 0.7%)
3.12 eV for 0.3% Fe-TiO2; 3.08 eV for 0.5% Fe-TiO2; 3.02 eV for 0.7% Fe-TiO2; 3.00 eV for 1.0% Fe-TiO2 and 2.96 eV for 1.5% Fe-TiO2
after 2h irradiation without the photocatalyst. • By increasing Fe concentration to reach Fe/Ti
ratio of 0.7%, the degradation rate of toluene increased significantly and reached the maximum level. Further Fe concentration led to a gradual decrease of the degradation rate.
• The Fe ion could replace with Ti4+ ions in TiO2 lattice which leads to extend the photoactivity of TiO2 to visible range and increase the electron and hole pairs’ formation.
Toluene (120 ppm)
Ag-doped TiO2 nanotube
Ag 1 wt.%
T=NA; RH=NA;
Lamps: UV (8W) and
visible light (500W Xe);
UV light intensity=
0.87 mWcm-2 Visible light intensity=
0.87 mWcm-2
79% for P25 (after 6 h)
90% for pure TiO2 under
UV
98% (after 4 h) under UV NA
• By doping Ag into the TiO2 nanotubes, the density of surface defects was increased and acts as rutile nucleation sites and result in promoting of phase transfer.
• The concentration of surface oxygen vacancy of anatase particles was improved in the Ag-doping TiO2 nanotubes, which caused Ag dopant could promote the transformation of anatase to rutile phase at lower calcination temperature.
• The surface area of 1% Ag-doping TiO2 nanotubes was 78.5 m2 g-1 and it was higher than P25 (52 m2 g-1).
• The pore size distribution of the catalyst was in the range of 1.0 and 30 nm, however, the main pore volume was found in the mesopores with diameters varying from 1.4 to 20 nm.
[114]
Toluene (200 ppm)
V-doped TiO2
V: 0, 2, 4, 6, 8 and 10 wt.%
T=NA; RH=50%; AFR= 200 mL/min; Lamp:
visible light, 20 W (400-700 nm);
Intensity= 50 mWcm-2
About 2% for undoped
TiO2
80% for 6 wt.% V-TiO2
3.20 eV for TiO2/PU; 3.09 eV for 2 wt.% -V-
TiO2/PU; 2.93 eV for 4 wt.% -V-
TiO2/PU; 2.83 eV for 6 wt.% -V-
TiO2/PU; 2.76 eV for 8 wt.% -V-
TiO2/PU and 2.70 eV for 10 wt.%-V-
TiO2/PU
• The optimum value for V content in V/TiO2 catalyst which showed the highest photocatalytic activity and high mineralization was 6 wt%.
• The band gap energy of V-TiO2/PU was gradually decreased with increase in the V/TiO2 ratios.
[109]
p-Xylene (80 ppm),
Ni doped TiO2 and Degussa
Ni: 0, 1.32,
T=NA; RH=30-
p-Xylene: 33%,
p-Xylene: about 20-60%;
NA • The concentration of xylene did not change with photolysis (under UV irradiation without
[64]

56
m-Xylene (70 ppm),
and o-Xylene
(60 ppm)
P25; Support:
Granular silicate glass;
Coating method:
impregnation
3.64, 4.23, 4.87, 4.46, 4.57,
and 4.74 wt.%
90%; RT= 54 s;
Lamp: UVC, 10 W (254
nm)
m-Xylene: 35%, and o-Xylene:
32%
m-Xylene: about 18-58%;
and o-Xylene:
about 18-54%
photocatalyst) or catalysis (under dark conditions in the presence of the photocatalyst).
• The photocatalytic degradation of xylene over TiO2 can be improved by doping Ni at a concentration lower than 4.2 wt.%, otherwise, the photocatalytic activity of modified TiO2 would be worse than that of pure TiO2.
m-Xylene (207 ppb)
Mn-doped TiO2
Mn: 0.5, 1, 2, 5, and 10
wt%
T=100 ºC; RH=23-25% and 75-80%;
RT=0.55-3.11s;
AFR=12 L/min;
Lamp: UV lamp
33.5±4.8% 2wt.%-Mn-TiO2
50±3.3 %
3.2 eV for TiO2; 3.1 eV for 0.5 wt.%-Mn-
TiO2; 3.06 eV for 1 wt.%-Mn-
TiO2; 3.01 eV for 2 wt.%-Mn-
TiO2; 2.8 eV for 5 wt.%-Mn-
TiO2 and 1.2 eV for 10 wt.%-Mn-
TiO2
• The loaded Mn provided more active sites on the photocatalyst surface, thus increased the photocatalytic activity.
• Mn-doped TiO2 results in narrowing the band gap.
• Mn dopants ions caused to reduce the charge carrier recombination rate and improved the separation rate of electron–hole pairs.
• Removal efficiency increased by loading Mn up to 2 wt%. However, an excess amount of Mn on the surface of catalyst led to decreeing in removal efficiency.
[62]
Isopropanol (1100 ppm)
Rare earth-doped TiO2
(RE= cerium, lanthanum,
europium and yttrium),
Undoped P25; Method: Thermal
treatment (Cal. Temp: 900 and
1000 ºC
Ce, La, Eu, and Y: 0.01
and 0.025 mol
T=23±2 ºC; RH=25-
30%; Lamp:
Xenon lamp, 300 W (400-
800 nm); Intensity= 16
mWcm-2
Efficiency NA
Acetone
formation (ppm h-1) at
Cal. Temp:900 For P25= 15
Efficiency NA
Acetone formation (ppm h-1) at Cal.
Temp:900 for La (0.01 mol)=26;
La (0.025 mol)=32; Eu (0.01 mol)=27;
Eu (0.025 mol)=19; Y (0.01 mol)=18;
Y (0.025 mol)=21; Ce (0.01 mol)<0.5
and Ce (0.01 mol)<0.5
3.01 eV for P25; 3.04 eV for La (0.01 mol);
3.04 eV for La (0.025 mol);
3.03 eV for Eu (0.01 mol); 3.04 eV for Eu (0.025
mol); 3.03 eV for Y (0.01 mol); 3.03 eV for Y (0.025 mol); 2.91 eV for Ce (0.01 mol)
and 2.90 eV for Ce (0.025
mol)
• The thermal treatment of the undoped P25 powder, caused to a decrease of its photocatalytic activity due to the concomitant size growth of the titania particles, and the decrease of its specific surface area.
• The three catalysts La (0.025 mol)-900, Eu (0.01 mol)-900 and La (0.01 mol)-900 all had high photocatalytic activity under visible-light irradiation.
• The rare earth doped TiO2 modifications led to attach more hydroxyl groups to the surface of the photocatalyst and generate chemical oxidative species, such as hydroxyl radicals which enhanced the photocatalytic activity.
[124]
Ethanol (0.2 vol. %)
(Concentrati
on of 0.2 vol.%, in
Pt-doped TiO2
Pt: 0.5 and 1 wt.%
T=60,80, and 100 ºC; RH=NA;
AFR=20-70 L/h;
Lamps= two
For undoped TiO2:
69%, 82% and 80% (at 60, 80, and
100 ºC,
98% for 0.5wt.%-Pt/TiO2 (at 80 ºC)
and 80% for 1 wt.%
Pt/TiO2 (at 80 ºC)
3.2 eV for TiO2; 2.8 eV for 0.5 wt.%-Pt-
TiO2 and
3.0 eV for 1 wt.%-Pt-TiO2
• No ethanol conversion was observed in dark adsorption for all tested temperature (60, 80 or 100 ºC).
• The conversion of ethanol enhanced when the reaction temperature increased to 80 ºC and then decreased for the reaction temperature of 100 ºC.
[91]

57
helium flow with an
oxygen/ethanol ratio of
2)
UVA-LEDs modules
(Each module
consisted of 40 UV-LEDs,
365nm); Intensity= 90
mWcm-2
respectively) • Ethanol conversion achieved with the catalysts with 1 wt.% Pt was slightly lower than those obtained with 0.5 wt.% Pt.
• Acetaldehyde was the main reaction product observed in all tests.
Acetonitrile (500 ppm)
M-doped TiO2
M: V, Cr, Fe, Co, Mn, Mo,
Ni, Cu, Y, Ce, and Zr
Ti/M=20 atomic ratio
(M: V, Cr, Fe,
Co, Mn, Mo, Ni,
Cu, Y, Ce, and Zr)
T=30-33 ºC; RH=NA;
AFR=100, 200, 300, and 500 mL/min;
Lamps: Six fluorescent white light lamps, 8W
4.5% for
P25
70% for Cr-TiO2; 21% for Fe-TiO2; 3.3% for Co-TiO2; 3.5% for Ce-TiO2; 5% for Cu-TiO2;
16.5% for V-TiO2; 2% for Ni-TiO2;
3.5% for Mn-TiO2; 2.3% for Mo-TiO2;
4.5% for Zr-TiO2 and 3% for Y-TiO2
3.11 eV for P25; 2.82 eV for Cr-TiO2; 2.69 eV for Fe-TiO2; 2.54 eV for Co-TiO2; 3.13 eV for Ce-TiO2; 2.86 eV for Cu-TiO2; 2.63 eV for V-TiO2; 2.37 eV for Ni-TiO2; 2.86 eV for Mn-TiO2; 3.19 eV for Mo-TiO2;
3.21 eV for Zr-TiO2 and 3.20 eV for Y-TiO2
• The Cr, Fe and V-doped TiO2 nanoparticles showed better photocatalytic efficiency under the visible light.
• The incorporation of the other transition metals including Mn, Mo, Ce, Co, Cu, Ni, Y, and Zr demonstrated an inhibition effect on the photocatalytic activity.
• Cr-doped TiO2 exhibited a superior photocatalytic activity and the rate constant for this modified catalyst was about 8–19 times higher than the other tested metal doped catalysts.
[125]
Acetaldehyde (500 ppm)
and Toluene (100 ppm)
Ir-doped TiO2; Support: glass
dish; Coating method:
Spray Coating
Ir: 0.25, 0.5, 0.75, and 1.5 wt.%
T= Room temperature; Lamp: LED (455 ± 0.1
nm); Intensity= 1
mWcm-2
Efficiency NA
About 270
CO2 ppm for undoped
TiO2
Efficiency NA
500 ppm CO2 for 0.5 wt% Ir-doped
TiO2
3.14 eV for bare TiO2 (brookite) and 1.88 eV
for 0.5wt.%-Ir-TiO2
• The specific surface areas for 0.25, 0.5, 0.75 and 1.5 wt% Ir-doped TiO2 brookite corresponded to 172.13, 208.41, 219.67, and 231.15 m2g−1 respectively, and for the undoped brookite was 128.18 m2g−1.
• 0.5 wt% Ir-doped TiO2 had the highest photocatalytic activity for decomposition of both acetaldehyde and toluene.
• The band gaps of the undoped and 0.5wt% Ir-doped TiO2 catalyst were 3.14 eV and 1.88 eV respectively.
[96]
Acetone (NA)
Ru-doped TiO2
Ru: 0.75, 0.5, 0.25, 0.1, 0.05, 0.01 and 0.005 g
Lamps: UV (365 nm and
400 nm)
Efficiency NA
Rate
constant for P25 Degussa was 0.00041
Efficiency NA
Rate constant for 0.05-Ru-TiO2 was
0.00059 and for 0.01-Ru-TiO2 was 0.00058
3.2 eV for TiO2; 2.7 eV for 0.75g-Ru-
TiO2; 2.9 eV for 0.5g-Ru-TiO2;
2.9 eV for 0.25g-Ru-TiO2;
2.9 eV for 0.1g-Ru-TiO2;
• The photocatalytic activities of Ru-doped TiO2 catalysts under visible light were strongly affected by the decreasing band gap energy.
• The rate constant (k) of the degradation of acetone under visible light was highest for the catalyst 0.05-Ru-TiO2.
• The total pore volume and a pore radius of
[95]
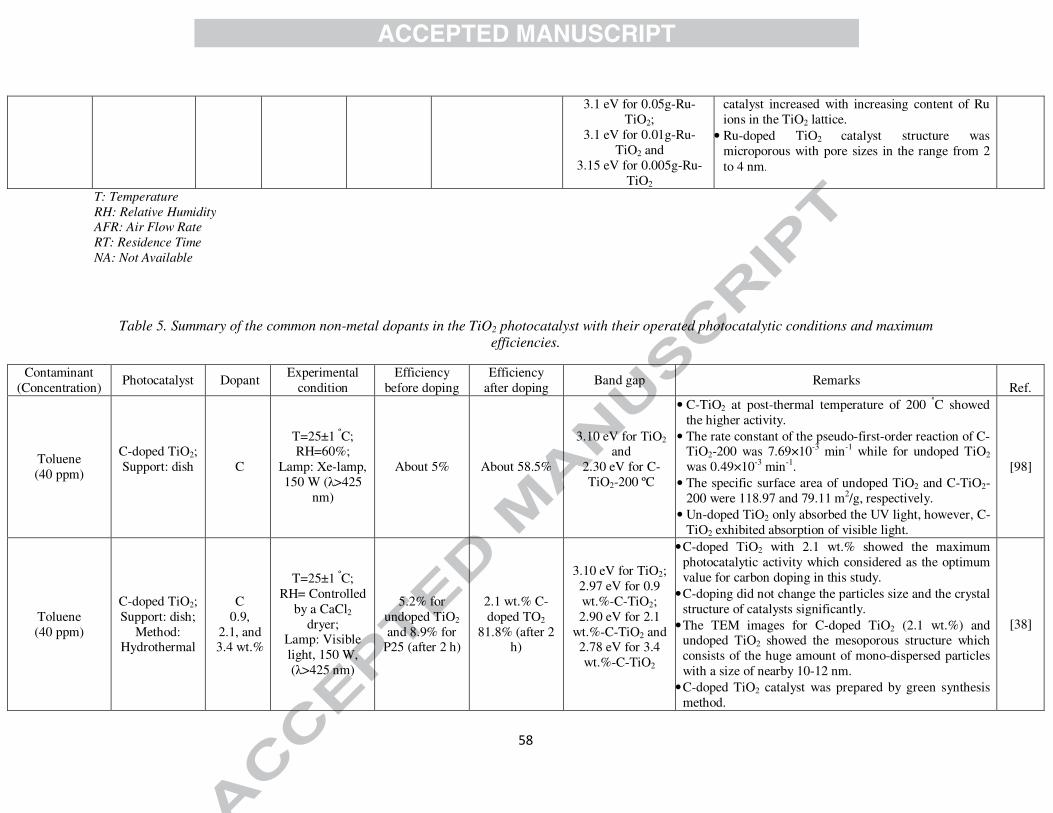
58
3.1 eV for 0.05g-Ru-TiO2;
3.1 eV for 0.01g-Ru-TiO2 and
3.15 eV for 0.005g-Ru-TiO2
catalyst increased with increasing content of Ru ions in the TiO2 lattice.
• Ru-doped TiO2 catalyst structure was microporous with pore sizes in the range from 2 to 4 nm.
T: Temperature
RH: Relative Humidity
AFR: Air Flow Rate
RT: Residence Time
NA: Not Available
Table 5. Summary of the common non-metal dopants in the TiO2 photocatalyst with their operated photocatalytic conditions and maximum
efficiencies.
Contaminant (Concentration)
Photocatalyst Dopant Experimental
condition Efficiency
before doping Efficiency
after doping Band gap Remarks
Ref.
Toluene (40 ppm)
C-doped TiO2; Support: dish
C
T=25±1 ºC; RH=60%;
Lamp: Xe-lamp, 150 W (λ>425
nm)
About 5% About 58.5%
3.10 eV for TiO2 and
2.30 eV for C-TiO2-200 ºC
• C-TiO2 at post-thermal temperature of 200 ºC showed the higher activity.
• The rate constant of the pseudo-first-order reaction of C-TiO2-200 was 7.69×10⁻³ min-1 while for undoped TiO2 was 0.49×10⁻³ min-1.
• The specific surface area of undoped TiO2 and C-TiO2-200 were 118.97 and 79.11 m2/g, respectively.
• Un-doped TiO2 only absorbed the UV light, however, C-TiO2 exhibited absorption of visible light.
[98]
Toluene (40 ppm)
C-doped TiO2; Support: dish;
Method: Hydrothermal
C 0.9,
2.1, and 3.4 wt.%
T=25±1 ºC; RH= Controlled
by a CaCl2 dryer;
Lamp: Visible light, 150 W, (λ>425 nm)
5.2% for undoped TiO2 and 8.9% for
P25 (after 2 h)
2.1 wt.% C-doped TO2
81.8% (after 2 h)
3.10 eV for TiO2; 2.97 eV for 0.9 wt.%-C-TiO2; 2.90 eV for 2.1
wt.%-C-TiO2 and 2.78 eV for 3.4 wt.%-C-TiO2
• C-doped TiO2 with 2.1 wt.% showed the maximum photocatalytic activity which considered as the optimum value for carbon doping in this study.
• C-doping did not change the particles size and the crystal structure of catalysts significantly.
• The TEM images for C-doped TiO2 (2.1 wt.%) and undoped TiO2 showed the mesoporous structure which consists of the huge amount of mono-dispersed particles with a size of nearby 10-12 nm.
• C-doped TiO2 catalyst was prepared by green synthesis method.
[38]

59
Toluene (100 ppm)
C- doped TiO2;
Support: optical fiber; Method: Sol-gel and dip
coating (1 to 5 times coating,
the film thickness of
TiO2 was 1.6, 2.6, 3.2, 4.0,
4.2 µm)
C 0.2 g
carbon particle (with
average diameter less than 50 nm)
T=25 ºC; RH=30%;
AFR= 3 L/min; Lamp: Hg lamp,
(300 nm, 405 nm, 436 nm)
35-79% (during 0.5
min to 30 min)
62-94% (during 0.5
min to 30 min)
Calculated band gap: 3.07 and
2.85 eV for N -TiO2
• Photodegradation efficiency was enhanced as the TiO2 thickness film was increased from 1.6 µm to 3.2 µm. However, by increasing thickness over 3.2 µm, the efficiency was decreased as the excessive film layer prevented UV light from passing through the TiO2 film.
• The specific surface area for TiO2 film (thickness 3.2 µm) was 55 m2g-1 and for C-TiO2 was 230 m2g-1
• By-products were formic acid and ethyl ester.
[97]
Toluene (66.3 ppm)
C-doped TiO2 and Degussa
P25; Support: dish;
Method: Hydrothermal
C
T=25±1 ºC; RH=NA;
Lamp: Xe lamp, 150 W
Efficiency NA
Rate constant k= 0.0008
min-1
Efficiency NA
Rate constant k= 0.0037
min-1
NA eV for P25; 2.80 eV for C-
TiO2-500 ºC and 2.90 eV for C-TiO2-600 ºC
• The PCO of toluene followed the pseudo-first-order reaction.
• The average diameter of the TiO2 hollow spheres after calcination at 500ºC for 1 hr was 0.5-3.0 µm.
• Degussa P25 exhibited lower activity rather than C-doped TiO2.
• The superior activity of C-doped TiO2 at 500 ºC resulted of the crystal structure and the mesoporous microstructure.
• The band gap of the C-doped TiO2 was narrower than that of the pure TiO2.
[99]
BTEX (0.03 to 3.1
ppm)
S-doped TiO2 and Degussa
P25; Support: glass
S Molar ratio
Titanium isopropoxide/thiour
ea was 1:4
T=19-25 ºC; RH=10-20, 50-
60, and 80-90%; AFR=0.5-6.0
L/min; Lamp:
Fluorescent Visible light, 8
W (400-700 nm);
Intensity= 1.9 mWcm-2
About 5% for Benzene; 14% for Toluene; 13% for
Ethylbenzene; 11% for m,p-Xylene and 13% for o-
Xylene
About 41-1.3% for Benzene;
about 85-1% for Toluene;
about 97-13% for
Ethylbenzene; about 97-53%
for m,p-Xylene and
about 95-51% for o-Xylene (in the range
of 0.03 ppm to 3.1 ppm)
Calculated band gap: 3.11-1.73 eV
for S -TiO2
• By increasing the AFR from 0.5 to 6 L/min, the degradation of BTEX decreased, thus, for the lowest AFR, the decomposition efficiency was maximum.
• The degradation efficiency of toluene and benzene exhibited a great dependency on RH and the decomposition efficiency of it increased by decreasing the relative humidity.
• The efficiency of Ethylbenzene and m,p-xylene decomposition exhibited a less dependency on RH and almost equal for both 10-20% and 50-60%. Then the efficiency decreased by increasing the RH to 80-90%.
• The degradation efficiency of BTEX exhibited an increasing trend with decreasing initial concentration because of competitive adsorption between pollutant molecules on the photocatalyst surface.
[65]

60
BTEX (0.1, 0.5, 0.7, and 0.9 ppm)
S-doped TiO2; Support:
Aluminum sheet
S/Ti ratio:
0.2, 0.4, 0.8, and
1.6
T=NA; RH= 45%;
AFR=1, 2, 3, and 4 L/min;
RT= 2, 2.6, 3.9, and 7.8 s;
Lamp: Daylight (8 W);
Intensity= 2.8 mWcm-2
TiO2-AS About 2% for
Benzene; 11% for Toluene; 21% for
Ethylbenzene; and 36% for
Xylene
For S-TiO2-0.8-AS
about 34% for Benzene;
about 78% for Toluene;
about 91% for Ethylbenzene;
and about 94% for
Xylene
3.02 eV for TiO2 and
2.75 eV for S‐TiO2‐0.8‐AS
• The photocatalytic degradation efficiencies of BTEX under visible irradiation enhanced with increasing S/Ti ratios from 0.2 to 0.8, then decreased when the ratio increased to 1.6.
• The photocatalytic degradation efficiencies of all target compounds over S-TiO2-0.8-AS decreased with increasing air flow rate.
• The XRD of both S-TiO2-0.8-AS and TiO2‐AS samples showed an anatase crystal structure with a major band at 2θ= 25.2° and a rutile crystal structure with a major band at 2θ = 27.4°.
• The photocatalytic degradation efficiencies showed an increasing pattern with decreasing initial contaminant concentration.
[101]
BTEX (100 ppb)
N-doped TiO2 and Degussa
P25; Support:
Pyrex
N
T=19-25 ºC; RH=10-20, 50-
60, and 80-90%; AFR=0.5,1.0, and 2.0 L/min;
RT= 22, 11, and 5.5 s; Lamp:
Fluorescent visible light, 8
W (400-700 nm); Intensity= 1.9
mWcm-2
About 14% for Benzene;
17% for Toluene; 16% for
Ethylbenzene; 12% for m,p-Xylene and 17% for o-
xylene
About 24% for Benzene;
about 64% for Toluene;
about 93% for Ethylbenzene; about 96% for
m,p-Xylene and
about 91% for o-Xylene (AFR=0.5
L/min, RH=50-60%)
Calculated band gap: 3.11-1.73 eV
for N -TiO2
• For all three examined flow rates, the PCO degradation efficiency for ethyl benzene and o,m,p-xylenes were higher than that of toluene or benzene.
• The PCO degradation efficiency of all target compounds increased as the flow rate decreased.
• Benzene exhibited the lowest degradation. • Increasing the distance of the catalyst from the light
source led to the decrease in the light intensity in the reactor and caused a drop in the degradation efficiency of the target compounds.
[39]
Toluene (500 ppm)
N-doped TiO2, undoped TiO2,
A-287, PC105,
DegussP25, and PC103;
Support: Pyrex
N N/Ti molar
ratio of 6.6,
7.6 and 9.2
T=NA; RH=60 %;
Lamp: Solar lamp, 300 W
(380-600 nm); Intensity= 1.2×10⁻⁵
Einstein dm-3 s-1
13.7% for T9 (undoped TiO2
at pH=9) 55.8% for A-
287, 47.7% for
PC105, and 56% for P25
79.6% for TN9 (prepared
at pH=9)
Calculated band gap: 3.27-2.07 eV
for N -TiO2
• The reaction kinetics for all synthesized catalyst could be explained as a pseudo-first-order rate equation.
• The N-doped TiO2 (prepared at pH=9 has the fastest kinetics constant which value is k = 6.0×10⁻³ min-1
[24]
Acetaldehyde (600–3650 ppm)
N-doped TiO2; Method: Thermal treatment
N
T=25 ºC; RH=NA;
AFR=1000 mL/min;
88.1% for 600 ppm;
77.3% for 1000 ppm;
100% for 600 ppm;
92.1% for 1000 ppm;
3.16 eV for P25 and
2.91 eV for N-TiO2
• The absorption range of N-doped TiO2 photocatalyst was expanded to the visible range.
[100]

61
Lamp: High pressure Hg lamp, 80 W
(185–580 nm)
66.1% for 1700 ppm; 58.8% for
2200 ppm; and 51.2% for 3650 ppm
87.2% for 1700 ppm; 81.2% for
2200 ppm and 77.6% for 3650 ppm
Toluene (NA)
B-doped TiO2; Support: Pyrex;
Method: Sol- gel
Br: 1, 3, and
5 wt.%
T=70 ºC; RH=NA;
Lamp: UVC (10 W, 254 nm) and
halogen (150 W,400 nm)
92 % About 100% for B-doped
TiO2
Calculated band gap: 3.11 eV for
B-TiO2
• All samples were pure anatase TiO2 after calcination and no phase change happened during the doping process.
• In XRD pattern, the crystallite size reduced with doping B into the TiO2.
• The most characteristic feature of B-doping was that both surface area and pore volume of TiO2 were increased.
• All reactions followed pseudo first- order kinetics.
[23]
Acetaldehyde (600–3650 ppm)
F-doped TiO2; Method:
Impregnation F
T=25 ºC; RH=NA;
AFR=1000 mL/min;
Lamp: High pressure Hg lamp, 80 W
(185–580 nm)
88.1% for 600 ppm;
77.3% for 1000 ppm; 66.1% for 1700 ppm; 58.8% for
2200 ppm and 51.2% for 3650 ppm
97% for 600 ppm;
81% for 1000 ppm;
76% for 1700 ppm;
68% for 2200 ppm and
62% for 3650 ppm
3.16 eV for P25 and
3.09 eV for F-TiO2
• The F-doped TiO2 catalyst exhibited a stronger light absorption in the UV region, but did not have any significant photoactivity in visible range.
• The F-doped TiO2 reduced the recombination process of charge carrier and led to the formation of new active sites.
• The F-doped TiO2 led to increase pollutants adsorption capacity and photocatalytic activity.
• F-doped TiO2 photocatalyst had less specific surface area compared to P25, which it indicates that crystals’ growth was improved.
[100]
T: Temperature
RH: Relative Humidity
AFR: Air Flow Rate
RT: Residence Time
NA: Not Available
Table 6. Summary of the common co-doped TiO2 photocatalyst with their operated photocatalytic conditions and maximum efficiencies.
Contaminant Photocatalyst Dopant Experimental Efficiency Efficiency Band gap Remarks

62
(Concentration) condition before doping
after doping Ref.
Toluene (40 and 133
ppm)
N, C, and S tri-doped
TiO2; Support: dish
The molar ratio of Ti:R 1:0, 1:1,
1:2 and 1:3, (TCNS0,
TCNS1, TCNS2 and TCNS3)
T=25±1 ºC; RH=NA;
Lamp: Xe-lamp, 150 W
Efficiency NA
Rate constant, k (min-1) for
P25= 6.95×10⁻²
Efficiency NA
Rate constant, k (min-1)= 12.8×10⁻²
3.18 eV for TCNS0; 3.0 eV for TCNS1; 2.88 eV for TCNS2
and 2.67 eV for TCNS3
• TCNS1 (R-doped TiO2, R=1, Ti: R=1:1) showed the higher activity under UV-vis light irradiation.
• The rate constant of the pseudo-first-order reaction of TCNS0, TCNS1 under UV-vis light were 5.54×10⁻² min-1 and 12.7×10⁻² min-1
respectively. • The specific surface area of TCNS0 and
TCNS1 were 155.1 and 154.3 m2/g respectively.
[72]
Formaldehyde (200±10 ppm)
N, C, and S tri-doped TiO2
and P25
N, C, and S. The molar ratio of thiourea to
TiO2 was 0, 1, 2, 3 and 6
T= Ambient temperature;
RH=NA; Lamp: daylight
(420 nm); Intensity= 0.46 ± 0.01 mWcm-2
2% for undoped TiO2 and
5% for P25
32.6% for N, C, and S-
doped TiO2-3
3.0 eV for P25; 3.2 eV for TiO2;
2.8 eV for N-C,S-TiO2-1;
2.5 eV for N-C,S-TiO2-2;
2.4 eV for N-C,S-TiO2-3 and
2.2 eV for N-C,S-TiO2-6
• The tri-doped catalysts could be activated by visible light and more photogenerated charge carriers can be generated and participate in the photocatalytic reactions.
• The C, N, S tri-doped TiO2 catalyst caused band gap narrowing and reduced the recombination of photo-generated charge carriers and thus enhanced photocatalytic activity.
[104]
Acetaldehyde (600–3650 ppm)
F and N co-doped;
Method: Sol-gel
F and N
T=25 ºC; RH=NA;
AFR=1000 mL/min;
Lamp: High-pressure Hg lamp, 80 W
(185–580 nm)
88.1% for 600 ppm; 77.3% for 1000 ppm; 66.1% for 1700 ppm; 58.8% for 2200 ppm
and 51.2% for 3650 ppm
100% for 600 ppm;
98.2% for 1000 ppm; 94.1% for 1700 ppm; 87.1% for
2200 ppm and 80.7% for 3650 ppm
3.16 eV for P25 and 2.86 eV for F-N-
TiO2
• The absorption ranges of F and N co-doped TiO2 photocatalysts was extended to the visible light.
• The F and N co-doped TiO2 catalyst had demonstrated the highest photocatalytic activity than other catalysts.
• Doping both N and F ions caused synergy effects such a narrowing band gap, formation of new active sites and enhancement of photoactivity.
• By increasing the initial contaminant concentration in the gas phase, the number of the available active sites of the catalyst became less than the amount of the pollutants.
• The F and N co-doped TiO2 photocatalyst had less specific surface area compared to P25, which it indicates that crystals’ growth was improved.
[100]

63
Hexane and Butyl acetate
(100 ppm each) and their mixture
Ag and V co-doped TiO2;
Support: polyurethane
Ag and V (0-6 wt.%)
T=NA; RH=50 %; AFR=100 mL/min; RT= 72s;
Lamps: Two white light
lamps, 20 W (400<λ<700); Intensity= 50
mWcm-2
NA
Individual: 93.7% for
Hexane and 95.5% for
Butyl acetate
In mixture: 75% for Butyl acetate and 48 % for Hexane
3.20 eV for TiO2/PU; 3.02 eV for 6Ag/0V-
TiO2/PU; 2.91 eV for 5Ag/1V-
TiO2/PU; 2.86 eV for 4Ag/2V-
TiO2/PU; 2.79 eV for 3Ag/3V-
TiO2/PU; 2.77 eV for 2Ag/4V-
TiO2/PU; 2.81 eV for 1Ag/5V-
TiO2/PU and 2.83 eV for 0Ag/6V-
TiO2/PU
• The optimum catalyst (4Ag/2V-TiO2/PU) had combination weight ratios of 4wt% Ag/TiO2 and 2wt% V/TiO2 led to the highest BET surface area of 230.5 (m2/g).
• The surface area of the co-doped photocatalyst was also higher than that of the undoped and single-dopant photocatalysts.
• Due to the high polarity of butyl acetate, higher amount of butyl acetate was adsorbed on the surface of 4Ag/2V-TiO2/PU than hexane.
[108]
Acetone (NA)
C and Mo co-doped TiO2
and undoped TiO2 (Degussa
P25); Support: dish
Mo: 2 at. % and C: 1 at. %
T=NA; RH=NA;
Lamp: UV lamp, 125 W
and glass filter to produce
visible light
53% 76.5% Calculated band gap: 2.96 eV for C, Mo-
TiO2
• Doping a small amount of C had no obvious effect on the crystalline size, while, the crystalline size of the Mo-doped and co-doped samples were smaller than that of the undoped one.
• C and Mo enhanced both the absorption ability of visible light and promoted the separation of photogenerated charge carriers.
• The surface area and pore size of C, Mo co-doping TiO2 significantly increase compared with those for P25.
[138]
Toluene (39.8 and
132.68 ppm)
Fe and N co-doped TiO2
Fe: 0, 0.005, 0.02, 0.05, 0.1, 0.5,
1.0 and 2.0 wt.%
T=25±1 ºC; RH= 60%;
Lamp: Xe-lamp, 150 W
63% Around 97% Calculated band gap:
2.92 eV for Fe, N-TiO2
• The optimum concentration of Fe ions was 0.02wt.% for the maximum photodegradation of toluene.
• The Fe, N co-doped TiO2 catalyst demonstrated about three times higher photoactivity than that of N–TiO2 nanocrystals.
• The reused Fe/N–TiO2 photocatalyst did not demonstrate an apparent change in photocatalytic activity.
[120]
Toluene (NA)
B and Fe co-doped TiO2; Method: Sol-
gel
B: 3 wt.% Fe: 0, 0.5, 1, 3,
and 5 wt.%
T=70 ºC; RH=NA;
Lamps: UVC (10 W, 254 nm)
and halogen
Under Visible
light About
8.8% (after
Under Visible light:
About 87.9% (after 180
min)
Calculated band gap: 3.11-2.07 eV for B,
Fe-TiO2
• All samples were pure anatase TiO2 after calcination and no phase change happened during the co-doping process.
• In XRD pattern, the crystallite size reduced with
[23]

64
lamp (150, 400 nm);
Visible light emitting flux:
3.9×10⁻⁶ Einstein/s
and UV light emitting flux:
1.47×10⁻⁶ Einstein/s
180 min) doping B and Fe ions into the TiO2 and the decrease of crystallite size was more result of B-doping than with Fe-doping.
• All reactions follow pseudo first- order kinetics rate.
Toluene (800 ppmv)
S and Fe co-doped TiO2;
Support: Pyrex
Fe: 1.5% S/Ti molar
ration: 1% to 20%
T=Room temperature; RH=75%; AFR= 100 mL/min;
Lamps: UVA and simulating
sunlight, 6W for both
Efficiency NA
Reaction rate for
P25 (mol/s.m2): 3.87634×
10-10
Efficiency NA
Reaction rate for S, Fe co-doped TiO2 (mol/s.m2):
4.77957× 10⁻¹⁰
NA
• The S, Fe co-doped TiO2 catalyst has improved photoactivity compared to the single-doped Fe-TiO2 and P25 under both sunlight and UV-light irradiation.
• The XRD patterns of both S, Fe co-doped, and S-doped TiO2 were included 100% anatase crystal phase.
• In the S, Fe co-doped TiO2 catalysts, adding the S content led to a gradual increase of the BET surface area value and pore size.
• All S, Fe co-doped TiO2 catalysts showed great absorption in the visible light compared to the S-doped TiO2 catalysts.
• Generated by-product was benzaldehyde.
[87]
T: Temperature
RH: Relative Humidity
AFR: Air Flow Rate
RT: Residence Time
NA: Not Available
Table 7. Summary of the common semiconductor coupled TiO2 photocatalyst with their operated photocatalytic conditions and maximum efficiencies.
Contaminant (Concentration)
Photocatalyst Dopant Experimental
condition
Efficiency before doping
Efficiency after doping
Band gap Remarks
Ref.
Propylene (NA)
MnCO3 -TiO2 and P25;
Support: glass plate
MnCO3/TiO2 ratios: 1:10,
1.5:10, and 2:10
T=NA; RH=NA;
RT=8 min; AFR=200
mL/h;
0% for MnCO3, and 7% for P25
70%
Calculated band gap: 2.96 eV for
MnCO3 -TiO2
• MnCO3-TiO2 (2:10) exhibited the highest activity for degradation of propylene.
• The majority of MnCO3 was nanoparticle (NP) with an average size of 4–5nm.
• Comparing with P25 and MnCO3, MnCO3-TiO2
[139]

65
Lamp: Xenon lamp,500 W (λ≥420 nm); Intensity= 25
mWcm-2
represented high absorption in visible light, especially in 400–500 nm region.
Hexane and Isopropyl alcohol
(0.1 ppm for each)
N doped TiO2-WO3
N/WO3/TiO2 composition
s: 2.5/0.5/100, 2.5/1.0/100, 2.5/2.0/100, 2.5/4.0/100,
and 2.5/6.0/100
T=NA; RH=45%;
AFR=0.1, 0.5, and 1 L/min;
RT= 1.3, 0.26, and 0.13 min; Lamp: 8 W, 400-720 nm;
Intensity= 0.48 mWcm-2
4% for Hexane
WO3-N-TiO2-4
43.4(±1.1)% for pure
Hexane, and 72.7(±1.6)% for pure IPA
In mixture:
34.2(±1.5)% for Hexane
and 72.6(±1.7)%
for IPA
3.17 eV for TiO2; 3.08 eV for N–
TiO2; 2.91 eV for
WO3–N–TiO2-0.5;
2.83 eV for WO3–N–TiO2-1;
2.80 eV for WO3–N–TiO2-2;
2.78 eV for WO3–N–TiO2-4
and 2.75 eV for
WO3–N– TiO2-6
• The photocatalytic degradation efficiency of the WO3–N–TNS catalysts enhanced by increasing in WO3 loading from 0.5% to 4.0%, while, a further increase in the WO3 loading to 6.0% resulted decreasing in photocatalytic efficiency.
• The deposition of WOx species on the TiO2 surface provided a higher surface area, however, the excess amount of WO3 caused partial blockage the TiO2 pores and led to the lower surface area.
• The photocatalytic degradation efficiency for pure IPA was higher than that for pure hexane.
• The photocatalytic degradation efficiency for hexane mixed with IPA, was lower than that for pure hexane, while the IPA decomposition efficiency remained relatively constant.
[106]
Toluene (NA)
Pt-SnO2-R/TiO2-
A/TiO2 and Titania
nanotubes (TNT)
Sn/Ti ratio: 2(S1), 6(S2),
10(S3), 15(S4) at. % and P1 was S3 doped with Pt (1
wt.%)
NA
Efficiency NA
CO2
production rate: 20.43
ppm/h
Efficiency NA
CO2
production rate: 113.81
ppm/h
3.13 eV for Pt-SnO2-TiO2
• The anatase phase was observed in all photocatalysts. However, the rutile and SnO2 appeared just for S3, S4, and P1 catalysts.
• The specific surface area was in the order S0 < S3 < P1, demonstrating that the number of mesoporous structures existing in the photocatalysts increased the specific surface area.
• S3 and P1 demonstrated larger pore volumes, pore diameters, more active site and better adsorption than TNT.
• By increasing the Sn/Ti ratio to 10 at. % the photocatalytic efficiency was enhanced. However, by more increasing from 10 to 15 at.% the efficiency was decreased.
[22]
Toluene (177 ppm)
xNi- TiO2-SnO2;
Method: Sol-gel and wet-impregnation
x=0.1, 0.3, and 0.5 wt% SnO2: 1 wt%
T=70 ºC; RH=NA; AFR=320 cm3/min;
Lamp: Halogen
5.7% 51% Calculated band gap: 3.11 eV for Ni-SnO2-TiO2
• All reactions for all different catalysts followed pseudo first-order kinetics as the rate of reaction for certain amount of catalyst depends only on toluene concentration.
• The rate constant for 0.3 wt% Ni–TiO2–SnO2 had the
[21]

66
lamp, 150W; Visible light emitting flux:
3.9×10⁻⁶ Einstein s-1
highest value (0.0058 min−1) among the tested catalysts.
• xNi-doped TiO2 was active in visible light while a composite of SnO2 onto the TiO2 surface further increase the efficiency of these catalysts.
• The Ni-doped TiO2 nanoparticles host SnO2 on their surface caused to reduce the recombination rate.
• TiO2 and TiO2–SnO2 catalyst were inactive under visible light irradiations
Toluene (7 ppm)
SiO2 doped TiO2;
Method: Sol-gel
Si/Ti molar ratio of
1:100, 5:100, 10:100,
15:100, and 20:100
T=NA; Humidity=1.6
g/m3; Lamp: UVA
mercury lamp, 300 W (365 nm)
69.6% for undoped TiO2 and 70.5% for
P25
90.6% NA
• The 10% SiO2 doped TiO2 fibrous catalyst calcined at 400 ºC had the highest degradation rate compared to the other catalysts.
• Based on the results 400ºC was selected as the optimum temperature to remove organic compounds.
• The surface area for SiO2 doped TiO2 ratio at 10% was 266 m2/g.
[37]
Benzene (280 ppm)
Ag3VO4 -TiO2 And pure TiO2
(TiO2 at cal. Temp:500 ºC);
Method: Hydrothermal
mass fraction of Ag3VO4 in
nanocomposites was 0.1, 0.5, 1, 2, and
5 %,
T=30±1 ºC; RH=NA; AFR= 20 cm3/min;
Lamps: Xe-arc lamp, 500 W (450<λ<900),
and Xe-arc lamp, 500 W
(λ<450)
Under visible light:
8.9%
Under solar light: 43%
Under visible light:
40%
Under solar light: 94.5%
Calculated band gap: 2.76 eV for Ag3VO4-TiO2
• By increasing the amount of Ag3VO4 in Ag3VO4/TiO2 nanocomposites, the anatase phase was increased.
• 0.5% Ag3VO4 in nanocomposites catalyst presented optimum activity for benzene degradation under visible light irradiation.
• The absorption edge and band gap of Ag3VO4 were estimated to be 560 nm and 2.2 eV.
• By increasing the amount of Ag3VO4 till 2% the BET specific surface area of Ag3VO4/TiO2 increased, and more increasing of that resulted in decreasing of the surface area.
• The specific surface area for 0.5% Ag3VO4/TiO2 nanocomposites and TiO2 were determined to be 48.98 and 28.24 m2g−1, respectively.
[36]
Benzene (NA)
CdS-TiO2; Support: fiber
glass; Method: Sol-
gel
Cd/Ti: 5.65, 7.93, 9.20, and 22.5 %
T=NA;
RH=NA; Lamp: High-
pressure mercury, 160 W
55.4% for TiO2/FGC
92.8% for 5.65%-CdS / TiO2-FGC under UV-
vis and and 32.7% for 5.65%-CdS / TiO2-FGC under
Calculated band gap: 3.11 eV for
CdS-TiO2
• By increasing the CdS amount, the photocatalytic activity of catalysts initially increased and then showed a downward trend.
• All the catalysts with different amount of CdS under visible light irradiation showed greater photocatalytic activities than TiO2-FGC.
• The recombination rate of charge carriers in CdS-TiO2 composite was effectively decreased.
[140]

67
visible
Benzene (31.3-62.6 ppb)
and Toluene (26.54-53.07
ppb)
TiO2 composite
ZnO
50% TiO2 and 50%
ZnO
T=NA; RH=NA;
AFR=0.42 -
2.54 L/min;
RT=5–30 min; Lamp: UVA
(365-400 nm); Intensity= 0.4,
0.6, and 1 mWcm-2
NA
93% of Toluene
and 78% of Benzene
Calculated band gap: 3.11 eV for
ZnO-TiO2
• The toluene and benzene degradation enhanced with increase UV light intensity in a different amount of catalyst and times.
• The removal efficiency of benzene was less than that of toluene.
• Toluene & benzene removal on TiO2/ZnO catalyst under UV light followed by first-order kinetic reactions rate.
[141]
Benzene, Toluene,
o, m and p-Xylene (BTX)
(NA)
N doped TiO2-Nb2O5
composite; Method: Sol-
gel
N: 0.49 at.% TiO2: 50
wt.% Nb2O5:50
wt.%
T=25±2 ºC; RH=NA;
Lamp: White LED (16 W)
and Black (46 W)
78.5% for TiO2 (UVA)
19% for TiO2 (Vis)
p-Xylene: 97.5% for N-
TiO2, 84.6% for N- TiO2/Nb2O5
(UVA)
62% for N-TiO2,
56% for N- TiO2/Nb2O5
(Vis)
3.18 eV for TiO2-500 ºC;
2.78 eV for N-TiO2-500 ºC; 3.28 eV for
TiO2-Nb2O5 -500 ºC and
3.02 eV for N- TiO2-Nb2O5 -500
ºC
• The photo-oxidation reactions were followed pseudo first-order kinetics.
• The N–Ti calcined at 500 ºC had the highest efficiency under UVA and visible light, with an apparent reaction rate constant of 0.0243 and 0.0076 min−1, respectively.
• According to results, the heterojunction of TiO2 and Nb2O5 was not effective for the photocatalytic performance.
• The anatase phase was detected in the TiO2-Nb2O5 mixed catalysts.
• Results showed that all the efficiencies of N-doped catalysts were better than its undoped TiO2 catalyst.
[25]
Benzene, Toluene, and
Xylenes (BTX) (100 ppm each)
N doped ZnO-TiO2
composite; Method: Sol-
gel
50 wt% of ZnO and 50 wt% of TiO2
T=25 ºC; RH=NA;
Lamp: white LED, 16 W (439.8 nm);
NA
86% for Benzene, 87% for
Toluene, and 86% for Xylene
NA eV for TiO2 3.36 eV for ZnO-TiO2-500 ºC and 2.88 eV for N-
ZnO-TiO2-500 ºC
• Doped photocatalysts exhibited higher specific surface area.
• The presence of nitrogen led to control nucleation and growth of crystallites, as well as the formation of a well-order porous structure.
• The N-doped TiO2 had visible light absorption due to the interstitial doping.
• The N-TiO2-ZnO composite caused to photosensitize ZnO in visible wavelength region and reduce recombination rate of charge carriers.
• The highest efficiency was achieved by N-TiO2-ZnO calcined at 500 ºC.
[105]
T: Temperature
RH: Relative Humidity
AFR: Air Flow Rate
RT: Residence Time

68
NA: Not Available