time–temperature–transformation (ttt) diagram …...the ttt diagram of caustic calcined magnesia...
TRANSCRIPT
TIME–TEMPERATURE–TRANSFORMATION (TTT) DIAGRAM OF CAUSTIC CALCINED
MAGNESIA
*K. Ebrahimi-Nasrabadi Ferdowsi University of Mashhad,
Faculty of Sciences, Department of Geology,
Mashhad, Iran.
(*Corresponding author: [email protected])
M. Barati
University of Toronto
184 College Street
Toronto, Canada, M5S 3E4
P.W. Scott
Camborne School of Mines
University of Exeter
United Kingdom

TIME–TEMPERATURE–TRANSFORMATION (TTT) DIAGRAM OF CAUSTIC CALCINED
MAGNESIA
ABSTRACT
The dependence between the extent of conversion of cryptocrystalline magnesite to caustic
magnesia was studied experimentally in the temperature range of 400–1200 °C and for calcination times up to 8 h. A TGA–DTA analysis showed that decomposition begins at temperatures as low as 340 °C and is completed at 600 °C. Measurements of specific surface area (SSA), iodine adsorption number (IN), crystallite size, and loss on ignition were carried out to characterize the product quality. It was found that while all the parameters are dependent on the extent of calcination, densification of the product caused by grain coarsening affects their final values. As a consequence, SSA and IN went through a maximum with time. The study showed that high quality caustic calcined magnesia can be produced in a narrow range of temperature (600–650 °C) and time (1–4 h). Medium quality caustic calcined magnesia can be made within a wider range of parameters.
KEYWORDS
Caustic calcined magnesia, Time-temperature-transformation (TTT), Magnesia quality
INTRODUCTION
Magnesia (MgO) is primarily produced by calcination of natural magnesite (MgCO3) where
physical properties of the final magnesia are determined by the calcination conditions. Depending on the thermal conditions, caustic calcined magnesia or dead burned magnesia is obtained (Wang et al., 2012). The latter is produced by calcination in temperatures exceeding 1600 °C, giving the material an exceptional resistance to hydration, hence suitable for manufacture of refractory. In contrast, light burned reactive magnesia (caustic calcined magnesia), also known commonly as Causter is comparatively a more porous and reactive material, with a high specific surface area (SSA). Caustic magnesia is obtained at relatively low temperature (500-1000 °C) and has numerous applications from chemical, paper, cattle feed, and pharmaceutical to environmental control, agriculture, and special grade cement (Birchal et al., 2000; Strydom et al., 2005). The important physical properties of caustic calcined magnesia are crystallite size (CS) and SSA. For highly reactive magnesia large SSA and small CS are desired.
The rate and extent of hydration are factors affecting the functional performance of both types of
magnesia. The hydration of refractory grade magnesia, for instance, should be reduced in order to prevent the degradation of the refractory brick. For other application, increasing the reactivity is often favored. This may be achieved by controlling the thermal treatment process for an optimum CS, porosity, and SSA (Ebrahimi-Nasrabadi, 1990). The main objective of this work was to establish a time-temperature-transformation (TTT) diagram for caustic calcined magnesia by decomposing natural cryptocrystalline magnesite over a range of temperatures and times of calcination, and characterizing the products. This is aimed to yield the calcination conditions for producing high quality magnesia.
MATERIALS AND METHODS
The study was carried out using nearly pure natural cryptocrstalline magnesites. Several samples
were mixed and crushed together to provide sufficient mass that is representative of the deposit. The major
impurities present in these samples were: CaO: 0.80–1.96, SiO2: 0.12–0.77, Fe2O3 :< 0.05, and Al2O3: 0.1–0.22 wt% based on X-ray fluorescence spectrometry analysis.
The materials were crushed into 2–5 mm particles, that is similar to those used in commercial
calcination condition. 30 g of crushed samples were weighed and held at the calcination temperatures in the range of 500–1200 °C, with 100 °C intervals in a lab-scale electric kiln. The calcination times were ¼, 1/2 , 1, 2, 4 and 8 h. For each combination of calcination temperature and time, the product was characterized with respect to microstructure, physical properties, and phase transformation.
X-ray diffraction analysis (XRD) was performed using a Phillips diffractometer operating at 40
kV and 30 mA with CuKα radiation from 10–84° 2θ. The analysis was carried out to determine the mineralogical composition of the samples after calcination to establish the TTT diagram.
Crystallite size was determined by Scherer method using TOPAS 2.0 with correction for line
broadening. Measurements were confined to the strongest (200) periclase line in the X-Ray patterns (Mansour 1978). SSA was determined through BET technique involving nitrogen adsorption on the product samples, using a Strohlein Area-meter II, surface area chemisorptions analyser. The iodine adsorption number (IN) was also measured, that provides an indirect measure of the SSA by adsorption of iodine to the sample from carbon tetrachloride solution (Cesar et al., 2003).
DTA-TGA was performed on a few grams of natural magnesite samples using a SDT 2960
simultaneous differential thermal analyser. The experiments were conducted under air flow (20 mL/min) and at a heating rate of 8 °C/min, from ambient to 1000 °C. Sintered α–Al2O3 powder was the thermally inert reference material used. Calcined magnesia materials were analysed to determine the decomposition temperature of magnesite. The residual CO2 content of the product was determined through the loss on ignition test (Mekhemer et al., 2004; Aslani et al., 2010).
RESULTS AND DISCUSSION
Decomposition of magnesite
The DTA diagram of the cryptocrystallite magnesite is presented in Figure 1. The endothermic decomposition starts at approximately 340 °C and is almost complete at 620 °C. The greatest decomposition rate corresponds to a temperature between approximately 550 and 600 °C, peaking at 594 °C. The range is below those published earlier (Webb & Heyster, 1957) that showed a decomposition temperature of 660–710 °C. The free energy of decomposition of MgCO3 (Gaskell, 1981) shows that theoretically, the reaction can take place at temperatures above 418 °C if the atmosphere is CO2 at 1 atm. Diluting the DTA gases will result in lower temperatures. The actual decomposition temperature will therefore depend on the DTA atmosphere, as well as heating rate and impurities present in the material. The differences between the decomposition temperatures observed may therefore be related to these factors. Such differences are common, for example, Soltan et al. (2011) have reported a decomposition temperature of 780 °C for limestone, whereas Maitra et al. (2005) have reported temperatures in the range of 900–960 °C for decomposition of CaCO3 that has been generated from calcination. These observations confirm the effect of chemical composition and temperature history on the characteristic calcination temperatures.

Figure 1 – DTA spectrum for heating of crptocrystalline magnesite at 8 °C/min
Mineralogical composition and crystalline size
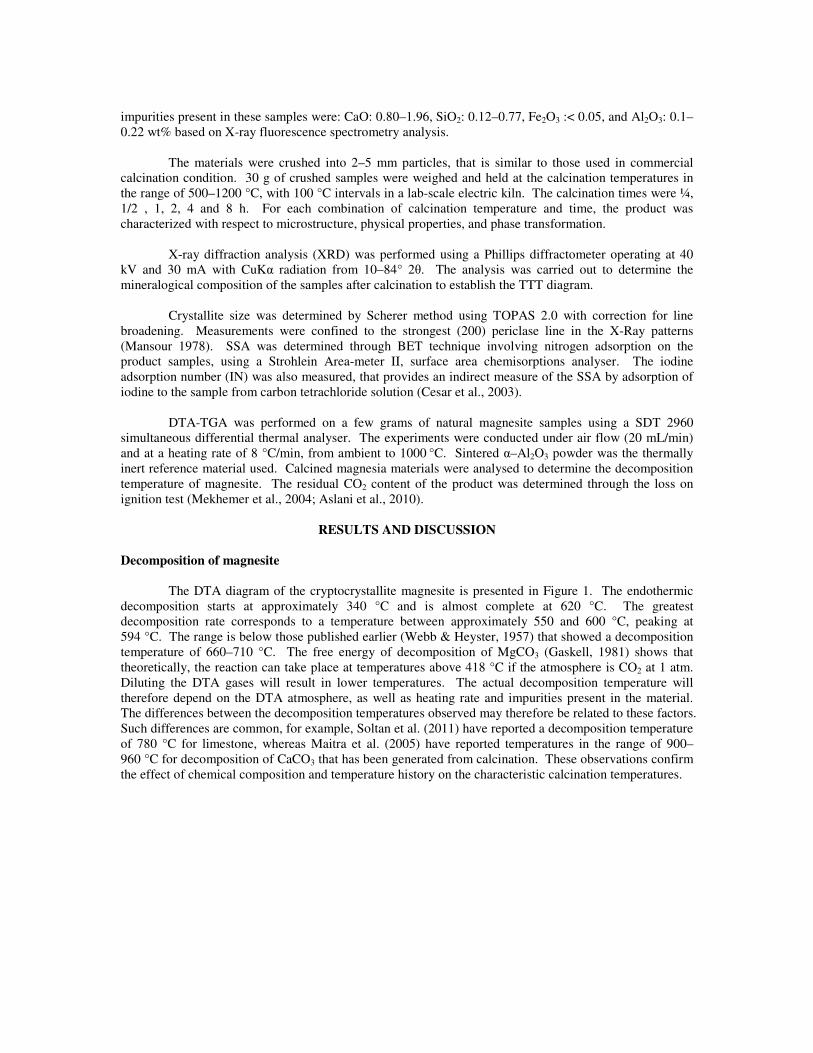
X-ray diffraction was used to study the transformation of magnesite (MgCO3) to periclase (MgO), and also obtain the CS of periclase. The TTT diagram of caustic calcined magnesia was established based on the XRD patterns, by determining when at a given temperature, magnesite peaks disappear and periclase prominent peaks emerge (Figure 2). In this diagram, Curve A represents the initiation of reaction, where periclase appears in the X-ray patter, and Curve B shows the time and temperature at which the transformation of magnesite to periclase is complete. Based on the XRD analysis, magnesite is absent beyond Curve B, where the dominant phase is periclase. Compared to dead–burned magnesia with virtually zero LOI, this product has an LOI up to 10%. The area between these two curves represents the transitional stage where both magnesite and periclase co–exist. As it can be seen from Figure 2, at the lower calcination temperatures the phase transformation is taking place at a slower rate. For example, at 600 °C the transformation starts in less than 15 min and is completed within 2 h. At 800 °C, on the other hand, the decomposition is completed in less than 30 min, while at 500 °C calcination longer than 8 h is required (Figure 2).
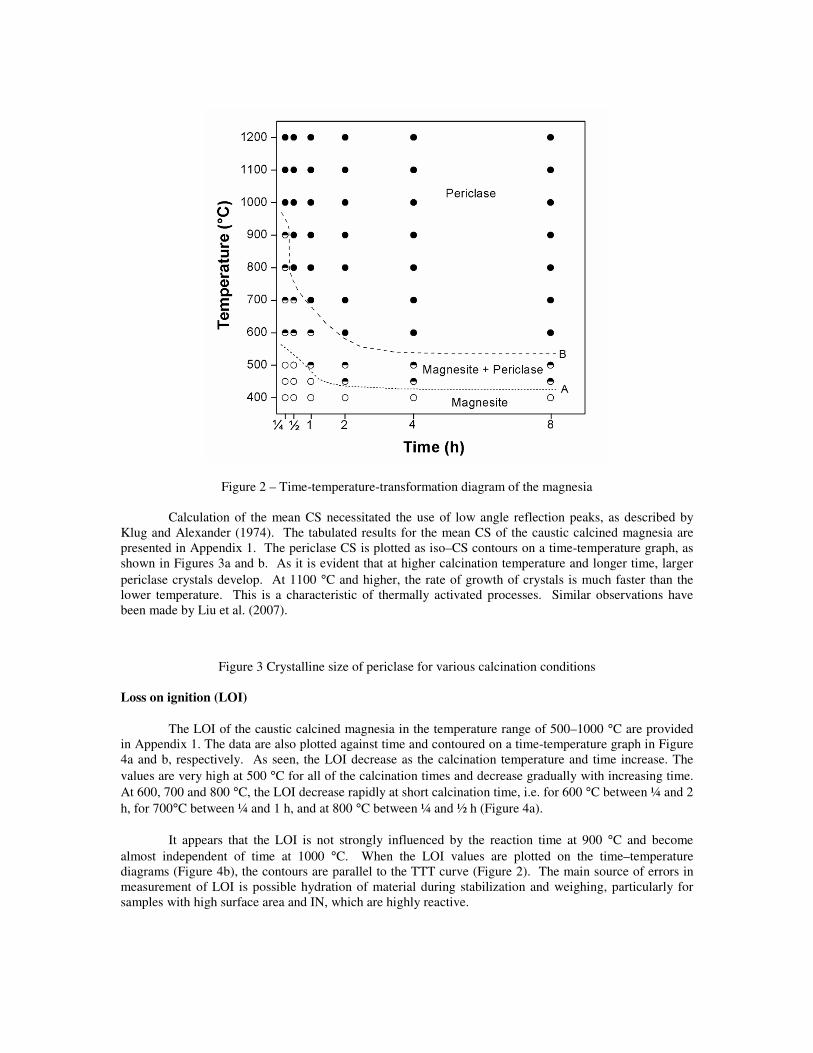
Figure 2 – Time-temperature-transformation diagram of the magnesia
Calculation of the mean CS necessitated the use of low angle reflection peaks, as described by Klug and Alexander (1974). The tabulated results for the mean CS of the caustic calcined magnesia are presented in Appendix 1. The periclase CS is plotted as iso–CS contours on a time-temperature graph, as shown in Figures 3a and b. As it is evident that at higher calcination temperature and longer time, larger periclase crystals develop. At 1100 °C and higher, the rate of growth of crystals is much faster than the lower temperature. This is a characteristic of thermally activated processes. Similar observations have been made by Liu et al. (2007).
Figure 3 Crystalline size of periclase for various calcination conditions
Loss on ignition (LOI)
The LOI of the caustic calcined magnesia in the temperature range of 500–1000 °C are provided in Appendix 1. The data are also plotted against time and contoured on a time-temperature graph in Figure 4a and b, respectively. As seen, the LOI decrease as the calcination temperature and time increase. The values are very high at 500 °C for all of the calcination times and decrease gradually with increasing time. At 600, 700 and 800 °C, the LOI decrease rapidly at short calcination time, i.e. for 600 °C between ¼ and 2 h, for 700°C between ¼ and 1 h, and at 800 °C between ¼ and ½ h (Figure 4a).
It appears that the LOI is not strongly influenced by the reaction time at 900 °C and become
almost independent of time at 1000 °C. When the LOI values are plotted on the time–temperature diagrams (Figure 4b), the contours are parallel to the TTT curve (Figure 2). The main source of errors in measurement of LOI is possible hydration of material during stabilization and weighing, particularly for samples with high surface area and IN, which are highly reactive.

Figure 4 – Loss on ignition (LOI) against calcination time and temperature
Specific surface area (SSA)
One of the most significant physical properties of caustic calcined magnesia is its SSA; the higher the SSA, the greater the reactivity (e.g., rate of hydration). Under ideal conditions of calcination due to the release of carbon dioxide, a high SSA can be developed in the porous periclase. As it can be seen in Figure 5a, b and Appendix 1, with increasing the temperature of calcination, the CS becomes larger, and as a result the internal pores become smaller and a dense product with low surface area will result. Increasing the calcination temperatures for a longer time causes grain growth, decrease in SSA and loss of reactivity.
The SSA values are plotted against time, and are contoured on a time-temperature graph, Figures
5a and b, respectively. As seen, for lower calcination temperature such as 600 °C and 700 °C, the SSA goes through a maximum with increasing the calcination time. This is clearly a result of two competing processes, decomposition of magnesite, and crystal growth. For 500 °C, the SSA continues to increase with time, because of insufficient calcination time (maximum 8 h in this study) and slow crystallite growth. On the other hand, for 800 °C and higher temperature the SSA begins to drop from the first measurement at ¼ h, indicating that the substantial calcination has already occurred before this time. The highest SSA is obtained for a sample calcined at 600 °C for 2 h (93.07 m2/g), corresponding to a significant residual loss of 5–10%.
When the SSA values are plotted against time-temperature (Figure 5b), the contours are nearly
parallel to those on the TTT diagram (Figure 2).

Figure 5 – Specific surface area as a function of calcination time and temperature. Iodine adsorption number (IN)
The IN is the amount of iodine in mg adsorbed per gram of periclase (MgO). The results of IN of caustic calcined magnesia are given in Appendix 1, also plotted as iso–IN contours on a time-temperature graph, (Figures 6a, b). The IN curves and contours are similar in shape to the SSA measurement. However, the errors in this method are higher. This is expected since higher temperature and longer time of calcination decrease SSA, which in turn reduces the IN (Figures 6b and 2).
Figure 6 – Iodine adsorption number (IN) as a function of calcination time and temperature
Microstructure
The microstructural study of caustic calcined magnesia was carried out using a LEO 1450 SEM. Figure 7 is a selection of SEM micrographs, showing the transformation of magnesite to periclase at different calcination temperatures (500–1200 °C) and times (¼–8 h). Perfectly rhombohedral magnesite crystals are visible at milder calcination conditions e.g., at 500 °C for ¼ h (Figure 7a).
As the calcination temperature and time increase, the magnesite crystals first start losing their
rhombohedral shape and slowly transfer to cubic periclase crystals. The remaining pseudorhombohedral shape of magnesite crystals were recognised up to 700 °C (Figure 7f). The results are consistent with the TTT study, indicating that a mixture of magnesite and periclase grains remain in material calcined up to 800
°C for ¼ h, but at higher temperatures or for longer calcination times pseudorhombohedral magnesite crystals completely disappear and periclase crystals start to develop (Figure 7g). At 1200 °C, the sintering of magnesia grains is observed clearly.

Figure 7 – SEM micrographs of calcination products
Practical significance
The inter-relationships between SSA, IN, LOI, and CS are presented in Figure 8. As expected, the SSA and IN follow a linear relationship (Figure 8a), indicating that both parameters are related to the exposed surface area of the material. The relationship between SSA and LOI depends on the degree of calcination (Figure 8b). At values of LOI greater than ~ 15%, an inverse relationship exists between the two. This is attributed to grain coarsening of magnesia, as higher LOI is obtained for samples with large calcination extent (i.e. higher temperature and/or longer time), which correspond to the conditions suitable

for crystallite growth. At LOI lower than 10%, the dependence of SSA on LOI becomes direct, confirming that within this domain, both parameters are dominantly controlled by loss of CO2, with little grain coarsening.
Figure 8c exhibits the relationship between SSA and CS. As seen, the SSA first drops sharply
with an increase in the CS. The dependence becomes weaker as the CS values exceed approximately 1000 Å. This is the typical characteristic of the materials that undergo sintering, since the SSA has an inverse relationship with CS.
Figure 8 – Relationship between characteristics of calcined magnesia
The high quality caustic calcined magnesia is a highly reactive product having SSA > 70 m2/g (Kimyongar & Scott, 1986; Birchal et al., 2000; Liu et al., 2007). Based on the relationships provided in Figure 8, these correspond to LOI < 10% and CS < 230 Å. The conditions yielding such product are identified by a small closed region on the time–temperature diagram, Figure 9. The narrow range of conditions for producing high quality magnesia points to difficult production of the material in commercial scale. This will require precise control of the calcination temperature and processing time.
Medium quality caustic calcined magnesia is characterized by a product possessing SSA of 30–70
m2/g. The material can be made within a wider range of conditions, represented by a band that is widened for lower temperatures. For example, a medium quality product can be made rapidly within 30 min of burning between 800 and 1000 °C. Formation of this grade of magnesia is largely independent of time in the range of 2–8 h of burning, temperature being the most important factor. Increase of calcination temperature beyond 800
°C is likely to lead to rapid deterioration of SSA, hence loss in the quality. The quality of the product is to a large extent influenced by the characteristics of the mineral.
High impurity level, for example, leads to grain coarsening at relatively low temperatures, which in turn

results in low SSA and poor quality. It is thus critical to evaluate each mineral deposition and tailor the processing conditions to achieve the product quality requirements.
Figure 9 – Time-Temperature regions with high quality (LOI < 10%, SSA > 70 m2/g, CS < 230 Å) and medium quality (LOI < 5%, SSA > 30m2/g, CS < 500 Å) caustic calcined magnesia
CONCLUSIONS
Complete calcination of magnesite could be achieved in temperatures > 700 °C in less than 1 h. 1. SSA showed to be a strong function of calcination time and temperature, and is affected by
two competing phenomena, porosity formation due to calcination and densification because of crystallite growth
2. Magnesite decomposition takes place between 340–620 °C, with the maximum rate taking place between approximately 550 and 600 °C.
3. High quality caustic magnesia with SSA > 70 m2/g could be produced in a relatively narrow range of conditions, temperature between 600 and 650 °C and calcination time of 1–4 h.
4. Medium quality products can be made within a broader conditions, temperature range of 650–800 °C and calcination time of ¼ to 8 h, depending on the temperature.
ACKNOWLEDGMENTS
K. Ebrahimi Nasrabadi would like to dedicate this work to the memory of Prof. A.C Dunham whose contributions to this project were elemental. He would also like to thank Mr. A.R. Bagheri the Managing Director of Iranian Refractory, Procurement & Production Company for their financial support and Dr. M. Khanehbad and Ms. S. Gholami from Ferdowsi University of Mashhad for their technical help.
REFERENCES
Aslani, S, Samim Bani Hashemi, H. R., & Arianpour, F. (2010). Beneficiation of Iranian magnesite ores by
inverse flotation process and its effects on shaped and unshaped refractories properties. Bulletin of
Materials Science, 33, 697–705. Birchal, V. S. S., Rocha, S. D. F, & Ciminelli, V. S. T. (2000). The effect of magnesite calcinations on
magnesia hydration, Mineral Engineering, 13, 1629–1633. Cesar, M. G. M. M, Vansconcelos, D. C. L, and Vasconcelos, W.L, (2002). Microstructure characterization
of magnesias derived from different source and their influence on the structure of ceramic films formed on a 3% silicon steel surface. Journal of Material Science, 37, 2323–2329.
Ebrahimi-Nasrabadi, K. (1995). The industrial mineralogy of magnesite and Huntite from eastern Iran
(Doctoral dissertation), University of Hull, UK, 504. Gaskell, D. R. (1981). Introduction to Metallurgical Thermodynamics, 2nd Edition, McGraw-Hill, NY. Kimyongar, K. and Scott, P.W. (1986). Calcined natural magnesite- influence of time and temperature on
the transformation and resulting industrial properties, Materials Science Forum, 7, 83–90. Klug, H. P., & Alexander, L. E. (1974). X-ray Diffraction Procedures 2nd ed., New York: John Wiley and
Sons, pp. 142–166 and 618–708. Liu, B., Thomas, A. S., Ray, A. S., & Guerbois, J .P. (2007). A TG analysis of the effect of calcination
conditions on the properties of reactive magnesia, Journal of Thermal Analysis and Calorimetry,
88, 145-149. Maitra, S, Choudhury, A, Das, H. S, & Pramanik, M. S. J. (2005). Effect of compaction on the kinetics of
thermal decomposition of dolomite under non-isothermal condition, Journal of Materials Science,
40, 4749–4751. Mansour, N.A.L. (1978), Variation of some physical properties with calcination and annealing temperature
of magnesia obtained by thermal decomposition of basic magnesium carbonate, Ceramurgia
International, 4, 24–27. Mekhemer, G. A. H, Halaway, S. A, Mohamed, M. A., & Zaki, M. I. (2004). Qualitative and quantitative
assessments of acid and base sites exposed on polycrystalline MgO durfaces: thermogravimetric, calorimetric, and in situ FTIR spectroscopic study combination, Journal of Physical Chemistry,
108, 13379–13386. Soltan, A.M, &Serry, M.A. (2011), Impact limestone microstructure on the calcination activation energy.
Advances in Applied Ceramics, 7, 409–416. Strydom, C. A., Vander Merwe, E. M., & Aphane, M. E. (2005). The effect of calcination conditions on
the rehydration of dead burnt magnesium oxide using magnesium Acetate as hydrating agent, Journal of Thermal Analysis and Calorimetry, 80, 659–662.
Wang, Q, Li, X, Wei, D, & Dai, S. (2012). Demostic progress in making magnesia from magnesite by heat
treatment. Advanced Material Research, 454, 168–173. Webb, T. L., & Heyster, H. (1957). The Carbonate Minerals, Mackenzie, R.C.(ed). London: Mineralogical
Society, 329–342.
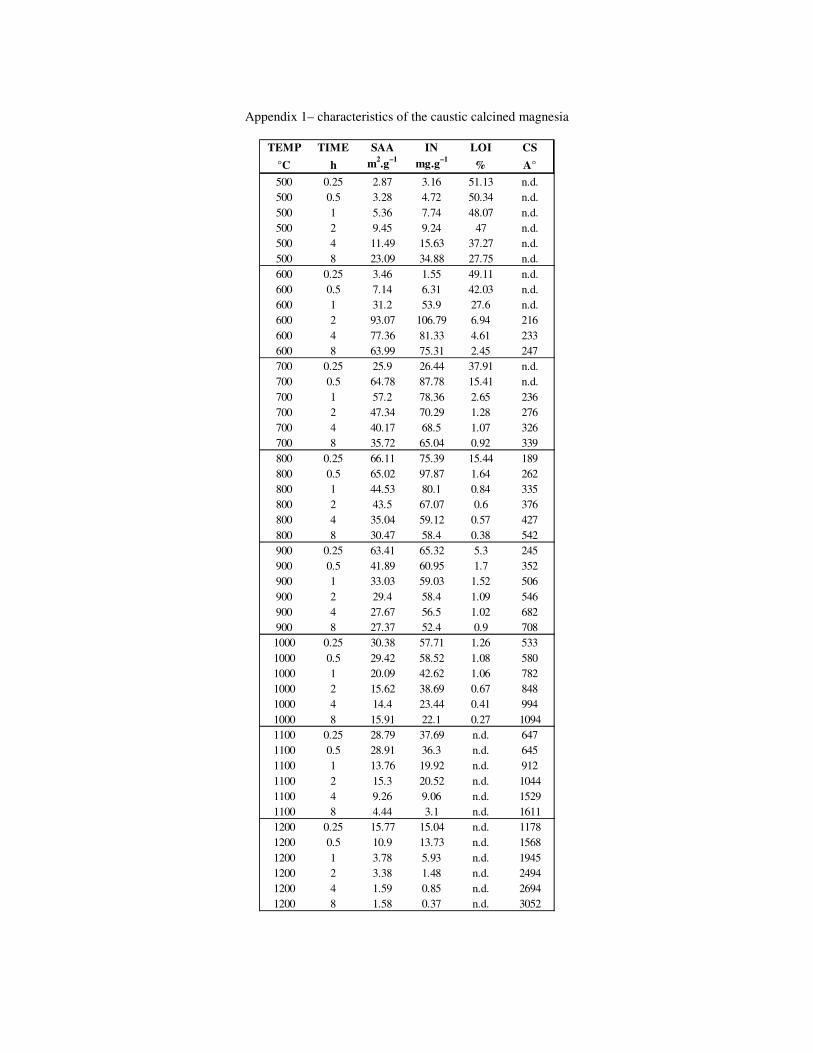
Appendix 1– characteristics of the caustic calcined magnesia
TEMP TIME SAA IN LOI CS
°C h m2.g
–1mg.g
–1% A°
500 0.25 2.87 3.16 51.13 n.d.500 0.5 3.28 4.72 50.34 n.d.500 1 5.36 7.74 48.07 n.d.500 2 9.45 9.24 47 n.d.500 4 11.49 15.63 37.27 n.d.500 8 23.09 34.88 27.75 n.d.600 0.25 3.46 1.55 49.11 n.d.600 0.5 7.14 6.31 42.03 n.d.600 1 31.2 53.9 27.6 n.d.600 2 93.07 106.79 6.94 216600 4 77.36 81.33 4.61 233600 8 63.99 75.31 2.45 247700 0.25 25.9 26.44 37.91 n.d.700 0.5 64.78 87.78 15.41 n.d.700 1 57.2 78.36 2.65 236700 2 47.34 70.29 1.28 276700 4 40.17 68.5 1.07 326700 8 35.72 65.04 0.92 339800 0.25 66.11 75.39 15.44 189800 0.5 65.02 97.87 1.64 262800 1 44.53 80.1 0.84 335800 2 43.5 67.07 0.6 376800 4 35.04 59.12 0.57 427800 8 30.47 58.4 0.38 542900 0.25 63.41 65.32 5.3 245900 0.5 41.89 60.95 1.7 352900 1 33.03 59.03 1.52 506900 2 29.4 58.4 1.09 546900 4 27.67 56.5 1.02 682900 8 27.37 52.4 0.9 7081000 0.25 30.38 57.71 1.26 5331000 0.5 29.42 58.52 1.08 5801000 1 20.09 42.62 1.06 7821000 2 15.62 38.69 0.67 8481000 4 14.4 23.44 0.41 9941000 8 15.91 22.1 0.27 10941100 0.25 28.79 37.69 n.d. 6471100 0.5 28.91 36.3 n.d. 6451100 1 13.76 19.92 n.d. 9121100 2 15.3 20.52 n.d. 10441100 4 9.26 9.06 n.d. 15291100 8 4.44 3.1 n.d. 16111200 0.25 15.77 15.04 n.d. 11781200 0.5 10.9 13.73 n.d. 15681200 1 3.78 5.93 n.d. 19451200 2 3.38 1.48 n.d. 24941200 4 1.59 0.85 n.d. 26941200 8 1.58 0.37 n.d. 3052