time-varying vs. non-time- varying growth in the gulf of mexico king mackerel stock assessment: a...
TRANSCRIPT

Time-Varying vs. Non-Time-Varying Growth in the Gulf
of Mexico King Mackerel Stock Assessment:
a Case StudySoutheast Fisheries
Science Center
Jeff Isely, Michael Schirripa, John Walter and Matt LaurettaSEFSC
J.J. Isely et al. | CAPAM Workshop | La Jolla, CA | November 3-7, 2014 Growth: theory, estimation, and application in fishery stock assessment models | Page 1

J.J. Isely et al. | CAPAM Workshop | La Jolla, CA | November 3-7, 2014 Growth: theory, estimation, and application in fishery stock assessment models | Page 2

J.J. Isely et al. | CAPAM Workshop | La Jolla, CA | November 3-7, 2014 Growth: theory, estimation, and application in fishery stock assessment models | Page 3

J.J. Isely et al. | CAPAM Workshop | La Jolla, CA | November 3-7, 2014 Growth: theory, estimation, and application in fishery stock assessment models | Page 4
J.J. Isely et al. | CAPAM Workshop | La Jolla, CA | November 3-7, 2014 Growth: theory, estimation, and application in fishery stock assessment models | Page 5

J.J. Isely et al. | CAPAM Workshop | La Jolla, CA | November 3-7, 2014 Growth: theory, estimation, and application in fishery stock assessment models | Page 6
Landings

J.J. Isely et al. | CAPAM Workshop | La Jolla, CA | November 3-7, 2014 Growth: theory, estimation, and application in fishery stock assessment models | Page 7

J.J. Isely et al. | CAPAM Workshop | La Jolla, CA | November 3-7, 2014 Growth: theory, estimation, and application in fishery stock assessment models | Page 8

J.J. Isely et al. | CAPAM Workshop | La Jolla, CA | November 3-7, 2014 Growth: theory, estimation, and application in fishery stock assessment models | Page 9
Investigative Model Configures• KMK_GOM_1: uses CPUE only with no length or age-at-length(AAL);
Two length bins (i.e. one big plus group) Allows recruitment deviations; Fixed sex-specific growth at Data Workshop values
• KMK_GOM_2: start with #1
Add only lengths and selectivity • KMK_GOM_3: starts with #2
Adds Age at Length Freely estimated constant (time invariant) growth (i.e. no informed priors)

J.J. Isely et al. | CAPAM Workshop | La Jolla, CA | November 3-7, 2014 Growth: theory, estimation, and application in fishery stock assessment models | Page 10
Females seems to be getting smaller over time

J.J. Isely et al. | CAPAM Workshop | La Jolla, CA | November 3-7, 2014 Growth: theory, estimation, and application in fishery stock assessment models | Page 11
J.J. Isely et al. | CAPAM Workshop | La Jolla, CA | November 3-7, 2014 Growth: theory, estimation, and application in fishery stock assessment models | Page 12
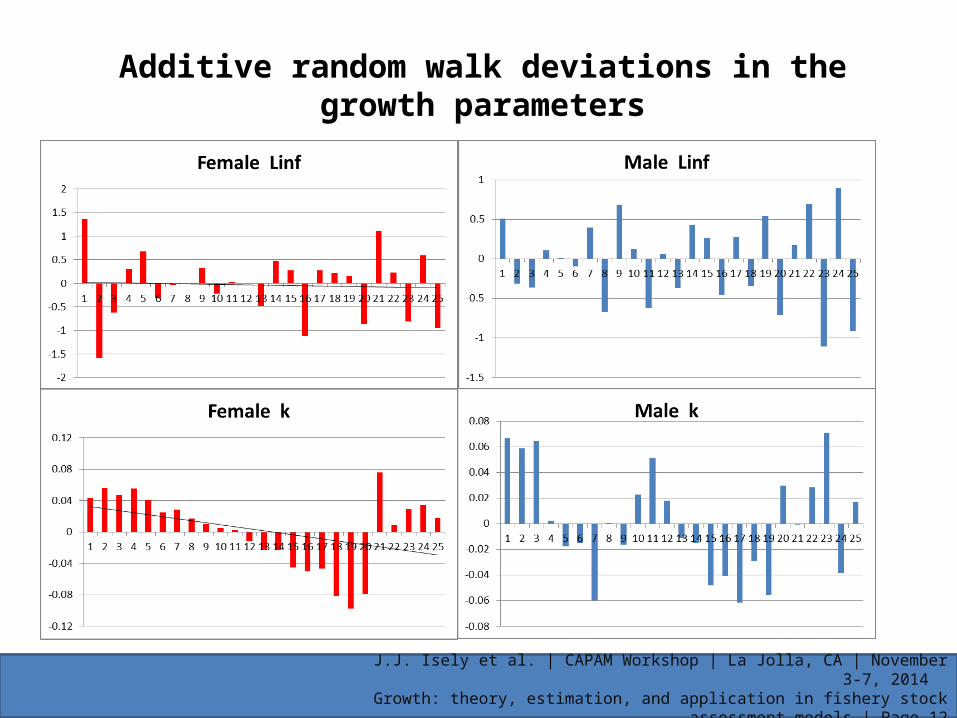
Additive random walk deviations in the growth parameters

J.J. Isely et al. | CAPAM Workshop | La Jolla, CA | November 3-7, 2014 Growth: theory, estimation, and application in fishery stock assessment models | Page 13
Approaches to Model Selection
• use numerical methods quantify the performance of the model fit to the data for each model
• use more of a “deductive reasoning” approach: utilizing “if / then” logic to arrive at a “common sense” decision
• Some combination of the two methods

J.J. Isely et al. | CAPAM Workshop | La Jolla, CA | November 3-7, 2014 Growth: theory, estimation, and application in fishery stock assessment models | Page 14
• Model_3: Ignore the observed changes in size-at-age and fits model to the data “as is” (null model).
• Model_4: Use time varying growth to address the changes in observed size-at-age. Fixes the growth parameters at those estimated in in #3. Allows for annual deviations in male and female L∞ and k.
• Model_5: Use time varying selectivity to address the changes in observed size-at-age. Fixes the growth parameters at those estimated in in #3. Allows for annual deviations in fleet-specific selectivites.
Three Models for Consideration

J.J. Isely et al. | CAPAM Workshop | La Jolla, CA | November 3-7, 2014 Growth: theory, estimation, and application in fishery stock assessment models | Page 15
IF Model_3 is “more” correct THEN:
• No pattern to the size-at-age over time• We would expect no significant improvement
in the fit statistics if we vary growth• We would expect no significant improvement
in the fit statistics if we vary selectivity

J.J. Isely et al. | CAPAM Workshop | La Jolla, CA | November 3-7, 2014 Growth: theory, estimation, and application in fishery stock assessment models | Page 16
IF Model_4 is correct THEN:
• we would expect to see a similar decrease in size-at-age for both male and females

J.J. Isely et al. | CAPAM Workshop | La Jolla, CA | November 3-7, 2014 Growth: theory, estimation, and application in fishery stock assessment models | Page 17
Both sexes show similar patterns

J.J. Isely et al. | CAPAM Workshop | La Jolla, CA | November 3-7, 2014 Growth: theory, estimation, and application in fishery stock assessment models | Page 18
Resulting Growth Curves

J.J. Isely et al. | CAPAM Workshop | La Jolla, CA | November 3-7, 2014 Growth: theory, estimation, and application in fishery stock assessment models | Page 19
IF Model_5 is correct THEN we would need to believe that all gears changed selectivity at the same rate

J.J. Isely | CAPAM Workshop | La Jolla, CA | November 3-7, 2014 Growth: theory, estimation, and application in fishery stock assessment models | Page 20

J.J. Isely et al. | CAPAM Workshop | La Jolla, CA | November 3-7, 2014 Growth: theory, estimation, and application in fishery stock assessment models | Page 21
There IS a significant improvement in the model fit statistics for Models_4 & 5
COMPONENT Model_3 Model_4 Model_5 Model_6No. Parameters 503 600 800 509Total Likelihood 16,467 15,902 16,224 17,471 Catch 14.89 11.52 11.11 31.70Survey -101.56 -145.19 -106.20 -123.93Discard 41.42 39.94 89.76 334.43Length_comp 3013.39 2943.67 2794.71 3591.72Age_comp 13498.50 13002.00 13423.70 13640.70Size_at_age* 3896 3814 3915 3860Recruitment -0.79 -3.71 0.17 -3.63Parm_priors 0.10 0.15 0.45 -0.01Parm_devs 0.64 52.76 9.32 0.08
** Although the LL maybe lower, it does not mean that the model is the most parsimonious

J.J. Isely et al. | CAPAM Workshop | La Jolla, CA | November 3-7, 2014 Growth: theory, estimation, and application in fishery stock assessment models | Page 22
Both Model_4 and _5 fit better than _3

J.J. Isely et al. | CAPAM Workshop | La Jolla, CA | November 3-7, 2014 Growth: theory, estimation, and application in fishery stock assessment models | Page 23
SSB for the four model configurations

J.J. Isely et al. | CAPAM Workshop | La Jolla, CA | November 3-7, 2014 Growth: theory, estimation, and application in fishery stock assessment models | Page 24
SSB trends are similar, certainty is not
Model_1 Model_2
Model_3 Model_4

J.J. Isely et al. | CAPAM Workshop | La Jolla, CA | November 3-7, 2014 Growth: theory, estimation, and application in fishery stock assessment models | Page 25
• Both of the alternative models (Model_4 & Model_5) explain the data better than the null model (Model_3) but requires the belief of unbiased length/age sampling. Cannot identify underlying ecological or environmental causes.
• Model_4 accounted for the most variation in the data while using the fewest number of parameters to do so, but requires the belief that growth has decreased consistently and substantially in the past 25 years.
• Model_5, while not requiring a change in growth, requires the belief that the selectivity for all gears changed in synchrony without a change in fishing methods.
Conclusions (Assessment Scientist)

J.J. Isely et al. | CAPAM Workshop | La Jolla, CA | November 3-7, 2014 Growth: theory, estimation, and application in fishery stock assessment models | Page 26
• Model_4: A 25-year decreasing trend in growth is unlikely.-Reject
• Model_5: It is highly unlikely that selectivity for all gears changed simultaneously. -Reject
• Model_3, Although not the best fit, requires the fewest assumptions and is consistent with our perception of the fishery. -Accept
Conclusions (review workshop)

J.J. Isely et al. | CAPAM Workshop | La Jolla, CA | November 3-7, 2014 Growth: theory, estimation, and application in fishery stock assessment models | Page 27
• Weaknesses: The GOM KMK assessment model is not very stable. The data streams are lacking contrast and thus any real definitive signal related to stock status or stock productivity was not captured in the analysis.
• Strengths: Despite the weaknesses, nearly every model configuration suggests that the stock size has been increasing since 1990 with no indication that the stock is currently being overfished or experiencing overfishing.
• Recommendation: The current management strategy seems to be very effective at achieving stated goals and there is no evidence to suggest changes in the current quota would be beneficial.
Additional Conclusions (review workshop)

J.J. Isely et al. | CAPAM Workshop | La Jolla, CA | November 3-7, 2014 Growth: theory, estimation, and application in fishery stock assessment models | Page 28
• Ageing method improvement: Has a change in ageing methods resulted in an increase in age at size?
• Institutional Memory: Were historical tournament/quota samples included in the general recreational catch samples?
• Coding/Identification issues: Are the small king mackerel in the historic Headboat samples really king mackerel? Were confiscated illegal catches included in the recreational samples?
• Regulations: Has there been a change in gear configuration in the Rec and HL fisheries that would eliminate larger fish (e.g. circle hooks)?
• Ecosystem-based assessment: Continue to investigate possible environmental and food-web changes in the GOM (FATE project).
Remaining issues to be resolved

J.J. Isely | CAPAM Workshop | La Jolla, CA | November 3-7, 2014 Growth: theory, estimation, and application in fishery stock assessment models | Page 29

J.J. Isely et al. | CAPAM Workshop | La Jolla, CA | November 3-7, 2014 Growth: theory, estimation, and application in fishery stock assessment models | Page 30
• Ageing method improvement: Has a change in ageing methods resulted in an increase in age at size?
• Institutional Memory: Were historical tournament/quota samples included in the general recreational catch samples?
• Coding/Identification issues: Are the small king mackerel in the historic Headboat samples really king mackerel? Or were theyconfiscated illegal catches included in the recreational samples?
• Regulations: Has there been a change in gear configuration in the Rec and HL fisheries that would eliminate larger fish (e.g. circle hooks)?
• Ecosystem-based assessment: Continue to investigate possible environmental and food-web changes in the GOM (FATE project).
Remaining issues to be resolved

J.J. Isely et al. | CAPAM Workshop | La Jolla, CA | November 3-7, 2014 Growth: theory, estimation, and application in fishery stock assessment models | Page 31

J.J. Isely et al. | CAPAM Workshop | La Jolla, CA | November 3-7, 2014 Growth: theory, estimation, and application in fishery stock assessment models | Page 32
• Ageing method improvement: Has a change in ageing methods resulted in an increase in age at size?
• Institutional Memory: Were historical tournament/quota samples included in the general recreational catch samples?
• Coding/Identification issues: Are the small king mackerel in the historic Headboat samples really king mackerel? Were confiscated illegal catches included in the recreational samples?
• Regulations: Has there been a change in gear configuration in the Rec and HL fisheries that would eliminate larger fish (e.g. circle hooks)?
• Ecosystem-based assessment: Continue to investigate possible environmental and food-web changes in the GOM (FATE project).
Remaining issues to be resolved

J.J. Isely et al. | CAPAM Workshop | La Jolla, CA | November 3-7, 2014 Growth: theory, estimation, and application in fishery stock assessment models | Page 33

J.J. Isely | CAPAM Workshop | La Jolla, CA | November 3-7, 2014 Growth: theory, estimation, and application in fishery stock assessment models | Page 34

J.J. Isely et al. | CAPAM Workshop | La Jolla, CA | November 3-7, 2014 Growth: theory, estimation, and application in fishery stock assessment models | Page 35
• Ageing method improvement: Has a change in ageing methods resulted in an increase in age at size?
• Institutional Memory: Were historical tournament/quota samples included in the general recreational catch samples?
• Coding/Identification issues: Are the small king mackerel in the historic Headboat samples really king mackerel? Were confiscated illegal catches included in the recreational samples?
• Regulations: Has there been a change in gear configuration in the Rec and HL fisheries that would eliminate larger fish (e.g. circle hooks)?
• Ecosystem-based assessment: Continue to investigate possible environmental and food-web changes in the GOM (FATE project).
Remaining issues to be resolved

J.J. Isely et al. | CAPAM Workshop | La Jolla, CA | November 3-7, 2014 Growth: theory, estimation, and application in fishery stock assessment models | Page 36

J.J. Isely et al. | CAPAM Workshop | La Jolla, CA | November 3-7, 2014 Growth: theory, estimation, and application in fishery stock assessment models | Page 37
• Ageing method improvement: Has a change in ageing methods resulted in an increase in age at size?
• Institutional Memory: Were historical tournament/quota samples included in the general recreational catch samples?
• Coding/Identification issues: Are the small king mackerel in the historic Headboat samples really king mackerel? Were confiscated illegal catches included in the recreational samples?
• Regulations: Has there been a change in gear configuration in the Rec and HL fisheries that would eliminate larger fish (e.g. circle hooks)?
• Ecosystem-based assessment: Continue to investigate possible environmental and food-web changes in the GOM (FATE project).
Remaining issues to be resolved

J.J. Isely et al. | CAPAM Workshop | La Jolla, CA | November 3-7, 2014 Growth: theory, estimation, and application in fishery stock assessment models | Page 38
Questions?

J.J. Isely et al. | CAPAM Workshop | La Jolla, CA | November 3-7, 2014 Growth: theory, estimation, and application in fishery stock assessment models | Page 39
Approaches to Model Selection
• Can use numerical methods quantify the performance of the model fit to the data for each model?
• Can use more of a deductive reasoning approach: utilizing “if / then” logic to arrive at a “common sense decision”?
• Some combination of the two methods• (It’s critical to keep in mind that the data are likely
biased to some degree (not perfect); one can favor the “right” model for the wrong reasons)

J.J. Isely | CAPAM Workshop | La Jolla, CA | November 3-7, 2014 Growth: theory, estimation, and application in fishery stock assessment models | Page 40
Figure 3.2.9. Observed and predicted length compositions of landings of GOM king mackerel in the recreational charter-private fleet (top). Observed (N) sample sizes and effective sample sizes (effN) estimated by SS are also reported. Pearson residuals for the length composition fit (bottom). Solid circles are positive residuals (i.e., observed greater than predicted) and open circles are negative residuals (i.e., predicted greater than observed).

J.J. Isely | CAPAM Workshop | La Jolla, CA | November 3-7, 2014 Growth: theory, estimation, and application in fishery stock assessment models | Page 41
Figure 3.2.6. Observed and predicted length compositions of landings of GOM king mackerel in the commercial handline line fleet (top). Observed (N) sample sizes and effective sample sizes (effN) estimated by SS are also reported. Pearson residuals for the length composition fit (bottom). Solid circles are positive residuals (i.e., observed greater than predicted) and open circles are negative residuals (i.e., predicted greater than observed).

J.J. Isely | CAPAM Workshop | La Jolla, CA | November 3-7, 2014 Growth: theory, estimation, and application in fishery stock assessment models | Page 42

J.J. Isely | CAPAM Workshop | La Jolla, CA | November 3-7, 2014 Growth: theory, estimation, and application in fishery stock assessment models | Page 43
Profile on Steepness

J.J. Isely | CAPAM Workshop | La Jolla, CA | November 3-7, 2014 Growth: theory, estimation, and application in fishery stock assessment models | Page 44
J.J. Isely et al. | CAPAM Workshop | La Jolla, CA | November 3-7, 2014 Growth: theory, estimation, and application in fishery stock assessment models | Page 45
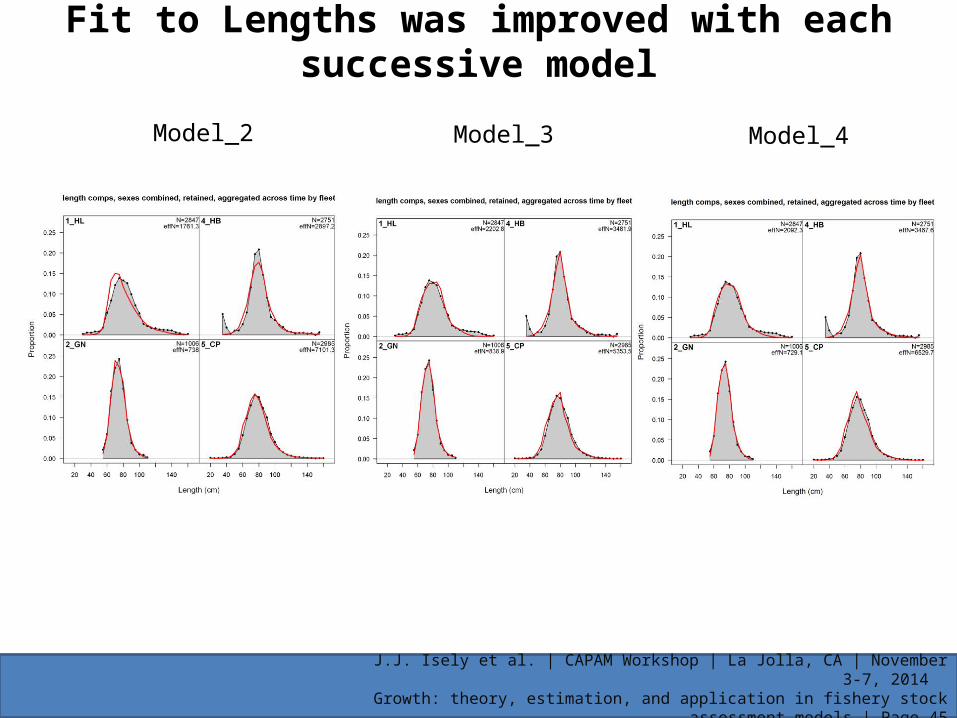
Fit to Lengths was improved with each successive model
Model_2 Model_3 Model_4

J.J. Isely et al. | CAPAM Workshop | La Jolla, CA | November 3-7, 2014 Growth: theory, estimation, and application in fishery stock assessment models | Page 46
Fit to Lengths was improved with each successive model
Model_2 Model_3 Model_4

J.J. Isely et al. | CAPAM Workshop | La Jolla, CA | November 3-7, 2014 Growth: theory, estimation, and application in fishery stock assessment models | Page 47

J.J. Isely et al. | CAPAM Workshop | La Jolla, CA | November 3-7, 2014 Growth: theory, estimation, and application in fishery stock assessment models | Page 48
Fit to Observations

J.J. Isely et al. | CAPAM Workshop | La Jolla, CA | November 3-7, 2014 Growth: theory, estimation, and application in fishery stock assessment models | Page 49
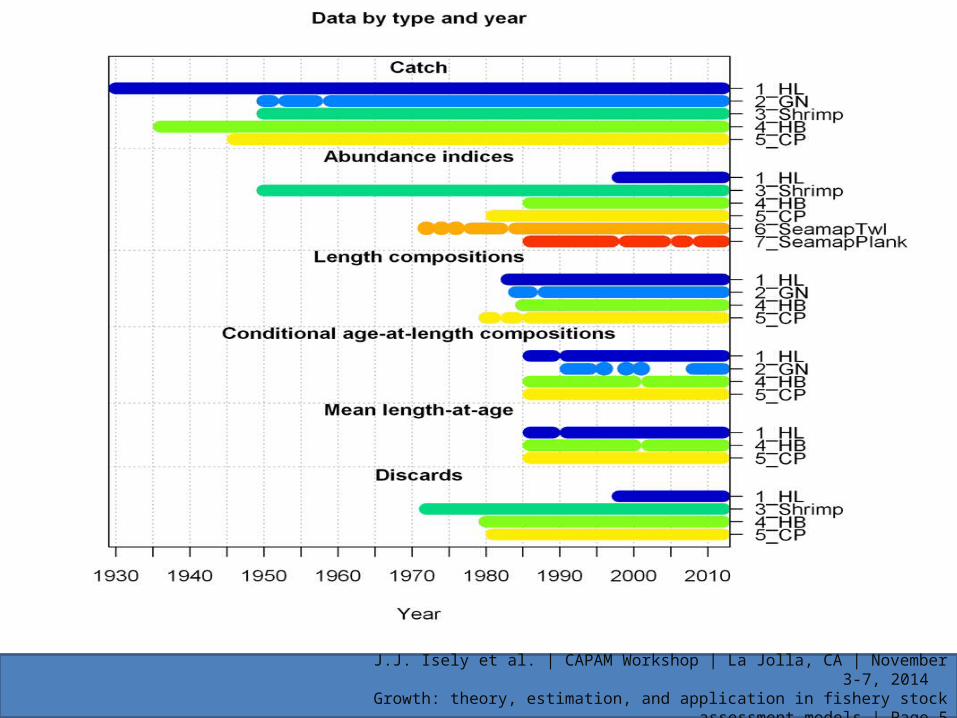
Model Configurations
• The total fishery was parsed into 5 fleets• Commercial fisheries included handline (H&L),
gillnet, and shrimp-fishery bycatch• Recreational fisheries included Headboat and
Charter/Private • Surveys included Commercial H&L CPUE, Shrimp
Effort, Headboat CPUE, SEAMAP Trawl Survey (age_1), and SEAMAP Larval Survey (SSB)

J.J. Isely et al. | CAPAM Workshop | La Jolla, CA | November 3-7, 2014 Growth: theory, estimation, and application in fishery stock assessment models | Page 50
Landings

J.J. Isely et al. | CAPAM Workshop | La Jolla, CA | November 3-7, 2014 Growth: theory, estimation, and application in fishery stock assessment models | Page 51
Label Value Active_CntPhase Min Max Init Status Parm_StDevL_at_Amin_Fem_GP_1 21.00 _ -3 10 80 21.00 NA _L_at_Amax_Fem_GP_1 112.15 1 3 100 150 112.03 OK 0.491VonBert_K_Fem_GP_1 0.36 2 4 0.1 0.5 0.37 OK 0.005CV_young_Fem_GP_1 0.27 3 6 0.01 0.3 0.27 OK 0.005CV_old_Fem_GP_1 0.10 4 6 0.01 0.3 0.10 OK 0.002L_at_Amin_Mal_GP_1 21.00 _ -3 10 80 21.00 NA _L_at_Amax_Mal_GP_1 93.06 5 3 70 120 93.11 OK 0.292VonBert_K_Mal_GP_1 0.38 6 4 0.1 0.7 0.38 OK 0.006CV_young_Mal_GP_1 0.34 7 6 0.01 0.5 0.35 OK 0.007CV_old_Mal_GP_1 0.06 8 6 0.01 0.3 0.06 OK 0.001
J.J. Isely et al. | CAPAM Workshop | La Jolla, CA | November 3-7, 2014 Growth: theory, estimation, and application in fishery stock assessment models | Page 52
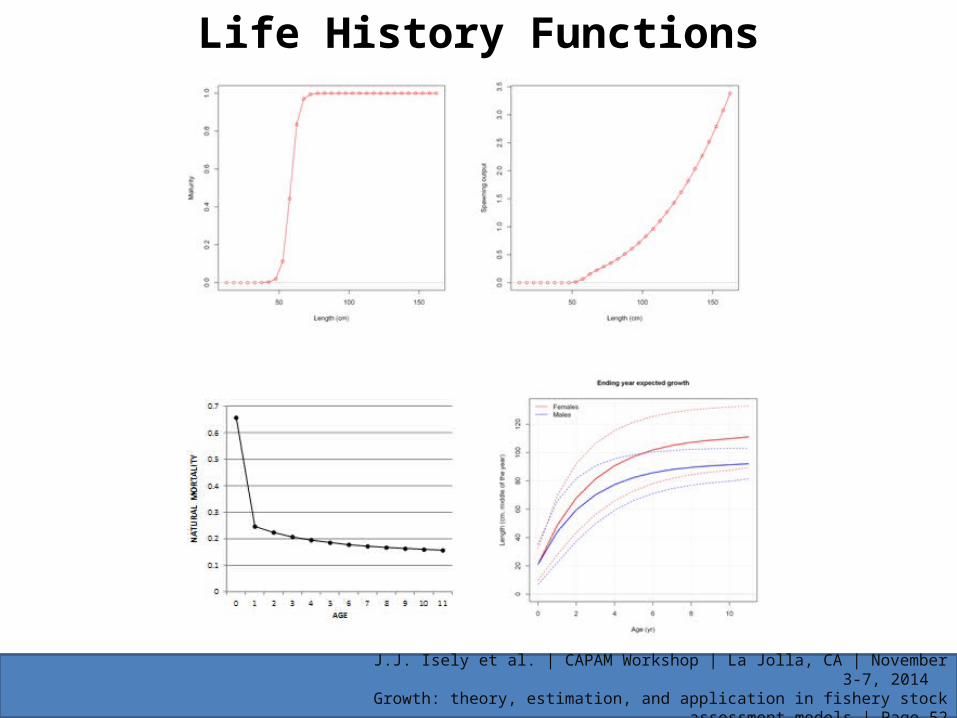
Life History Functions

J.J. Isely et al. | CAPAM Workshop | La Jolla, CA | November 3-7, 2014 Growth: theory, estimation, and application in fishery stock assessment models | Page 53
• Try constant growth with time varying selctivities
Next Steps

J.J. Isely et al. | CAPAM Workshop | La Jolla, CA | November 3-7, 2014 Growth: theory, estimation, and application in fishery stock assessment models | Page 54
Additive random walk deviations in the growth parametersparm’ (y) = parm (y-1) + dev(y)

J.J. Isely et al. | CAPAM Workshop | La Jolla, CA | November 3-7, 2014 Growth: theory, estimation, and application in fishery stock assessment models | Page 55
Time varying growth adds 92 parameters but reduces LL by 769 units
TOTAL 16,659.00 15,890.30 (768.70)Catch 16.49 11.58 (4.91)Equil_catch - - Survey (104.84) (148.40) (43.56)Discard 44.83 40.33 (4.50)Length_comp 3,196.99 2,933.44 (263.55)Age_comp 13,504.90 12,999.90 (505.00)Recruitment (0.14) (2.72) (2.57)Forecast_Recruitment - - Parm_priors 0.18 0.21 0.03Parm_softbounds 0.01 0.01 0.00Parm_devs 0.63 56.02 55.39Crash_Pen - -
Model_3 Model_4
J.J. Isely et al. | CAPAM Workshop | La Jolla, CA | November 3-7, 2014 Growth: theory, estimation, and application in fishery stock assessment models | Page 56
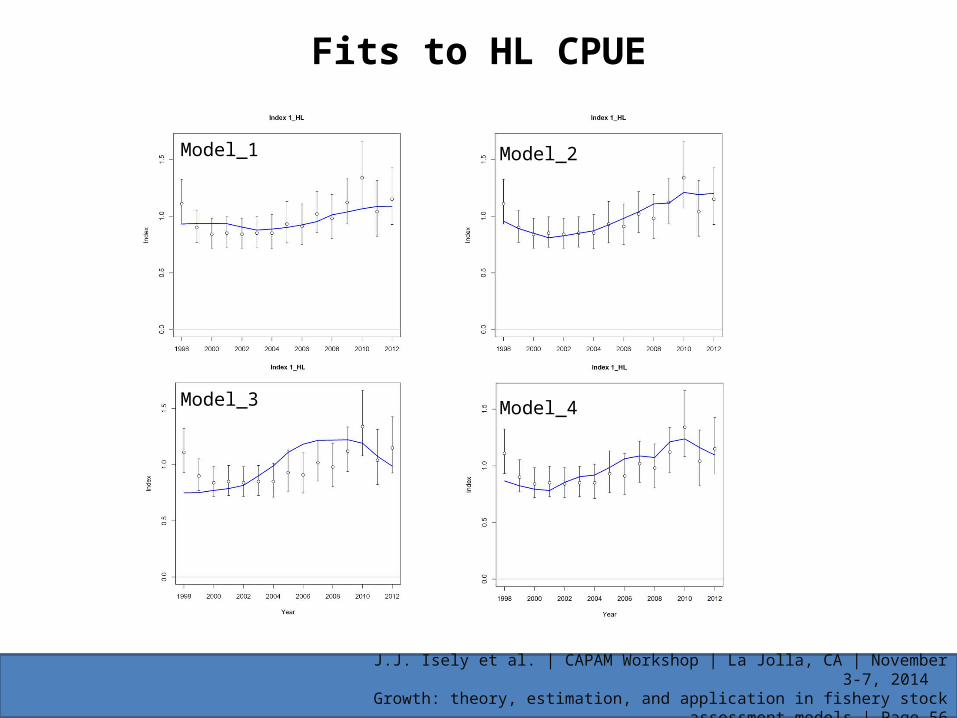
Fits to HL CPUE
Model_1 Model_2
Model_3 Model_4