time variable gravity de-aliasing for grace
TRANSCRIPT

GRACE 327-750 (GR-GFZ-AOD-0001)
Gravity Recovery and Climate Experiment
AOD1B Product Description Document
for Product Release 05
(Rev. 4.2, May 20, 2014)
Frank Flechtner, Henryk Dobslaw, Elisa Fagiolini
GFZ German Research Centre for Geosciences
Department 1: Geodesy and Remote Sensing

GRACE AOD1B Product Description Document GR-GFZ-AOD-0001
Rev. 4.2, May 20, 2014 Page 2
Prepared by:
_____________________________________
Frank Flechtner, GFZ
GRACE Co-PI and Deputy Science Operations Manager
Contact Information:
GFZ German Research Center for Geosciences
Department 1: Geodesy and Remote Sensing
c/o DLR Oberpfaffenhofen
D-82234 Wessling
Germany
Email: [email protected]
_____________________________________
Henryk Dobslaw, GFZ
GRACE SDS Co-worker
Contact Information:
GFZ German Research Center for Geosciences
Department 1: Geodesy and Remote Sensing
Telegrafenberg
D-14473 Potsdam
Germany
Email: [email protected]
_____________________________________
Elisa Fagiolini, GFZ
GRACE SDS Co-worker
Contact Information:
GFZ German Research Center for Geosciences
Department 1: Geodesy and Remote Sensing
Telegrafenberg
D-14473 Potsdam
Germany
Email: [email protected]
Reviewed by:
Srinivas Bettadpur, UTCSR, GRACE Science Operations Manager
Maik Thomas, GFZ, GRACE Science Team Member
Tatyana Pekker, UTCSR
Approved by:
_____________________________________
Byron D. Tapley, UTCSR
GRACE Principal Investigator

GRACE AOD1B Product Description Document GR-GFZ-AOD-0001
Rev. 4.2, May 20, 2014 Page 3
Table of Content 1. Introduction ............................................................................................................... 5
1.1 Outline ........................................................................................................................ 5 1.2 High-Frequency Non-Tidal Mass Variability ............................................................ 5 1.3 Scope of the GRACE AOD1B Product ..................................................................... 6
1.4 History of Available AOD1B Releases ..................................................................... 6 1.5 Latest Status Information on AOD1B RL05 ............................................................. 7 1.6 Known Limitations of AOD1B RL05 ........................................................................ 7
1.7 AOD1B as an Operational Product of the IERS ........................................................ 8 2. Input Data and Models .............................................................................................. 9
2.1 Atmospheric Data ...................................................................................................... 9 2.2 Ocean Model OMCT ............................................................................................... 10
3. Processing Strategy for the Ocean and Atmosphere ............................................... 13 3.1 Processing Strategy OMCT ..................................................................................... 13
3.2 Processing Strategy Atmosphere ............................................................................. 14 3.3 Mean Ocean and Atmospheric Pressure Fields ....................................................... 19
3.4 Coefficients available in AOD1B: atm, ocn, glo, oba ............................................. 19 3.5 Consideration of Atmospheric Tides ....................................................................... 20 3.6 Time-Averaged AOD1B Products: GAA, GAB, GAC, and GAD .......................... 20
3.7 Discontinuities in atmospheric pressure data and associated correction products
GAE and GAF ................................................................................................................ 21
4. Available Releases of the AOD1B Product ............................................................ 27 5. AOD1B and OCN1B Format and Content Description .......................................... 28
6. References ..................................................................................................................... 31 7. Acronyms ...................................................................................................................... 33

GRACE AOD1B Product Description Document GR-GFZ-AOD-0001
Rev. 4.2, May 20, 2014 Page 4
Document Change
Issue Date Pages Description of Change
Draft 22.09.2003 all First version
1.0 22.10.2003 all Included GRACE project comments on draft version
2.0 20.09.2005 6 Added changes w.r.t release 03 (substitution of the barotropic ocean
model PPHA by the baroclinic model OMCT)
7 Updated description of the necessary ECMWF forcing fields
16 Added description of OMCT model to chapter 2.2.3
21 Added processing strategy of OMCT to chapter 3.1
28 Updated chapter 3.3 on mean fields
32 Defined new chapter 4 (Available Releases)
33 Updated chapter 5(Validation of AOD product)
37 Chapter 6.2: Added remark that OCN1B read s/w is available at the
archives
39 Added OMCT references to Chapter 7
40 Updated Chapter 8 (Abbreviations)
Deleted appendix
2.1 04.11.2005 22 Corrected explanation to equation 3-3
23 Corrected explanation to equation 3-5
25 Corrected first sentence after figure 3-3
26 Corrected explanation to equation 3-20
27 Corrected last sentence of 3.2.2.1
2.2 26.04.2006 32 Updated RL03 availability period
33 Changed title of Chapter 5 and included recommendation for TN04
34 Changed title of Chapter 6
36 Added comment on OCN1B availability
38 Included new Chapter 7 “Average of AOD1B products: GAA, GAB
and GAC”.
3.0 23.02.2007 Included RL04 relevant issues in Chapters 4-7, added clarification and
recommendation on use of different products.
3.1 13.04.2007 Added clarifications in Chapter 6 and 7 for AOD1B “oba” data type
and GAD products.
4.0 15.07.2013 Thoroughly revised and shortened version that isfocused entirely on
the latest product release 05.
4.1 07.04.2014 Included new Chapter 3.7 “Discontinuities in atmospheric pressure
data and associated correction products GAE and GAF”
4.2 20.05.2014 Editorial changes to chapters 3.6 and 3.7 to better describe the correct
usage of various GAx Level-2 products

GRACE AOD1B Product Description Document GR-GFZ-AOD-0001
Rev. 4.2, May 20, 2014 Page 5
1. Introduction
1.1 Outline
This version of the Product Description Document for the GRACE Atmosphere and Ocean Level-
1B De-Aliasing (AOD1B) Product is dedicated to release 05. For previous releases 01 to 04 we
refer to revision 3.1 of this document that is still available from the GRACE archives at ISDC and
PO.DAAC.
Following some introductory information in chapter 1, the second chapter describes the required
meteorological input data and the OMCT ocean model. In chapter 3, the processing strategy to
derive atmospheric and oceanic pressure variations is described that considers the vertically
varying atmospheric density and computes gravity coefficients by spherical harmonic analysis.
The mean atmosphere and ocean fields, needed to derive residual mass variations, are described
as well as the combination of the atmospheric and oceanic contributions. Chapter 4 gives more
detailed comments on previous versions of AOD1B, whereas in chapter 5 the format and
components of the AOD1B RL05 product are explained. The document is supplemented by a list
of references and abbreviations.
1.2 High-Frequency Non-Tidal Mass Variability
Gravity field determination from low Earth-orbiting satellites is generally affected by time-
changes in the external gravitational field and its underlying mass distribution within the
atmosphere, at the surface, and in the Earth's interior. Due to sampling limitations of all satellite
missions, observations are typically accumulated over a certain time-period in order to be able to
solve for a global gravity field solution with reasonably high spatial resolution. For the GRACE
mission, typical accumulation times range between 7 and 30 days.
Besides tidal signals that are present in the oceans and the solid Earth, there are also substantial
non-tidal mass variations at periods below 30 days that take place at the Earth's surface. Evolving
synoptic weather systems with horizontal dimensions of several ~100 km that are adverted with
the mean flow cause surface pressure changes of a few ~10 hPa in middle latitudes. Heavy
precipitation events associated with convective processes cause rapid increases of the amount of
water stored on the continents, and winds associated with cyclonic pressure systems cause re-
distributions of oceanic water masses, and thus changes in ocean bottom pressure.
Failures during accounting those high-frequency signals within the gravity field estimation
process cause aliasing into the estimated gravity fields, a process that is at least partly responsible
for the systematic meridional striations common to all GRACE gravity field solutions. Although
these high-frequency variability is also affecting gravity field modeling from CHAMP and, less
pronounced, from GOCE satellite observations, the GRACE mission, dedicated to the observation
of time-variable mass transport phenomena, is affected most up to intermediate spatial
wavelengths of several ~100 km (Fig. 1-1).

GRACE AOD1B Product Description Document GR-GFZ-AOD-0001
Rev. 4.2, May 20, 2014 Page 6
Figure 1-1: Gravity variation signals from atmosphere, oceans and terrestrial stored water in different time
scales compared to mission sensitivities of CHAMP, GRACE and GOCE: daily atmosphere, daily oceanic
and monthly hydrological signals (left), andatmospheric signals sampled at 6, 12, and 24 hours (right).
1.3 Scope of the GRACE AOD1B Product
AOD1B is intended to provide a model-based data-set that describes the time variations of the
gravity potential at satellite altitudes that are caused by non-tidal mass variability in the
atmosphere and oceans. The product contains for each 6-hourly time step four different sets of
Stokes coefficients: 'atm' describes the global contribution of the vertically distributed
atmospheric masses by explicitly taking into account the actual density distribution in the
atmosphere. 'ocn' contains the contribution of the oceanic water column to ocean bottom pressure
variations, 'glo' the summed effect of atmosphere represented by 'atm' and ocean represented by
'ocn'. Finally, 'oba' represents the ocean bottom pressure simulated by the ocean model in
response to surface pressure and other meteorologic quantities from the lower boundary of the
atmosphere. 'oba' thereby ignores any effects of the vertical distribution of the masses in the
atmosphere.
1.4 History of Available AOD1B Releases
All releases of AOD1B published up to now are based on 6-hourly operational atmospheric
analysis data from ECMWF, in combination with 6-hourly bottom pressure fields from different
global ocean model simulations. To evaluate mass anomalies, a corresponding long-term average
is calculated over all 6-hourly oceanic and atmospheric mass fields of a given time-span prior to
the transformation into Stokes Coefficients.
The differences between the different releases so far available are shortly summarized in the
following. Further details are provided in Chapter 4.
Release 01 of AOD1B is available for the period July 2000 until June 2007 and incorporates
ocean bottom pressure simulated with the barotropic ocean model PPHA (Hirose et al. 2000).
Atmospheric and oceanic mean fields calculated for the year 2001 are removed from all the data-
sets for this release.
Release 02consists of a short test series from operational ECMWF analysis data and ocean
bottom pressure of an improved version of PPHA. This dataset is not publicly available.
Release 03 is based on a first test simulation with an OMCT configuration discretized on a 1.875°
latitude-longitude grid (Thomas and Dobslaw, 2005). The series is available from January 2002
until January 2007, mean fields calculated over the years 2001 and 2002 are subtracted.

GRACE AOD1B Product Description Document GR-GFZ-AOD-0001
Rev. 4.2, May 20, 2014 Page 7
A further long-term simulation with OMCT discretized on a 1.875° grid with slightly adjusted
parameterizations is the basis for release 04 (Dobslaw and Thomas, 2007). OMCT has been
forced with ERA40 atmospheric reanalysis data for the time-period January 1976 to December
2000, followed by simulations forced with operational ECMWF analyses until April 2012,
making it suitable for the consistent re-processing of historical satellite laser ranging observations
(Flechtner et al., 2008). The mean fields removed are once more calculated for the years 2001 and
2002.
The most recent release 05 that is described in detail in this document was introduced in early
2012. The series is based on OMCT discretized on a 1.0° latitude-longitude grid (Dobslaw et al.,
2013), that has been integrated with ERA Interim reanalysis data (Dee et al., 2011) for the time-
period January 1989 to December 2000, followed by simulations forced with operational
ECMWF analyses. The atmospheric contribution was not changed w.r.t. release 04.
Corresponding mean fields calculated for the years 2001 and 2002 are once more subtracted.
1.5 Latest Status Information on AOD1B RL05
The most recent release 05 of AOD1B is available since Jan 1st, 2001, and is currently updated
on an approximately weekly basis. Up-to-date information on the status of this product can be
obtained from the web-pages at www.gfz-potsdam.de/AOD1B.
AOD1B RL05 and in particular its oceanic component has been extensively tested against a
number of independent data-sets, demonstrating the superiority of the latest product version with
respect to previous releases. The results are summarized in the following paper:
Dobslaw, H., Flechtner, F., Bergmann-Wolf, I., Dahle, Ch., Dill, R., Esselborn, S., Sasgen, I.,
Thomas, M. (2013), Simulating High-Frequency Atmosphere-Ocean Mass Variability for De-
Aliasing of Satellite Gravity Observations: AOD1B RL05, J. Geophys. Res., 118(C5),
10.1002/jgrc.20271.
1.6 Known Limitations of AOD1B RL05
AOD1B is intended to serve as a background model for the removal of high-frequency non-tidal
variability. It entirely relies on numerical data from ECMWF and the (unconstrained) ocean
model OMCT. It therefore includes a number of limitations, which are summarized in the
following. An updated list of known limitations is found on the web-pages at www.gfz-
potsdam.de/AOD1B.
OMCT simulations are intended to simulate in particular short-term variability of ocean bottom
pressure in response to rapidly varying atmospheric conditions. In the long run, however, the
model state is drifting more rapidly than, e.g., current state-of-the-art coupled atmosphere-ocean
models that are prepared to reproduce climate variability over many centuries. Low frequency
variability and trends in OMCT ocean bottom pressure are primarily related to ongoing warming
and cooling of water masses at intermediate depths, and its secondary effects on the thermohaline
circulation. They are therefore much less reliable than the high-frequency variability and should
not be interpreted geophysically.
The basis of the atmospheric part of the AOD products are operational analyses from ECMWF -
that is, data from a numerical weather prediction model which is intended to provide best possible
state estimates and corresponding medium-range forecasts to its users. Therefore, the ECMWF is
upgraded periodically to incorporate improvements in the physical model, the numerics, the data
assimilation scheme, and to accommodate new observing technologies. Those changes to the
model consequently lead to inconsistencies in the time-series of model states (e.g. jumps), most
easily realized from series of atmospheric surface pressure at high altitudes in mountainous

GRACE AOD1B Product Description Document GR-GFZ-AOD-0001
Rev. 4.2, May 20, 2014 Page 8
regions. ECMWF model changes are usually performed about twice a year, and are announced
at the ECMWF web-pages.
1.7 AOD1B as an Operational Product of the IERS
By acknowledging the value of the AOD1B series for geodetic applications that go beyond its
primary purpose of serving as a time-variable background model for GRACE gravity processing,
AOD1B has been formally assigned the status of an 'operational product' of the Global
Geophysical Fluid Center, a data service operated within the International Earth Rotation and
Reference System Service (IERS) of the International Association for Geodesy (IAG).

GRACE AOD1B Product Description Document GR-GFZ-AOD-0001
Rev. 4.2, May 20, 2014 Page 9
2. Input Data and Models
For the calculation of the GRACE AOD1B product, different atmospheric fields and an ocean
model are required. In the following chapters the input data and the ocean model are described.
2.1 Atmospheric Data
For the de-aliasing analysis GFZ regularly extracts operational analysis data at the European
Center for Medium-range Weather Forecast (ECMWF) Integrated Forecast System (IFS) at
synoptic times 0:00, 6:00, 12:00 and 18:00. Details on the used models can be found at
http://www.ecmwf.int/research/ifsdocs/index.html. The spatial resolution is defined on a
Gaussian N160 grid which corresponds to about 0.5 latitude/longitude grid resolution.
Temperature and specific humidity profiles are represented at 60 (from 2001 till 1 February
2006), 91 (1 February 2006 till 25 June 2013) and since then at 137 vertical levels. The necessary
fields to perform the vertical integration of the atmosphere are (see below)
- Surface Pressure (PSFC)
- Multi-level Temperature (TEMP)
- Multi-level Specific Humidity (SHUM)
- Geopotential Heights at Surface (PHISFC)
and are long-term archived at GFZ´s Information System and Data Center (ISDC) for the time
span starting on July 1, 2001 until today.
To run the ocean model OMCT, the following ECMWF IFS data are acquired:
- Wind Speed at 10m height in U and V direction (U10, V10)
- Temperature at 2m level (TEMP2M)
- Surface Pressure (PSFC)
- Freshwater fluxes deduced from precipitation minus evaporation (taken from operational
forecasts) (PmE)
- Sea Surface Temperature (SST) (*)
- Specific Humidity (SHUM) (*)
- Temperature at 10m level (TEMP10M) (*)
- Charnock parameters (CHAR) (*)
(*): Necessary for the transformation to wind stress components x, y

GRACE AOD1B Product Description Document GR-GFZ-AOD-0001
Rev. 4.2, May 20, 2014 Page 10
2.2 Ocean Model OMCT
The Ocean Model for Circulation and Tides (OMCT) is a further development of the Hamburg
Ocean Primitive Equation (HOPE) model. Prognostic variables are the three-dimensional
horizontal velocity fields, the sea-surface elevation, and potential temperature and salinity. The
originally climatological HOPE model has been adjusted to the weather timescale and coupled
with an ephemeral tidal model. Implemented is a prognostic thermodynamic sea-ice model that
predicts ice-thickness, compactness, and drift. In contrast to HOPE, OMCT is discretised on a
Arakawa-C-grid and allows for the calculation of ephemeral tides and the thermohaline, wind-,
and pressure driven circulation as well as secondary effects arising from loading and self-
attraction of the water column and nonlinear interactions between circulation and tidal induced
ocean dynamics. Since tidal induced oceanic mass redistribution and corresponding gravity
effects are removed from GRACE measurements by means of another algorithm, in the OMCT
version applied here tidal dynamics are not taken into account.
Details concerning the applied model equations, numerical implementations, and
parameterizations can be found in Wolff et al. (1996), Drijfhout et al. (1996), and Thomas (2002).
A detailed discussion of the OMCT configuration used for AOD1B RL04 is given by Dobslaw
(2007). In the following, only the model components of OMCT not included in HOPE and
relevant for short-period mass redistributions are described.
Model equations and numerical implementations
The numerical model OMCT is based on nonlinear balance equations for momentum, the
continuity equation for an incompressible fluid, and conservation equations for heat and salt. The
hydrostatic and Boussinesq approximations are applied. Three-dimensional horizontal velocities,
water elevation, potential temperature as well as salinity fields are calculated prognostically;
vertical velocities are determined diagnostically from the incompressibility condition.
Implemented is a sea-ice model with viscous-plastic rheology (Hibler, 1979) allowing a
prognostic calculation of sea-ice thickness, compactness, and drift. The temporal resolution of the
originally climatological model (Drijfhout et al., 1996; Wolff et al., 1996) is 20 minutes. Twenty
layers exist in the vertical, the horizontal resolution is 1.0° in longitude and latitude on a
Arakawa-C-grid (Arakawa and Lamb, 1977) covering the global ocean including the Arctic (77°S
to 90°N). The bathymetry discretized on the 1° grid is derived from ETOPO5 and accounts for
the realistic representation of important stream barriers. Depths shallower than the uppermost
layer thickness are set to 20m.
Spinup. Initially, OMCT was spun up for 265 years with cyclic boundary conditions, that is,
climatological wind stresses (Hellermann and Rosenstein, 1983) as well as annual mean surface
temperatures and salinities (Levitus, 1982). The resulting mean circulation and internal variability
is discussed in Drijfhout et al. (1996). Starting from this climatological quasi steady-state
circulation, a real-time simulation was performed for the period 1989-2000 driven by 6-hourly
wind stresses, 2m-temperatures, freshwater fluxes, and sea level pressure from ECMWF´s latest
re-analysis ERA Interim. The resulting model state is used as initial model state for the
operational OMCT simulations driven with ECMWF´s analysis and forecast fields.
Wind stress. To reproduce the wind-driven component of the general circulation the model
requires wind stress at the ocean´s surface as forcing data. Since wind stress components are not
provided by ECMWF´s operational analyses, wind velocities 10m above the surface need to be
converted to wind stresses via
,UUCD

GRACE AOD1B Product Description Document GR-GFZ-AOD-0001
Rev. 4.2, May 20, 2014 Page 11
where is the wind stress vector at the ocean´s surface, the density of air, U the horizontal wind
vector 10m above the ocean´s surface, and CD a transfer coefficient for momentum (drag
coefficient) depending on U itself as well as on the stability of the boundary layer above the
ocean. The algo rithm is, in principle, an inversion of the transformation from wind stresses to
wind velocities done within operational ECMWF analyses and was provided by A.C.M. Beljaars
from ECMWF (Beljaars, 1997).
Steric correction, freshwater fluxes, mass conservation. Baroclinic ocean general circulation
models (OGCM) using the Boussinesq approximation conserve rather volume than mass and,
thus, artificial mass changes are introduced. Since the artificial mass variations would cause
corresponding artificial changes of ocean bottom pressure, following Greatbatch (1994) steric
anomalies are accounted for by adding/subtracting a spatially uniform layer, , to the sea-
surface (see, e.g., Ponte and Stammer, 2000; Gross et al., 2003)
where is the instantaneous density anomaly, 0 a reference density, and O, V the ocean´s
surface and volume, respectively. In the OMCT run used for AOD1B RL05, the total ocean mass
is kept constant at any time-step.
Oceanic bottom pressure. The output of the three-dimensional finite-difference code is ocean
bottom pressure in Pa, and accounts for the effects of the thermohaline, wind- and pressure driven
baroclinic circulation. Since pressure forcing is included, no assumption with respect to the
response of the ocean´s surface to atmospheric pressure is required. With the hydrostatic equation
the ocean bottom pressure, pB, as a function of latitude and longitude can be written as (cf.,
Wünsch et al., 2001)
where pA is the atmospheric pressure at sea level, g=9.80665m2/s the mean gravitational
acceleration, H the time-invariant water depth, the sea surface elevation, the time-space
dependent sea water density, and 0=1030kg/m3 a mean reference density. The impact of
individual components of the baroclinic oceanic circulation on oceanic bottom pressure and, thus,
on the Earth´s time-variable gravity field is analysed in Thomas and Dobslaw (2005).
Time-mean. From atmospheric fields and OMCT output, a mean field for the period 2001-2002
has been calculated and removed. As for the barotropic case, the baroclinic sea level, , the
density, , and consequently the bottom pressure, pB, are defined as departures from rest; thus,
these fields contain a time-mean baroclinic circulation.
Input data
Time invariant:
- bathymetry file;
Time varying: - gridded wind velocities in 10m height;
- gridded atmospheric temperature fields 2m above surface;
- gridded freshwater fluxes deduced from precipitation minus evaporation as taken from
ECMWF´s operational short range forecasts;
- gridded atmospheric pressure at sea level.
,dVO
1
V 0
,dzggpdzgpp
0
H
0A
H
AB

GRACE AOD1B Product Description Document GR-GFZ-AOD-0001
Rev. 4.2, May 20, 2014 Page 12
Output:
The model output required for AOD1B processing includes the following files:
- oceanic bottom pressure (contribution of the water column alone);
- atmospheric pressure at sea level (interpolated to OMCT grid);
- final model state and restart information for the next run.
Overview of basic model parameters
basic equations nonlinear balance equation for momentum (Navier-Stokes),
continuity equation, conservation equations for heat and salt
Coverage global, 77°S – 90°N
Topography 1.0° average of ETOPO5; minimal water depth: 20m
spatial resolution 1.0° x 1.0°; 20 levels
temporal resolution 20 minutes
Forcing wind stress/velocity, heat flux/2m-temp., atmospheric pressure
from ECMWF analyses, freshwater fluxes (precipitation minus
evaporation) from ECMWF forecasts
mass conservation Enforced
Function simulation of short-term oceanic mass redistributions due to
thermohaline, wind- and pressure driven circulation under
consideration of sea ice

GRACE AOD1B Product Description Document GR-GFZ-AOD-0001
Rev. 4.2, May 20, 2014 Page 13
3. Processing Strategy for the Ocean and Atmosphere
In this chapter the processing strategy for the ocean and the atmosphere is described and the
corresponding mean fields, necessary for the calculation of residual pressure values, are defined.
Finally, the combination of the ocean and the atmosphere is explained, which has been generally
not altered during the transition from RL04 to RL05.
Note: the equations for the atmosphere have been modified w.r.t. RL04 to describe the
latitude dependency of gravity. This latitude dependency was already implemented in
RL04, but not sufficiently described in version 3.1 of this document!
3.1 Processing Strategy OMCT
The following figure describes the processing strategy to run the baroclinic ocean model OMCT
to generate ocean bottom pressure.
Figure 4-1: Processing Strategy Ocean using OMCT (red: input, yellow: processing step, light blue:
output).
Input data are the following 6 hourly ECMWF atmospheric fields (see chapter 2.1)
- IMET_ECMWF_IFS_PSFC_A_YYYY_MM_DD_HH.grb: surface pressure
- IMET_ECMWF_IFS_U10_A_YYYY_MM_DD_HH.grb: U wind speed
- IMET_ECMWF_IFS_V10_A_YYYY_MM_DD_HH.grb: V wind speed
- IMET_ECMWF_IFS_SST_A_YYYY_MM_DD_HH.grb: sea surface temperature
- IMET_ECMWF_IFS_TEMP2M_A_YYYY_MM_DD_HH.grb: temperature at 2 m
level
- IMET_ECMWF_IFS_TEMP10M_A_YYYY_MM_DD_HH.grb: temperature at 10 m
level
- IMET_ECMWF_IFS_SHUM_A_YYYY_MM_DD_HH.grb: specific humidity

GRACE AOD1B Product Description Document GR-GFZ-AOD-0001
Rev. 4.2, May 20, 2014 Page 14
- IMET_ECMWF_IFS_PmE_for_A_YYYY_MM_DD_HH.grb: freshwater fluxes
deduced from precipitation minus evaporation according to ECMWF short term
forecasts and an initial model state of the baroclinic oceanic circulation.
- IMET_ECMWF_IFS_CHAR_A_YYYY_MM_DD_HH.grb: Charnock parameters
The ECMWF data are transformed from a N160 gaussian to a 1.0° equidistant grid. This
temporal ECMWF data base linearly interpolated to the OMCT time step of 20 minutes and
the initial ocean model state force the OMCT. As a result the ocean bottom pressure fields of
the epochs at 0, 6, 12, 18 hours are produced by OMCT. Additionally, restart information to
initiate the next OMCT run is stored.
For the later combination with the atmosphere the output grids are interpolated to 0.5° block
mean values.
The baroclinic ocean bottom pressure fields for the period 2001-2002 have been used to
calculate a mean ocean bottom pressure field which is used to derive residual bottom pressure
fields for individual time-steps.
3.2 Processing Strategy Atmosphere
To take into account the atmospheric mass variations for the calculation of the de-aliasing product
two different methods have been coded: The surface pressure (SP) and the vertical integration
(VI) approach. In the following only the VI approach, which is used for AOD1B RL05, is
described. For the SP approach we refer to the Revision 3.1 document.
Note: For the VI approach also a gravity acceleration has to be used. In the RL05 (and also
in the RL04 case, even if not explicitly noted in the Release 3.1 version of this document), a
latitude weighted value is derived from the normal WGS84 gravity at the equator and the
pole. Consequently, the following equations are slightly different than provided in the
version 3.1 of this document. But, the software and the ‘atm’ coefficients used to calculate
VI is exactly the same in version 3.1 and 4.0.
Fundamental Formulae
If the vertical structure of the atmosphere shall be taken into consideration (as for RL05) the
vertical integration of the atmospheric masses has to be performed. For this case we start with
some general basic formulas. Surface pressure data can be easily transformed into gravity
harmonics by spherical harmonic analysis with integration and by applying specific
factors for re-scaling the spherical harmonic coefficients. The gravitational potential V at
a point outside the Earth due to heterogeneous mass distribution inside the Earth is
expressed by a spherical harmonic expansion using normalized coefficients Cnm and Snm
of degree n and order m (Heiskanen and Moritz, 1967, 2-34, 2-35 with 2-40).
(3-1)
(3-2)

GRACE AOD1B Product Description Document GR-GFZ-AOD-0001
Rev. 4.2, May 20, 2014 Page 15
with the mass, volume or surface elements:
(3-3)
Introduction of this into (3-1) and (3-2) and introduction of surface load and surface pressure (see
AOD1B Product Description Document for Releases 01 to 04) results finally in
(3-4)
Using the hydrostatic equation:
(3-5)
we get:
(3-6)
The gravity acceleration in height r (gr) can be approximated from the mean gravity acceleration
g by:
(3-7)
Then we get:
(3-8)
The radial coordinate r is composed of (see figure 3-2 and (Wahr and Svensson, 1999)):

GRACE AOD1B Product Description Document GR-GFZ-AOD-0001
Rev. 4.2, May 20, 2014 Page 16
(3-9)
Figure 3-2: Radial component r used in vertical integration
ξ is the height of the mean geoid above the mean sphere r = a. h is the elevation of the Earth´s
surface above the mean geoid (Earth´s surface topography). The geopotential height a point *
above the Earth´s surface is defined by:
(3-10)
After transformation we get:
(3-11)
Then it follows:
(3-12)
This expression is substituted in (3-13): (3-13)

GRACE AOD1B Product Description Document GR-GFZ-AOD-0001
Rev. 4.2, May 20, 2014 Page 17
After including the degree dependent term into the integral (for numerical reasons) and
introducing again the elastic deformation of the solid Earth we get the following final formulas
for determination of the gravity coefficients using the vertical integration approach:
(3-14)
From the meteorological analysis centers usually not the geopotential height , but temperature
and specific humidity are available on the model or full levels and are considered constant within
the layers. Therefore, before the integration with formula (3-14) can be performed numerically,
the geopotential heights for all levels have to be computed. This computation can be done in the
following way (White, 2001, formula 2.21; Schrodin 2000, page 51) (NLevel represents the lowest
level).
(3-15)
with Φk+1/2 Geopotential height at half level (layer interfaces)
ΦS Geopotential height at surface (if provided as potential
divide by g0)
Rdry Gas constant for dry air = 287 m2/(s
2K) = 287 J/(kgK)
Tv Virtual temperature
P k+1/2 Pressure at half level (layer interface)
THTv )608.01( (3-16)
H specific Humidity
T Temperature

GRACE AOD1B Product Description Document GR-GFZ-AOD-0001
Rev. 4.2, May 20, 2014 Page 18
(3-17)
ak+1/2 Model dependent coefficient
bk+1/2 Model dependent coefficient
Both coefficients are provided in ECMWF GRIB files, for DWD
see Schroding 2000, p.51)
The geopotential heights at pressure levels finally can be used to compute the inner integral in (3-
14). In the second term ξ/a, the mean geoid above the sphere r=a can be approximated by the
geopotential height at the Earth´s surface which is available at ECMWF.
Processing Sequence
Starting points are point values of surface pressure and geopotential height grids on the Earth’s
surface (surface is defined as a half level)and point values of temperature and specific humidity at
all model levels (full levels) of the atmospheric model in the same global grid. All these
equiangular point grids are transformed to block mean grids by applying a mean value operator to
the 4 corner points. Then the pressure at all model half levels (formula 3-17) is computed by
using the atmospheric model specific interpolation coefficients (a, b). These pressure values, the
virtual temperature, which is computed from the real temperature and the specific humidity in
each model full level (3-16) and the surface geopotential heights are used to compute the
geopotential heights for all half levels. For this also a gravity acceleration has to be used. In the
RL05 (and also in the RL04 case, even if not explicitly noted in the Release 3.1 version of this
document), a latitude weighted value is derived from the normal WGS84 gravity at the equator
and the pole. Then the integration is done numerically for each degree separately using the
geopotential heights of the model levels. These intermediate results are stored in a three
dimensional array with longitude, latitude and degree as indices. Finally the spherical harmonic
analysis is performed for each degree of the spherical harmonic series separately, in order to take
into account the degree dependent exponent in equation (3-14). Finally the complete spherical
harmonic series is written on a binary spherical harmonic series file which is input to derive the
final ASCII AOD1B product.
To analyze gravity variations caused by atmospheric vertical integrated pressure variations a
corresponding mean field covering at least one year of data has to be subtracted (in order to
eliminate seasonal effects in the mean field) from the inner integral of above equation 3-14 (see
also chapter 3.3). After subtraction of the mean pressure field residual pressure data, which
represent mass variations with respect to the mean field are available:
(3-18)
For a better clarification of this processing sequence a pseudo code is provided below.
Read global surface pressure from GRIB file
IMET_ECMWF_IFS_PSFC_A_YYYY_MM_DD_HH.grb
Read global surface geopotent. height from GRIB file
IMET_ECMWF_IFS_PHISFC_A_YYYY_MM_DD_HH.grb
Read global model level temperatures from GRIB file

GRACE AOD1B Product Description Document GR-GFZ-AOD-0001
Rev. 4.2, May 20, 2014 Page 19
IMET_ECMWF_IFS_TEMP_A_YYYY_MM_DD_HH.grb
Read global model level specific humidity from GRIB file
IMET_ECMWF_IFS_SHUM_A_YYYY_MM_DD_HH.grb
Compute for all global data sets block mean values
Do for all block means in the global grid files
Do for all model levels
Compute pressure at model level (3-17)
Compute virtual temperature a model level (3-16)
Compute geopotential height of model level by summing up individual heights
and add surface geopotential height (3-15)
Compute expression in large brackets of inner integral in (3-14)
Do for all degrees of spherical harmonic series
Apply exponent and do numerical integration by multiplication with pressure
difference of model levels and summation of all model levels
Store result in temporary 3-D field with long., latitude and degree as indices
End Do
End Do
End Do
Do for all degrees of spherical harmonic series
Subtract mean contribution for this degree by reading it from a separate file
Perform spherical harmonic analysis for this degree using the temporary 3-D field (3-14)
Store coefficients of this degree in result vector
End Do
Write spherical harmonic series to output file
3.3 Mean Ocean and Atmospheric Pressure Fields
To calculate mass anomalies that represent the deviation from a certain reference state, a long-
term average is calculated for each component, i.e., the 3D atmospheric mass distribution, as well
as the oceanic and atmospheric contributions to ocean bottom pressure. For RL05, those mean
fields are calculated for the time period 2001+2002.
3.4 Coefficients available in AOD1B: atm, ocn, glo, oba
The different coefficient sets contained in AOD1B that represent the individual and combined
effect of atmosphere and ocean are calculated in the following way:
'atm': difference between vertically integrated density of the atmosphere and the corresponding
mean field
'ocn': difference between the water column contribution to ocean bottom pressure and the
corresponding mean field
'glo': sum of 'atm' and 'ocn' mass anomalies
'oba': sum of the water column contribution to the ocean bottom pressure anomalies (i.e., the 'ocn'
data-set) and the atmospheric contribution to ocean bottom pressure anomalies (i.e., the
difference between the atmospheric contribution to ocean bottom pressure and the corresponding
mean field). In contrast to 'glo', this data-set is set to zero at the continents.
All four sets of mass anomalies are subsequently transformed into Stokes coefficients. Please note
that although they are provided within the AOD1B products, the degree 0 and 1 terms shall not be
used during determination of GRACE products.

GRACE AOD1B Product Description Document GR-GFZ-AOD-0001
Rev. 4.2, May 20, 2014 Page 20
3.5 Consideration of Atmospheric Tides
Atmospheric tides that are primarily excited in the middle atmosphere are most prominent at
frequencies of one (i.e., S1) and two (i.e., S2) cycles per solar day. Periodic changes are also
present in surface pressure and wind fields, thereby causing an additional oceanic response to
atmospheric tides (Dobslaw and Thomas, 2005a).
Signals from atmospheric tides are fully retained in the vertically integrated atmospheric part of
AOD1B. However, S2 corresponds to the Nyquist frequency for 6-hourly resolved data-sets,
implying that only a fraction of the signal at this period can be reconstructed.
Therefore, the recommendation for GRACE Precise Orbit Determination (POD) and avoidance of
double bookkeeping using the atmospheric part of AOD1B is as follows:
Reduce S2 at 0h, 6h, 12h and 18h from AOD1B using the atmospheric tide model applied
in POD
Apply the atmospheric tide model for each integration step size during POD
In the oceanic part of AOD1B, S1 signals are retained as well. However, variability at the S2
frequency is not included in the oceanic contribution to ocean bottom pressure: Since S2 is
among the largest ocean tides, it is separately accounted for by means of a separate ocean tide
model. Those models are typically constrained by satellite altimetry or other sea-level
observations that do not distinguish between gravitationally induced tides and pressure induced
tides as long as they are acting at the same frequency. It is therefore assumed that the oceanic
response to atmospheric tides at the S2 frequency is contained in the tide model: it is therefore not
appropriate to introduce it into POD for a second time via AOD1B.
Consequently, the atmospheric contribution to ocean bottom pressure as simulated by OMCT
does not include signals at S2. The difference between 'glo' and 'oba' over the oceans therefore
represents the difference between both the vertically distributed atmospheric masses and surface
pressure, and the effect of the semidiurnal atmospheric tide S2.
3.6 Time-Averaged AOD1B Products: GAA, GAB, GAC, and GAD
In order to allow users to re-introduce time-mean signal parts that have been removed during the
gravity field processing by applying AOD1B, monthly mean gravity fields prepared by the SDS
Centers are routinely accompanied by time-averaged AOD1B products. Those products are
always averaged over whole days, regardless of whether full or partial day's data were used in
creating the particular GRACE monthly gravity field.
'GAA': monthly average of 'atm' coefficients
'GAB': monthly average of 'ocn' coefficients
'GAC': monthly average of 'glo' coefficients
'GAD': monthly average of 'oba' coefficients
Please note that - as with the daily AOD1B products - the GAA to GAD products include degree
0 and 1 terms. Users shall be aware not to apply these coefficients in their calculations.
When using these Level-2 products it is recommended to filter first the GSM monthly gravity
products (e.g. by applying Gaussian or Kusche DDK filters) and then to add the corresponding
GAx products (without additional filtering).

GRACE AOD1B Product Description Document GR-GFZ-AOD-0001
Rev. 4.2, May 20, 2014 Page 21
3.7 Discontinuities in atmospheric pressure data and associated correction products GAE and GAF
The basis of the atmospheric part of the AOD1B products are operational analyses from ECMWF
- that is, data from a numerical weather prediction model which is intended to provide best
possible state estimates and corresponding medium-range forecasts to its users. Therefore, the
ECMWF is upgraded periodically to incorporate improvements in the physical model, the
numerics, the data assimilation scheme, and to accommodate new observing technologies. Those
changes to the model consequently may lead to inconsistencies in the time-series of model states,
mostly visible in time series of atmospheric surface pressure at high altitudes in mountainous
regions.
These in-homogeneities consist in positive and negative jumps of surface pressure and surface
geopotential time series at specific locations (e.g. high elevation points, Fig. 3-3). Between 2001
and May 2013 these jumps occurred two times:
1) between 2006-01-29 18h and 2006-01-30 00h
2) between 2010-01-26 00h and 2010-01-26 06h
Figure 3-3: 6-hourly surface pressure variation between January 2001 and June 2012 at a location in Chile
(left) and over Mount Everest (right). Two discontinuities are visible in January 2006 and January 2010.
We observed that those inconsistencies are strictly associated with upgraded horizontal and
vertical resolution at ECMWF.
Jumps in the surface pressure and surface geopotential time series propagate through the vertical
integration and spherical harmonics analysis affecting the resulting gravity field. Therefore, they
can lead to wrong regional trend estimation of mass variations over a time span that includes one
or both of these jumps.
In order to overcome this problem, a correction strategy for the de-aliasing products is needed.
Since only atmospheric parameters are affected, also only 'atm' and 'glo' coefficients need to be
corrected. An accurate approach would be to add supplementary AOD1B products to the 6-
hourly AOD1B data sets 'atm' and 'glo' during GRACE Precise Orbit Determination (POD). The
derived gravity solutions as well as the monthly averages 'GAA' and 'GAC' would then be free
from errors (jumps) present in the atmospheric input data. Unfortunately, for this purpose, all
GSM-solutions would have to be reprocessed with the corrected AOD1B. This is not doable for
RL05 at the moment, but is planned for a future RL06. There we plan to reprocess 6-hourly
(jump) corrected AOD1B which can then be applied to derive improved RL06 gravity field
solutions. Also, we will check routinely resolution changes at ECMWF. If a new jump appears,

GRACE AOD1B Product Description Document GR-GFZ-AOD-0001
Rev. 4.2, May 20, 2014 Page 22
we will estimate new correction coefficients and consequently apply them at the AOD1B level
without the need of additional Level-2 products such as 'GAE' and 'GAF' as described below.
Till then, as an intermediate solution, we neglect the error introduced at orbit level and suggest
correcting the atmospheric and oceanic temporal-averaged products 'GAA' and 'GAC' by using
two additional products called 'GAE' and 'GAF', which correct the jumps in January 2006 and
January 2010. The 'atm' and 'glo' coefficients to derive 'GAE' and 'GAF' are estimated by
comparing the standard atmosphere coefficients with independently generated coefficients based
on ECMWF ERA-Interim reanalysis. The latter is known to be more homogenous and stable in
time and therefore more appropriate for long-term analysis (e.g. trend analysis).
The basic ideas and the computation of these new products is described in the following more
detailed:
t1 = 2006-01-30 00h (exact occurrence of the first jump)
t2 = 2010-01-26 06h (exact occurrence of the second jump)
- We first calculate 6h differences after and before the jumps of standard 'atm' coefficients.
For the first jump: 'atm' at t1 minus 'atm' at 2006-01-29 18h. For the second jump: 'atm' at
t2 minus 'atm' at 2010-02-26 00h. These atmospheric gravity variations include the true
6h 'atm' differences plus an error due to the jump (Fig. 3-4).
- We calculate the same 6h differences of new 'atm' coefficients generated using
atmospheric input parameters from ERA-Interim. We assume that these new atmospheric
gravity variations represent the true (unbiased) 6h 'atm' differences (Fig. 3-5).Note that
for the ERA-Interim products a corresponding mean field based on ERA-Interim data for
the years 2001 and 2002 has to be calculated and removed.
- Calculation of jump correction coefficients J1 for the time span between t1 and t2 result
as the difference between the new and the standard atmospheric gravity variations at t1
(Fig. 3-6 left). Since J1 is constant in time, the monthly average 'GAE' is equal to J1.
- Calculation of correction coefficients J2 for the time after t2 result as the difference
between the new and the standard atmospheric gravity variations at t2 plus J1 (Fig. 3-6
right). Again, the monthly average 'GAF' is equal to J2.
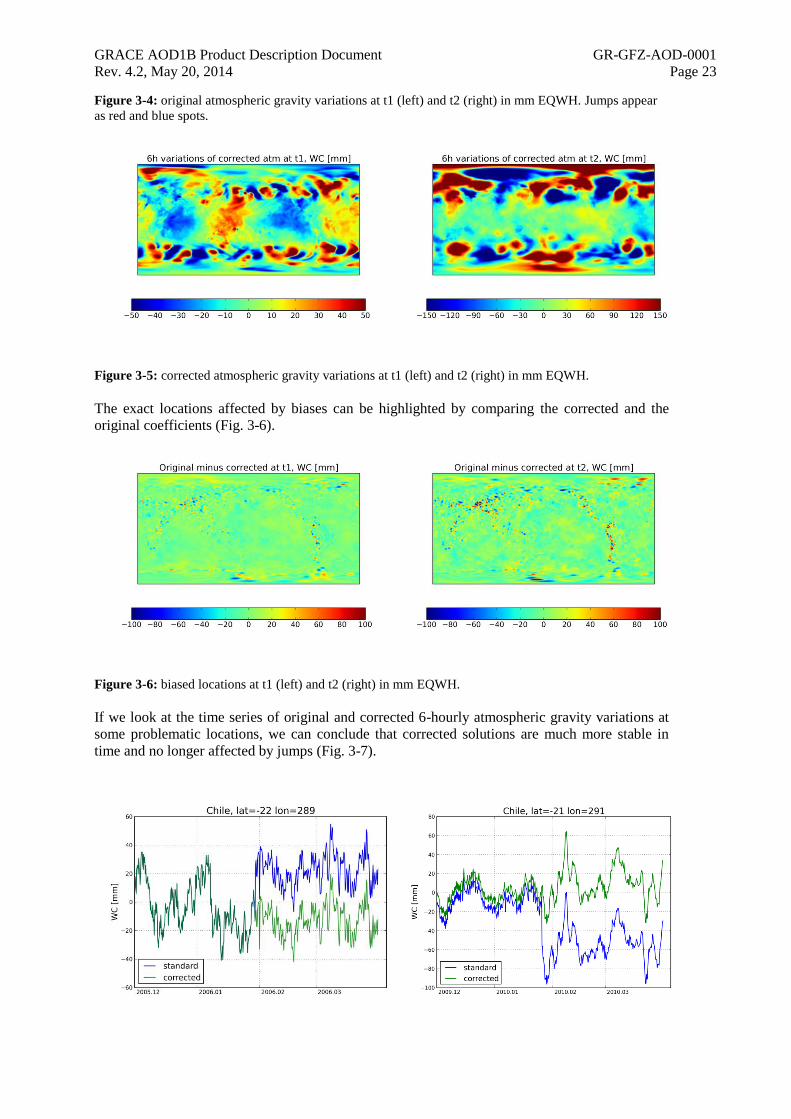
Fig. 3-4 shows 6-hourly atmospheric gravity variations expressed in equivalent water height
(EQWH) at t1 (left) and t2 (right). Besides realistic signatures of surface pressure variations one
can notice spurious artifacts in form of negative (blue) and positive (red) spots. Fig. 3-5 shows the
same 6-hourly gravity variations but this time with corrected 'atm'. Patterns are smoother and
previous artifacts disappear in both cases.
GRACE AOD1B Product Description Document GR-GFZ-AOD-0001
Rev. 4.2, May 20, 2014 Page 23
Figure 3-4: original atmospheric gravity variations at t1 (left) and t2 (right) in mm EQWH. Jumps appear
as red and blue spots.
Figure 3-5: corrected atmospheric gravity variations at t1 (left) and t2 (right) in mm EQWH.
The exact locations affected by biases can be highlighted by comparing the corrected and the
original coefficients (Fig. 3-6).
Figure 3-6: biased locations at t1 (left) and t2 (right) in mm EQWH.
If we look at the time series of original and corrected 6-hourly atmospheric gravity variations at
some problematic locations, we can conclude that corrected solutions are much more stable in
time and no longer affected by jumps (Fig. 3-7).
GRACE AOD1B Product Description Document GR-GFZ-AOD-0001
Rev. 4.2, May 20, 2014 Page 24
Figure 3-7: standard and corrected atmospheric gravity variations at a location in Chile for t1 (left) and t2
(right).
The global effect on gravity field is represented by the GAE and GAF products themselves. The
corrected gravity fields differ from the original ones by a latitude and longitude dependent time-
constant bias. Between February 2006 and January 2010 the bias is exactly GAE and after
February 2010 it is GAF.
The GAE and GAF products (monthly average of 'atm' correction coefficients) are recommended
to be used for the following periods:
1) GAE to be used between February 2006 (included) and January 2010 (included).
2) GAF to be used after February 2010 (included).
Users who are not interested in introducing back oceanic and atmospheric signals (e.g.
hydrologists), have the possibility to correct gravity field solutions with reduced atmosphere and
ocean (the standard ‘GSM’ products) by subtracting GAE (between February 2006 and January
2010) and GAF (after February 2010) from GSM. Introducing also a filter technique for GSM
(e.g. DDK2 in the following) the correct procedure would look like
1) Subtract GAE or GAF from the current RL05 GSM L2 model (still including the jumps)
2) Filter the result with e.g. DDK2
3) The difference between the original and corrected GSM is
GSM(DDK2) – (GSM-GAE)(DDK2) or
GSM(DDK2) – (GSM-GAF)(DDK2)
and is the filtered GAE or GAF product shown in Fig. 3-8
Users who are interested in introducing back oceanic and atmospheric signals (e.g.
oceanographers) have to apply the following procedure, e.g. for GAC
1) Subtract GAE or GAF from the current RL05 GSM L2 model (still including the jumps)
2) Filter the result with e.g. DDK2
3) Add GAC plus GAE or GAF (without filtering!)
4) The difference between the original and corrected GSM + GAC is
[GSM(DDK2) + GAC] – [(GSM-GAE)(DDK2) + (GAC+GAE)] or
[GSM(DDK2) + GAC] – [(GSM-GAF)(DDK2) + (GAC+GAF)]
and is the difference between the unfiltered GAE/GAF and filtered GAE/GAF products
shown in Fig. 3-9.

GRACE AOD1B Product Description Document GR-GFZ-AOD-0001
Rev. 4.2, May 20, 2014 Page 25
Figure 3-8: DDK2 filtered GAE (left) and GAF (right) correction coefficients in mm EQWH.
The “netto correction” for the second case (re-adding GAA or GAC) is the difference between the
unfiltered GAE/GAF (see Fig. 3.6) and filtered GAE/GAF (see Fig. 3.8) result and is shown in
Fig. 3-9. From this it can be seen that the spurious signals indeed only affect land areas. Filtered
GAF values present a range of 53 mm clearly greater than the 37 mm of filtered GAE, since both
jumps add up to GAF. Some descriptive statistics are shown in Table 3-1.
Figure 3-9: Difference between unfiltered and filtered GAE (left) and GAF (right) correction coefficients
in mm EQWH.
In order to verify if the proposed intermediate solution (a-posteriori correction of Level-2 gravity
field products by GAE/GAF) is a good approximation of the accurate one (corrected AOD1B
used in POD), we calculated the corresponding effect for January and February 2010 (Fig. 3-10).
The global differences present considerable low mean (-0.01 mm EQWH for both months) and
standard deviation (1.1 mm EQWH for January and 0.7 mm EQWH for February). We can notice
a slightly worse performance in January, probably due to the fact that the jump occurs on the 26th
and GAE ignores the last four days of the month. Nevertheless, we can conclude that the error,
also for the minimum and maximum values, introduced by the proposed provisional solution is
negligible w.r.t. the current GRACE error level (see Table 3-1).

GRACE AOD1B Product Description Document GR-GFZ-AOD-0001
Rev. 4.2, May 20, 2014 Page 26
Figure 3-10: monthly gravity field difference in mm EQWH between the accurate and intermediate
approach for January 2010 (left) and February 2010 (right).
Table 3-1: statistical information on GAE, GAF, and on the difference of the accurate and intermediate
method (all derived applying a DDK2 filter)

GRACE AOD1B Product Description Document GR-GFZ-AOD-0001
Rev. 4.2, May 20, 2014 Page 27
4. Available Releases of the AOD1B Product
The following releases of AOD1B are available at the archives. Although this document release is
intended to describe RL05 only, the history of previous release might be interesting for the user.
For details on RL00 till RL04 see also Release 3.1 of this document.
Release Period Ocean
Model
Mean Field S2 Tide
Atmosphere(3)
S2 Tide
Ocean
RL00 June 2000-April 2003 (1)
PPHA 2001 Included Included
RL01 June 2000-June 2007 PPHA 2001 Included Included
RL02 (2)
PPHA 2001+2002 Included Removed(4)
RL03 Jan 2002-January 2007 OMCT(5)
2001+2002 Included Removed(4)
RL04 Jan 2001-April 2012 OMCT(6)
2001+2002 Included Removed(4)
RL05 Jan 2001-today OMCT(7)
2001+2002 Included Removed (4)
(1) RL00 generation stopped in April 2003 and was substituted by RL01. Both AOD products are
exactly the same, except that besides the global combined mass variation also the atmospheric
and oceanic contributions are provided in the RL01 AOD1B product
(2) Only available for May 2003, July 2003, August 2003, September 2003, November 2003,
February 2004, December 2004 and January 2005
(3) The S2 atmospheric tide is still included in the atmospheric part of the AOD1B products.
When using an atmospheric tide model in POD users might have to avoid a double book-keeping
by reduction of the S2 part from the AOD1B using their atmospheric tide model prior to POD.
(4) The S2 atmospheric tide was removed from surface pressure before forcing PPHA or OMCT
using a strategy described in Ponte and Ray (2002). This is done to avoid double-modeling, once
in the ocean’s response to pressure variations and once in the altimetric ocean tide models.
Consequently, users should take care to use an ocean tide model which has the total (gravitational
plus atmospheric) S2 tide in!
(5) The RL03 OMCT outputs were calculated with the condition of vanishing net freshwater
fluxes during the period Jan 2002 to December 2004. Since January 2005 this condition is
replaced by a condition that instantaneously conserves mass. As a consequence, gravity field
products of the period January 2002 to December 2004 corrected with this version of OMCT
show artificial slopes over land which has to be corrected by the corresponding GAB products
(for definition see below).GRACE users which are analyzing GFZ RL03 or JPL RL02 time-series
are referred to GRACE Technical Note #04 for further information.
(6) To overcome the RL03 problems, all RL04 OMCT outputs were calculated by a condition that
instantaneously conserves mass. Additionally, the OMCT RL04 bathymetry was adjusted to the
AOD1B software land-ocean mask (used to combine atmospheric and oceanic contributions), the
thermodynamic sea ice model was updated and a new data set for surface salinity relaxation was
taken into account. Besides the 6-hourly atmosphere, ocean and combined mass variations, RL04
also provides simulated OMCT ocean bottom pressure anomalies: the so-called 'oba' coefficients.
(7) The generation of RL01 and RL04 has been stopped according to above table and it was
continued with the routine generation of RL05 only.
GRACE AOD1B Product Description Document GR-GFZ-AOD-0001
Rev. 4.2, May 20, 2014 Page 28
5. AOD1B and OCN1B Format and Content Description
In the following chapters the output format and the content of the atmosphere and ocean de-
aliasing product (AOD1B) is described.
AOD1B products are regularly updated in the GRACE ISDC on a daily basis using the GRACE
level-1 filename convention “AOD1B_YYYY-MM-DD_S_RL.EXT.gz” (Case et al., 2002)
where “YYYY-MM-DD” is the corresponding date, the GRACE satellite identifier “S” is fixed to
X (meaning product cannot be referred to GRACE-A or -B), RL is an increasing release number
and EXT is fixed to asc (ASCII data). For data transfer simplification the products are gnu-zipped
(suffix “gz”).
Each file consists of a header with a dedicated number of lines (NUMBER OF HEADER
RECORDS) and ends with a constant header line (END OF HEADER). The first part of the
header is based on the level-1 instrument product header convention (Case et al., 2002) and gives
more general information on the product (header lines PRODUCER AGENCY to PROCESS
LEVEL). These lines are accomplished by a certain number of header lines describing the de-
aliasing product more precisely like
PRESSURE TYPE (SP OR VI) : Surface Pressure or Vertical Integration approach
MAXIMUM DEGREE : The maximum degree of the spherical harmonic
series
COEFFICIENT ERRORS (YES/NO) : Yes, if errors are added to the coefficients
COEFF. NORMALIZED (YES/NO) : YES, if the coefficients are normalized
CONSTANT GM [M^3/S^2] : GM value used for computation
CONSTANT A [M] : semi-major axis value used for computation
CONSTANT FLAT [-] : flattening value used for computation
CONSTANT OMEGA [RAD/S] : Earth rotation rate used for computation
NUMBER OF DATA SETS : Number of data fields per product
DATA FORMAT (N,M,C,S) : Format to read the data (depending on header line
The NUMBER OF DATA SETS is 12 or 16 (RL04 and RL05) because for each 6-hours 3 or 4
(RL04 and RL05) different spherical harmonic series (incl. degree 0 and 1) up to a MAXIMUM
DEGREE (defined in the header, 100 for all releases) are provided (see also comment 6 in
chapter 4). Before calculation of these spherical harmonic series the 0.5º block means are defined
as follows (also depending on PRESSURE TYPE (SP OR VI) defined in the header):
1. DATA SET TYPE “glo” (GLObal atmosphere and ocean combination):
Land: [SP-SP(mean)] or [VI-VI(mean)]
Defined ocean area: [ocean-ocean(mean) + SP-SP(mean)] or [ocean-ocean(mean) + VI-
VI(mean)]
Undefined ocean area: 0
2. DATA SET TYPE “atm” (global ATMosphere):
Land area: [SP-SP(mean)] or [VI-VI(mean)]
Defined ocean area: [SP-SP(mean)] or [VI-VI(mean)]
Undefined ocean area: [SP-SP(mean)] or [VI-VI(mean)]
3. DATA SET TYPE “ocn” (OCeaN area):
Land: 0
Defined ocean: ocean-ocean(mean)
Undefined ocean: 0

GRACE AOD1B Product Description Document GR-GFZ-AOD-0001
Rev. 4.2, May 20, 2014 Page 29
4. DATA SET TYPE “oba” (Ocean Bottom pressure Analysis, only RL04 and RL05):
Land: 0
Defined ocean: [ocean-ocean(mean) + SP-SP(mean)] (see Note 2 below!)
Undefined ocean: 0
The following is an example for the AOD1B_2002-05-01_X_05.asc RL05product, where for
simplification only the two first and last coefficients of each data set are given:
PRODUCER AGENCY : GFZ
PRODUCER INSTITUTION : GFZ
FILE TYPE ipAOD1BF : 999
FILE FORMAT 0=BINARY 1=ASCII : 1
NUMBER OF HEADER RECORDS : 29
SOFTWARE VERSION : atm_ocean_dealise.05
SOFTWARE LINK TIME : Not Applicable
REFERENCE DOCUMENTATION : GRACE De-aliasing ADD
SATELLITE NAME : GRACE X
SENSOR NAME : Not Applicable
TIME EPOCH (GPS TIME) : 2000-01-01 12:00:00
TIME FIRST OBS(SEC PAST EPOCH): 389102348.816000 (2012-04-30 23:59: 8.82)
TIME LAST OBS(SEC PAST EPOCH) : 389188748.816000 (2012-05-01 23:59: 8.82)
NUMBER OF DATA RECORDS : 82416
PRODUCT CREATE START TIME(UTC): 2012-06-25 15:06:18.000
PRODUCT CREATE END TIME(UTC) : 2012-06-25 15:29:18.000
FILESIZE (BYTES) : 3299112
FILENAME : AOD1B_2012-05-01_X_05.asc
PROCESS LEVEL (1A OR 1B) : 1B
PRESSURE TYPE (SP OR VI) : VI
MAXIMUM DEGREE : 100
COEFFICIENT ERRORS (YES/NO) : NO
COEFF. NORMALIZED (YES/NO) : YES
CONSTANT GM [M^3/S^2] : 0.39860044150000E+15
CONSTANT A [M] : 0.63781364600000E+07
CONSTANT FLAT [-] : 0.29825765000000E+03
CONSTANT OMEGA [RAD/S] : 0.72921150000000E-04
NUMBER OF DATA SETS : 16
DATA FORMAT (N,M,C,S) : (2(I3,X),E15.9,X,E15.9)
END OF HEADER
DATA SET 01: 5151 COEFFICIENTS FOR 2002-05-01 00:00:00 OF TYPE atm
0 0 -.666624533E-10 0.000000000E+00
1 0 0.190851967E-09 0.000000000E+00
…
100 99 0.358595920E-13 -.775798222E-13
100 100 -.232602751E-13 -.428385882E-13
DATA SET 02: 5151 COEFFICIENTS FOR 2002-05-01 00:00:00 OF TYPE glo
0 0 -.666624533E-10 0.000000000E+00
1 0 -.134104180E-09 0.000000000E+00
...
100 99 0.476333557E-13 -.706918867E-13
100 100 -.471617805E-13 -.410401989E-13
DATA SET 03: 5151 COEFFICIENTS FOR 2012-05-01 00:00:00 OF TYPE oba
0 0 0.495506969E-09 0.000000000E+00
1 0 0.667669143E-11 0.000000000E+00
...
100 99 0.707426096E-14 -.632682187E-14
100 100 -.593949867E-14 0.962139597E-14
DATA SET 04: 5151 COEFFICIENTS FOR 2012-05-01 00:00:00 OF TYPE ocn
0 0 -.111022302E-15 0.000000000E+00
1 0 -.324956147E-09 0.000000000E+00
...
DATA SET 13: 5151 COEFFICIENTS FOR 2012-05-01 18:00:00 OF TYPE atm
0 0 -.698412439E-10 0.000000000E+00
1 0 0.186100398E-09 0.000000000E+00
...
100 99 0.371270413E-13 -.844661759E-13

GRACE AOD1B Product Description Document GR-GFZ-AOD-0001
Rev. 4.2, May 20, 2014 Page 30
100 100 -.249752352E-13 -.383175966E-13
DATA SET 14: 5151 COEFFICIENTS FOR 2012-05-01 18:00:00 OF TYPE glo
0 0 -.698412439E-10 0.000000000E+00
1 0 -.655994406E-10 0.000000000E+00
...
100 99 0.484388333E-13 -.899935159E-13
100 100 -.505244072E-13 -.389103461E-13
DATA SET 15: 5151 COEFFICIENTS FOR 2012-05-01 18:00:00 OF TYPE oba
0 0 0.579448711E-09 0.000000000E+00
1 0 0.367351372E-10 0.000000000E+00
...
100 99 0.343878180E-14 -.165026313E-13
100 100 -.993987841E-14 0.104389398E-13
DATA SET 16: 5151 COEFFICIENTS FOR 2012-05-01 18:00:00 OF TYPE ocn
0 0 0.000000000E+00 0.000000000E+00
1 0 -.251699838E-09 0.000000000E+00
.
100 99 0.113117920E-13 -.552733997E-14
100 100 -.255491720E-13 -.592749436E-15

GRACE AOD1B Product Description Document GR-GFZ-AOD-0001
Rev. 4.2, May 20, 2014 Page 31
6. References
General References on Atmosphere and Ocean De-aliasing
Case K., Kruizinga, G., Wu, S.; GRACE Level 1B Data Product User Handbook; JPL Publication
D-22027, 2002
Fagiolini, E., L. Zenner, F. Flechtner, T.Gruber, G. Schwarz, T. Trautmann und J. Wickert
(2007). The Sensitivity of Satellite Gravity Field Determination to Uncertainties in
AtmosphericModels. In: Joint GSTM / SPP Kolloquium, Potsdam.
Farrel W.E.; Deformation of the Earth by Surface Loads; Review of Geophysics, Vol. 10, p. 761-
797, 1972
Foldvary L., Fukuda Y.; IB and NIB Hypotheses and Their Possible Discrimination by GRACE,
Geophysical Research Letters, Vol.28, No. 4, p. 663-666, 2001.
Gegout P., Cazenave A.; Temporal Variations of the Earth Gravity Field for 1985-1989 derived
from Lageos; Geophysical Journal International, Vol. 114, p. 347-359, 1993
Heiskanen W.A., Moritz H., Physical Geodesy; W.H. Freeman Publications Co., San Francisco,
1967
Pekker T.; Comparison of the Influence of Real Vertical Mass Distribution in the Atmosphere
versus Surface Pressure Representing Atmospheric Mass on Time Dependent Gravity;
Internal Report Center for Space Research at University of Texas in Austin, 2001.
Persson A.; User Guide to ECMWF Forecast Products; Meteorological Bulletin M3.2, ECMWF,
2000
Ponte R., Ali, A.H.; Rapid ocean signals in polar motion and length of; Geophysical Research
Letters, Vol. 29, Articel 1711, 2002
Ponte R., Gaspa P.; Regional Analysis of the Inverted Barometer Effect over the Global Ocean
Using TOPEX/POSEIDON Data and Model results; Journal of Geophysical Research, Vol.
104, No. C7, p. 15587-15601, 1999
Ponte, R., Ray, R .: Atmospheric pressure corrections in geodesy and oceanography: A strategy
for handling tides, Geophys. Res. Lett., 29(24), L2153, doi: 10.1029/2002GL016340, 2002.
Schrodin R. (Ed.); Quarterly Report of the Operational NWP-Models of the
DeutscherWetterdienst; No. 22, Dec. 1999- Feb. 2000
Swenson S., Wahr J.; Estimated Effects of the Vertical Structure of Atmospheric Mass on the
Time-Variable Geoid; Paper submitted to Journal of Geophysical Research – Solid Earth,
1999
Vedel H.; Conversion of WGS84 Geometric Heights to NWP Model HIRLAM Geopotential
Heights; Danish Meteorlogical Institute – Scientific Report 00-04, 2000
Velicogna, I., Wahr, J., Van den Dool, H.; Can Surface Pressure be used to remove atmospheric
contributions from GRACE data with sufficient accuracy to recover hydrological signals?;
Journal of Geophysical Research, Vol. 106, No. B8, p. 16415-16434, 2001
White P.W. (Ed.); IFS Documentation Part III: Dynamics and Numerical Procedures (CY21R4);
ECMWF Research Department, 2001
References on Baroclinic Ocean Model OMCT
Accad, Y., and C.L. Pekeris, Solution of the tidal equations for the M2 and S2 tides in the
world oceans from a knowledge of the tidal potential alone, Phil. Trans. R. Soc.
London Ser. A, 290, 235-266, 1978.
Arakawa, A., and V.R. Lamb, Computational design of the basic dynamical processes of
the UCLA general circulation model, Meth. Comput. Phys., 17, 173-265, 1977.
Dobslaw, H., Modellierung der allgemeinen ozeanischen Dynamik zur Korrektur und
Interpretation von Satellitendaten, Sci. Techn. Rep. 04/07, GFZ Potsdam, available at
GRACE AOD1B Product Description Document GR-GFZ-AOD-0001
Rev. 4.2, May 20, 2014 Page 32
http://ebooks.gfz-
potsdam.de/pubman/item/escidoc:8750:3/component/escidoc:8749/0710.pdf, 2007.
Dobslaw, H., and M. Thomas, Atmospheric induced ocean tides from ECMWF forecasts,
Geophys. Res. Lett., 32, L10615, 2005.
Dobslaw, H., and M. Thomas, Simulation and observation of global ocean mass
anomalies. J. Geophys. Res., 112, C05040, 2007.
Dobslaw, H., Flechtner, F., Bergmann-Wolf, I., Dahle, Ch., Dill, R., Esselborn, S.,
Sasgen, I., and M. Thomas, Simulating High-Frequency Atmosphere-Ocean Mass
Variability for De-Aliasing of Satellite Gravity Observations: AOD1B RL05, J.
Geophys. Res., 118, 10.1002/jgrc.20271, 2013.
Beljaars, A.C.M., Air-sea interaction in the ECMWF model, ECMWF seminar
proceedings on: Atmosphere-surface interaction, 8-12 September 1997, p. 33-52,
Reading, 1997.
Chambers, D.P., Wahr, J., Nerem, R.S., Preliminary observations of global ocean mass
variations with GRACE, Geophys.Res. Lett., 31, L13310,
doi:10.1029/2004GL020461, 2004.
Drijfhout, S., C. Heinze, M. Latif, and E. Maier-Reimer, Mean circulation and internal
variability in an ocean primitive equation model, J. Phys. Oceanogr., 26, 559-580,
1996.
Greatbach, R.J., A note on the representation of steric sea level in models that conserve
volume rather than mass, J. Geophys. Res., 99, 12,767-12,771, 1994.
Gross, R.S., I. Fukumori, and D. Menemenlis, Atmospheric and oceanic excitation of the
Earth’s wobbles during 1980-2000, J. Geophys. Res., 108(B8), 2370, doi:
10.1029/2002JB002143, 2003.
Hellerman, S., and M. Rosenstein, Normal monthly wind stress over the world ocean
with error estimates, J. Phys. Oceanogr., 13, 1093-1104, 1983.
Hibler III, W.D., A dynamic thermodynamic sea ice model, J. Phys. Oceanogr., 9, 815-
846, 1979.
Levitus, S., Climatological atlas of the world ocean, NOAA Professional Paper, 13, 173
pp., U.S. Department of Commerce, 1982.
Ponte, R.M., and D. Stammer, Global and regional axial ocean angular momentum
signals and length-of-day variations (1985-1996), J. Geophys.Res., 105, 17,161-
17,171, 2000.
Thomas, M., Ocean induced variations of Earth´s rotation – Results from a simultaneous
model of global circulation and tides, Ph.D. diss., 129 pp., Univ. of Hamburg,
Germany, 2002.
Thomas, M., and H. Dobslaw, On the impact of baroclinic ocean dynamics on the Earth’s
gravity field, Proceedings Joint CHAMP/GRACE Science Team Meeting, Potsdam,
2004, available at http://edoc.gfz-
potsdam.de/gfz/get/13998/0/af144247702d6833d9d85b994e36fe01/13998.pdf
Wolff, J.O., E. Maier-Reimer, and S. Legutke, The Hamburg Ocean Primitive Equation
Model HOPE, Technical Report No. 13, DKRZ, Hamburg, 103pp, 1996.
Wünsch, J., M. Thomas, and T. Gruber, Simulation of oceanic bottom pressure for
gravity space missions, Geophys. J. Int., 147, 428-434, 2001.

GRACE AOD1B Product Description Document GR-GFZ-AOD-0001
Rev. 4.2, May 20, 2014 Page 33
7. Acronyms
AOD1B Atmosphere and Ocean De-aliasing Level-1B Product
ECMWF European Centre for Medium Weather Forecast
DWD Deutscher Wetterdienst
GFZ GeoForschungsZentrum Potsdam
GRACE Gravity Recover And Climate Experiment
ISDC Integrated System and Data Center
NCEP National Center for Environmental Predictions
OCN1B Ocean level-1B product
OMCT Ocean Model for Circulation and Tides
PO.DAAC Physical Oceanographic Distributed Active Archive Center
PPHA barotropic ocean model code: name termed after its main developers Pacanowski,
Ponte, Hirose and Ali