time-series validation of modis land biophysical products in a
TRANSCRIPT

Time-series validation of MODIS land biophysical products in aKalahari woodland, Africa
K. F. HUEMMRICH*{, J. L. PRIVETTE{, M. MUKELABAI§, R. B. MYNENI"
and Y. KNYAZIKHIN"
{Joint Center for Earth Systems Technology, University of Maryland, Baltimore
County, Baltimore, MD 20771, USA
{Code 614.4, Biospheric Sciences Branch, NASA Goddard Space Flight Center,
Greenbelt, MD 20771, USA
§Meteorological Office, Mongu, Zambia
"Department of Geography, Boston University, MA 02215, USA
Monthly measurements of leaf area index (LAI) and the fraction of absorbed
photosynthetically active radiation (fAPAR) taken at approximately monthly
intervals were collected along three 750 m transects in a Kalahari woodland near
Mongu in western Zambia. These data were compared with MODIS NDVI
(MOD13, Collection 3) and MODIS LAI and fAPAR products (MOD15,
Collection 3) over a 2 year period (2000–2002). MODIS and ground-measured
LAI values corresponded well, while there was a significant bias between MODIS
and ground-measured fAPAR even though both MODIS variables are produced
from the same algorithm. Solar zenith angle effects, differences between
intercepted and absorbed photosynthetically active radiation, and differences
in measurement of fAPAR (photon counts versus energy) were examined and
rejected as explanations for the discrepancies between MODIS and ground-
measured fAPAR. Canopy reflectance model simulations produced different
values of fAPAR with the same LAI when canopy cover was varied, indicating that
errors in the estimation of canopy cover in the MODIS algorithm due to the land
cover classification used are a possible cause of the fAPAR discrepancy. This is one
of the first studies of MODIS land product performance in a time-series context.
Despite a bias in fAPAR, our results demonstrate that the woodland canopy
phonology is captured in the MODIS product.
1. Introduction
One of the important uses of satellite observations of the Earth is to monitor
seasonal changes of vegetation (e.g. Goward et al. 1985, Justice et al. 1985, Reed
et al. 1994, Moulin et al. 1997, Chidumayo 2001). Seasonal variations in leaf area
index (LAI) and the fraction of absorbed photosynthetically active radiation (fAPAR)
are vital to determine landscape water, energy and carbon balances, as well as in the
detection of long-term climate change (Potter et al. 1993, Churkina and Running1998). As such, it is useful to examine the accuracy of LAI and fAPAR from the
MODIS (Moderate-Resolution Imaging Spectroradiometer) algorithms against
surface measurements over a multi-year period at a single site that experiences
significant seasonal variations in these variables.
*Corresponding author. Email: [email protected]
International Journal of Remote Sensing
Vol. 26, No. 19, 10 October 2005, 4381–4398
International Journal of Remote SensingISSN 0143-1161 print/ISSN 1366-5901 online # 2005 Taylor & Francis
http://www.tandf.co.uk/journalsDOI: 10.1080/01431160500113393

In any exercise where there are comparisons made between biophysical variablesmeasured using multiple methods, it is very important to understand how each
variable is defined as well as to examine the effects of possible error sources affecting
the measurements.
There are multiple approaches to measuring LAI, and along with them are multiple
subtly different definitions of LAI itself. Barclay (1998) describes five common
measurement approaches for determining LAI and finds that each measurement
approach results in a different definition of LAI. His five definitions are:
1. total LAI based on the total outside area of the leaves, taking leaf shape into
account, per unit area of horizontal land below the canopy;
2. one-sided LAI is generally defined as half the total LAI, even where the two
sides of the leaves are not symmetrical;
3. horizontally projected LAI is the area of ‘shadow’ that would be cast by eachleaf in the canopy with a light source at infinite distance and perpendicular to
it, summed up for all leaves in the canopy per unit area of horizontal land
below the canopy;
4. inclined projected LAI, ‘silhouette’ LAI, or effective LAI, represents the
projected area of leaves taking into account individual leaf inclinations; and
5. a variation on number 4 where overlapping leaf areas are counted only once.
With each of these definitions of LAI, there are associated ground-based
measurement approaches (Scurlock et al. 2001):
a. destructive harvesting and direct determination of one-sided leaf area, usingsquared grid paper, weighing of paper replicates, or an optically based area
measurement system;
b. collection and weighing of total leaf litterfall, converted to leaf area by
determining specific leaf area (leaf area/leaf mass) for sub-samples;
c. allometry (based on simple physical dimensions, such as stem diameter at
breast height), using species-specific or stand-specific relationships based on
detailed destructive measurement of a sub-sample of leaves, branches, or
whole individuals;
d. indirect contact methods, such as plumb lines and inclined point quadrats;and
e. indirect non-contact methods, such as the Decagon Ceptometer (Decagon
Devices, Inc., Pullman, Washington), the LI-COR LAI-2000 (Li-Cor, Inc.,
Lincoln, NE), and analysis of hemispheric photographs.
Methodologies A and B are commonly used in conjunction with definition 2 ofLAI, whereas D and E are used with definitions 3 and 4, respectively. Methodology
C may be used with any of the LAI definitions, including definition 1, depending
upon the details of the calibration of the allometric equations.
The MODIS algorithm for LAI uses a three-dimensional radiative transfer model
to describe canopy reflectance characteristics in multiple wavelength bands
(Knyazikhin et al. 1998a, b). The model is inverted to determine LAI, using yet
another approach not accounted for in the list above.
This study required repeated field measurements of the same location to observeseasonal and inter-annual change, obviously eliminating destructive measurement
approaches. Allometry and litterfall methods would not be able to capture the
timing of the seasonal change in leaf area. Because MODIS products have a 1 km
4382 K. F. Huemmrich et al.
ground resolution, we also sought a field sampling technique that could rapidly
characterize large areas. This led to the use of the LI-COR LAI-2000 that measures
leaf area using an indirect non-contact method based on light transmittance through
the canopy and assumptions of random leaf distribution within the canopy. This
approach provided a repeatable consistent measure of effective LAI. This value of
LAI was actually a total plant area index (PAI) as it lacked the ability to distinguish
between green leaves and twigs or senescent leaves.
This study also examined temporal changes of fAPAR. The total absorbed
photosynthetically active radiation (PAR) by a canopy (APAR) is the balance of the
fluxes into and out of the canopy, expressed as:
APAR~QinzQb{Qt{Qr, ð1Þ
where Qin is the incident PAR flux, Qb is the PAR reflected into the canopy from the soil
background, Qt is the PAR transmitted through the canopy, and Qr is the above-
canopy reflected PAR (Hipps et al. 1983, Goward and Huemmrich 1992). PAR fluxes
may be measured as energy fluxes (W m22) or as counts of photons with units of
(mmol m22 s21). To determine fAPAR, we normalize APAR by the incident PAR
fAPAR~APAR=Qin~ QinzQb{Qt{Qrð Þ=Qin: ð2Þ
Frequently, Qb is small and is set to zero in the calculation of fAPAR (e.g. Walter-
Shea et al. 1992). In tall vegetation, it is often difficult to measure above canopy
reflected PAR (Qr). In that case, usually the fraction of intercepted PAR (fIPAR) is
calculated:
fIPAR~ Qin{Qtð Þ=Qin: ð3Þ
Because PAR reflectance from vegetation (energy loss from the system) is usually
small and somewhat cancelled out by the background reflectance (Qb, energy gained
by the system), fIPAR is generally within a few percent of fAPAR (Huemmrich and
Goward 1997, Huemmrich 2001). The patchy nature of light transmittance through
woodland vegetation canopies means that large and spatially diverse samples of
transmitted PAR (Qt) and background reflected PAR (Qb) must be collected to
effectively describe these variables over a region.
As with the light-transmittance methods for determining LAI, the measurements
of fAPAR cannot distinguish between PAR absorption by green leaves or non-green
components of the canopy. This is a critical weakness of the field methods of fAPAR
measurements because when modelling photosynthesis, the required information is
the PAR absorbed by green leaves.
2. Site description
Surface observations were collected from the area surrounding the flux tower at the
Kataba Local Forest, approximately 20 km south of Mongu in western Zambia. The
tower was located at 15u 26.39 S, 23u 15.29 E, on a flat area adjacent to the Zambezi
River flood plain. The land cover was miombo woodland on Kalahari Sand
(Privette et al. 2002) or Kalahari woodland. Around the tower, the woodland tree
and shrub basal area measured at chest height averaged 8.19 m2 ha21 with a
standard deviation of 2.75 m2 ha21, for 42 samples, with canopy cover averaging
49.3% with a standard deviation of 10.6% (Scholes et al. 2002). There were five
dominant species in the forest canopy: Brachystegia spiciformis, Burkea africana,
SAFARI 2000 4383
Guibourtia coleosperma, Brachystegia bakerana, and Ochna pulchra. The average
upper canopy height was about 12 m. Beneath the canopy, there was a sparse
understory of the grass Pogonarthria squarrosa, various shrubs and geoxylic
suffrutices (Copaifera baumiana, Paropsia brazzeana, Baphia massaiensis, Bauhinia
petersiana and Lannea gossweileri, among others), moss, and leaf litter. The soil was
a pale grey, deep, excessively well-drained, fine sandy regosol of largely aeolian
origin (‘Kalahari sand’) that showed almost no profile development with depth
(Otter et al. 2002, Swap et al. 2002).
The site experiences a hot continental climate with pronounced wet and dry
seasons. The average annual rainfall is 879 mm (Swap et al. 2002). Nearly all of the
rain occurs from November to April, while typically no rainfall occurs from June to
September. The forest vegetation is deciduous, responding to the seasonal variation
in rainfall.
Ground measurements of LAI and fIPAR were made along three parallel east–west
running transects, each 750 m long. The transects were separated by 250 m. Each
transect was divided up into thirty 25-m-long segments. The segments were used in
the processing of the fIPAR data, and the end-points of the segments were where the
LAI-2000 measurements were collected (Privette et al. 2002). The length and spacing
of the transects were chosen to sample an area large enough to be representative of a
1 km MODIS pixel.
3. Materials and methods
3.1 Ground measurements
Effective leaf area index was measured using the LI-COR LAI-2000 Plant Canopy
Analyzer (PCA) (LI-COR Inc., Lincoln, Nebraska) instrument (Welles and Norman
1991). The LAI-2000 measures the intensity of blue light in five upward-looking
concentric conical rings. Measurements made under the canopy were compared with
open-sky measurements to determine transmittance for each of the five viewing
angles. Effective leaf area was calculated from the transmittance in the different view
angles based on the assumption of a random distribution of leaves. Measurements
were collected near sunrise or sunset to obtain nearly uniform sky illumination.
Open-sky measurements were collected before and after the transect measurements.
This approach was chosen as it allows repeated consistent measurements of the same
locations, without disturbing the canopy. This made possible LAI measurements to
be collected throughout the growing season to examine LAI phenology.
Ground-level measurements were made at fixed locations every 25 m along the
transects. Effective LAI values were determined for each measurement, and all 93
values were averaged to estimate the MODIS pixel LAI (Privette et al. 2002). LAI-
2000 measurements were rejected when they were collected under partly cloudy
conditions, when open-sky measurements were not available at both the beginning
and ending of the transect measurements, or when the sky became too dark for
meaningful transmittance values to be determined.
The Tracing Architecture and Radiation of Canopies (TRAC) (3rd Wave
Engineering, Nepean, Canada) instrument was used to measure fAPAR and fIPAR.
Generally, TRAC data would be processed using proprietary software to determine
gap fraction distribution, and from that LAI and leaf clumping factors (Chen and
Cihlar 1995, Chen 1996, Chen et al. 2000). Previous studies had already described LAI
for this site using the TRAC (Privette et al. 2002), while fAPAR had not been examined.
4384 K. F. Huemmrich et al.

In this study, the raw TRAC data were processed in a different way to calculate fIPAR.
The TRAC head contained three pyranometers sensitive to PAR wavelengths, with two
sensors upward looking and one downward looking (Chen et al. 2000). It was carried
through the forest along a transect at a steady walking pace while the sensors measured
PAR at 32 Hz, resulting in a horizontal sampling interval of about 1.7 cm (Privette et al.
2002). The sensors were held about 0.7 m off the ground. After each 25 m segment along
the transect, the operator entered a date/time stamp into the data by pressing a button.
TRAC measurements were collected on clear days. If a cloud obscured the Sun, data
collection was paused until the cloud passed.
fIPAR from TRAC was calculated using equation (3). PAR transmittance values
were determined from the upward viewing pyranometers on the TRAC instrument.
Owing to the large gaps in the canopy, incident PAR was estimated from the TRAC
data as 95% of the maximum upward-viewing pyranometer value for each transect.
The 95% factor was used to adjust for the TRAC not being completely level in each
measurement. As TRAC data were collected over a relatively short period of time,
with each transect measurement set taking less than a half hour to collect, the
incident PAR (Qin) was considered constant over the period of time covered to
measure each 750 m transect. With a value for incident PAR determined for a
transect measurement set, each upward-viewing pyranometer measurement was
used as a value of Qt. fIPAR values greater than one were set to one. Approximately
40 000 samples were collected in a single transect measurement set, and the fIPAR
values for each of these observations were averaged to give a transect-average fIPAR
value. The three transect average fIPAR values were averaged together to provide a
site fIPAR value.
To calculate fAPAR, measurements of above-canopy PAR albedo were required as
well as the PAR reflected from the background. PAR albedo was estimated with
data from upward and downward viewing pyranometers (Model CM14, Kipp &
Zonen, Delft, The Netherlands) that measured the entire shortwave flux and the
near-infrared part (.0.7 mm) of the shortwave. The pyranometers were located on
,2 m arms extending outward from the top of a 30 m tower positioned midway
between the centres of the middle and southern transects. The pyranometers
effectively integrate radiances over the hemisphere, which in the current configura-
tion provides a ,200 m diameter circular footprint for 0–80u incident angles. There
was no measurement of the spatial variation of the PAR albedo, so the single value
from the flux tower was used to describe all transects. PAR flux values were taken to
be the differences between the shortwave and near-infrared fluxes, so that PAR
albedo (Qr/Qin) was calculated as:
Qr=Qin~ Qswr{Qnirrð Þ= Qswin{Qnirinð Þ, ð4Þ
where Qswr was the reflected short wave flux above the canopy, Qswin was the
incident short wave flux, Qnirr was the reflected near-infrared flux above the canopy,
and Qnirin was the incident near-infrared flux. Shortwave pyranometers measure a
wavelength range of 0.285–2.8 mm, while the lower wavelength boundary for PAR is
defined as 0.4 mm. This means that the tower estimates of PAR flux include some
ultraviolet wavelengths. As the atmosphere blocks most of the incident ultraviolet
radiation from reaching the ground, we assume that this addition to the PAR flux
estimation is small.
Besides measuring transmitted PAR, the TRAC instrument measured reflected
background PAR, the other component of fAPAR. The challenge to calculating
SAFARI 2000 4385

fAPAR was to combine the TRAC and tower data. The tower sensors were not
intercalibrated to the PAR sensors in the TRAC; in fact the tower sensors measured
energy units (W m22) while the TRAC measured number of quanta (photons)
(mmol s21 m22). To account for these two data sources, the fAPAR equation
(equation (2)) was rearranged to work with self-consistent, unitless ratios and avoid
mixing data from the different sources:
fAPAR~Qin=QinzQb=Qin{Qt=Qin{Qr=Qin ð5Þ
or
fAPAR~fIPARzQb=Qin1{Qr=Qin2: ð6Þ
The background reflectance (Qb/Qin1) came from TRAC data and was calculated
using a similar approach to the fIPAR. As with fIPAR, the average measured PAR
reflected from the ground and the maximum transmitted PAR were determined.
Incident PAR (Qin1) was assumed to be 95% of maximum transmitted PAR for the
transect. In equation (6), the incident PAR (Qin2) in the PAR albedo term (Qr/Qin2)
came from the tower measurements. PAR albedo values from the tower fluxes were
recorded as 15 min averages. These were matched to the TRAC measurement times
to within less than an hour. So, two different values were used for the incident PAR
(Qin), but they were used to normalize the data from two different instruments.
3.2 Satellite measurements
The MODIS LAI and fAPAR products (Terra satellite, MOD15, level 4, collection 3)
were produced at 1 km spatial resolution over 8 day compositing periods (Myneni
et al. 2002). The algorithm used to produce these products was based on the
inversion of a three-dimensional radiative transfer model. The LAI and fAPAR
products retrieved from the algorithm represent values for green leaves under direct
solar illumination, with LAI being half the total leaf surface area per unit ground
area. Algorithm inputs included atmospherically corrected bidirectional reflectance
values in two wavelength bands, red and near-infrared; the Sun and viewing
geometry for the reflectance data; and a land cover classification that defined the
basic vegetation architecture and characteristics. For a range of canopy structures
and background reflectances that were expected from natural conditions, the
algorithm determined canopy reflectances and compared them with observations. In
cases where the differences between modelled and observed reflectances were within
the uncertainty of the observed reflectance, the biophysical values used as inputs
were considered as possible solutions. A test of energy conservation was also
applied. The mean LAI and fAPAR of possible solutions were reported as the
MODIS products (Knyazikhin et al. 1998a, b).
The MODIS NDVI product (Terra satellite, MOD13, level 3, collection 3) was also
examined in this study, as NDVI has long been used in studies to determine LAI or
fAPAR (for example, Hatfield et al. 1984, Badhwar et al. 1986, Peterson et al. 1987,
Wiegand et al. 1990, Goward and Huemmrich 1992). This product provided a check on
the use of MODIS NDVI as an inter-seasonal correlate to these variables in African
woodlands. The MODIS NDVI product has a spatial resolution of 1 km with a 16 day
compositing period. The inputs are red and near-infrared surface reflectances,
corrected for molecular scattering, ozone absorption, and aerosols, and adjusted to
nadir with the use of bi-directional reflectance function models (Huete et al. 2002).
4386 K. F. Huemmrich et al.
Both the LAI and fAPAR product and NDVI are sensitive to the green leaves in the
canopy. Green leaves have large differences in radiation absorption between the red
and near-infrared bands, while in dead leaves and soil, that difference is decreased.
Algorithms use this difference to determine LAI and fAPAR. As described above, the
ground measurements do not distinguish between green and non-green canopy
materials. This is a critical difference between the ground measurements and the
satellite values.
In this study, individual values of the 1 km pixel for both the NDVI and LAI/
fAPAR products representing the Mongu tower site were extracted and used for the
comparison with the ground measurements. MODIS geolocation of pixels is
approximately 50 m at nadir, a very small value compared with the pixel size (Wolfe
et al. 2002). In the LAI/fAPAR algorithm, the land cover classification of the Mongu
tower site was identified as savannah, as were the pixels surrounding the site. Each
pixel used had a quality assessment code associated with it. MODIS products were
not used if the quality assessments indicated significant cloud contamination or poor
data quality, or if the primary algorithm was not used.
4. Results
4.1 fIPAR
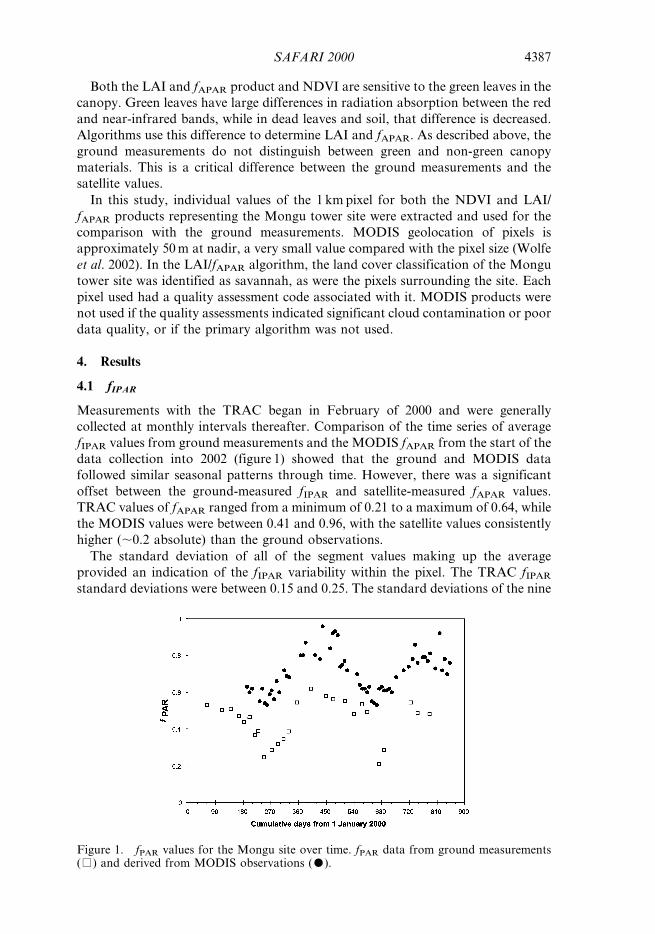
Measurements with the TRAC began in February of 2000 and were generally
collected at monthly intervals thereafter. Comparison of the time series of average
fIPAR values from ground measurements and the MODIS fAPAR from the start of the
data collection into 2002 (figure 1) showed that the ground and MODIS data
followed similar seasonal patterns through time. However, there was a significant
offset between the ground-measured fIPAR and satellite-measured fAPAR values.
TRAC values of fAPAR ranged from a minimum of 0.21 to a maximum of 0.64, while
the MODIS values were between 0.41 and 0.96, with the satellite values consistently
higher (,0.2 absolute) than the ground observations.
The standard deviation of all of the segment values making up the average
provided an indication of the fIPAR variability within the pixel. The TRAC fIPAR
standard deviations were between 0.15 and 0.25. The standard deviations of the nine
Figure 1. fPAR values for the Mongu site over time. fPAR data from ground measurements(%) and derived from MODIS observations ($).
SAFARI 2000 4387

surrounding MODIS pixels gave a measure of the regional variability, and these
values were between 0.01 and 0.17. As expected for this type of open woodland, the
standard deviations indicate more spatial variation at the 25 m segment scale than at
the scale of the larger 1 km MODIS pixels.
In figure 2, there was a direct comparison between the ground measured fIPAR
values with MODIS values where the TRAC measurements were collected during
the MODIS product 8 day compositing period. The points were well away from the
1-to-1 line. The MODIS fAPAR values were higher with a smaller range than the
ground measurements. The MODIS and ground measurements of fIPAR tended to
be closest at high values of fIPAR.
4.2 LAI
Ground measurements with LAI-2000 began in October of 2000. The MODIS LAI
product became available starting in June of 2000. Figure 3 shows the LAI over time
from the ground measurements using the LAI-2000 and the MODIS LAI for the
single 1 km pixel of the Mongu tower site. The short-term variability from
consecutive MODIS LAI observations was due to uncertainties in input data and
the algorithm.
Over the course of a year, the LAI pattern from both sources showed a strong
seasonal variation. The highest values of LAI occurred in the peak wet season
(January through March) with the canopy LAI reaching values around 2. Following
this, there was a steady decline in LAI to approximately 1 in September.
There were eight times where the ground measurement occurred during the 8 day
period where the MODIS result was assigned a good quality code, allowing a direct
comparison between the two measures of LAI. These points were plotted in figure 4
and showed a strong relationship between the ground-measured effective LAI and
the MODIS LAI, with the MODIS LAI giving a value slightly higher than the
ground LAI. This offset may be because the ground LAI was an effective LAI and
did not include a clumping factor (Chen and Cihlar 1995). However, the LAI-2000
measurements actually provide Plant Area Index (sum of leaf and stem area) rather
Figure 2. MODIS fPAR and ground measured fPAR values where the ground measurementswere collected during the 8 day compositing period of the MODIS value.y50.32x + 0.53; R250.26; n521.
4388 K. F. Huemmrich et al.

than the green leaf area index estimated from MODIS. Therefore, the LAI-2000
results should be slightly greater (e.g. by about 0.3) than the MODIS LAI results.
4.3 NDVI, fIPAR and LAI
Rather than using a model inversion approach, another method for determining
LAI and fIPAR by remote sensing has been to correlate the variables with NDVI. We
compared the seasonal pattern of the MODIS 16-day composite NDVI with the
ground-measured values of LAI and fIPAR in figure 5. Direct comparisons between
the MODIS NDVI and the ground-based measurements collected during the
compositing period displayed good correlations of LAI and fIPAR with NDVI
(figures 6 and 7).
Figure 3. LAI values for the Mongu site over time. LAI data from ground measurements(%) and derived from MODIS observations ($).
Figure 4. MODIS LAI and ground measured LAI values where the ground measurementswere collected during the 8 day compositing period of the MODIS value.y50.98x + 0.25; R250.79; n58.
SAFARI 2000 4389

5. Discussion
A comparison of the ground-based measurements of LAI and fIPAR with the
MODIS algorithm results showed that the MODIS algorithm provided a good
estimate of LAI, but has a significant fIPAR bias. As fIPAR is directly related to the
amount of leaf area in the canopy intercepting light, it was surprising that there
should be this discrepancy. We examined several possible causes for differences
between the MODIS fAPAR and ground-measured fIPAR.
One possible cause of the offset between the MODIS algorithm, that determines
fAPAR, and the surface-measured fIPAR was the difference between the intercepted
and absorbed PAR. To examine this difference, we calculated fAPAR for individual
transects at times when flux data above the canopy from the tower were also
Figure 5. NDVI, fPAR, and LAI values for the Mongu site over time. LAI (%) and fPAR (D)data from ground measurements and MODIS NDVI ($).
Figure 6. MODIS NDVI and ground measured LAI values where the ground measurementswere collected during the 16 day compositing period of the MODIS value.y52.97x20.38; R250.90; n59.
4390 K. F. Huemmrich et al.

available. There were 28 cases where we were able to calculate fAPAR for a transect.
There was very little difference in values between fIPAR and fAPAR (figure 8). The
largest difference was around 4% fAPAR. The small difference between intercepted
and absorbed PAR was because an increase in PAR coming into the canopy through
reflectance from the ground (an average of about 6% reflectance) was just about
offset by the above canopy reflected PAR (an average of about 5%).
Solar zenith angle (SZA) variations may have an effect on the measurement of
fIPAR (Goward and Huemmrich 1992). Ideally, fIPAR measurements should all be
Figure 7. MODIS NDVI and ground measured fPAR values where the ground measure-ments were collected during the 16 day compositing period of the MODIS value.y50.88x + 0.03; R250.66; n518.
Figure 8. fIPAR vs. fAPAR. Data from individual transects A, B, and C are used in this plot,i.e. each point represents the value for a single transect.y50.99x + 0.05; R250.99; n528.
SAFARI 2000 4391

collected at the same SZA for seasonal comparisons, or matching the SZA of the
satellite overpass time for comparisons between ground and satellite, but in practice
it is difficult to keep to such an exacting schedule. Since the data were collected
under a variety of SZA, it is important to evaluate the magnitude of their effect. The
best way to examine the relationship between SZA and fIPAR would be to measure
fIPAR several times in the same day, so that SZA varies while the overall canopy
characteristics have not changed. However, such measurements were not collected.
With the available data, we assumed for a null hypothesis that SZA does
significantly affect fIPAR. Measurements from individual 750 m transects were
examined, as these measurements were collected over time periods of ,30 min
compared with the time over which all three transects were measured, which could
be hours. This allowed a specific value of SZA to be assigned to a transect
measurement. To test the hypothesis, periods over which there were small changes in
fIPAR were chosen. Five periods were identified where there were small changes in
fIPAR: for transect A, cumulative days 271–326 and cumulative days 454–540;
transect B, days 60–181; and transect C, cumulative days 138–199 and 354–472. All
of these periods were when leaves were out in the forests. The measured fIPAR for
those periods were plotted against SZA (figure 9) and showed significant variations
in SZA with a very small variation in fIPAR. The null hypothesis was therefore
rejected, as there was no indication that differences in SZA would result in
significant differences in fIPAR for any of the transects.
Another possible difference between the MODIS product and ground-measured
fIPAR was that the model for the MODIS product used energy units in the
calculations, while the TRAC PAR detectors are quantum sensors that count
photons. The energy in a photon is related to its wavelength, and photons with
shorter wavelengths have more energy than photons with longer wavelengths. This
means that the TRAC sensors register a count for a photon of blue light the same as
a photon of red light, even though the blue light photon has over 40% more energy
than the red light photon. No data were collected on the spectral distribution of the
incident or absorbed light, so a direct analysis was not possible. We examined this
problem using the GeoSail model (Huemmrich 2001) to describe canopy spectral
absorption for a variety of canopy geometries, both continuous and clumped. The
model was formulated to calculate the fraction of the incident radiation absorbed by
Figure 9. Transect fIPAR vs. solar zenith angle for five periods where individual transectfIPAR had small changes over time.
4392 K. F. Huemmrich et al.

the canopy for wavelength bands of 0.005 mm between 0.400 and 0.700 mm (61
bands). Test cases used a variety of measured values for leaf optical properties over a
range of LAI values. A typical model result is shown in figure 10.
The results of the canopy model runs suggested that the spectral absorptance of
canopies of green leaves over the PAR wavelengths was fairly flat over the PAR
wavelengths. No spectral region was more than a few percent different from the
average. Generally, the largest difference in spectral absorption was in the green
wavelengths. However, there was no indication that measuring fAPAR by photon
counts versus measuring by energy units produced differences greater than 1% (see
figure 10).
The TRAC-derived fIPAR does not account for vegetation between the ground
surface and ,0.7 m, the height of the sensors during sampling. This error does not
occur with the LAI-2000, since that sensor was placed at ground level during
operation. The MODIS products represent the full vertical column of vegetation.
Nevertheless, understory vegetation is considerably more sparse than overstory
vegetation at Mongu, and therefore its contribution to the total column fIPAR is
likely to be small.
The relationships between LAI and fIPAR for both the ground-based and MODIS
values were examined in figure 11. As both the MODIS LAI and fAPAR come from
the same algorithm, it was not surprising that there is a tight relationship between
them. The relationship between the ground-measured values was more scattered, but
still strong considering that the ground-based LAI and fIPAR were measured with
different instruments, at different times, and often on different days. Figure 11
clearly showed that there was a different relationship between LAI and fIPAR for the
ground-based measurements in comparison with the MODIS algorithm.
Figure 10. Model results of spectral absorption by vegetation canopies over PARwavelengths. The modelled canopy consisted of a single, horizontally infinite layer of leaves.The leaves had a spherical leaf inclination angle distribution. Each line represents a canopywith the LAI shown below the line. The dark black line was the individual leaf absorptanceused as model input.
SAFARI 2000 4393

A simple canopy reflectance model was used to illustrate possible causes of the
differences between the measured LAI/fAPAR relationship and that derived from
the MODIS algorithm. Again, the GeoSail model (Huemmrich 2001) was used. The
simulation results shown in figure 12 assumed a landscape that was a plane covered
with identical trees described as cylinders with a height to width ratio of 4; all the
leaf area was constrained within the cylinders; the leaves had a spherical leaf angle
distribution; and SZA was 30u. In each of the simulations, represented by a line in
figure 12, the canopy coverage (that is the area of the plane covered by cylinders)
was held constant with LAI varying by increasing the LAI per tree (leaf density).
The results from this simple model showed that different LAI/fAPAR curves were
formed depending on the canopy coverage. These simulations suggest that the
differences between the MODIS LAI and fAPAR and ground-measured values may
be due to an error in the estimate of canopy cover in the MODIS algorithm.
Figure 11. LAI and fAPAR or fIPAR values for the same time periods. %: ground-measuredvalues; $: from the MODIS algorithm.
Figure 12. GeoSail simulations of LAI and fAPAR for deciduous forest canopies. Thefraction of canopy coverage for each line is shown above the line.
4394 K. F. Huemmrich et al.

Figure 12 showed that the same LAI value can have different values of fAPAR
depending on the fractional canopy cover. If the MODIS algorithm underestimated
fractional canopy cover, it may well overestimate fAPAR for a given LAI (compare
figures 11 and 12). The measured fractional canopy cover when the canopy was fully
leafed out was 0.49 (Scholes et al. 2002), while the range of fraction of canopy cover
in the MODIS algorithm for the savannah biome was 0.2–0.4 (Knyazikhin et al.
1998b). Thus, for the purposes of the MODIS algorithm, the classification of the
Mongu site as savannah was an error that leads to the observed problems with the
fAPAR values.
Beyond the effect of canopy structure, another source of uncertainty was
indicated in the relationship between NDVI and fIPAR. Some of the scatter in the
NDVI/fIPAR relationship shown in figure 7 may be explained by dividing the data
between the green-up periods and dry periods. The green-up periods were the times
when NDVI was increasing, and the dry periods were when NDVI was flat or
decreasing. Figure 13 shows the same data as figure 7 but with two lines describing
NDVI/fIPAR relationships, one during the green-up and the other during dry
periods.
During the green-up, the woodland in Mongu went from nearly leafless to fully
green. This period was characterized by a tight relationship between NDVI and
fIPAR. During the dry periods, the leaves drooped, dried out, and became brown,
while there were leaves, even dead ones, on the trees they were intercepting PAR and
contributing to the fIPAR. However, NDVI is sensitive to the amount of green
foliage, so NDVI dropped during the dry period more than the decrease in fIPAR.
This produced the second relationship in figure 13 shown as the dry line. Over the
year in Mongu, starting at the time of no leaves, the trees greened up, increased
green LAI and fIPAR and caused a steady increase in NDVI. As the dry season
began, NDVI decreased faster than fIPAR, resulting in a relationship line with a
lower slope. Finally, the trees lost their dead leaves, and fIPAR suddenly dropped
with little change in NDVI, bringing the cycle back to the start. This cycle suggests
Figure 13. MODIS NDVI and ground measured fIPAR values where the groundmeasurements were collected during the 16 day compositing period of the MODIS value.$: points that occur during the green-up period. y50.96x20.11; R250.87; n510; %: datapoints collected during the dry periods. y50.44x20.26; R250.45; n58.
SAFARI 2000 4395

that seasonal variations in leaf optical properties due to drying are not fully
accounted for in the MODIS algorithm.
6. Conclusions
This study of seasonal variation in MODIS LAI and fAPAR products shows thatboth products describe the pattern of seasonal vegetation change observed at
Mongu. However, we find that while the MODIS LAI product matches observed
values of ground-measured effective LAI with a small offset, there are significant
differences between the MODIS fAPAR product and ground-measured fIPAR.
The examination of the relationship between NDVI and fIPAR indicated that
variations in leaf optical properties may be an important source of error in retrieving
biophysical variables (Goward and Huemmrich 1992, Huemmrich and Goward1997). The spatial and temporal variability of leaf optical properties is not well
known. Improving the accuracy of biophysical variable retrieval may require a
systematic study of the variability of leaf optical properties.
This study examined the effects of SZA on fIPAR indirectly; future validation
studies should directly address this issue. Data-collection protocols should include
fIPAR measurements at multiple times in a single day at a single site to test the effects
of SZA on fIPAR.
Simulations from a simple canopy reflectance model suggest that another possible
cause of the differences between MODIS and ground-measured fIPAR may be due to
errors in estimating canopy cover in the MODIS algorithm. The canopy cover
differences are due to the classification of Mongu as a savannah where the assigned
fractional canopy cover in the algorithm was less than the observed coverage.
The results of this analysis clearly show that success in retrieving one biophysical
variable does not ensure success with other variables, even when there is a physical
link between the variables as there is between LAI and fAPAR. This means that
validation efforts must be made for all satellite data products.
Acknowledgements
This study was part of the SAFARI 2000 Initiative and was funded under the EOS
Validation Program. All field data used in this study are on the SAFARI 2000 CD-
ROM Volume III, available from the Oak Ridge National Laboratories Data Active
Archive Center (DAAC): ORNL DAAC User Services Office, Oak Ridge National
Laboratory, PO Box 2008, Mail Stop 6407, Oak Ridge, TN 37831-6490, USA.
Email: [email protected]
ReferencesBADHWAR, G.D., MACDONALD, R.B., HALL, F.G. and CARNES, J.G., 1986, Spectral
characterization of biophysical characteristics in a boreal forest: Relationship between
Thematic Mapper band reflectance and leaf area index for aspen. IEEE Transactions
on. Geoscience and Remote Sensing, 24, pp. 322–326.
BARCLAY, H.J., 1998, Conversion of total leaf area to projected leaf area in lodgepole pine
and Douglas-fir. Tree Physiology, 18, pp. 185–193.
CHEN, J.M., 1996, Optically-based methods for measuring seasonal variation in leaf area
index in boreal conifer stands. Agricultural and Forest Meteorology, 80, pp. 135–163.
CHEN, J.M. and CIHLAR, J., 1995, Plant canopy gap size analysis theory for improving optical
measurements of leaf area index. Applied Optics, 34, pp. 6211–6222.
CHEN, J.M., LEBLANC, S.G. and KWONG, M., 2000, Manual for TRAC (Ottawa: Canada
Centre for Remote Sensing).
4396 K. F. Huemmrich et al.

CHIDUMAYO, E.N., 2001, Climate and phenology of savanna vegetation in southern Africa.
Journal of Vegetation Science, 12, pp. 347–354.
CHURKINA, G. and RUNNING, S.W., 1998, Contrasting climatic controls on the estimated
productivity of global terrestrial biomes. Ecosystems, 1, pp. 206–215.
GOWARD, S.N. and HUEMMRICH, K.F., 1992, Vegetation canopy PAR absorptance and the
normalized difference vegetation index: an assessment using the SAIL model. Remote
Sensing of Environment, 39, pp. 119–140.
GOWARD, S.N., TUCKER, C.J. and DYE, D.G., 1985, North American vegetation patterns
observed with the NOAA-7 advanced very high resolution radiometer. Vegetatio, 64,
pp. 3–14.
HATFIELD, J.L., ASRAR, G. and KANEMASU, E.T., 1984, Intercepted photosynthetically active
radiation estimated by spectral reflectance. Remote Sensing of Environment, 14, pp.
65–75.
HIPPS, L.E., ASRAR, G. and KANEMASU, E., 1983, Assessing the interception of
photosynthetically active radiation in winter wheat. Agricultural Meteorology, 28,
pp. 253–259.
HUEMMRICH, K.F., 2001, The GeoSail model: a simple addition to the SAIL model to
describe discontinuous canopy reflectance. Remote Sensing of Environment, 75, pp.
423–431.
HUEMMRICH, K.F. and GOWARD, S.N., 1997, Vegetation canopy PAR absorptance and
NDVI: an assessment for ten tree species with the SAIL model. Remote Sensing of
Environment, 61, pp. 254–269.
HUETE, A., DIDAN, K., MIURA, T., RODRIGUEZ, E.P., GAO, X. and FERREIRA, L.G., 2002,
Overview of the radiometric and biophysical performance of the MODIS vegetation
indices. Remote Sensing of Environment, 83, pp. 195–213.
JUSTICE, C.O., TOWNSHEND, J.R.G., HOLBEN, B.N. and TUCKER, C.J., 1985, Analysis of the
phenology of global vegetation using meteorological satellite data. International
Journal of Remote Sensing, 6, pp. 1271–1381.
KNYAZIKHIN, Y., MARTONCHIK, J.V., DINER, D.J., MYNENI, R.B., VERSTRAETE, M.,
PINTY, B. and GOBRON, N., 1998a, Estimation of leaf area index and fraction
absorbed photosynthetically active radiation from atmosphere corrected MISR data.
Journal of Geophysical Research, 103, pp. 32239–32256.
KNYAZIKHIN, Y., MARTONCHIK, J.V., MYNENI, R.B., DINER, D.J. and RUNNING, S.W.,
1998b, Synergistic algorithm for estimating vegetation canopy leaf area index and
fraction absorbed photosynthetically active radiation from MODIS and MISR data.
Journal of Geophysical Research, 103, pp. 32257–32274.
MOULIN, S., KERGOAT, L., VIOVY, N. and DEDIEU, G., 1997, Global-scale assessment of
vegetation phenology using NOAA/AVHRR satellite measurements. Journal of
Climate, 10, pp. 1154–1170.
MYNENI, R.B., KNYAZIKHIN, Y., PRIVETTE, J., GLASSY, J., TIAN, Y., WANG, Y., HOFFMAN, S.,
SONG, X., ZHANG, Y., SMITH, G.R., LOTSKCH, A., FRIEDL, M., MORISETTE, J.T.,
VOTAVA, P., NEMANI, R.R. and RUNNING, S.W., 2002, Global products of vegetation
leaf area and fraction absorbed PAR from year one of MODIS data. Remote Sensing
of Environment, 83, pp. 214–231.
OTTER, L.B., SCHOLES, R.J., DOWTY, P., PRIVETTE, J., CAYLOR, K., RINGROSE, S.,
MUKELABAI, M., FROST, P., HANAN, N., TOTOLO, O. and VEENENDAAL, E.M.,
2002, The Southern African Regional Science Initiative (SAFARI 2000): wet season
campaigns. South African Journal of Science, 98, pp. 131–137.
PETERSON, D.L., SPANNER, M.A., RUNNING, S.W. and TEUBER, K.B., 1987, Relationship of
Thematic Mapper Simulator data to leaf area index of temperate coniferous forest.
Remote Sensing of Environment, 22, pp. 323–341.
POTTER, C.S., RANDERSON, J.T., FIELD, C.B., MATSON, P.A., VITOUSEK, P.M., MOONEY, H.A.
and KLOOSTER, S.A., 1993, Terrestrial ecosystem production—a process model-based
on global satellite and surface data. Global Biogeochemical Cycles, 7, pp. 811–841.
SAFARI 2000 4397

PRIVETTE, J.L., MYNENI, R.B., KNYAZIKHIN, Y., MUKUFUTE, M., ROBERTS, G., TIAN, Y.,
WANG, Y. and LEBLANC, S.G., 2002, Early spatial and temporal validation of
MODIS LAI product in Africa. Remote Sensing of Environment, 83, pp. 232–243.
REED, B.C., BROWN, J.F., VANDERZEE, D., LOVELAND, T.R., MERCHANT, J.W. and
OHLEN, D.O., 1994, Measuring phenological variability from satellite imagery.
Journal of Vegetation Science, 5, pp. 703–714.
SCHOLES, R.J., DOWTY, P.R., CAYLOR, K., PARSONS, D.A.B., FROST, P.G.H. and
SHUGART, H.H., 2002, Trends in savanna structure and composition along an aridity
gradient in the Kalahari. Journal of Vegetation Science, 13, pp. 419–428.
SCURLOCK, J.M.O., ASNER, G.P. and GOWER, S.T., 2001, Worldwide Historical Estimates of
Leaf Area Index, 1932–2000, Oak Ridge National Laboratory Technical Report
ORNL/TM-2001/268.
SWAP, R.J., ANNEGARN, H.J., SUTTLES, J.T., HAYWOOD, J., HELMLINGER, M.C., HELY, C.,
HOBBS, P.V., HOLBEN, B.N., JI, J., KING, M.D., LANDMANN, T., MAENHAUT, W.,
OTTER, L., PAK, B., PIKETH, S.J., PLATNICK, S., PRIVETTE, J., ROY, D.,
THOMPSON, A.M., WARD, D. and YOKELSON, R., 2002, The Southern African
Regional Science Initiative (SAFARI 2000): overview of the dry season field
campaign. South African Journal of Science, 98, pp. 125–130.
WALTER-SHEA, E.A., BLAD, B.L., HAYS, C.J., MESARCH, M.A., DEERING, D.W. and
MIDDLETON, E.M., 1992, Biophysical properties affecting vegetative canopy
reflectance and absorbed photosynthetically active radiation at the FIFE site.
Journal of Geophysical Research-Atmospheres, 97, pp. 18925–18934.
WELLES, J.M. and NORMAN, J.M., 1991, Instrument for indirect measurement of canopy
architecture. Agronomy Journal, 83, pp. 818–825.
WIEGAND, C.L., GERBERMANN, A.H., GALLO, K.P., BLAD, B.L. and DUSEK, D., 1990,
Multisite analyses of spectral-biophysical data for corn. Remote Sensing of
Environment, 33, pp. 1–16.
WOLFE, R.E., NISHIHAMA, M., FLEIG, A.J., KUYPER, J.A., ROY, D.P., STOREY, J.C. and
PATT, F.S., 2002, Achieving sub-pixel geolocation accuracy in support of MODIS
land science. Remote Sensing of Environment, 83, pp. 31–49.
4398 SAFARI 2000