time-resolved structural analysis of k- and ba-exchange reactions
TRANSCRIPT

American Mineralogist, Volume 92, pages 380�387, 2007
0003-004X/07/0203�380$05.00/DOI: 10.2138/am.2007.2242 380
INTRODUCTION
Birnessite is one of the most common Mn oxides found in nature. Manganese oxides having the birnessite-type layer struc-ture occur as Þ ne-grained aggregates, veins, marine and fresh-water nodules and concretions, crusts, dendrites, and coatings on other mineral particles and rock surfaces (Burns and Burns 1976; Dixon et al. 1986; Cornell and Giovanoli 1988; Post 1992, 1999). As a result of their Þ ne grain sizes, birnessite phases have large surface areas for cation-exchange and redox reactions; therefore, even small amounts can signiÞ cantly inß uence the chemical compositions of sediments and aqueous systems with which they are in contact (Paterson et al. 1986; Golden et al. 1986, 1987; Banerjee and Nesbitt 1999). The unusually high adsorption capacities and scavenging capabilities of Mn oxide/hydroxide minerals make their presence in soils a primary control on heavy metal and trace-element mobility; these characteristics make them useful geochemical exploration tools and water puri-Þ cation agents (Post 1999). Synthetic birnessite-like phases are extensively studied for use as catalysts, cation-exchange agents, octahedral sieves, and battery materials (Shen et al. 1993; Luo et al. 1998; Feng et al. 1999; Leroux et al. 2001). However, the same Þ ne-grained texture that makes birnessite so reactive also makes its crystal structure difÞ cult to study since crystals are generally unsuitable for single-crystal diffraction.
Birnessite is a layered Mn oxide consisting of edge-sharing Mn-O octahedra with an ~7 Å basal spacing (Fig. 1). The inter-
layer region of natural birnessites is occupied by hydrated cations, such as Na+, Ca2+, and K+. Since birnessite readily exchanges these interlayer cations, a variety of birnessite-type structures can be synthesized with different cations in the interlayer. Despite the plethora of synthesis methods for birnessite (McKenzie 1971; Golden et al. 1986; Shen et al. 1993; Luo and Suib 1997; Feng et al. 1999; Ma et al. 1999; Luo et al. 2000), details concerning the changes in atomic structure associated with cation exchange are not well documented. Because of the poorly crystalline nature of natural birnessite, structure reÞ nement by powder diffraction is difÞ cult, and synthetic birnessite typically is studied as an analog to the natural material (Kuma et al. 1994).
Recent studies have reported reÞ nements of the structure of Na-birnessite using synchrotron powder XRD coupled with Rietveld analysis. This work has revealed that Na-birnessite is triclinic (Post et al. 2002; Lanson et al. 2002), not monoclinic, as was previously believed (Post and Veblen 1990). In the present study, we used synchrotron radiation, imaging plate technology, and a ß ow-through capillary cell (Parise et al. 2000; Lee et al. 1998, 2000) to monitor in real-time structural changes as dissolved K+ and Ba2+ exchanged for Na+ in the interlayer of birnessite. The crystal structures of the K- and Ba-birnessite end-members, as well as the intermediate, partially exchanged phases, were determined using Rietveld analysis with the same methods described by Post et al. (2002). The purpose of our study was to provide a more com-plete understanding of the way in which birnessite incorporates metal cations into its crystal structure. Insights into this exchange process will assist in the development of birnessite-type phases as catalysts and cation-exchange agents, and they will provide * E-mail: [email protected]
Time-resolved structural analysis of K- and Ba-exchange reactions with synthetic Na-birnessite using synchrotron X-ray diffraction
CHRISTINA L. LOPANO,1,* PETER J. HEANEY,1 JEFFREY E. POST,2 JONATHAN HANSON,3 AND SRIDHAR KOMARNENI4
1Department of Geosciences, Penn State University, University Park, Pennsylvania 16802, U.S.A.2Department of Mineral Sciences, Smithsonian NMNH, Washington, D.C. 20013-7012, U.S.A.
3Department of Chemistry, Brookhaven National Lab, Upton, New York 11973, U.S.A.4Department of Crop and Soil Sciences and Materials Research Institute, Penn State University, University Park, Pennsylvania 16802, U.S.A.
ABSTRACT
Time-resolved Rietveld reÞ nements using synchrotron X-ray diffraction (XRD) have documented real-time changes in unit-cell parameters in response to cation substitution in synthetic Na-birnessite. Potassium- and Ba-birnessite, like Na-birnessite, were found to have triclinic symmetry. Rietveld analyses of the XRD patterns for K- and Ba-exchanged birnessite revealed decreases in the a, c, and β unit-cell parameters, with a decrease of 1.7 and 0.5%, respectively, in unit-cell volume relative to Na-birnessite. Fourier electron difference syntheses revealed that the changes in the conÞ guration of the interlayer species, and the charge, size, and hydration of the substituting cations, serve as the primary controls on changes in unit-cell parameters. Split electron density maxima with centers at (0 0 0.5) were present for Na, K, and Ba end-members; however, with increased substitution of K+ for Na+, the axis connecting the split-site maxima rotated from an orientation parallel to the b-axis to along the a-axis. Substitution of Ba2+ for Na+ did not result in rotation, but splitting of the interlayer site was more pronounced.
Keywords: Birnessite, cation exchange, synchrotron, X-ray diffraction, Mn-oxide

LOPANO ET AL.: XRD OF CATION EXCHANGE IN BIRNESSITES 381
a deeper understanding of the geochemical role of birnessite in natural systems.
EXPERIMENTAL METHODS
Sample preparationThe Na-birnessite samples used in the Ba-exchange experiments were derived
from the same synthetic batch used by Post and Veblen (1990) and Post et al. (2002), with the formula Na0.58(Mn4+
1.42,Mn3+0.58)O4·1.5H2O. This material contained
a small quantity of hausmannite (~5 wt%). Examination by transmission electron microscopy revealed that the crystals were plate-like and measured ~1 μm across and several hundred Ångstroms thick (Post and Veblen 1990). The Na-birnessite samples used in the K-exchange were freshly synthesized using the same methods employed by Post and Veblen (based on protocols in Golden et al. 1986, 1987). A solution of NaOH (55 g of NaOH in 250 mL of H2O) was added to 200 mL of a chilled 0.5 M MnCl2 solution and reacted at room temperature while oxygen was bubbled through the Mn(OH)2 suspension at a rate of ≥1.5 L/min through a glass frit. Similar to the procedure outlined in Kuma et al. (1994), the precipitate was Þ ltered through a 0.1 μm Millipore Þ lter, washed, and stored as a suspension until aliquots were removed and air-dried for use. XRD patterns of the initial Na-birnes-site samples used in the K-exchange reactions revealed no evidence of signiÞ cant amounts of hausmannite (<1%).
Data collectionXRD data were collected at beam line X7B of the National Synchrotron Light
Source (NSLS), Brookhaven National Laboratory (BNL), with an X-ray wavelength of 0.9044 Å (as determined from a LaB6 standard) for the K- and Ba-exchange. A small amount (~1 mg) of birnessite was loaded into 0.5 or 0.7 mm quartz capillaries and held in place by cotton or glass wool on either side of the sample. The capillary was inserted into a ß ow-through apparatus similar to the SECReTS (Small Envi-ronmental Cell for Real-Time Studies) cell described by Parise et al. (2000) for the exchange reactions used in studies by Lee et al. (1998, 2000). XRD patterns were collected every 2 to 3 minutes with a MAR345 full-imaging plate detector for periods of 1 to 4 hours as 0.01 M solutions of KCl or BaCl2 at neutral pH ß owed through the sample (on average 1 drop/100 s) under N2 pressure. During exposure, the sample was rotated through a 10° phi angle. Preferred orientation of the powder was elimi-nated through a combination of specimen rotation, use of a capillary sample holder, and full intensity integration of the diffraction rings, as obtained using the program FIT2D (Hammersley et al. 1996) with a polarization factor of 0.93. The series of time-resolved XRD patterns collected during the K-exchange and Ba-exchange reactions can be seen in Figures 2 and 3, respectively.
The exchanged samples were placed on a carbon stub and analyzed using
energy dispersive X-ray spectroscopy (EDS), with a JEOL JSM-840A scanning electron microscope (SEM) and an attached Noran System dispersive X-ray ana-lyzer. The results indicated that both the K-exchanged samples were completely exchanged and the Ba-exchanged samples contained little to no Na+ (~1 wt%) by the completion of the experimental runs. The small sample size and the Þ ne-grained powdered nature prevented accurate quantitative chemical analysis by electron-beam methods. Chemical analyses of the starting Na-birnessite material can be found in Post and Veblen (1990).
Structure reÞ nementRietveld structure reÞ nements (Rietveld 1969) were performed using the
EXPGUI interface (Toby 2001) of the General Structure Analysis System (GSAS) developed by Larson and Von Dreele (2006). The initial structure parameters for the starting Na-birnessite material came from the triclinic structure of Post et al. (2002). The latter authors employed triclinic rather than monoclinic symmetry on the basis of split diffraction peaks (such as the 0
�11, 101,
�102), as was revealed by
synchrotron XRD. We observed that these peaks also were split in our K- and Ba-birnessite patterns, indicating that these structures are triclinic as well.
For the calculation of Fourier electron difference maps, the interlayer species were excluded. The backgrounds for the XRD patterns were Þ t using up to 28 terms for Na-, K-, and Ba-birnessite, with a linear interpolation function. The peak proÞ les were modeled by a pseudo-Voigt proÞ le function as parameterized by Thompson et al. (1987), with asymmetry corrections by Finger et al. (1994) and microstrain anisotropic broadening terms by Stephens (1999). During initial cycles of reÞ nement, only the background, scale, peak proÞ le, and unit-cell parameters were allowed to vary. The position of the O atom in the Mn-O sheet was then reÞ ned. Calculations of difference electron Fourier (DELF) maps were performed to determine the interlayer atom positions. Once located, the interlayer atoms were added to the reÞ nement as a single Oint site, which served to model the average combined water and cation sites. As discussed below, for the completely exchanged phases, the Oint site was replaced with separate cation and O sites. Following reÞ nements of the interlayer atom posi-tions, occupancy factors and isotropic atomic displacement factors for the interlayer site were allowed to vary. During the K-birnessite reÞ nement, soft constraints were applied to the Mn-O distances (constrained to 1.85 Å with a standard deviation of 0.03 Å), and the weighting factor was gradually reduced in successive cycles until it was eventually eliminated.
RESULTS AND DISCUSSION
Effects of cation substitution on lattice parametersThe exchange of interlayer cations in birnessite resulted
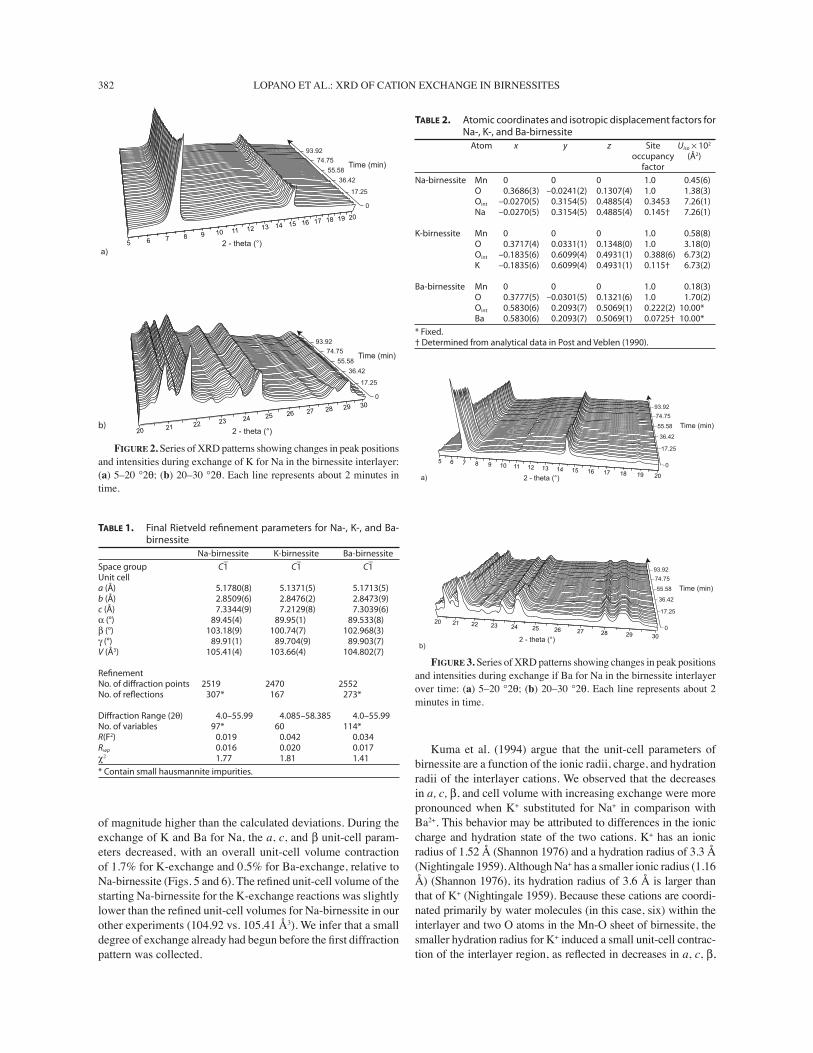
in variations in diffraction peak intensities and positions with increasing degree of exchange (Figs. 2 and 3). SpeciÞ cally, replacement of Na by K resulted in gradually decreasing in-tensity of certain peaks (e.g., 001, 1�1�1, and 11�1), shifting of peaks (e.g., 20�1 and 200), and merging of peaks (e.g., 20�2 with 111). Barium exchange yielded an abrupt decrease in all peak intensities and abrupt peak shifts (e.g., the 20�2 and 004 peaks). The Þ nal reÞ nement parameters are listed in Table 1. Atomic positions can be found in Table 2 with the corresponding bond distances in Table 3.
The Þ nal end-member diffraction patterns of K- and Ba-birnessite showed signiÞ cant decreases in peak-to-background ratios in comparison with that of the initially dry Na-birnessite material (Fig. 4), most likely due to the increased background caused by the presence of water. Rietveld analyses of XRD pat-terns obtained at intervals of approximately 5 minutes revealed strong dependencies of the unit-cell parameters with time (Figs. 5 and 6). The error bars for Figures 5 and 6 are smaller than the plotted data symbols. The standard deviations calculated by GSAS for the lattice parameters typically are smaller than the true errors (Post and Bish 1989), and we present the errors cal-culated by GSAS in the tables and Þ gures of this paper with the understanding that the actual errors may be more than an order
Na, H2O
Mn, O
FIGURE 1. View of the synthetic Na-birnessite [Na0.58(Mn4+1.2,Mn3+
0.58)O4·1.5H2O] structure approximately along the b axis.
LOPANO ET AL.: XRD OF CATION EXCHANGE IN BIRNESSITES382
of magnitude higher than the calculated deviations. During the exchange of K and Ba for Na, the a, c, and β unit-cell param-eters decreased, with an overall unit-cell volume contraction of 1.7% for K-exchange and 0.5% for Ba-exchange, relative to Na-birnessite (Figs. 5 and 6). The reÞ ned unit-cell volume of the starting Na-birnessite for the K-exchange reactions was slightly lower than the reÞ ned unit-cell volumes for Na-birnessite in our other experiments (104.92 vs. 105.41 Å3). We infer that a small degree of exchange already had begun before the Þ rst diffraction pattern was collected.
Kuma et al. (1994) argue that the unit-cell parameters of birnessite are a function of the ionic radii, charge, and hydration radii of the interlayer cations. We observed that the decreases in a, c, β, and cell volume with increasing exchange were more pronounced when K+ substituted for Na+ in comparison with Ba2+. This behavior may be attributed to differences in the ionic charge and hydration state of the two cations. K+ has an ionic radius of 1.52 Å (Shannon 1976) and a hydration radius of 3.3 Å (Nightingale 1959). Although Na+ has a smaller ionic radius (1.16 Å) (Shannon 1976), its hydration radius of 3.6 Å is larger than that of K+ (Nightingale 1959). Because these cations are coordi-nated primarily by water molecules (in this case, six) within the interlayer and two O atoms in the Mn-O sheet of birnessite, the smaller hydration radius for K+ induced a small unit-cell contrac-tion of the interlayer region, as reß ected in decreases in a, c, β,
FIGURE 2. Series of XRD patterns showing changes in peak positions and intensities during exchange of K for Na in the birnessite interlayer: (a) 5�20 °2θ; (b) 20�30 °2θ. Each line represents about 2 minutes in time.
TABLE 1. Final Rietveld refi nement parameters for Na-, K-, and Ba-birnessite
Na-birnessite K-birnessite Ba-birnessite
Space group C–1 C
–1 C
–1
Unit cell a (Å) 5.1780(8) 5.1371(5) 5.1713(5)b (Å) 2.8509(6) 2.8476(2) 2.8473(9)c (Å) 7.3344(9) 7.2129(8) 7.3039(6)α (°) 89.45(4) 89.95(1) 89.533(8)β (°) 103.18(9) 100.74(7) 102.968(3)γ (°) 89.91(1) 89.704(9) 89.903(7)V (Å3) 105.41(4) 103.66(4) 104.802(7) Refi nement No. of diff raction points 2519 2470 2552No. of refl ections 307* 167 273* Diff raction Range (2θ) 4.0–55.99 4.085–58.385 4.0–55.99No. of variables 97* 60 114*R(F2) 0.019 0.042 0.034Rwp 0.016 0.020 0.017χ2 1.77 1.81 1.41
* Contain small hausmannite impurities.
TABLE 2. Atomic coordinates and isotropic displacement factors for Na-, K-, and Ba-birnessite
Atom x y z Site Uiso × 102
occupancy (Å2) factor
Na-birnessite Mn 0 0 0 1.0 0.45(6) O 0.3686(3) –0.0241(2) 0.1307(4) 1.0 1.38(3) Oint –0.0270(5) 0.3154(5) 0.4885(4) 0.3453 7.26(1) Na –0.0270(5) 0.3154(5) 0.4885(4) 0.145† 7.26(1) K-birnessite Mn 0 0 0 1.0 0.58(8) O 0.3717(4) 0.0331(1) 0.1348(0) 1.0 3.18(0) Oint –0.1835(6) 0.6099(4) 0.4931(1) 0.388(6) 6.73(2) K –0.1835(6) 0.6099(4) 0.4931(1) 0.115† 6.73(2) Ba-birnessite Mn 0 0 0 1.0 0.18(3) O 0.3777(5) –0.0301(5) 0.1321(6) 1.0 1.70(2) Oint 0.5830(6) 0.2093(7) 0.5069(1) 0.222(2) 10.00* Ba 0.5830(6) 0.2093(7) 0.5069(1) 0.0725† 10.00*
* Fixed.† Determined from analytical data in Post and Veblen (1990).
FIGURE 3. Series of XRD patterns showing changes in peak positions and intensities during exchange if Ba for Na in the birnessite interlayer over time: (a) 5�20 °2θ; (b) 20�30 °2θ. Each line represents about 2 minutes in time.
5 6 7 8 9 10 11 12 13 14 15 16 17 18 19 20
2 - theta (°)
0
17.25
36.4255.58
74.7593.92
Time (min)
20 21 22 23 24 25 26 27 28 29 30
2 - theta (°)
0
17.25
36.4255.58
74.7593.92
Time (min)
a)
b)
a)
b)
5 6 7 8 9 10 11 12 13 14 15 16 17 18 19 202 - theta (°)
20 21
29 30
22 23 24 25 26 27 282 - theta (°)
17.25
36.42
55.58
74.7593.92
Time (min)
0
17.25
36.42
55.58
74.7593.92
Time (min)
0

LOPANO ET AL.: XRD OF CATION EXCHANGE IN BIRNESSITES 383
and V. Ba2+, with an ionic radius of 1.49 Å (Shannon 1976) and a hydration radius of 4.0 Å (Nightingale 1959), nevertheless induced a unit-cell contraction after replacing Na+. The greater charge of Ba2+ leads to stronger bonding with the negatively charged Mn-O layers, resulting in a diminished interlayer spacing despite the larger hydration radius for Ba2+ and its halved occupancy relative to the starting Na.
The contraction of the interlayer region does not entail a de-crease in primary bond lengths (Fig. 7). The O-H�O1 distances changed little following cation exchange, but the angles between octahedral layer oxygen ions and the interlayer oxygen decreased after both Ba- and K-exchange. SpeciÞ cally, the O1-O1-Oint bond angles diminished from 93.5° in Na-birnessite to 87.7° in Ba-birnessite and 72.9° in K-birnessite (Fig. 7). Thus, the contraction of the unit cell following Ba- and K-exchange is effected by a change in bond angles that, in turn, reß ect a re-arrangement of the interlayer cations, as described below.
Arrangement of interlayer species
According to Manceau et al. (1992), if there are no vacancies in the octahedral sheets, then the two-dimensional superperiodic-ity depends on the position of negative charge in the Mn-O sheet and the exchangeable cation valence. When the sheets do contain vacancies, they postulated that divalent cations will be situated above and below the vacancies, irrespective of layer charge. Our Rietveld reÞ nement of the Mn occupancies in all of our samples yielded values close to 1.00, indicating that there were no vacan-cies in the Mn-O layer of the synthetic Na-, K-, and Ba-birnes-site used in our study. Therefore, the interlayer hydrated cation positions most likely occurred adjacent to the Mn3+ sites in the Mn-O octahedral sheets, rather than near vacancies.
The interlayer atom positions used for initial reÞ nement of the interlayer were determined from DELF maps. For these reÞ nements, Na, K, Ba, and O(H2O) were modeled as a single atomic species (oxygen, Oint). The combined effects of partial occupancies, positional disorder, and similarities in X-ray scatter-ing factors for Na, K, and O rendered it impossible to distinguish among these species during the reÞ nement. For clariÞ cation of the end-member structures, we modeled the interlayer O site with separate O (water) and cation sites, both constrained to occupy
the same position. The occupancy factors for the cations were Þ xed to the values determined by chemical analyses in Post and Veblen (1990), and the O (water) occupancy factor was reÞ ned (Table 2). As in Post et al. (2002), the split site for Na-birnessite is best described as two maxima separated by ~1 Å; therefore, both positions of the binary site are never occupied at the same time. The splitting of the interlayer sites is most likely caused by positional disorder of the Na+, Ba2+, and K+ cations, and H2O molecules, such that they occupy different positions in the in-terlayer region in different unit cells. Therefore, the diffuse split sites apparent in the DELF maps must represent a composite average location for the interlayer species in the unit cell.
Again, as was found in Post et al. (2002) for Na-birnessite, the
TABLE 3. Selected bond distances (Å) for Na-, K-, and Ba-birnessite
Na-birnessite K-birnessite Ba-birnessite
Mn-O1 1.931(4) 1.977(5) 1.961(5) -O1 1.972(0) 1.978(7) 1.976(3) -O1 1.882(2) 1.842(0) 1.847(4) O1-O1 2.595(2) 2.657(9) 2.604(2) -O1 2.413(0) 2.438(2) 2.532(5) -O1 2.547(9) 2.847(6) 2.847(4) -O1 2.851(0) 2.551(0) 2.436(6) -O1 2.957(5) 2.943(2) 2.953(8) -O1 2.953(6) 2.930(4) 2.949(6) O1-Oint 2.590(9) 2.661(4) 2.634(6) -Oint 2.795(9) 2.885(0) 2.809(8) Oint-Oint 2.850(9) 2.847(6) 2.847(4)Oint-Oint 2.953(6) 2.943(2) 2.953(8)Oint-Oint 2.957(5) 2.930(4) 2.949(6) 2.911(3)
Note: Oint represents both the interlayer cation and the H2O molecules.
Na-birnessite
Inte
nsi
ty
20000
80000
Inte
nsi
ty
Ba-birnessite
1
10000
30000
2
K-birnessite
5 10 15 20 25 30 35 40
Inte
nsi
ty
10000
30000
FIGURE 4. Observed (crosses), calculated (solid line), and difference (line below) plots for the end-member XRD patterns from 4.0 to 42.5 °2θ for: (a) Na-birnessite; (b) K-birnessite; and (c) Ba-birnessite. All were reÞ ned in a triclinic unit cell (C
�1). Peak positions are indicated
by vertical dashes.

LOPANO ET AL.: XRD OF CATION EXCHANGE IN BIRNESSITES384
interlayer sites for Na-, K-, and Ba-birnessite form a hexagonal planar array parallel to the octahedral layers (Figs. 8 and 9). Each interlayer cation or H2O molecule is surrounded by six other H2O molecules with bond distances ranging from 2.85 to 2.95 Å (Table 3). The distances between octahedral O1 and interlayer Oint sites reÞ ned consistently to between 2.59 and 2.65 Å (Table 3), which might suggest H-bonds or, in the case of Na-birnessite, Na-O bonds (Post et al. 2002) between the octahedral oxygen and interlayer species. When Na is placed on a centroid between the split sites (an inversion center), bond distances are on the order of 2.9 to 3.0 Å, which are far from optimal. Based on the ionic radii presented in Shannon (1976), VIINa-IVO bond distances ideally are 2.56 Å, as is consistent with Na-O bond distances observed in Na-rich aluminosilicates, such as albite (Harlow and Brown 1980). Nevertheless, our calculated Na-birnessite bond distances are very similar to those found both in Post et al. (2002) and Lanson et al. (2002), supporting the results of our reÞ nement. The longer bond distances measured in these studies of birnessite may account for the extremely high susceptibility of interlayer Na to exchange for other cations.
Ideal VIIBa-IVO distances are 2.76 Å (Shannon 1976), and when Ba2+ is placed on the centroid between split sites, a bond distance of 2.97 Å results. On the other hand, when Ba is situated on the lobes of the electron density ellipsoids in DELF syntheses,
0 50 100 150 200 2505.12
5.14
5.16
5.187.20
7.24
7.28
7.32
101.0
102.0
103.0
103.6
104.0
104.4
104.8
Time (min)
β(
Na-birnessite K-birnessite
ac
V
FIGURE 5. Changes in unit-cell parameters over time for the 0.01 M K-exchange reaction with Na-birnessite. The b, α, and γ parameters remained constant with exchange. The error bars calculated in GSAS are smaller than the plotting symbols.
0 25 50 75 100 125 1505.169
5.172
5.175
5.178
7.31
7.32
7.33
102.9
103.0
103.1
103.2104.8
105.0
105.2
105.4
Time (min)
β)(
Na-birnessite Ba-birnessite
ac
V
FIGURE 6. Changes in unit-cell parameters over time for the 0.01 M Ba-exchange reaction with Na-birnessite. The b, α, and γ parameters remained constant with exchange. The error bars calculated in GSAS are smaller than the plotting symbols.
FIGURE 7. Diagrams revealing the angular relationships between the octahedral O atoms and the interlayer water species in the end-member birnessite phases as viewed down the a-axis. (a) Na-birnessite, (b) K-birnessite, (c) Ba-birnessite.
1.90 Å 5.27 Å
2.592 Å
93.468 o
ac
b
1.90 Å 5.25 Å
2.645 Å
87.621 o
Å71.5Å29.1
2.661 Å
72.907 o
a)
b)
c)

LOPANO ET AL.: XRD OF CATION EXCHANGE IN BIRNESSITES 385
time = 0 min time = 8 min time = 15 min
time = 19 min time = 65 min time = 228 min
a. b. c.
d. e. f.
x x x
x x x
a
b
-0.5 0.0 0.5
0.5
0
.0
-0
.5
5 Å
FIGURE 8. Difference electron Fourier (DELF) maps of the interlayer region calculated by GSAS for 0.01 M K-exchange reactions with Na-birnessite, for exchange times of (a) 0 min; (b) 8 min; (c) 15 min; (d) 19 min; (e) 65 min; and (f) 228 min. Areas of maximum electron density are located at the positions marked with an x. The contour interval is 0.1 e�/Å3. Elongation of the areas of electron density represents positional disorder of the interlayer cation and water species.
a. time = 0 min b. time = 10 min c. time = 19 min
d. time = 36 min e. time = 85 min f. time = 142 min
5 Åa
b
-0.5 0.0 0.5
0.5
0
.0
-0
.5
xx
x
x
x
x
x
x
x
x
x
FIGURE 9. Difference electron Fourier (DELF) maps of the interlayer region calculated by GSAS for 0.01 M Ba-exchange reactions with Na-birnessite, for exchange times of (a) 0 min; (b) 10 min; (c) 19 min; (d) 36 min; (e) 85 min; and (f) 142 min. Areas of maximum electron density are located at the positions marked with an x. The contour interval is 0.1 e�/Å3. Splitting of the areas of electron density represents positional disorder of the Ba2+ and water species.

LOPANO ET AL.: XRD OF CATION EXCHANGE IN BIRNESSITES386
a Ba-O distance of 2.65 Å is observed (Table 3). Consequently, when Ba2+ substitutes into the interlayer, it is more likely to be lo-cated toward the lobes of the split site as opposed to the centroid. In contrast, the ideal VIIK-VIO ideal bond distance is 2.89 Å (Shannon 1976), and when K+ is placed on the centroid in the interlayer, its bond distances to the interlayer oxygen atoms are 2.85 Å. When K+ is situated on the lobes of the DELF ellipsoids, the corresponding K-O distances are 2.66 Å (Table 3). Therefore, we infer that K+ is located on the centroid of the split sites when it substitutes into the interlayer. When H2O occupies that site, the O atom is sited on the lobe to achieve an O-H�O bond distance of 2.66 Å, as is characteristic of hydrogen bonds. Thus, our reÞ nement suggests that both the positional disorder and the variability in the interlayer conÞ gurations of Na-, K-, and Ba-birnessite are explainable to a large degree by optimization of bond distances.
Real-time analyses
Difference maps for 00l sections near z = 0.5 revealed sys-tematic and continuous changes in the positions of the interlayer species as the reactions progressed (Figs. 8 and 9). Split electron-density maxima with centroids at (0 0 0.5) are present in electron difference maps for Na, K, and Ba end-members; however, with increased substitution of K+ for Na+, the axis connecting the split-site maxima rotated from an orientation parallel to the b-axis to an orientation parallel to a. The split electron density maxima of interlayer Ba2+, on the other hand, exhibited no rotation, but the degree of splitting grew more pronounced. Thus, our real-time XRD results suggest that the transition from one interlayer con-Þ guration to another as cationic substitution proceeds involves continuous shifts in atomic positions rather than the co-existence of end-member conÞ gurations. This interpretation runs counter to arguments that exchange processes occur through dissolution of one phase and precipitation of another (e.g., Putnis 2002). Nevertheless, we note that the gradual evolution reported here also represents structures that are averaged over many unit cells, as is inherent to the XRD process.
Although the shifting in interlayer positions is gradual, the kinetics of substitution occurs as a two-step process. The Þ rst and more rapid stage involves a repositioning that may correspond with exchange of the interlayer species, and the second slower step entails an ordering of the interlayer spe-cies into those new positions. For example, the 90° rotation of the ellipsoid that represents interlayer positional disorder in Na-birnessite was completed within 20 min of exchange with K. Since the interlayer species controls the evolution of the unit-cell parameters, the decrease in unit-cell volume followed a similar behavior. Initially, the decrease in unit-cell volume was rapid, generally within 15 to 20 minutes after the initiation of ß uid ß ow. The subsequent stage involved a smaller variation in unit-cell parameters. We have determined that for K-exchange the initial stage had a coefÞ cient of unit-cell contraction of �8.96 × 10�6 1/s, and the second stage had a contraction coef-Þ cient of �2.66 × 10�7 1/s. Ba-exchange resulted in a contrac-tion coefÞ cient of �2.17 × 10�6 1/s for the initial stage (the Þ rst 15�20 min) and �2.71 × 10�7 1/s for the second stage. Ongoing research into the kinetics of these reactions in combination with molecular dynamical modeling will further elucidate the cation exchange processes in birnessite.
ACKNOWLEDGMENTSFunding for this research was provided by NSF grants EAR01-25908 and
EAR04-17741 and by a Penn State Materials Research Institute (MRI) SEED grant. We are grateful for the comments of two anonymous reviewers. Thanks go to YongJae Lee of the Brookhaven National Lab for his assistance with the operation of the environmental cell. This research was carried out at the National Synchrotron Light Source, Brookhaven National Laboratory, which is supported by the U.S. Department of Energy, Division of Materials Sciences and Division of Chemical Sciences, under contract no. DE-AC02-98CH10886.
REFERENCES CITEDBanerjee, D. and Nesbitt, H.W. (1999) Oxidation of aqueous Cr(III) at birnessite
surfaces: constraints on reaction mechanism. Geochimica et Cosmochimica Acta, 63, 1671�1687.
Burns, R.G. and Burns, V.M. (1976) Mineralogy of ferromanganese nodules. In G.P. Glasby, Ed., Marine Manganese Deposits, p. 185�248. Elsevier, Amsterdam.
Cornell, R.M. and Giovanoli, R. (1988) Transformation of hausmannite into birnes-site in alkaline media. Clays and Clay Minerals, 36, 249�257.
Dixon, J.B., Golden, D.C., Uzochukwu, G.A., and Chen, C.C. (1986) Soil Manga-nese Oxides. In M.H.B. Hayes and A. Herbillon, Eds., Soil Colloids, Structures and Associations in Soil Aggregates. NATO Workshop, Ghent, Belgium.
Feng, Q., Kanoh, H., and Ooi, K. (1999) Manganese oxide porous crystals. Journal of Materials Chemistry, 9, 319�333.
Finger, L.W., Cox, D.E., and Jephcoat, A.P. (1994) A correction for powder diffrac-tion peak asymmetry due to axial divergence. Journal of Applied Crystal-lography, 27, 892�900.
Golden, D.C., Chen, C.C., and Dixon, J.B. (1986) Synthesis of todorokite. Science, 231, 717�719.
��� (1987) Transformation of birnessite to buserite, todorokite, and manganite under mild hydrothermal treatment. Clays and Clay Minerals, 35, 271�280.
Hammersley, A.P., Svensson, S.O., Hanß and, M., Fitch, A.N., and Hausermann, D. (1996) Two-dimensional detector software: From real detector to idealized image or two-theta scan. High Pressure Research, 14, 235�248.
Harlow, G.E. and Brown, G.E. (1980) Low albite: an X-ray and neutron diffraction study. American Mineralogist, 65, 986�995.
Kuma, K., Usui, A., Paplawsky, W., Gedulin, B., and Arrhenius, G. (1994) Crystal structures of synthetic 7 and 10 Å manganates substituted by mono-divalent cations. Mineralogical Magazine, 58, 425�447.
Lanson, B., Drits, V.A., Feng, Q., and Manceau, A. (2002a) Structure of synthetic Na-birnessite: Evidence for a triclinic one-layer unit-cell. American Mineralo-gist, 87, 1662�1671.
Lanson, B., Drits, V.A., Gaillot, A., Silvester, E., Plançon, A., and Manceau, A. (2002b) Structure of heavy-metal sorbed birnessite: Part 1. Results from X-ray dif-fraction. American Mineralogist, 87, 1631�1645.
Larson, A.C. and Von Dreele, R.B. (2006) GSAS-General Structure Analysis System. Los Alamos National Laboratory Report No. LAUR 86-748.
Lee, Y., Carr, S.W., and Parise, J.B. (1998) Phase transition upon K+ ion exchange into Na-low silica X: combined NMR and synchrotron x-ray powder diffraction study. Chemistry of Materials, 10, 2561�2570.
Lee, Y., Kim, S., Schoonen, M.A.A., and Parise, J.B. (2000) Structural and Sr2+ ion ex-change studies of gallosilicate TsG-1. Chemistry of Materials, 12, 1597�1603.
Leroux, F., LaSalle, A.L., Guyomard, D., and Piffard, Y. (2001) Interleaved oxovana-dium cations in the rancieite manganese oxide delta-MnO2. Journal of Materials Chemistry, 11, 652�656.
Luo, J. and Suib, S.L. (1997) Preparative parameters, magnesium effects and anion effects in the crystallization of birnessites. Journal of Physical Chemistry B, 101, 10403�10413.
Luo, J., Huang, A., Park, S.H., Suib, S.L., and OʼYoung, C. (1998) Crystallization of sodium-birnessite and accompanied phase transformation. Chemistry of Materials, 10, 1561�1568.
Luo, J., Zhang, Q., and Suib, S.L. (2000) Mechanistic and kinetic studies of crystal-lization of birnessite. Inorganic Chemistry, 39, 741�747.
Ma, Y., Luo, J., and Suib, S.L. (1999) Synthesis of birnessites using alcohols as reducing reagents: Effects of synthesis parameters on the formation of birnes-sites. Chemistry of Materials, 11, 1972�1979.
Manceau, A., Charlet, L., Boisset, M.C., Didier, B., and Spadini, L. (1992) Sorption and speciation of heavy metals on hydrous Fe and Mn oxides. From microscopic to macroscopic. Applied Clay Science, 7, 201�223.
McKenzie, R.M. (1971) The synthesis of birnessite, cryptomelane, and some other oxides and hydroxides of manganese. Mineralogical Magazine, 38, 493�502.
Nightingale, E.R. (1959) Phenomenological theory of ion solvation. Effective radii of hydrated ions. Journal of Physical Chemistry, 63, 1381�1387.
Parise, J.B., Cahill, C.L., and Lee, Y. (2000) Dynamic powder crystallography with synchrotron X-ray sources. Canadian Mineralogist, 38, 777�800.
Paterson, E., Clarke, D.R., Russell, J.D., and SwafÞ eld, R. (1986) Cation exchange in synthetic manganates II. The structure of an alkylammonium-saturated phyllomanganate. Clay Minerals, 21, 957�964.
Post, J.E. (1992) Crystal structures of manganese oxide minerals. Catena Supple-

LOPANO ET AL.: XRD OF CATION EXCHANGE IN BIRNESSITES 387
ment, 21, In H.C.W. Skinner and R.W. Fitzpatrick, Eds., Biomineralization, processes of iron and manganese, Catena Supplement 21, p. 51�73. Catena Verlag, Germany.
��� (1999) Manganese oxide minerals: Crystal structures and economic and environmental signiÞ cance. In J.V. Smith, Ed., Colloquium on Geology, Min-eralogy, and Human Welfare, 91, p. 3447�3454. Proceedings of the National Academy of Sciences, Washington, D.C.
Post, J.E. and Bish, D.L. (1989) Rietveld reÞ nement of crystal-structures using powder X-ray diffraction data. In D.L. Bish and J.E. Post, Eds., Modern Powder Diffraction, 20, p. 277�308. Reviews in Mineralogy, Mineralogical Society of America, Chantilly, Virginia.
Post, J.E. and Veblen, D.R. (1990) Crystal structure determinations of synthetic sodium, magnesium, and potassium birnessite using TEM and the Rietveld method. American Mineralogist, 75, 477�489.
Post, J.E., Heaney, P.J., and Hanson, J. (2002) Rietveld reÞ nement of a triclinic structure for synthetic Na-birnessite using synchrotron powder diffraction data. Powder Diffraction, 17, 218�221.
Putnis, A. (2002) Mineral replacement reactions: From macroscopic observations to microscopic mechanisms. Mineralogical Magazine, 66, 689�708.
Rietveld, H.M. (1969) A proÞ le reÞ nement method for nuclear and magnetic
structures. Journal of Applied Crystallography, 2, 65�71.Shannon, R.D. (1976) Revised effective ionic radii and systematic studies of
interatomic distances in halides and chalcogenides. Acta Crystallographica A, 32, 751�767.
Shen, Y.F., Zerger, R.P., DeGuzman, R.N., McCurdy, L., Potter, D.I., and OʼYoung, C.L. (1993) Manganese oxide octahedral molecular sieves: Preparation, char-acterization, and applications. Science, 260, 511�515.
Stephens, P.W. (1999) Phenomenological model of anisotropic peak broadening in powder diffraction. Journal of Applied Crystallography, 32, 281�289.
Thompson, P., Cox, D.E., and Hastings, J.B. (1987) Rietveld reÞ nement of De-bye-Scherrer synchrotron X-ray data from Al2O3. Journal of Applied Crystal-lography, 20, 79�83.
Toby, B.H. (2001) EXPGUI, a graphical user interface for GSAS. Journal of Ap-plied Crystallography, 34, 210�213.
MANUSCRIPT RECEIVED FEBRUARY 17, 2006MANUSCRIPT ACCEPTED SEPTEMBER 25, 2006MANUSCRIPT HANDLED BY HONGWU XU