time-resolved degenerate four-wave mixing studies of solid-state poly(p-phenylene) oligomers
TRANSCRIPT

Timeresolved degenerate fourwave mixing studies of solidstate poly(pphenylene) oligomersHenry O. Marcy, Mark J. Rosker, Leslie F. Warren, Bruce A. Reinhardt, Michael Sinclair et al. Citation: J. Chem. Phys. 100, 3325 (1994); doi: 10.1063/1.466424 View online: http://dx.doi.org/10.1063/1.466424 View Table of Contents: http://jcp.aip.org/resource/1/JCPSA6/v100/i4 Published by the AIP Publishing LLC. Additional information on J. Chem. Phys.Journal Homepage: http://jcp.aip.org/ Journal Information: http://jcp.aip.org/about/about_the_journal Top downloads: http://jcp.aip.org/features/most_downloaded Information for Authors: http://jcp.aip.org/authors
Downloaded 23 Sep 2013 to 128.233.210.97. This article is copyrighted as indicated in the abstract. Reuse of AIP content is subject to the terms at: http://jcp.aip.org/about/rights_and_permissions

Time-resolved degenerate four-wave mixing studies of solid-state poly(p-phenylene) oligomers
Henry O. Marcy, Mark J. Rosker, and Leslie F. Warren Rockwell International Science Center, Thousand Oaks, California 91360
Bruce A. Reinhardt Wright Laboratory Materials Directorate, Wright Patterson AFR, Ohio 45433
Michael Sinclair and Carl H. Seager Sandia National Laboratory, Albuquerque, New Mexico 87185
(Received 13 September 1993; accepted 5 November 19?3)
We have measured X(3) for a series of solid-state samples of polyphenyleile oligomers, (Ph)n' where n=4-8 is the number of phenyl ring units, using optical pulses of 140 fs duration and 650 nm wavelength. A degep.erate four-wave mixing (DFWM) signal was only observable for n>6,' and thereafter the measured values of X(3) increased monotonically with n. Measurements of the linear absorption are also reported. Although the DFWM measurements were performed at wavelengths far from resonance, the figure of merit i 3) la was essentially flat beyond n;;.6. In contrast to previous studies of oligomers' in solution, the principal nonlinear responses were instantaneous within the 140 fs temporal resolution.
I. INTRODUCTION
Considerable success has been made in recent years to identify nonlinear optical materials with large third-order susceptibility, X(3). However, for many applications, the' appropriate material figures of merit to optimize are i 3) la
and n2/2{3A,1 where a is the linear absorption, (3 is the two-photon absorption coefficient, A is the wavelength, and n2=12 (7T1nO)X(3)(co,co,co,-co) is. the nonlinear refractive index. While the effects of linear absorption can potentially be minimized through tradeoffs in the magnitude of the nonlinearity, excitation intensity, and device geometry, two-photon absorption represents a fundamental materials limitation which. cannot be minimized via such compromises.1,2,Thus, the Xq ) response of a nonlinear material must be large at wavelengths far from one-photon and twophoton absorption bands for it to be useful in many device applications.
Highly conjugated organic molecules and polymers have received attention as potentially promising nonlinear optical materials due to the large X(3) values which result from the inherent polarizability of their valence electrons.3
Organics are attractive because they. readily allow for chemical modifications to enhance their optical properties, and because of their high damage thresholds, ultrafast re~ sponse, and processibility iitto a variety of optical device configurations.4,5
Metal-coordinated phthalocyanines and metal dithiolenes are examples of highly conjugated organic systems for which nonlinear optical studies have been performed on dilute solutions and evaporated thin films. For the unsubstituted and transition metal phthalocyanines, X(3) values as large as 2x 10⁻¹⁰ esu at 1064 nm have been inferred for the bulk material based on extrapolation of measurements made in solution.6,7Both the solution and thin film studies,8 however, point to the probability of resonance enhancement of the observed response due to linear and/or nonlinear absorption. In any case, even. in 10-2 M solu-
tions and at wavelengths (e.g., 1064 nm) far from the main absorption bands, the x(3)la values for these p~thalocyanines are not as large as those for CS2 or Si02. 6 For the metal dithiolenes and rare-earth diphthalocyanines, resonance enhanc.ed X(3) values as large as 103_105 times that for CS2 [=7X 10- 13 esu (Ref. 9)] have been reported.2,1O,11
Winter et al. reported linear and two-photon absorption figures of merit for some of these materials that may make them useful for waveguide geometry all-optical signal pro~ cessing device implementations in the near-infrared (IR).2,11 In all of these highly nonlinear systems, there is extensive charge transfer between the organic ring units and the bridging and/or central metal ion. While the metal ion. provides a convenient means for modifying the properties of these materials via atomic substitutions, the combination of extensive charge delocalization and ligandmetal charge transfer causes most of these materials to be have large, broad absQrptions (a> 103 cm- 1 and width ~ 50 nm) throughout the visible.,
In conjugated organic polymers, the essentially infinite 7T-electron pathways should lead to very large nonlinear optical responses. Polydiacetylene and poly(3-dodecylthiophene) have been reported to have X(3) values of up to 9 X 10⁻⁹ esu (Ref. 12) and 5 X 10⁻¹⁰ esu,13 respectively, at wavelengths near 600 nm. However, both of these polymers have substantial linear absorption in the visible, and the i 3
) response of polydiacetylene has a significant imaginary component due to two-photon absorption even at wavelengths far from resonance. 14
X(3) la in these systems might be improved by restricting the length of the polymer chain, which could act to limit the absorption while still allowing for large optical nonlinearities. Garnier et al. have reported a two ordersof-magnitude increase in charge carrier mobility in a polythiophene oligomer (n=6) compared to its long-chain polymer analog. 15 The increased carrier mobility ostensibly results from an increased degree of order along the poly-
J. Chern. Phys. 100 (4), 15 February 1994 0021-9606/94/100(4)/3325/9/$6.00 @ 1994 American Institute of Physics 3325 Downloaded 23 Sep 2013 to 128.233.210.97. This article is copyrighted as indicated in the abstract. Reuse of AIP content is subject to the terms at: http://jcp.aip.org/about/rights_and_permissions
3326 Marcy et al.: Four-wave mixing in poly(p-phenylene) oligomers
mer backbone which leads to improved 1T-orbital overlap and hence electron delocalization. As the degree of electron delocalization, Le., the ease with charge can be polarized along the polymer backbone, is the basis of theoretical models aimed at predicting molecular nonlinear optical response,4,16,17 an enhanced carrier mobility would suggest that oligomers may have the potential to display larger third-order nonlinearities. Oligomers are also excellent model compounds for a study of the relationship between x (3) , conjugation length, and linear absorption because the conjugation length for an oligomer is well defined. By studying X(3
) and a for a series of related oligomers in which the number of monomer repeat units are systematically varied, the X(3) /a figure of merit can be empirically explored.
Recently, X(3) of dilute solutions of both poly
thiophene and derivatized polyphenylene oligomers have been studied. I8-21 Thienpont et al. 21 measured the second hyperpolarizability (r) of poly thiophene oligomers through dc field-induced second-harmonic generation and claimed saturation of the third-order nonlinearity as the number of repeat units, n, exceeded seven. This saturation was attributed to twisting of the thiophene rings about the bonds connecting them, which effectively localized the electrons onto short chain segments. Zhao et al. found no saturation of r as measured by degenerate four-wave mixing (DFWM) with 602 nm optical pulses in poly thiophene oligomers up to n = 5, but noted a significant saturation for derivatized polyphenylenes beyond n=3.20
,22 This saturation might have been caused by steric hindrance introduced by derivatization on the center monomer unit with long alkoxy chains. Derivatization was required to make the molecules soluble, but this may break the electron delocalization pathway in the middle of the oligomer. In subsequent studies on oligomer containing solutions, this group claimed that the subpicosecond, time-resolved DFWM signal indicated two-photon absorption as a significant contribution to the observed X(3) response of derivatized polyphenylene oligomers. 19 Furthermore, the authors reported in this later work that not only did r not saturate, but it dramatically increased as n varied from 3 to 7. This increase in r was attributed to the formation of a long-lived population grating due to two-photon absorption as evidenced by the long-lived response and the greater than cubic dependence of the signal on input intensity.
All of these authors report values of r on the order of 10-32_10- 34 esu [or about 102_104 times that ofCS2 (Refs. 9,23)] for polythiophene and derivatized polyphenylene oligomers. This suggests that the macroscopic X(3) value for bulk samples sould be larger than that for CS2 • However, it is difficult to extrapolate from the molecular second hyperpolarizability, r, to the bulk X(3
) value due to the uncertainty associated with estimating local-field effects. Fichou et al. also explored the third-order nonlinear optical properties of thiophenes, but instead looked at thin films via third-harmonic generation. 18 On the basis on their calculations, a strong dependence of X(3
) on conjugation length was predicted. This dependence was verified exper-
Ocliphenyl - (Ph)a
Sepliphenyl - (Ph)7
Sexiphenyt - (Ph)6
Quinquephenyt - (Ph)5
0-0-0-0 Qualerphenyl - (Ph)4
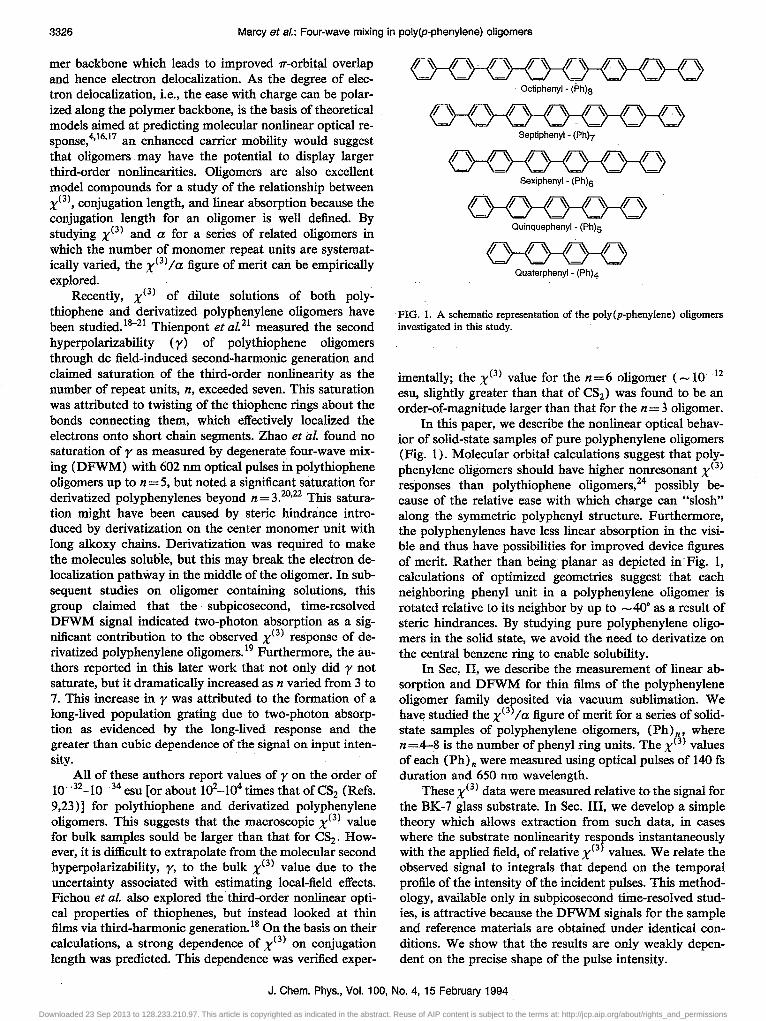
FIG. 1. A schematic representation of the poly(p-phenylene) oligomers investigated in this study.
imentally; the l3) value for the n=6 oligomer (_10- 12
esu, slightly greater than that of CS2 ) was found to be an order-of-magnitude larger than that for the n=3 oligomer.
In this paper, we describe the nonlinear optical behavior of solid-state samples of pure polyphenylene oligomers (Fig. 1). Molecular orbital calculations suggest that polyphenylene oligomers should have higher nonresonant X(3
)
responses than poly thiophene oligomers,24 possibly because of the relative ease with which charge can "slosh" along the symmetric polyphenyl structure. Furthermore, the polyphenylenes have less linear absorption in the visible and thus have possibilities for improved device figures of merit. Rather than being planar as depicted in Fig. 1, calculations of optimized geometries suggest that each neighboring phenyl unit in a polyphenylene oligomer is rotated relative to its neighbor by up to -40· as a result of steric hindrances. By studying pure polyphenylene oligomers in the solid state, we avoid the need to derivatize on the central benzene ring to enable solubility.
In Sec. II, we describe the measurement of linear absorption and DFWM for thin films of the polyphenylene oligomer family deposited via vacuum sublimation. We have studied the X(3
) / a figure of merit for a series of solidstate samples of polyphenylene oligomers, (Ph) f:' where n =4-8 is the number of phenyl ring units. The X 3) values of each (Ph) n were measured using optical pulses of 140 fs duration and 650 nm wavelength.
These l3) data were measured relative to the signal for the BK-7 glass substrate. In Sec. III, we develop a simple theory which allows extraction from such data, in cases where the substrate nonlinearity responds instantaneously with the applied field, of relative XC3 values. We relate the observed signal to integrals that depend on the temporal profile of the intensity of the incident pulses. This methodology, available only in subpicosecond time-resolved studies, is attractive because the DFWM signals for the sample and reference materials are obtained under identical conditions. We show that the results are only weakly dependent on the precise shape of the pulse intensity.
J. Chern. Phys., Vol. 100, No.4, 15 February 1994
Downloaded 23 Sep 2013 to 128.233.210.97. This article is copyrighted as indicated in the abstract. Reuse of AIP content is subject to the terms at: http://jcp.aip.org/about/rights_and_permissions

Marcy at sl.: Four-wave mixing in poly(p-phenylene) oligomers 3327
In Sec. IV, we discuss the results of these experiments. Over the range studied, the X<3) values of (Ph)n oligomers increase monotonically with n, but that for n<5 the values are smaller than our detection threshold. Measurements of the linear absorption are also reported. Additionally, we have utilized the time-resolved capabilities of our experimental apparatus to establish an upper bound for the time response of the nonlinearity in (Ph) n oligomers, and have found the principal nonlinear responses to have < 140 fs duration. The results presented contrast strongly with results reported previously for derivatized polyphenylene oligomers in solution.
II. EXPERIMENT
Thin films (~1 /Lm) of (Ph) n' where n =4-8 is the number of phenyl ring units, were deposited on BK-7 substrates via vacuum sublimation from purified powders. The n=4 and 5 powders were purchased (Aldrich and TKI, Inc., respectively) while the n = 6-8 materials were synthesized as described in Ref. 25 and purified via multiple vacuum sublimations. Melting points of these highly insoluble materials agreed with literatur~ values. As described in Ref. 18, the highest quality films were obtained when the films were very rapidly deposited, on the order of 10-100 nm s-1, such that thermal polymerization and/or crystallization were avoided. The purity of the deposited films was confirmed through measurements of the visible emission spectra. As expected, the emission peaks were red shifted as the number of phenyl ring repeat units increased. The film thicknesses were estimated by stylus profilometry and confirmed by fitting the interference fringes observed in UV-VIS linear transmission measurements. These fits also provided estimates of the refractive index for each (Ph)n'
The linear absorption, a, of the (Ph) n films was determined via photothermal deflection spectroscopy (PDS). The (Ph)n films for PDS were vacuum deposited on specially prepared Infrasi1® substrates simultaneously with the samples used in the DFWM investigations. In PDS, the linear absorption of a material is determined by measuring the temperature rise of the sample when it is irradiated by a light beam of known intensity. To detect the temperature rise, the sample was immersed in a liquid (for the measurements reported here, Fluoronert®, FC-75) and a probe beam from a helium neon laser was propagated parallel to the front surface of the material in the region illuminated by the heating beam. Any change in the temperature of the surface of the sample resulted in the formation of a thermal gradient in the liquid immediately adjacent to the surface of the sample and a deflection of the probe beam which was sensed using a photovoltaic detector. Calibration of the PDS technique was carried out by comparing the sample spectra with those from uniformly absorbing (flat black) reference specimens. Absorbance sensitivity below 3 ppm was obtained over most of the spectral range of interest for these studies. Details of the PDS technique and apparatus are described elsewhere.26,27
DFWM studies were carried out in the conventional counterpropagating pump geometry as shown in Fig. 2.
Pol
Variable Delay
~-----:--0- Detector . Beam 4
FIG. 2. Schematic view of the optical layout for the DFWM investigations. Key: BS=50% beamsplitter, Pol=polarizer, and ..:I./2=half-wave retardation plate. The wave plates were typically adjusted to rotate beam 2 by 90· relative to beams I and 3.
The optical source was an amplified, mode-locked femtosecond dye laser producing 600 /LJ pulses with a width of 140 fs at 20 Hz. A variable attenuator was placed in the beam path to permit intensity dependent measurements and thereby verify the cubic dependence of the DFWM signal. The three input beams at the sample were determined to be nearly Gaussian with ~ 120 f.Lm diam. Beams 1 and 2 (see Fig. 2) were approximately equal in energy with an intensity at the sample measured to be ~ 3.6 GW / cm2. Beam 3 had about 1/3 this intensity. The phaseconjugate signal (beam 4) was monitored using a photomultiplier tube to measure the reflection from a beamsplitter placed in the path of beam 3. Calcite polarizers in each beam path insured pure polarizations.
The relative arrival times of the pulses at the sample were individually controlled. Beam 1 was set by a computer-driven optically encoded linear actuator with submicron resolution. For these experiments, this delay was always fixed to the position which gave maximum observed signal, which was therefore assumed to correspond to coarrival of beams 1 and 3 at the sample. The angle between beams 1 and 3 was ~ 10°. The variable delay for beam 2 was set by the position of a corner cube mounted on a linear slide controlled by a precision galvonometer. The slide position could be varied over a range corresponding to delays of beam 2 relative to beams 1 and 3 of up to 150 ps. In the counterpropagating geometry, the temporal resolution is determined by the longer of either the pulse width or the length of the interaction region. Since the samples were only ~ 1 f.Lm thick, the temporal resolution was therefore equal to the pulse width (see also Sec. III).
Intensity autocorrelations of the optical pulses were performed using the same slide assembly to provide the delay. The input time-delayed and fixed beams were noncollinearly phasematched in a 300 f.Lm thick KD*P crystal and the frequency-doubled signal was detected with a photomultiplier. The data were typically averaged over several thousand laser shots and a travel range for. the
J. Chern. Phys., Vol. 100, No.4, 15 February 1994 Downloaded 23 Sep 2013 to 128.233.210.97. This article is copyrighted as indicated in the abstract. Reuse of AIP content is subject to the terms at: http://jcp.aip.org/about/rights_and_permissions
3328 Marcy et 81.: Four-wave mixing in polyCp-phenylene) oligomers
Substrate n=nr
X(3) = X(3)r
o
..
Sample n=ns x(3) = X(3)s
(Delayed Beam)
L , X
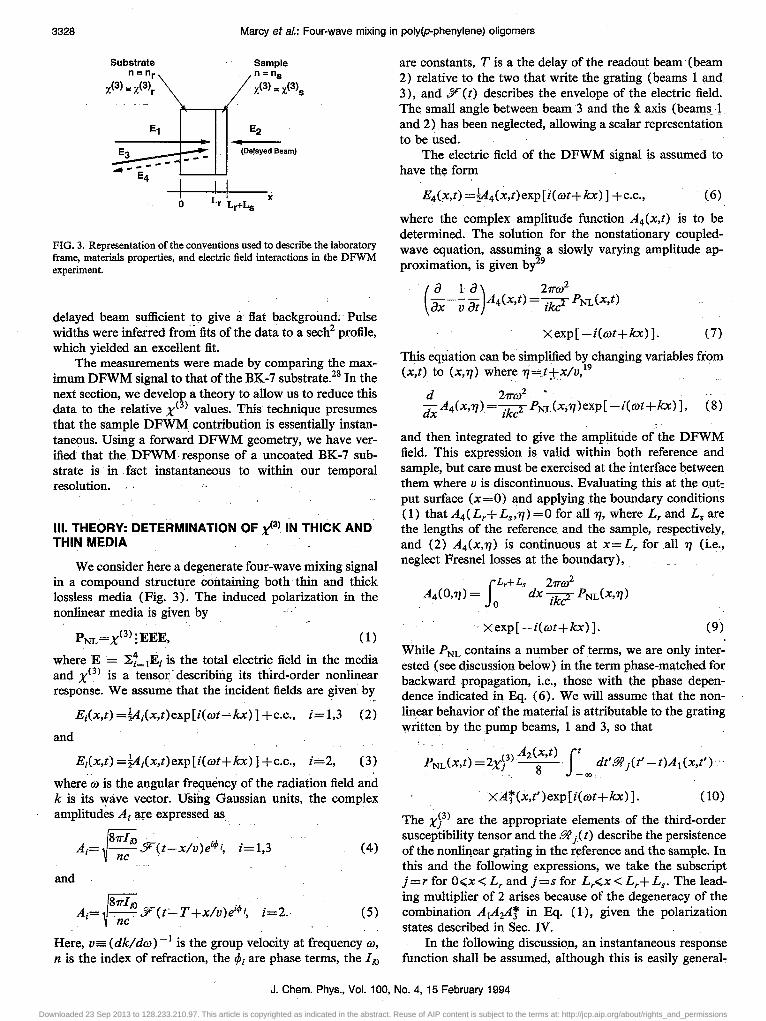
FIG. 3. Representation of the conventions used to describe the laboratory frame, materials properties, and electric field interactions in the DFWM experiment.
delayed beam sufficient to give a flat background;' Pulse widths were inferred from fits of the data to a sech2 profile, which yielded an excellent fit.
The measurements were made by comparing the maximum DFWM signal to that of the BK -7 substrate.28 In the next section, we develop a theory to allow us to reduce this data to the relative X(3) values. This technique presumes that the sample DFWM contribution is essentially instantaneous. Using a forward DFWM geometry, we have verified that the DFWM response of a uncoated BK-7 substrate is in fact instantaneous to within our temporal resolution.
III. THEORY: DETERMINATION OF X(3) IN THICK AND THIN MEDIA
We consider here a degenerate four-wave mixing signal in a compound structure containing both' thin and thick lossless media (Fig. 3). The induced polarization in the nonlinear media is given by .,
PNL=X(3):EEE, (1)
where E= ~i=IEi is the total electric field in the media and X<3) is a tensor'describing its third-order nonlinear response. We assume that the incident fields are given by
Ei(x,t) =!Ai(X,t) exp [i(li.lt-'-kx) I +c.c., i= 1,3 (2)
and
Ei(x,t) =!Ai(x,t)exp[i(li.lt+kx)] +c.c., i=2, (3)
where li.l is the angular frequency of the radiation field and k is its wave vector. Usfug Gaussian units, the complex amplitudes Ai a,re expressed as .
l1TltO ' •. Ai= --YU-x/v)e1<Pi, i=1,3 (4)
nc
i=2. (5)
Here, v -= (dk/ dli.l )-1 is the group velocity at frequency li.l, n is the index of refraction, the tPi are phase terms, the ItO
are constants, T is a the delay of the readout beam' (beam 2) relative to the two that write the grating (beams 1 and 3), and Y(t) describes the envelope of the electric field. The small angle between beam'3 and the i axis (beams·1, and 2) .has been neglected, allowing a scalar representation to be used .
The electric field of the DFWM signal is assumed to have the form
(6)
where the complex amplitUde function A4 (x,t) is to be determined. The solution for the nonstationary coupledwave equation, assuming a slowly varying amplitude approximation, is given by29
Xexp[ -i(li.lt+kx)]. (7)
This eq~ation can be simplified by changing variables from (x,t) to (x,1]) where '7j=ItX/v,19
d 21Tli.l2 -d A4(x,1]) =~k PNL(x,1])exp[ -i(li.lt+kx) I, (8) x . 1 C
and then integrated to give the amplitude of the DFWM field. This expression is. valid within both reference and sample, but care must be exercised at the interface between them where v is discontinuous. Evaluating this at the O\1t:: put surface (x=O) and applying .the boundary conditions (1) that A4( Lr+ L s ,1]) =0 for a111], where Lr and Ls are the lengths of the reference and the sample, respectively, and (2) A4(x,1]) is continuous at x=Lr for all 1] (Le., neglect Fresnel losses at the boundary),
iLr+ Ls 21Tli.l2 A4(0,1]) =. dx ~k PNL(x,1])
ole
, Xexp[ -i(wt+kx)]. (9)
While PNL contains a number of terms, we are only interested (see discussion below) in the term phase-matched for backward propagation, Le., those with the phase dependence indicated in Eq. (6). We will assume that the nonlinear behavior of the material is attributable to the grating written by the pump beams, 1 and 3, so that
P (X;)=2xC.3)A2(X,t)·ft
dt'f!/t·(t'-t)A (xt')c., NL, , J '. 8 _ 00 _ _ J I,
XAT(x,t')exp[i(li.lt+kx) ]. (10)
The Xj3) are the appropriate elements of the third-order susceptibility tensor and the f!/t j(t) describe the persistence of the nonli~ear grating in the reference and the sample. In this and the following expressions, we take the SUbscript j=r for O<x< Lr and j=s for Lr<x< Lr+Ls. The leading multiplier of 2 arises because of the degeneracy of the combination AIA~r in Eq. (1), given the polarization states described in Sec. IV.
In the following discussion, an instantaneous response function shall be assumed, although this is easily general-
J. Chern. Phys., Vol. 100, No.4, 15 February 1994
Downloaded 23 Sep 2013 to 128.233.210.97. This article is copyrighted as indicated in the abstract. Reuse of AIP content is subject to the terms at: http://jcp.aip.org/about/rights_and_permissions

Marcy et sl.: Four-wave mixing in poly(p-phenylene) oligomers 3329
izable. [This approach for measuring X(3) will only be useful, however, provided that the reference material responds within the pulse width.] For an instantaneous response, fJ1l /t' -t) =l)(t' -t), so that
PNL(x,t) =iXj3)A1 (x,t)A2 (x,t)At (x,t) exp [i(cut+kx) ] (11 )
xY(t- T +xlv)exp[i(cut+kx)], (12)
where the overall phase term equal to CPI + cpz - CP3 has been omitted. Substitution of this expression into Eq. (9) yields the general solution for the DFWM electric field amplitude,
C X(3) 'lL (2x) Orr 2 A4(0,t)=--zm:-Y(t-T) dxY t--
, znr 0 Vr
- C (3)' ,.:.,
+ .oXs Y(t~T) ~ s'
(13)
since . 'T1=t· when x=o. In. this expression, Co=-~128:;Scu2Ilol2ol301c5,and Vs and Vr are the group velocities in the ,sample and the reference, respectively. The first term in Eq. (13) clearly results from the nolinearity of the reference,. while. the second term is due to the sample. The extra term in the bracket of the second integrand is required by the condition that A4 be continuous across the interface (neglecting refleCtion losses). ;;.,
We next tum to limiting forms of the general relation, Eq. (13). We assume in the following discussion that the envelope function Yet) i.s:'integrable and peaked at the origin. Thus Y(t) ->0 if t<,--:-T or t>T; where T describes the width of Yet). It therefore follows that the product Y(t- ny2(t-2xlv) ->0 when x<v(T -1")/2 or when X>V(T+T)/2.
A. Thick reference media
For a thick reference, we assume that Lr>TVr. If we restrict the time delay T under consideration by the condition
~ 2L' t<T<_r_T,
Vr (14)
then the second term in Eq. (13) can be neglected. In other words, for the case of an instantaneous material response, the nonlinearity is localized in space to a region determined by the overlap position and the width of the counterpropagating pulses. If the integrand tends to zero sufficiently rapidly, the limits of integration can then be extended to obtain
_. C (3) oX foc A4(0,t) ~~ dxY(t- T)?(t-2xlv) ln r - 00
(15)
COX;3) , Vr =---=m;:Y(t- T) -2 T!>(16)
znr
where T1=f'::.oodsy2(s). The total DFWM signal energy'incident on the detector is given by
4 42 1T cu (3) 22 3
=-::4T [Xr ] Ilolzol30vrTl' nrC
(17)
This expression is independent of the delay, T, so long as Eq. (14) is satisfied.
B.Ihin sample
We assume here (1) Ls<'TVs, and (2) the contribution of the substrate is much smaller than the peak value of the sample. Since Y(t) is slowly varying over a length Ls' the electric field amplitUde is therefore
, COX~3) - 2 .' '., - . A4(0,t) 9!!.--zm:-Y(t-T)Y cr-2L/vs)Ls' (18)
zns
x f~oc dt'?(tI'-T')~y4(t,), (19)
whereT'=T-2L/vs·
C; Comparison of thin and thick results
The experiments reported here relied on comparison of the signal from a thick substrate, used as a reference, and a thin sample. The ratio of the maximum value for the thin sample, obtained from Eq. (19) with T' =0, to the constant value obtained from Eq. (17) is
w~ax (nr)4[X;3)]24L;T2 --- - ::m ~ g>~ax- ns Xr vrT1 '
where T2=f~oodsy6(S). Solving Eq. (20) known X~3), we obtain
2 L* g>max (3) (3) (ns) . s
Xs =Xr'n T wmax, r s r
where L* is an effective length givenby
L*='2 rR_~ rR - 2 VT; - 2nr VT;'
(20)
for the un-
(21 )
(22)
This expression was obtained by assuming that the dispersion of the reference media is negligible, so that vr'Zculk =clnr •
J. Chern. Phys., Vol. 100, No. 4,15 February 1994 Downloaded 23 Sep 2013 to 128.233.210.97. This article is copyrighted as indicated in the abstract. Reuse of AIP content is subject to the terms at: http://jcp.aip.org/about/rights_and_permissions
3330 Marcy et sl.: Four-wave mixing in poly(p-phenylene) oligomers
TABLE I. Normalization factor for effective length for several intensity pulse shapes. The quantity rp is the half-maximum full.width of the intensity for each shape.
r L*nr Name [F(t)]2 rp CTp
Square _11; Itl<r 0.5
- 0; It I >r Gaussian =exp[ - (t/1")2] 1.6651 0.7005
Triangular _11-ltlrl; Itl<r 1 0.7071
- 0; It 1 >r Sech squared = sech2(t/r) 2.7196 0.7768
One-sided exponential -lexP( -tlr); t>O 0.6931 1.2494
- 0; t<O Lorentzian 1 2 1.2825
1 + (tlr)2
Table I lists normalized values of L * for several common pulse shapes. As expected, the trend is for tightly peaked pulses to have smaller effective lengths than those with large "wings." However,. even for these dramatically different pulse shapes, L * does not substantially differ from T pClnr• This implies that complete knowledge of the pulse shape, which is difficult to obtain experimentally, is not critical to the estimation of X;3) using this relative technique.
IV. RESULTS AND DISCUSSION
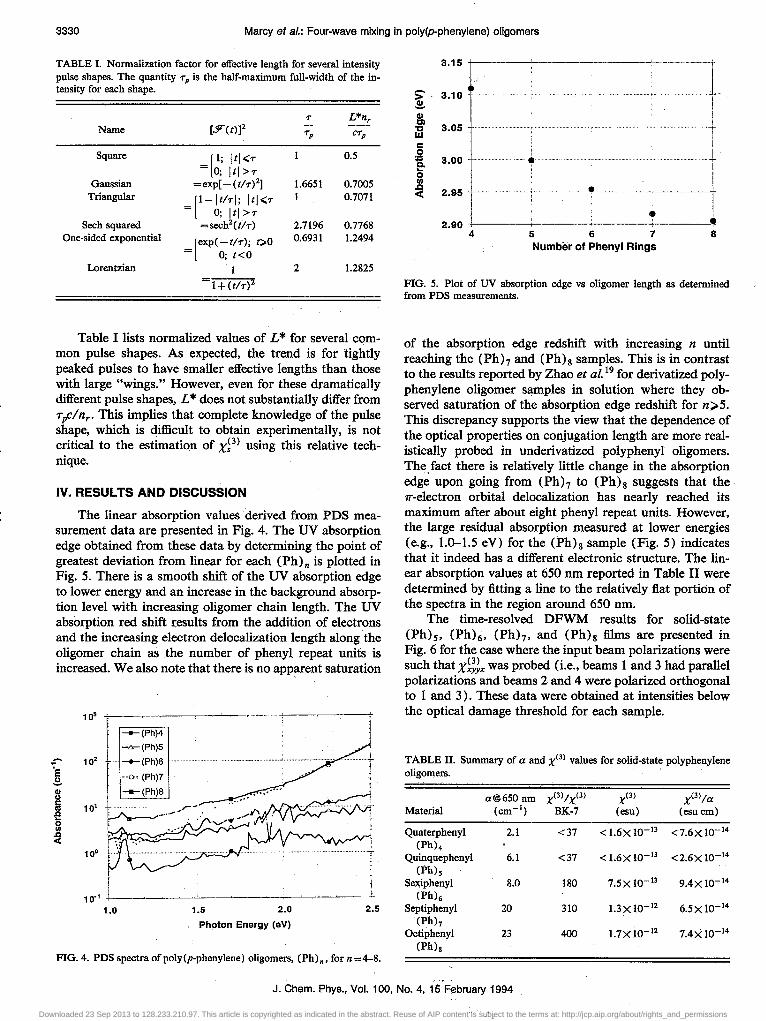
The linear absorption values derived from PDS measurement data are presented in Fig. 4. The UV absorption edge obtained from these data by determining the point of greatest deviation from linear for each (Ph)n is plotted in Fig. 5. There is a smooth shift of the UV absorption edge to lower energy and an increase in the background absorption level with increasing oligomer chain length. The UV absorption red shift results from the addition of electrons and the increasing electron delocalization length along the oligomer chain as the number of phenyl repeat units is increased. We also note that there is no apparent saturation
-E S Q) (.) C til
€ 0 UI
.Q c(
10'
10'
101
10·
___ (Ph)4
-o--(Ph)5
-+-(Ph)6 I ··0' (Ph)7
~:"'-'/"': [
.-..... ~.~~~ .v .... ~""..J"'.· .f~vl
10.1 l---~~~--,-'--~-~,---,-~-~-~-----,-1.0 2.0 2.5
Photon Energy (eV)
FIG. 4. PDS spectra ofpoly(p-phenylene) oligomers, (Ph)., for n=4--8.
3.15
! 3.10 1 G) ! til 3.05 "D w c
i 3.00 ...
,t
.J I
....... , .. 0 1/1 .c
2.95 «
2.90 .
• .] 4 5 6 7 8
Number of Phenyl Rings
FIG. 5. Plot of UV absorption edge vs oligomer length as determined from PDS measurements.
of the absorption edge redshift with increasing n until reaching the (Phh and (Ph)g samples. This is in contrast to the results reported by Zhao et al. 19 for derivatized polyphenylene oligomer samples in solution where they observed saturation of the absorption edge redshift for n>5. This discrepancy supports the view that the dependence of the optical properties on conjugation length are more realistically probed in underivatized polyphenyl oligomers. The. fact there is relatively little change in the absorption edge upon going from (Ph)7 to (Ph)g suggests that the 'IT-electron orbital delocalization has nearly reached its maximum after about eight phenyl repeat units. However, the large residual absorption measured at lower energies (e.g., 1.0-1.5 eV) for the (Ph}g sample (Fig. 5) indicates that it indeed has a different electronic structure. The linear absorption values at 650 nm reported in Table II were determined by fitting a line to the relatively flat portion of the spectra in the region around 650 nm.
The time-resolved DFWM results for solid-state (Ph>S, (Ph)(j, (Phh, and (Ph)g films are presented in Fig. 6 for the case where the input beam polarizations were such that X~;;x was probed (i.e., beams 1 and 3 had parallel polarizations and beams 2 and 4 were polarized orthogonal to 1 and 3). These data were obtained at intensities below the optical damage threshold for each sample.
TABLE II. Summary of a and X(3l values for solid-state polyphenylene oligomers.
Material
Quaterphenyl (Ph)4
Quinquephenyl (Ph)s
Sexiphenyl (Ph)6
Septiphenyl (Ph),
Octiphenyl (Ph)s'
a@650nm (em-I)
2.1
6.1
8.0
20
23
X(3l/ X(3)
BK-7
<37
<37
180
310
400
xC3) X(3l / a (esu) (esucm)
< 1.6XlO-13 <7.6XlO- 14
< 1.6 X 10⁻¹³ <2.6x 10⁻¹⁴
7.5XlO- 13 9AXlO- 14
1.3 X 10⁻¹² 6.5XlO- 14
L7xio- 12 7.4)(10- 14
J. Chern. Phys., Vol. 100, No.4, 15 February 1994
Downloaded 23 Sep 2013 to 128.233.210.97. This article is copyrighted as indicated in the abstract. Reuse of AIP content is subject to the terms at: http://jcp.aip.org/about/rights_and_permissions

Marcy et al.: Four-wave mixing in poly(p-phenylene) oligomers 3331
1400 -r-;::=:::;:;t;::;----(Ph)S
1200 --(Ph)8
1000 -" -w-- (Ph)7
:
--(Ph)8 800
i I ............. ·j·\·····················I·············;···················i·····~···················+
.................. ; .... ,,1 600-'-'1 ..
400 : ," _ .., .. ' ,. ", ~ ~'IIl'''''', ."._~"",,"~ ...... ,
200 1 '
'- ""'111 .L.J.... o L .... -~ ;t ;~zrn' ne it? rJw T" Or '~l
-200 .. "" .. -1--. --+---+---+-"""---2 -1 0 1 2 3'
Time Delay (ps)
FIG. 6 .. Time-resolved degenerate four-wave mixing data of (Ph) n for n=5-S.
For probe beam (beam 2) delays of less thim -10 ps, there was no signal because the probe beam arrived before the writing beams are coincident in the sample or substrate. The zero delay position (i.e., T=O) is estimated as the delay which gave the maximum fitted peak height for each sample. The DFWM signal from the BK-7 substrate material extended from roughly - 10 ps time delay to the point where the large signal spike corresponding to" the sample response was observed. To separate the transient response for the sample from that for the substrate, the sample had to be oriented such that the film surface faced the probe beam (beam 2), as shown in Fig. 3. This insured that the first grating sampled. by the probe beam is that written in the sample. If the sample surface faced beams 1 and 3, at delay times where O<t<ns(Lr+Ls)/c, the probe beam would have sampled both the transient response of the sample and the signal due to the substrate making it difficult to separate the relative contributions to the measured signal.
The most striking observation from these data is that the response for all the (Ph) n samples was strongly dominated by an extremely fast (pulse-width limited) response component. There was no evidence for a long-lived component of the DFWM signal with the exception .of the signal for (Ph)g where we observed a small tail component having a time constant of -10 ps, as well as a feature whose decay time is much longer than the time delay available in our present apparatus (-100 ps). These results are consistent with a predominantly electronic nature to the nonlinear response which is likely due to the polarization of delocalized charge along the oligomer backbone. Although the one-photon absorption reported above is small, we cannot rule out the possibility that an excited state population grating contributes to the DFWM signal, but this grating would have to be extremely short-lived ( < 140 fs). These data are in sharp contrast to the results for derivatized polyphenyl oligomers in solution for which a very large component of the DFWM signal had a long ().1O ps) decay for samples with n> 5. 19 This further suggests that derivatization of the central phenyl unit causes a significant change in the electronic bandstructure of the
10' t--~-~
10'
-e- (Ph)6 Signal
___ (Ph)8 Signal
1 ~ l·············,·············,··············o·,,······ ·""0··"···· ····················1·
:Cl
···········t
t ~~J
10' f 10. J -~~--•
0.1 10
Energy in Beam 2 (nJ)
FIG. 7. Intensity dependence of the DFWM signal peak for (Ph)6 and (Ph)g.
material and/or that there are additional response mechanisms (e.g., nuclear and/or librational) contnbuting to the X(3) response for the solution-based oligomers.
The da~a shown here were for a nominally 650 nm excitation wavelength. We also performed several DFWM measurements for each of the s~ples as a function of wavelength in the range between 620 and 650 nm. The results obtained were essentially identical to those presented above. This behavior is consistent with a nonresonant response mechanism.
Further evidence supporting a purely electronic response for the solid state (Ph)n samples isshown in Fig. 7, where the intensity dependence of the DFWM signal peak (i.e., at t~O) is shown for (Ph)6 and (Ph)g. The solid lines in Fig. 7 represent the nonlinear Ieast-squares fit to a third-order power law. The observed cubic dependence for these data (solid lines) supports the claim that there is no enhancement of the observed signal as a result of twophoton absorption or higher order nonlinear processes. 19
The apparent deviation from a cubic dependence at low intensities is related to the signal to noise ratio for these experiments and is clearly subcubic. For the (Ph)g sample, our measurements of the intensity dependence of the observed tail signal made at probe beam delay values several pulse lengths away for the signal peak also displayed a cubic dependence.
Table II reports the results obtained for a, X(3), and X<3) /a for (Ph)4 through (Ph)g. The values of a are those obtained on the film samples at 650 nm (1.9 eV) using the PDS technique. The X<3) values reported refer to the peak value obtained, which occurs when all three optical beams temporally overlap in the sample, and were determined using the relative method described in Sec. III. For the (Ph)4 and (Ph)s samples, we were not able to resolve a signal larger than that which we observed for the substrate. Therefore, in Table II we have used the substrate value28 to set an upper bound on the X(3) values for these samples. Plotting the X(3) values for the (Ph) n samples as a function of chain length (Fig. 8) indicates that the values monoton-
J. Chern. Phys., Vol. 100, No.4, 15 February 1994 Downloaded 23 Sep 2013 to 128.233.210.97. This article is copyrighted as indicated in the abstract. Reuse of AIP content is subject to the terms at: http://jcp.aip.org/about/rights_and_permissions

3332 Marcyet sf.: Four-wave mixing in poly(p-phenylene) oligomers
10.13 +-_--.l!lL_....JjL_ .... -i-___ -;.. __ -+-__ --+ 3 4 5 6 7 8 9
Number of Phenyl Rings
FIG. 8. Plot of X(3) vs chain length for thin films of (Ph). for n=5-8.
ically increase as the conjugation length is increased. However, these data show clearly that an anomalous increase in the observed X(3) values occurs for n;;.6. These results are similar to those in Refs. 19 and 21, where a sharp increase in the molecular second hyperpolarizability r was observed for poly thiophene and derivatized polyphenyl oligomers having between four and six repeat units. It would appear that there is a relatively long critical delocalization length which must be achieved before an appreciable nonresonant optical nonliIiearity can be observed. Also clear from Table II and Fig. 8 isthat the bulk X(3) values for the polyphenylene oligomers are not as large as those predicted by extrapolation of the r measurements made in dilute solutions. The largest X(3) value we observed was about 5XCS2 for the (Ph)8 sample. This result highlights the difficulties associated with estimating the local-field correction factors when extrapolating a bulk X(3) value from experimental results for dilute solutions. '.
It is also interesting to plot the value of the figure of merit X<3) fa vs the oligomer chain length as'shown in Fig. 9. The increase with n in the measured value of X(3) at .650 nm occurs concomitantly with an increase in' the linear absorption. This somewhat surprising result strengthens
" 10-14 -I 0(:
3 4' 5 6 7 8
Number of Phenyl Rings
FIG. 9. Plot ofx(3l/a as a function of chain length for thin films of (Ph). for n=5-8.
the argument that mechanisms other than extended electron delocalization will be required to design materials having improved device figures of merit.
v. SUMMARY AND CONCLUSIONS
We have shown that vacuum deposited poly(pphenylene) oligomers have potential for providing low loss materials having large third-order optical nonlinearities. Based on our measurements, the nonlinearities for these materials are probably purely electronic and have magnitudes on the order of that for CS2 • The small absorption coefficients suggest that they may be useful for waveguide
. h b b' ed . . t d' 21.22 deVIces. As as een 0 serv in preVIOUS s u les, our results indicate that a critical electron delocalization length must be achieved to observe an appreciable nonresonant X(3). We have further shown that there can be large differences in the nonlinear optical behavior between solid-state and dilute solutions of similar materials and that it can be misleading to infer the solid-state properties based on solution-based results.
ACKNOWLEDGMENTS
The authors thank Patricia Cunningham and May-Lin DeHaan for help in synthesizing, purifying, and depositing the polyphenylene oligomers; Haluk Sankur for his assistance in fitting the UV -VIS transmission data; and b?th Fred Vachss and Ragini Saxena for helpful discussions rel~ ative to the theory of DFWM in thick and thin media. This work was partially supported by the Wright Laboratory Materials Directorate and the Strategic Defense Initiative Organization under Contract .. No. F33615-90-C-5805. Work at Sandia National Laboratory was performed under the auspices of the U.S. Department of Energy Contract No" DE-AC04-76DPOO789.
1 V. Mizrahi. K: W. DeLong; G. I. Stegeman. M. A. Saifi, and M. J. 'Andrejco, Opt. Lett. 14, 1140 (1989). 2C. S. Winter, S. N. Oliver, J. D. Rush, R. J. Manning, C. Hill, and A. Underhill, in Materials for Nonlinear Optics, ACS Symposium Series No. 455, edited by S. R. Marder, J. E. Sohn, and G. D. Stucky (American Chemical Society, Washirigton, D.(:., 1991), pp. 616-625.
3p. N. Prasad, in Materials/or Nonlinear Optics-Chemical Perspectives, ACS Symposium Series, edited by S. R. Marper, J. E. Sohn, and G. D. Stucky (American Chemical Society, Washington, D.C., 1991), Vol. 455, pp. 50-66. . ,
4 Materials for Nonlinear Optics-Chemical Perspectives, edited by S. R. Marder, J. E. Sohn, and G. D. Stucky (American Chemical Society, Washington, D.C., 1991), Vol. 455.
S Nonlinear Optical Properties 0/ Organic Molecules and Crystals, edited by D. S. Chemla and J. Zyss (Academic, New York, 1987).
6 J. S. Shirk, J. R. Lindle, F. J. Bartoli, Z. H. Kafafi, and A. W. Snow, in Materials/or Nonlinear Optics, ACS Symposium Series No. 455, edited by S. R. Marder, J. E. Sohn, and G. D. Stucky. (American Chemical Society, Washington, D.C., 1991), pp. 626-634.
7 J. S. Shirk, J. R. Lindle, F. J. Bartoli, C. A. Hoffman, Z. H. Kafafi, and A. W. Snow, Appl. Phys. Lett. 55, 1287 (1989).
8z. Z. Ho, C. y. Ju, and W. M. Hetherington III, J. Appl. Phys. 62, 716 (1987).
9N. P. Xuan, J.-L. Ferrier, J. GazengeI, and G. Rivoire, Opt. Commun. 51,433 (1984). ..
lOZ. H. Kafafi, J. R. Lindle, C. S. Weisbecker, F. J. Bartoli, J. S. Shirk, T. H. Yoon, and O.-K. Kim, Chern. Phys. Lett. 179, 79 (1991).
J. Chern. Phys., Vol. 100, No.4, 15 February 1994
Downloaded 23 Sep 2013 to 128.233.210.97. This article is copyrighted as indicated in the abstract. Reuse of AIP content is subject to the terms at: http://jcp.aip.org/about/rights_and_permissions

Marcy et al.: Four-wave mixing in poly(p-phenylene) oligomers 3333
11 C. S, Winter, C. A. S. Hill, and A. E. Underhill, Appl. Phys. Lett. 58, 107 (1991).
12G. M. Carter, M. K. Thakur, Y. J. Chen, ana J. V. Hryniewicz, 'Appl. Phys. Lett. 47, 457 (1985).
13B. P. Singh, M. Samoc, H. S. Nalwa, and P. N. Prasad, J. Chern. Phys. 92,2756 (1990).
14p. D. Townsend, J. L. Jackel, G. L. Baker, I. J. A. Shelburne, and S. Etemad, Appl. Phys. Lett. 55, 1829 (1989).
ISF. Garnier, G. Horowitz, and D. Fichou, Synth. Met. 28, C705 (1989). 16 Nonlinear Optical Properties of Polymers, edited by A. J. Heeger, J.
Orenstein, and D. R. Ulrich (Materials Research Society, Pittsburgh, 1987), Vol. 109.
17p. N. Prasad and B. A. Reinhardt, Chern. Mater. 2, 660 (1990). \8D. Fichou, F. Garnier, F. Charra, F. Kajzar, and:r. Messier, Spec.
Publ.-R. Soc. Chern. 69, 176 (1989). ' 19M. Zhao, Y. Chiu, M. Samoc, P. N. Prasad, M. R. Unroe, and B. A.
Reinhardt, J. Chern. Phys. 95, 3991 (1991). . 2oM._T. Zhao, M. Samoc, B. P. Singh, and P. N. Prasad, J: Phys. Chern.
93, 7916 (1989).
21 H. Thienpout, Q. L. LA. Rikken, and E. W. Meijer, Phys .. Rev. Lett. 65, 2141 (1990):
22M._T. Zhao, B. P. Singh, and P. N. Prasad, J. Chern. Phys. 89, 5535 (1988).
23B. F. Levine, J. Chern. Phys. 63, 2666 (1975). 24M. Dory, V. P. Bodart, J. Defhalle, J. M. Andre, and. J. L. Bredas, in
Nonlinear Optical Properties of Polymers, edited by A. J. Heeger, J. Orenstein, and D. R. Ulrich (Materials Research Society, Pittsburgh, 1988), Vol. 109, pp. 239-250.
25M. R. Unroe and B. A. Reinhardt, Synth. 1987,981; P. Kovacic and R. M. Lange, J. Org. Chern. 29, 2416 (1964).
26W. B. Jackson, l'LM. Arner, A. C. Boccara, and D. Fournier, Appl. .. Opt. 20, 1333 (1981). . 27 C. H. Seager; M. Sinclair, D. M. McBranch, A. J. Heeger, and G. L.
Baker, Synth. Met. 49-50, 91 (1992). . 28 A.Owyoung, R. W. Hellwarth, and N. George, Phy~. Rev. B 5, 628
( 1972). 29y. R.. Shen, in The Principles of Nonlinear Optics (Wiley, New
York, 1984).
J. Chern. Phys., Vol. 100, No.4, 15 February 1994
Downloaded 23 Sep 2013 to 128.233.210.97. This article is copyrighted as indicated in the abstract. Reuse of AIP content is subject to the terms at: http://jcp.aip.org/about/rights_and_permissions