time-domain spectral induced polarization based on pseudo-random sequence
TRANSCRIPT

Time-Domain Spectral Induced Polarization Based on Pseudo-random Sequence
MEI LI,1 WENBO WEI,1 WEIBIN LUO,1 and QINDONG XU1
Abstract—To reduce noise during electrical prospecting, we
hereby propose a new method using correlation identification
technology and conventional electrical exploration devices. A
correlation operation can be carried out with the transmitted
pseudo-random sequence and received time signal to suppress the
random noise, and the time-domain impulse response and fre-
quency response of the frequency domain of the underground
media can be obtained. At the same time, using a dual Cole–Cole
model to fit a complex resistivity spectrum, which is close to the
frequency response, we can get a variety of induced polarization
parameters and electromagnetic parameters of subsurface, which
can provide more useful information for the exploration of mineral
resources. This time domain prospecting method can effectively
improve the efficiency of the spectral induced polarization method.
In this article, we have carried out theoretical calculations and a
simulation to prove the feasibility of such a method.
Key words: Pseudo-random sequence, SIP,
correlation identification technology, MTEM.
1. Introduction
Conventional electrical prospecting is signifi-
cantly limited by noise and low efficiency. The
depletion of easily discovered mine reserves and
other raw materials has triggered a renewed interest
in alternative techniques for exploration.
In electrical prospecting, the use of a pseudo-
random signal as the transmitter signal source has
been shown to improve the signal-to- noise ratio
(SNR). As an example, the multi-transient electro-
magnetic system (MTEM) (ZIOLKOWSKI et al., 2006,
2007, 2009) has become an established commercial
system whose second and third generation equipment
has been used to generate pseudo-random sequences
instead of step signals, with significantly improved
SNR.
An MTEM system obtains the impulse responses
of the subsurface by deconvolution of the transmitted
and received signals. However, according to the
correlation identification theory, the correlation
operation of the received time sequence with a sent
pseudo-random sequence can not only remove ran-
dom noise to improve SNR, but also easily obtain the
impulse response and frequency response of under-
ground media (DUNCAN et al., 1980; QUINCY et al.,
1980; LUO and LI, 2009). They employed electro-
magnetic methods in their approach to interpret the
frequency response, whereas MTEM is based on DC
resistivity inversion by the peak of the impulse
response.
In fact, the complex resistivity spectrum of the
underground media can be deduced from its fre-
quency response (PRASAD et al., 2010; LIU, 2010), but
they did not explain how to obtain the complex
resistivity spectrum from its frequency response.
In this paper, we aim to propose a complex
resistivity method based on the pseudo-random
sequence, verify its feasibility with simulation, and
provide the theoretical basis for further development
of a newer generation of electrical prospecting
devices.
With fitting and inversion using the spectral
induced polarization method (SIP) of dual Cole–
Cole, we can obtain more parameters and improve the
accuracy of characterization of the underground
media. Therefore, this strategy can be considered as a
time-domain SIP method since a complex resistivity
spectrum of the subsurface can be obtained with a
single transmit–receive sequence.
1 China University of Geosciences (Beijing), Beijing 100083,
China. E-mail: [email protected]
Pure Appl. Geophys.
� 2012 Springer Basel
DOI 10.1007/s00024-012-0624-z Pure and Applied Geophysics
2. The Correlation Identification of Subsurface
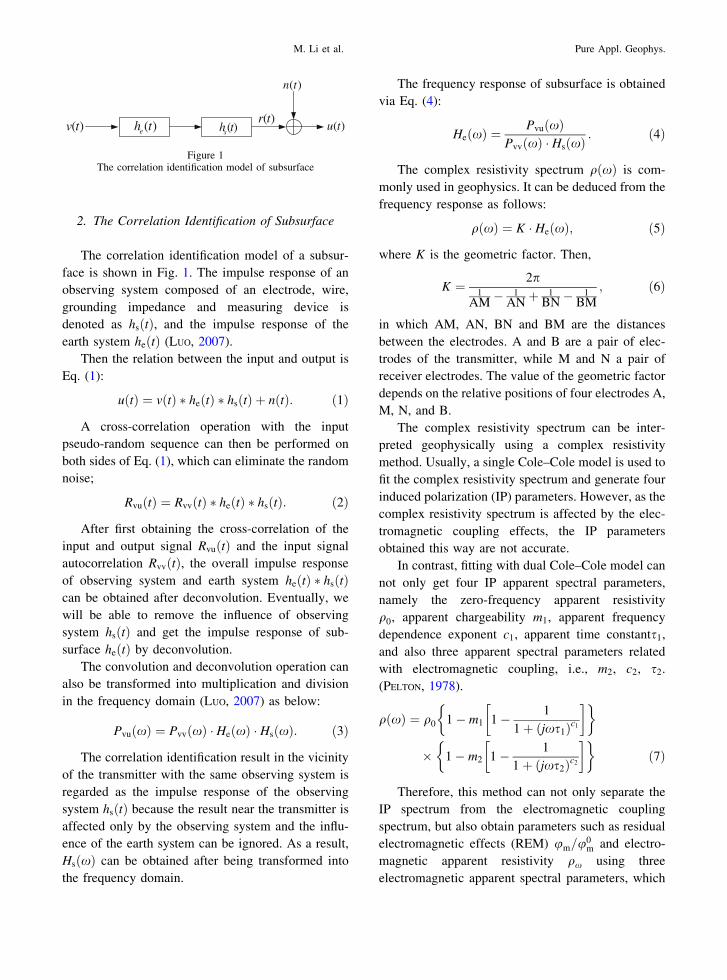
The correlation identification model of a subsur-
face is shown in Fig. 1. The impulse response of an
observing system composed of an electrode, wire,
grounding impedance and measuring device is
denoted as hsðtÞ, and the impulse response of the
earth system heðtÞ (LUO, 2007).
Then the relation between the input and output is
Eq. (1):
uðtÞ ¼ vðtÞ � heðtÞ � hsðtÞ þ nðtÞ: ð1Þ
A cross-correlation operation with the input
pseudo-random sequence can then be performed on
both sides of Eq. (1), which can eliminate the random
noise;
RvuðtÞ ¼ RvvðtÞ � heðtÞ � hsðtÞ: ð2Þ
After first obtaining the cross-correlation of the
input and output signal RvuðtÞ and the input signal
autocorrelation RvvðtÞ, the overall impulse response
of observing system and earth system he tð Þ � hs tð Þcan be obtained after deconvolution. Eventually, we
will be able to remove the influence of observing
system hsðtÞ and get the impulse response of sub-
surface heðtÞ by deconvolution.
The convolution and deconvolution operation can
also be transformed into multiplication and division
in the frequency domain (LUO, 2007) as below:
PvuðxÞ ¼ PvvðxÞ � HeðxÞ � HsðxÞ: ð3Þ
The correlation identification result in the vicinity
of the transmitter with the same observing system is
regarded as the impulse response of the observing
system hsðtÞ because the result near the transmitter is
affected only by the observing system and the influ-
ence of the earth system can be ignored. As a result,
HsðxÞ can be obtained after being transformed into
the frequency domain.
The frequency response of subsurface is obtained
via Eq. (4):
HeðxÞ ¼PvuðxÞ
PvvðxÞ � HsðxÞ: ð4Þ
The complex resistivity spectrum qðxÞ is com-
monly used in geophysics. It can be deduced from the
frequency response as follows:
qðxÞ ¼ K � HeðxÞ; ð5Þ
where K is the geometric factor. Then,
K ¼ 2p1
AM� 1
ANþ 1
BN�1
BM
; ð6Þ
in which AM, AN, BN and BM are the distances
between the electrodes. A and B are a pair of elec-
trodes of the transmitter, while M and N a pair of
receiver electrodes. The value of the geometric factor
depends on the relative positions of four electrodes A,
M, N, and B.
The complex resistivity spectrum can be inter-
preted geophysically using a complex resistivity
method. Usually, a single Cole–Cole model is used to
fit the complex resistivity spectrum and generate four
induced polarization (IP) parameters. However, as the
complex resistivity spectrum is affected by the elec-
tromagnetic coupling effects, the IP parameters
obtained this way are not accurate.
In contrast, fitting with dual Cole–Cole model can
not only get four IP apparent spectral parameters,
namely the zero-frequency apparent resistivity
q0, apparent chargeability m1, apparent frequency
dependence exponent c1, apparent time constants1,
and also three apparent spectral parameters related
with electromagnetic coupling, i.e., m2, c2, s2.
(PELTON, 1978).
qðxÞ ¼ q0 1� m1 1� 1
1þ ðjxs1Þc1
� �� �
� 1� m2 1� 1
1þ ðjxs2Þc2
� �� �ð7Þ
Therefore, this method can not only separate the
IP spectrum from the electromagnetic coupling
spectrum, but also obtain parameters such as residual
electromagnetic effects (REM) um=u0m and electro-
magnetic apparent resistivity qx using three
electromagnetic apparent spectral parameters, which
)(tv)(tr
)(tn
)(tu)(ths)(the
Figure 1The correlation identification model of subsurface
M. Li et al. Pure Appl. Geophys.
can significantly improve the detection accuracy (LUO
and ZHANG, 1998).
The result obtained in one measuring point are
the apparent spectral parameters, which reflect the
overall information about the subsurface between
the source and receiver electrodes. What we truly
need is the intrinsic Cole–Cole model parameters of
the target polarization body (ore, oil or gas reser-
voirs to be ascertained, etc.) and its geometric
distribution (including depth, thickness, shape and
other information). Therefore, information from
more than two measurement points is needed. The
information can be greatly enriched by multi-offsets
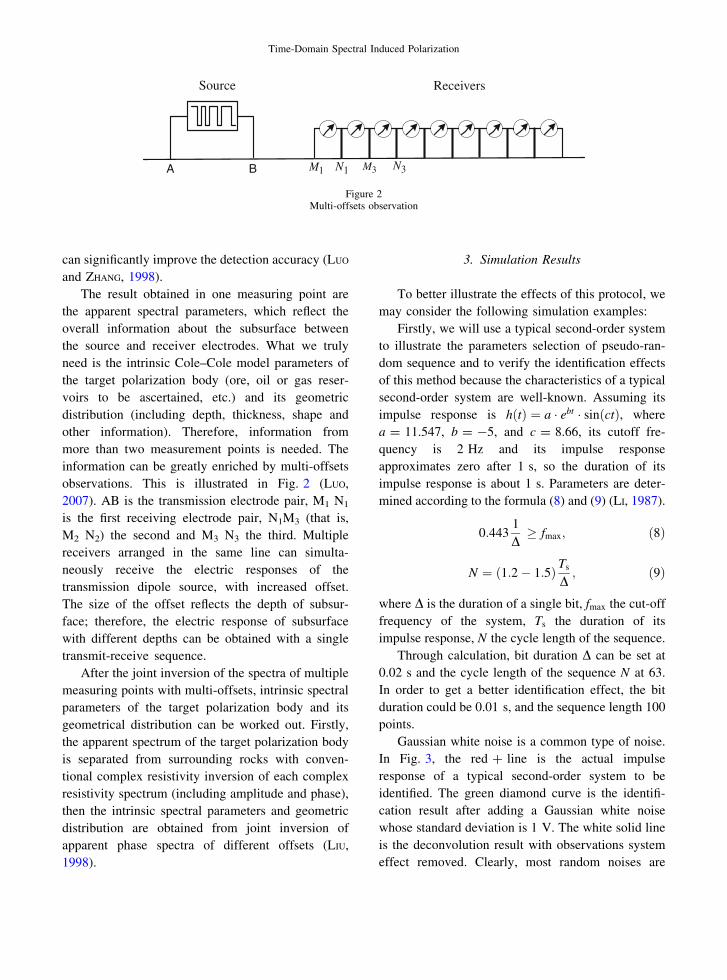
observations. This is illustrated in Fig. 2 (LUO,
2007). AB is the transmission electrode pair, M1 N1
is the first receiving electrode pair, N1M3 (that is,
M2 N2) the second and M3 N3 the third. Multiple
receivers arranged in the same line can simulta-
neously receive the electric responses of the
transmission dipole source, with increased offset.
The size of the offset reflects the depth of subsur-
face; therefore, the electric response of subsurface
with different depths can be obtained with a single
transmit-receive sequence.
After the joint inversion of the spectra of multiple
measuring points with multi-offsets, intrinsic spectral
parameters of the target polarization body and its
geometrical distribution can be worked out. Firstly,
the apparent spectrum of the target polarization body
is separated from surrounding rocks with conven-
tional complex resistivity inversion of each complex
resistivity spectrum (including amplitude and phase),
then the intrinsic spectral parameters and geometric
distribution are obtained from joint inversion of
apparent phase spectra of different offsets (LIU,
1998).
3. Simulation Results
To better illustrate the effects of this protocol, we
may consider the following simulation examples:
Firstly, we will use a typical second-order system
to illustrate the parameters selection of pseudo-ran-
dom sequence and to verify the identification effects
of this method because the characteristics of a typical
second-order system are well-known. Assuming its
impulse response is h tð Þ ¼ a � ebt � sin ctð Þ, where
a = 11.547, b = -5, and c = 8.66, its cutoff fre-
quency is 2 Hz and its impulse response
approximates zero after 1 s, so the duration of its
impulse response is about 1 s. Parameters are deter-
mined according to the formula (8) and (9) (LI, 1987).
0:4431
D� fmax; ð8Þ
N ¼ 1:2� 1:5ð Þ Ts
D; ð9Þ
where D is the duration of a single bit, fmax the cut-off
frequency of the system, Ts the duration of its
impulse response, N the cycle length of the sequence.
Through calculation, bit duration D can be set at
0.02 s and the cycle length of the sequence N at 63.
In order to get a better identification effect, the bit
duration could be 0.01 s, and the sequence length 100
points.
Gaussian white noise is a common type of noise.
In Fig. 3, the red ? line is the actual impulse
response of a typical second-order system to be
identified. The green diamond curve is the identifi-
cation result after adding a Gaussian white noise
whose standard deviation is 1 V. The white solid line
is the deconvolution result with observations system
effect removed. Clearly, most random noises are
1M 1N 3N3MA B
Source Receivers
Figure 2Multi-offsets observation
Time-Domain Spectral Induced Polarization
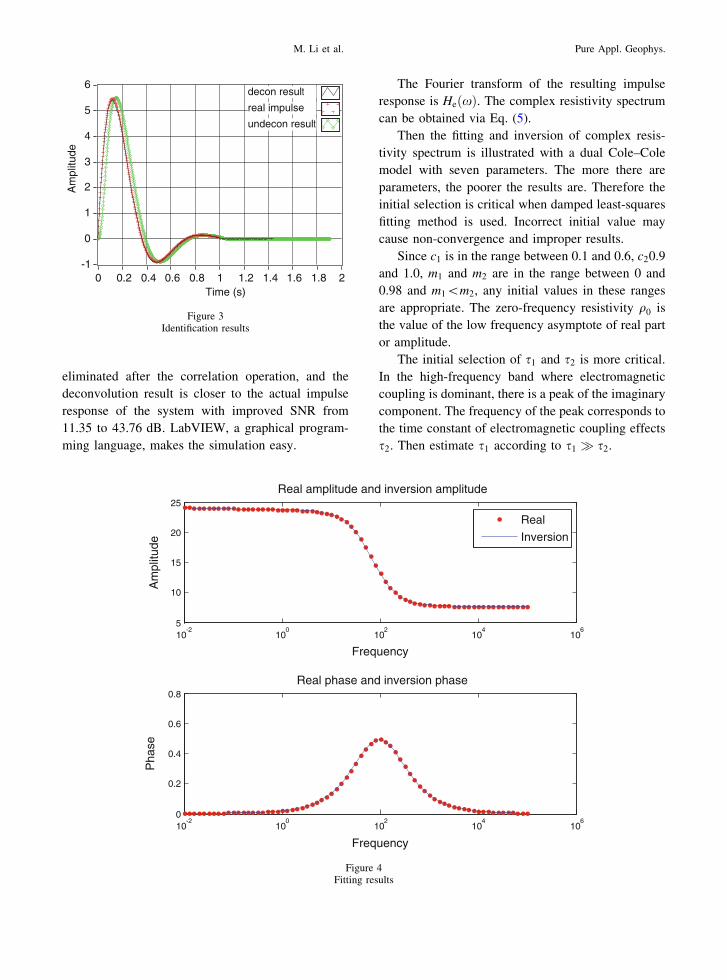
eliminated after the correlation operation, and the
deconvolution result is closer to the actual impulse
response of the system with improved SNR from
11.35 to 43.76 dB. LabVIEW, a graphical program-
ming language, makes the simulation easy.
The Fourier transform of the resulting impulse
response is HeðxÞ. The complex resistivity spectrum
can be obtained via Eq. (5).
Then the fitting and inversion of complex resis-
tivity spectrum is illustrated with a dual Cole–Cole
model with seven parameters. The more there are
parameters, the poorer the results are. Therefore the
initial selection is critical when damped least-squares
fitting method is used. Incorrect initial value may
cause non-convergence and improper results.
Since c1 is in the range between 0.1 and 0.6, c20.9
and 1.0, m1 and m2 are in the range between 0 and
0.98 and m1\m2, any initial values in these ranges
are appropriate. The zero-frequency resistivity q0 is
the value of the low frequency asymptote of real part
or amplitude.
The initial selection of s1 and s2 is more critical.
In the high-frequency band where electromagnetic
coupling is dominant, there is a peak of the imaginary
component. The frequency of the peak corresponds to
the time constant of electromagnetic coupling effects
s2. Then estimate s1 according to s1 � s2.
Am
plitu
de6
-1
0
1
2
3
4
5
Time (s)20 0.2 0.4 0.6 0.8 1 1.2 1.4 1.6 1.8
undecon result
decon result
real impulse
Figure 3Identification results
10-2
100
102
104
106
5
10
15
20
25
Frequency
Am
plitu
de
Real amplitude and inversion amplitude
Real
Inversion
10-2
100
102
104
106
0
0.2
0.4
0.6
0.8
Frequency
Pha
se
Real phase and inversion phase
Figure 4Fitting results
M. Li et al. Pure Appl. Geophys.
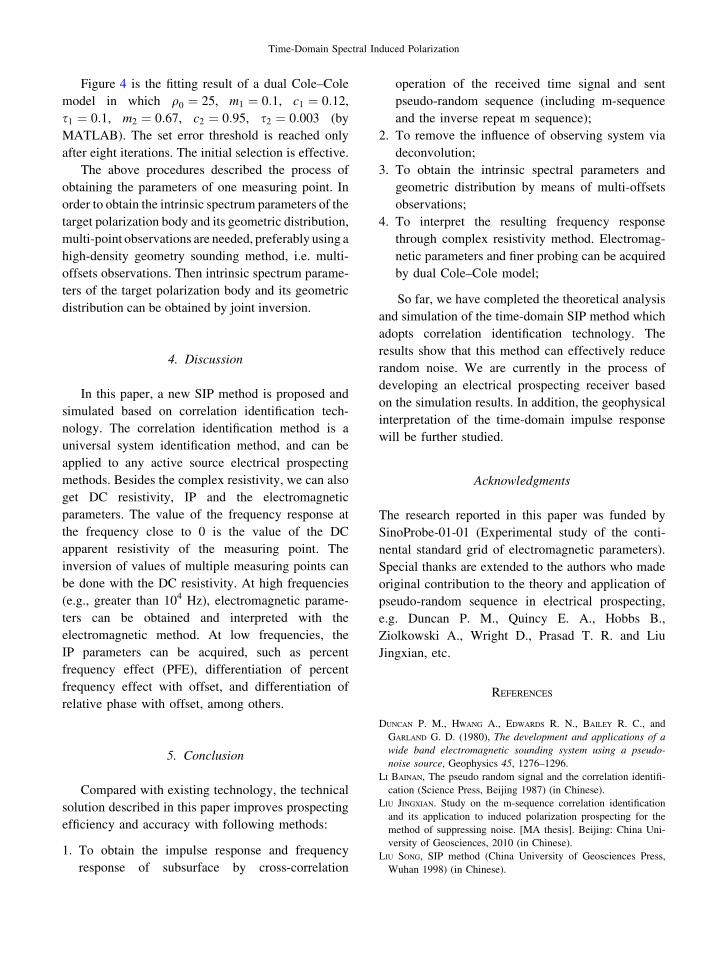
Figure 4 is the fitting result of a dual Cole–Cole
model in which q0 ¼ 25, m1 ¼ 0:1, c1 ¼ 0:12,
s1 ¼ 0:1, m2 ¼ 0:67, c2 ¼ 0:95, s2 ¼ 0:003 (by
MATLAB). The set error threshold is reached only
after eight iterations. The initial selection is effective.
The above procedures described the process of
obtaining the parameters of one measuring point. In
order to obtain the intrinsic spectrum parameters of the
target polarization body and its geometric distribution,
multi-point observations are needed, preferably using a
high-density geometry sounding method, i.e. multi-
offsets observations. Then intrinsic spectrum parame-
ters of the target polarization body and its geometric
distribution can be obtained by joint inversion.
4. Discussion
In this paper, a new SIP method is proposed and
simulated based on correlation identification tech-
nology. The correlation identification method is a
universal system identification method, and can be
applied to any active source electrical prospecting
methods. Besides the complex resistivity, we can also
get DC resistivity, IP and the electromagnetic
parameters. The value of the frequency response at
the frequency close to 0 is the value of the DC
apparent resistivity of the measuring point. The
inversion of values of multiple measuring points can
be done with the DC resistivity. At high frequencies
(e.g., greater than 104 Hz), electromagnetic parame-
ters can be obtained and interpreted with the
electromagnetic method. At low frequencies, the
IP parameters can be acquired, such as percent
frequency effect (PFE), differentiation of percent
frequency effect with offset, and differentiation of
relative phase with offset, among others.
5. Conclusion
Compared with existing technology, the technical
solution described in this paper improves prospecting
efficiency and accuracy with following methods:
1. To obtain the impulse response and frequency
response of subsurface by cross-correlation
operation of the received time signal and sent
pseudo-random sequence (including m-sequence
and the inverse repeat m sequence);
2. To remove the influence of observing system via
deconvolution;
3. To obtain the intrinsic spectral parameters and
geometric distribution by means of multi-offsets
observations;
4. To interpret the resulting frequency response
through complex resistivity method. Electromag-
netic parameters and finer probing can be acquired
by dual Cole–Cole model;
So far, we have completed the theoretical analysis
and simulation of the time-domain SIP method which
adopts correlation identification technology. The
results show that this method can effectively reduce
random noise. We are currently in the process of
developing an electrical prospecting receiver based
on the simulation results. In addition, the geophysical
interpretation of the time-domain impulse response
will be further studied.
Acknowledgments
The research reported in this paper was funded by
SinoProbe-01-01 (Experimental study of the conti-
nental standard grid of electromagnetic parameters).
Special thanks are extended to the authors who made
original contribution to the theory and application of
pseudo-random sequence in electrical prospecting,
e.g. Duncan P. M., Quincy E. A., Hobbs B.,
Ziolkowski A., Wright D., Prasad T. R. and Liu
Jingxian, etc.
REFERENCES
DUNCAN P. M., HWANG A., EDWARDS R. N., BAILEY R. C., and
GARLAND G. D. (1980), The development and applications of a
wide band electromagnetic sounding system using a pseudo-
noise source, Geophysics 45, 1276–1296.
LI BAINAN, The pseudo random signal and the correlation identifi-
cation (Science Press, Beijing 1987) (in Chinese).
LIU JINGXIAN. Study on the m-sequence correlation identification
and its application to induced polarization prospecting for the
method of suppressing noise. [MA thesis]. Beijing: China Uni-
versity of Geosciences, 2010 (in Chinese).
LIU SONG, SIP method (China University of Geosciences Press,
Wuhan 1998) (in Chinese).
Time-Domain Spectral Induced Polarization

LUO YANZHANG, and ZHANG GUIQING, Theory and application of
spectral induced polarization (Society of Exploration Geophysi-
cists 1998).
LUO WEIBIN. Study on Pseudorandom marine controlled-Source
electromagnetic sounding with multi-offsets. [PhD thesis].
Changsha: Central South University, 2007 (in Chinese).
LUO WEIBIN, and LI QINGCHUN (2009), Electromagnetic Explora-
tion Based on System Identification for Seafloor
Hydrocarbon Reservoir and Gas Hydrate, PIERS Proceedings,
1344–1348.
PRASAD TADEPALLI RAMMOHAN, RAMAYYA BOPPANA DASARADHA, RAO
YELAMANCHILI PURNACHANDRA. Process and device for measure-
ment of spectral induced polarization response using pseudo
random binary sequence (PRBS) current source. US Patent
2010/0102822 A1.
PELTON W.H., WARD S.H., HALLOF P.G. et al. (1978), Mineral
discrimination and removal of inductive coupling with multi-
frequency IP, Geophysics 43, 588–609.
QUINCY E. A., RHOADES MARK L., and STURM KIM A. (1980), Remote
Induction Sounding of Hanna Underground Coal Burn 11, Phase
1, Employing Pseudo noise Cross-Correlation Techniques,
Transactions on Geoscience and Remote Sensing, 18, 337–347.
ZIOLKOWSKI A., HOBBS B.A., and WRIGHT D. True amplitude tran-
sient electromagnetic system response measurement. WO2006/
114561_A2, 2006-11-02.
ZIOLKOWSKI A., HOBBS B.A., and WRIGHT D. (2007), Multitransient
electromagnetic demonstration survey in France, Geophysics,
72, 197–209.
ZIOLKOWSKI A. Optimization of MTEM parameters. US2009/
0230970_A1, 2009-09-17.
(Received April 30, 2012, revised November 5, 2012, accepted November 6, 2012)
M. Li et al. Pure Appl. Geophys.