time & cost overruns in the edinburgh tram network (etn ... · 1 time & cost overruns in...
TRANSCRIPT
1
Time & Cost Overruns in the Edinburgh Tram Network (ETN) Project: Causes and Scientific modelling
Prince BoatengDr Z. ChenProf. S.O. Ogunlana
11th July 2014
MEGAPROJECT Whole Action Workshop, MC & Joint Working Group Meetings, - IFB, Liverpool

Contents
Overview of the new ETN project
Causes of time and cost overruns
Scientific modelling
Summary


Overview
2001 – Feasibility studies of the Tram system
30 options drawn up
May 2002 – Formation of Transport Initiatives Edinburgh (Tie) plc by the City of Edinburgh Council (CEC)
o Tasked to deliver major transport projects for CEC, its owner.
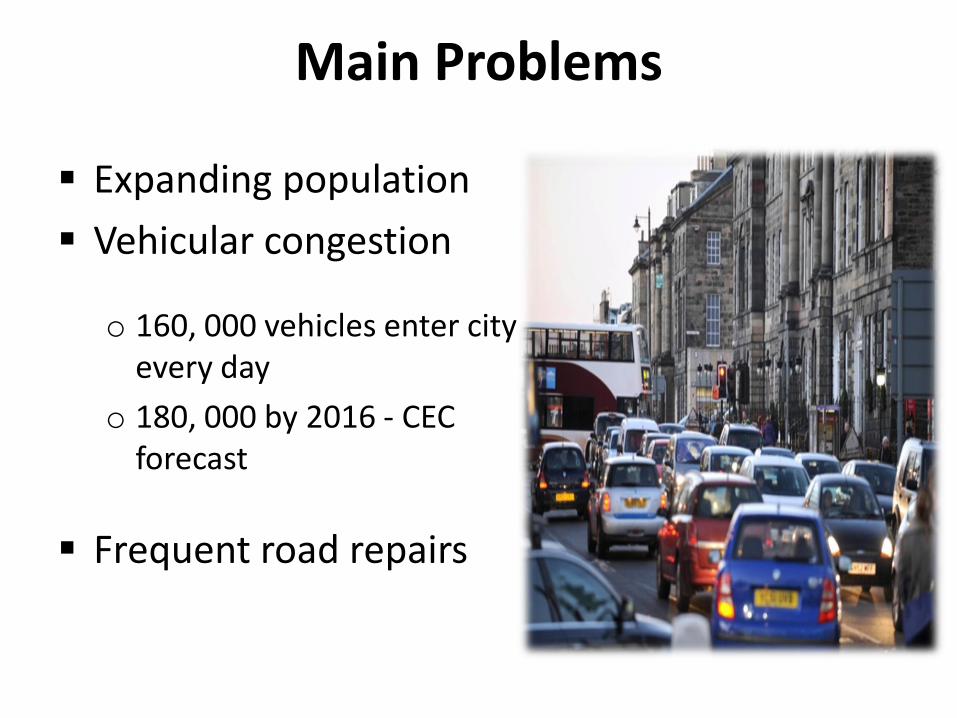
Main Problems
Expanding population
Vehicular congestion
o 160, 000 vehicles enter city every day
o 180, 000 by 2016 - CEC forecast
Frequent road repairs

Consultation & Response 24th March-18th May 2003
o 125, 000 leaflets distributed
o Several public meetings & Exhibitions
o Sectors consulted: Transport, Business, Environment, Tourism, Conservative/Heritage, Disability groups,
Utilities, etc.
Over 3,000 responses (83.6% in support of the new tram network)
January 2004 - Proposal submitted to the Scottish Parliament to reintroduce tram in Edinburgh

Objectives ETN Project
• Support the local economy by improving accessibility
• Promote sustainability and reduce environmental damage caused by traffic
• Reduce traffic congestion
• Make the transport system safer and more secure
• Promote social benefits.

Contractual Framework
Development Partnering and Operating Franchise Agreement (DPOFA)
System Design Services (SDS)
Multi Utilities Diversion Framework Agreement (MUDFA)
Infrastructure provider and maintenance (Infraco) and
Vehicle supply and maintenance (Tramco)

System Design Services (SDS) 2005 – Appointment of design consultants
Originally, 3 lines were proposedSaltire
Square
Caroline
ParkGranton
Lower
Granton
Newhaven
Ocean
Terminal
Port of Leith
Bernard Street
Foot of the Walk
Balfour Street
McDonald Road
Picardy Place
York Place
St Andrew Square for Edinburgh Waverley
Princes
Street
Shandwick Place
West End-
Princes Street
Haymarket
Murrayfield
Stadium
Roseburn
Ravelston
Craigleith
Telford Road
Crewe Toll
West Pilton
B
R
Balgreen
Saughton
BankheadEdinburgh Park Station
Edinburgh
Park Central
Gyle Centre
Gogarburn
Ingliston
Park & Ride
Edinburgh Airport
Ingliston
West
Ratho
Station
Newbridge South
Newbridge North
R
R
R
Phase 1a (final route)
Phase 1a (never built)
Phase 1b (proposed)
Other future proposals
Phase 2
Phase 3
B
B
B
B
B
B
Railway Station
Bus Interchange
Airport
B
Proposed Route of the Edinburgh Trams - Source: The City of Edinburgh Council, 2013.
Phase 1a = 18.5km, is being developed (Case study) Phase 1b = 5.5 km, to be developed later.

Political Treat March 2006 – Tram Bill passed & granted Royal
Assent
2007- Scottish National Party (SNP) was elected
o Pledged to cancel project to same money
o Voted by Parliament to continue project
o SNP agreed, but will not give extra public money
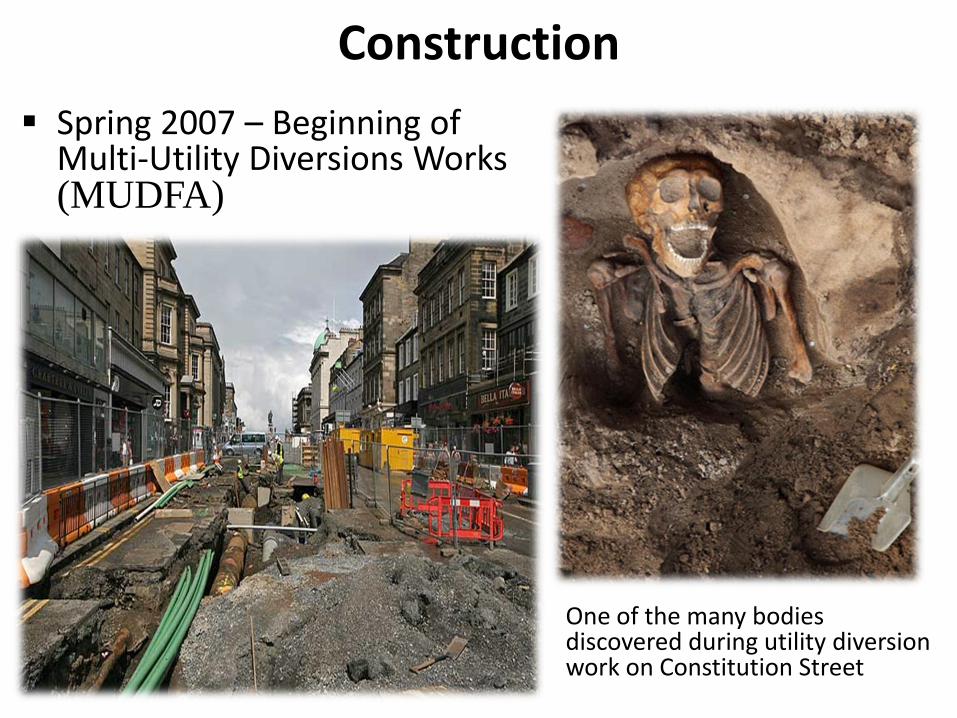
Construction
Spring 2007 – Beginning of Multi-Utility Diversions Works (MUDFA)
One of the many bodies discovered during utility diversion work on Constitution Street
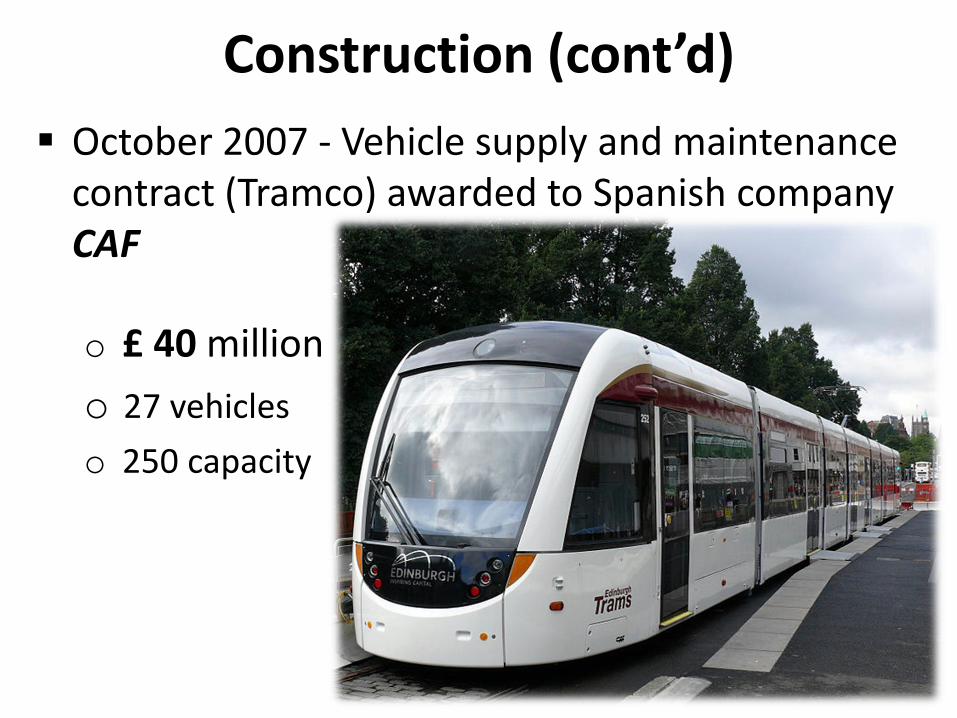
October 2007 - Vehicle supply and maintenance contract (Tramco) awarded to Spanish company CAF
o £ 40 million
o 27 vehicles
o 250 capacity
Construction (cont’d)

Construction (cont’d)
May 2008 – Turnkey Infrastructure Construction contract (INFRACO) awarded to Bilfinger Berger & Siemens (BBS) Consortium
o Initial estimated costs £498 million

TEST VERSIONONLY
(Planned infrastructure construction programme)
YearQuarter number
2007 2008 2009 2010 2011
Newhaven to Foot of Leith Walk
Foot of Leith to St. Andrew Square
St. Andrew Square to Haymarket
Haymarket to Edinburgh Park Station
Edinburgh Park station to Airport
2 3 41 2 3 41 2 3 412 3 4
Legend: Utilities
Road and Tramworks
Overhead line equipmentSource: Audit Scotland
Project Time Performance

TEST VERSIONONLY
(Delivery against key milestones)
YearQuarter number
2006 2007 2008 2009 2010 2011 2014
Business Case
Design and Traffic Regulation order
Utilities
Tram construction (Tramco)
Infrastructure construction (Infraco)
2 3 41 2 3 41 2 3 412 3 413 4 1
Legend: Plan
Actual
Project Time Performance (cont’d)
2 312 3 4

TEST VERSIONONLYProject Cost Performance
Spend to the end of December 2010
Budget as at May 2008Expenditure to end December 2010
£m
illi
on
300
250
200
150
100
50
0
Infrastructure construction
Tramconstruction
Utilities diversion
Design Projectmanagement
Land and compensation
Contingency
Note: 2008 - Initial cost was £498 December 2009 – Cost revised to £545 mil December 2010 – Cost passed £545 mil Final Cost unknown
£67m
£81m
£85m
£27m
£33m
£49m

Causes of Time & Cost Overruns
Social risks
o Dispute
o Legal actions
o Multi-level decision
making bodies
o Stakeholders’
pressure
Internal
Demand side
Supply side
CEC, TS, TEL, Lothian Buses, TIE, MPs, Ministers
BBS, CAF, Trandev, T&T, Parson, Alfred McAlpine
Private
External
Public
Edinburgh residents, Scotland residents, UK residents, cycling groups, Business owners, media, other private transport operators
HSE, Lothian fire service, Edinburgh Council, National Government, Metropolitan police authority, media
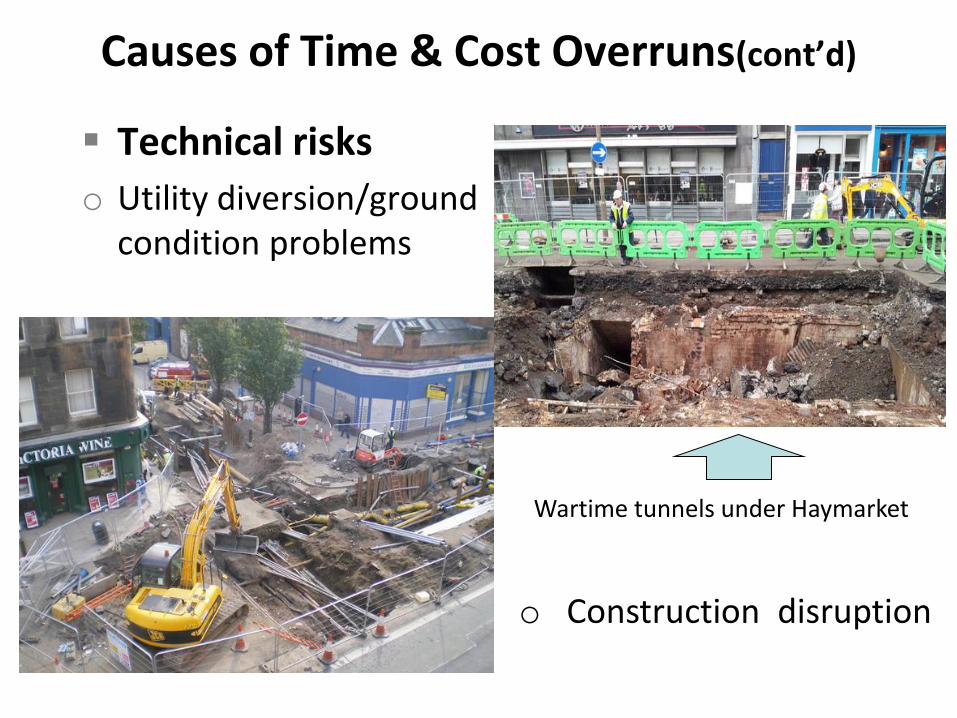
Technical risks
o Utility diversion/ground condition problems
Causes of Time & Cost Overruns(cont’d)
Wartime tunnels under Haymarket
o Construction disruption

Causes of Time & Cost Overruns (cont’d)
Economic risks
o Economic downturn
o Delays of all types
o Changes in project governing body
o Quality deficiency/rework

Environmental risks
o 2009/2010 & 2010/2011 – Freezing temperature halted construction
Causes of Time & Cost Overruns (cont’d)

Political risks
oLack of political support
oPolitical indecision
oContractual disputes2009- BBS demand additional £50-£80 mil before
beginning work on Princes Street.
Tie refused
2010- BBS announced 30 months delay to 2014
o2011- Tie released from managing project
o2011 - Cost revised from £545 to £776 mil
o2012- T&T appointed to manage project
Causes of Time & Cost Overruns (cont’d)

Changes and Disputes to date.816 notice of
Claims
677 continued
with139 withdrawn
426 Estimates
submitted
198 settled 228 not settled
20 settled thru’
FDRP
178 settled thru’
IDRP
7 resolved thru’
negotiation
2 resolved thru’
external mediation
11 resolved thru’
adjudication
251 – Still
hanging
£
3.7m
£
3.5m
£
4.0m
£
12.6
m
Cost of disputes to date
£ 23.8 m

Hierarchy of Identified Risk Areas in ETN Project
Level 1
Level 2
Level 3
STEEP Risks in Megaproject Construction
Social Technical Economic Environmental Political
Social grievances
Multi -level decision
making bodies
Disputes
Legal Actions
Stakeholder's pressure
Social Issues
Treats to person & asset
security
Ambiguity of project scope/
Scope change
Ground conditions on given
project sites
Unforeseen modification to
project
Inadequate project complexity
analysis
Inaccurate project cost
estimate
Failure to meet specified
standards
Technical difficulties in
utilities diversions
Engineering and design change
Supply chain breakdown
Project time overruns
Project cost overruns
Inadequate site investigation
Change in government
funding policy
Taxation changes
Wage inflation
Change in government
Local inflation change
Foreign exchange rate
Material price changes
Economic recession
Energy price changes
Catastrophic environmental
effects
Project technical difficulties
Project delays of all forms
Environmental issues from
works (Pollution)
Unfavourable climate
conditions (Snow, rain,
wind etc.)
Change in government funding
policy
Political opposition
Lack of political support
Government discontinuity
Political indecision
Project termination
Delay in obtaining consent/
Approval
Legislative/regulatory changes
Protectionism
Delay in obtaining temporary
Traffic Regulation Orders
(TROs)
Based on desktop search, ETNP source
documents and Interviews.
24/67
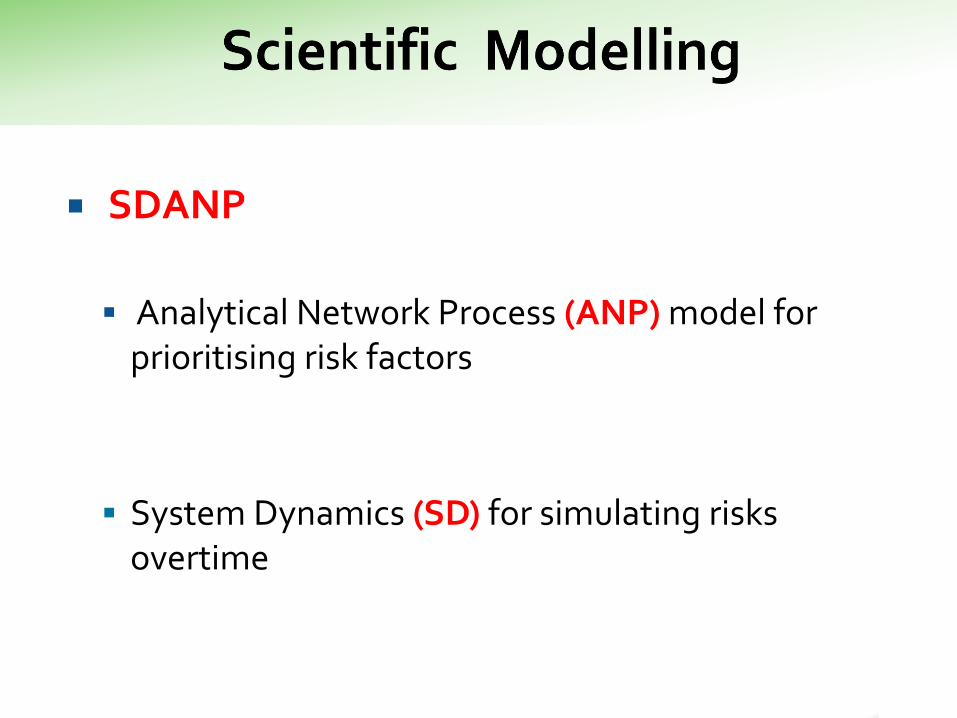
SDANP
Analytical Network Process (ANP) model for prioritising risk factors
System Dynamics (SD) for simulating risks overtime

25/67SDANP Framework
Model verification
· Expert opinion
Model development
· Develop formulae for flow diagrams
Initial model development
Model simulation
Model validation
Testing of model structure &
behaviour
Policy analysis, design and
improvement and implementation
Test not
passed
· Reference modes
· Model boundary chart
· Feedback structure
· Casual flow diagram
Model Testing
· Dimensional consistency
· Structure consistency
Test passed
Test not
passed
Test passed Software application
Develop and structure the ANP model
List of Top n
“priority risks”
wwR ij
n
jij max
1
11
n
iiw
Normalized criteria
Perform Risk Priority Index (RPI)
Calculation
RWRPI ijJ RCii*
)(
List of
potential risks
Database
Risks identification and categorization
Perform Mean Scores of importance
n
iQTCiE
nMV
1),,(
1
· Literature on STEEP
· Case studies
Data source
· Data from source
documents of past
similar projects
ANP route SD route
1......
1....1...
......
...1
1
1
21
112
RRRR
RRRR
n
nijji
ij
n
PRw
Conduct pairwise Comparison
Conduct prioritization survey based on
experts’ decisions

Parameters Values
Number of questionnaires distributed 300
Number of responses received 145
Number of invalid responses 5
Number of valid responses 140
Percentage of responses received 48.30
Percentage of valid responses 46.60
Number of Interviewees 20

Project
objectives (Po)Cost Time Quality Rounded MVs
C: Cost 4.9 5
T: Time 4.8 5
Q: Quality 5.0 5
Risk Cluster (PR)
Cost Time Quality Rounded MVs
Cost Time Quality
PR1:Social risks 4.2 3.6 2.4 4 4 2
PR2:Technical risks 4.7 4.7 4.6 5 5 5
PR3:Economic risks 4.7 4.6 4.4 5 5 4
PR4:Environmental risks 4.1 4.1 4.0 4 4 4
PR5:Political risks 4.5 4.0 3.4 5 4 3
Project Objectives (Po)
STEEP Risks Impact on (Po)
Weighted Quantitative Score (WQS)(Respondent’s Mean Scores of Importance - RMSI)

Option: Potential Risks (PR)
Inner
dependencies
SV1,Sv2, Sv3, Sv4
Sv5, Sv6, Sv7
ENV1, ENV2
TV1,TV2,TV3,TV4,TV5,
TV6,TV7,TV8,TV9,
TV10,TV11,TV12,
PR1:Social risks
PV1,PV2,PV3,PV4,
PV5,PV6,PV7,PV8,
PV9,PV10,
EV1,EV2,EV3,EV4,EV5,
EV6,EV7,EV8,EV9,
EV10,EV11,EV12,
PR2:Technical risks
PR5:Political risks PR3:Economic risks
PR4:Environmental
risks
List of high risks
Goal: Risk Prioritization
Criterion: Potential Consequences on:
Cost Time Quality
Potential Risks Prioritization Goal
Time Cost
PR2:Technical RisksPR1: Social risks PR5: Political risksPR4: Environmental
risksPR3: Economic risksOptions
Criterion Quality
Technical Risks PrioritizationGoal
Time Cost
TV1Options
Criterion Quality
TV12TV11TV10TV9TV8TV7TV6TV5TV4TV3TV2
Environmental Risks PrioritizationGoal
Time Cost
ENV2ENV1Options
Criterion Quality
Modelling in ANP for Risk Prioritization
ANP Network Models for STEEP Risks Prioritization

Project objectiveMVR
Potential Risks (PR)
PR1 PR2 PR3 PR4 PR5 TPV Priorities R
Costλmax = 5.00CI = 0.00RI = 1.11CR = 0.00
4 PR1 1 1/2 1/2 1 1/2 0.13 0.13 4
5 PR2 2 1 1 2 1 0.25 0.25 2
5 PR3 2 1 1 2 1 0.25 0.25 1
4 PR4 1 1/2 1/2 1 1/2 0.13 0.13 5
5 PR5 2 1 1 2 1 0.25 0.25 3
1.01 1.01
Timeλmax = 5.00CI = 0.00RI = 1.11CR = 0.00
4 PR1 1 1/2 1/2 1 1 0.14 0.14 3
5 PR2 2 1 1 2 2 0.29 0.29 2
5 PR3 2 1 1 2 2 0.29 0.29 1
4 PR4 1 1/2 1/2 1 1 0.14 0.14 5
4 PR5 1 1/2 1/2 1 1 0.14 0.14 4
1.00 1.00
Qualityλmax = 5.08CI = 0.02RI = 1.11CR = 0.02
3 PR1 1 1/3 1/2 1/2 1 0.11 0.11 4
5 PR2 3 1 2 2 3 0.37 0.37 1
4 PR3 2 1/2 1 1 2 0.21 0.21 2
4 PR4 2 1/2 1 1 2 0.21 0.21 3
3 PR5 1 1/3 1/2 1/2 1 0.11 0.11 5
1.01 1.01
Legend: λmax = maximum eigenvalue, CI = Consistency Index, RI = Random Index, CR = Consistency ratio, TPV = Total priority value,NPV = Normal priority value, IPV = Ideal priority value R = Ranking
Comparison Matrices

Potential Risks (PR) Priorities for Potential Risks Final Priorities
Local risk priority index
(RPIL)
Global risks priority index
(RPIG)
Synthesized
results
Cost
(0.33)
Time
(0.33)
Quality
(0.33)
Cost Time Quality TRPI IRPI R
PR1:Social 0.13 0.14 0.11 0.04 0.05 0.04 0.13 0.43 5
PR2:Technical 0.25 0.29 0.37 0.08 0.10 0.12 0.30 1.00 1
PR3: Economic 0.25 0.29 0.21 0.08 0.10 0.07 0.25 0.83 2
PR4: Environmental 0.13 0.14 0.21 0.04 0.05 0.07 0.16 0.53 4
PR5:Political 0.25 0.14 0.11 0.08 0.05 0.04 0.17 0.56 3
Total 1.01 1.00 1.01 1.00 1.01
Results of Final Mode ANP Decision Making Priorities
TRPI - Total risk priority index IRPV - Ideal risk priority indexes
R - Ranking


Project complexity
Project scope
Ground conditions
problem at a given site
Technical
uncertainties
Cost of delay in
utilities diversions
Modification to project
design/specification
Rework
Cost of
reworkError generation
Time to divert
underground utilities
+
Cost estimation
problems
Political risks
Political debates on
the project
Government
discontinuity
Political
support
Political
indecision
Time to obtain
consent & approvals
Protectionism
Legal actions
Political opposition
to the project
<Legal
actions>
Social grievances
Social issuesPressure to modify
project scope
Threat to
personal&asset security
Need to relocate
Pedistran &
bicycle safety
Accessibility difficulties tofamilies, friends &community
resources
Choice of travel
mode
Linkage between
residence & job
Land & property
values
Social risks
++
+
+
++++
+
+
Environmental
risks
Unfavourable
climatic conditions
Environmental issues
from works
Environmental
uncertaintities
+
++
+
Economic
recession
Material price
Energy
price
Government
funding policy
Wage inflation
Local inflation
Foreign
exchange
Economic risks.
Taxation
Escalation to project
cost overrun
New legislations &
regulations
Disputes
Cost of legal &
dispute resolution
Project delays of
all forms
<Material
price>
Social
uncertainties
+
+
+
Economic
uncertainties
+
+
+
<Government
funding policy>
Political interferrrance
in the project
Political
uncertaintities
+
-
+
Technicalrisks
Risks of project
cost overrun.
Escalation to project time overrun
Work to do
+
Engineering & design
changes/problems +
+
Inadequate site
investigation
+
<Inadequate site
investigation>
+
<Technical
uncertainties>
+
+
+
+
Supply chain
breakdown.
+
Risks of project
time overrun
+
+ +
Mult level decisionmaking bodies
involvement
+
<Rework>
<Social
grievances>
<Threat topersonal&asset
security>
+
+
Regulatory everionmentbodies (local, national &
Europe wide)
+
+
+
Escalation to
grievances
-
+
+Social
certainties
-
-
Project quality
deficiency
Worksite coordination
problems
+
+
+
+
+
<Error
generation> <Disputes>
+
+
+
+
+
+
<Social
risks>+
Environmental
certainties
--
<Risks of project
time overrun>
<Risks of project
time overrun>
-
-
<Social
uncertainties>
<Environmental
uncertaintities>+
+
+++
+
Ambiguity of
project scope
+
+
Technical
certainties
-
-
<Risks of project
time overrun>
Unforseen modification
to project
+
+
+
Technical difficulties in
utility diversions
++
+
+
<Error
generation>+
+
<Time to divert
underground utilities>
++
Political
harmony
Social
acceptability
+
+
+
+
--
-
++
++
Politicalcertainties
--
+
--
-+
<New legislations &
regulations>
+
+
Cost of delays+
+
Economic
certainties
+-
-
+
+
<Technical
uncertainties>
+
<Economic
risks.>
+
<Politicalrisks>
+
Traffic regulation
orders (TROs)
+
+
Material
price hike
+
+
-
++
+
+
+
+
+
+
+
+
+
+
De-escalation to
grievances-
<Legal
actions>
+
<Risks of project
time overrun>
+
+
+
<Risks of project
cost overrun.>
+
+
+
+
<Project quality
deficiency>
+
+
<Technical
risks>
+
+
+
<Supply chain
breakdown.>+
+
+
<Government
discontinuity>
+
Catastrophic
environmental effects
Project technical
difficulties
++
<Government
funding policy>+
+
-
<Social
acceptability>
-
<Social
acceptability>
+
+
Project
termination
+
+
<Project
termination>
+
<Risks of project
time overrun>
-
<Political
support>+
<Political
risks> +
<Mult level decisionmaking bodiesinvolvement>
+
<Social issues>+
Environmental
regulation enforcement
+
+
+
-
Causal Loop Diagram for STEEP Risks in ETN Project

Design
SD models for STEEP risks in ETN project
Model structure
MegaDS
SOCIAL SUBSYSTEM
TECHNICAL SUBSYSTEM
ECONOMIC SUBSYSTEM
ENVIRON.SUBSYSTEM
POLICAL SUBSYSTEM
Environ. Factors
Effects of Project
Air emission
Habitat destruction
Waste generation
Pollution (air/ water)
Comfort disturbances
Health & safety
Effects on Project
Critical weather conditions (snow, rain, wind etc..)
Temperature
Landslide, etc.

Risk Code Risk TypeType I: Endogenous Risk Variables
PR4 Environmental risksENV3 Cost of legal actionENV4 DisputesENV5 Environmental regulation enforcementENV6 Environmental certaintiesENV7 Environmental uncertaintiesENV8 Error generationENV9 Escalation to project cost overrunENV10 Escalation to project time overrunENV11 Legal actionENV12 Multi decision making bodies involvementENV13 Project quality deficiencyENV14 Risks of project cost overrunENV15 Risks of project time overrunENV16 Social issuesENV17 Social grievancesENV18 Worksite coordination problems
Type II: Exogenous Risk VariablesENV1: Environmental issues from works ENV2 Unfavourable climate conditions
Model Boundary

Environmental
risks
Unfavourable
climatic conditions
Environmental issues
from works
Environmental
uncertainties
+
+ +
+ Project quality
deficiency
Risks of project
cost overrun
Risks of project
time overrunEscalation to project
time overrun
Escalation to project
cost overrun
+
+
+
+
Worksite coordination
problems+ Error
generation
+
+
+
+
+Environmental
certainties
-
-
R1
R2
R3
R4
R5
R6
-Temperature
-Hurricane;
-Heat waves;
-Thunder and Lightning;
-Earthquake;
-Drought;
-Heavy rainfall;
-Snowfall;
-Flood;
-Dust & Wind storms;
. .. A casual relationship
Legend:
+ (-) signs at the arrowheads indicate that the effect is
positively (negatively) related to the cause.
R denotes reinforcing loop
{Pollution (Air, water,
soil & noise)}
+
R7
-
R8
+
Social
issues
Social
grievances
Disputes Legal
actions
Environmental
regulation
enforcement
+
+
+
+
+
+
+
<Legal
actions>
Cost of legal
action
+
+
Multilevel decisionmaking bodies
involvement
+
-
`
<Environmental issues
from works>
+
R9
Information flow, e.g. how environmental uncertainties affect
project time
System Dynamics: Dynamic Hypothesis (CLD)
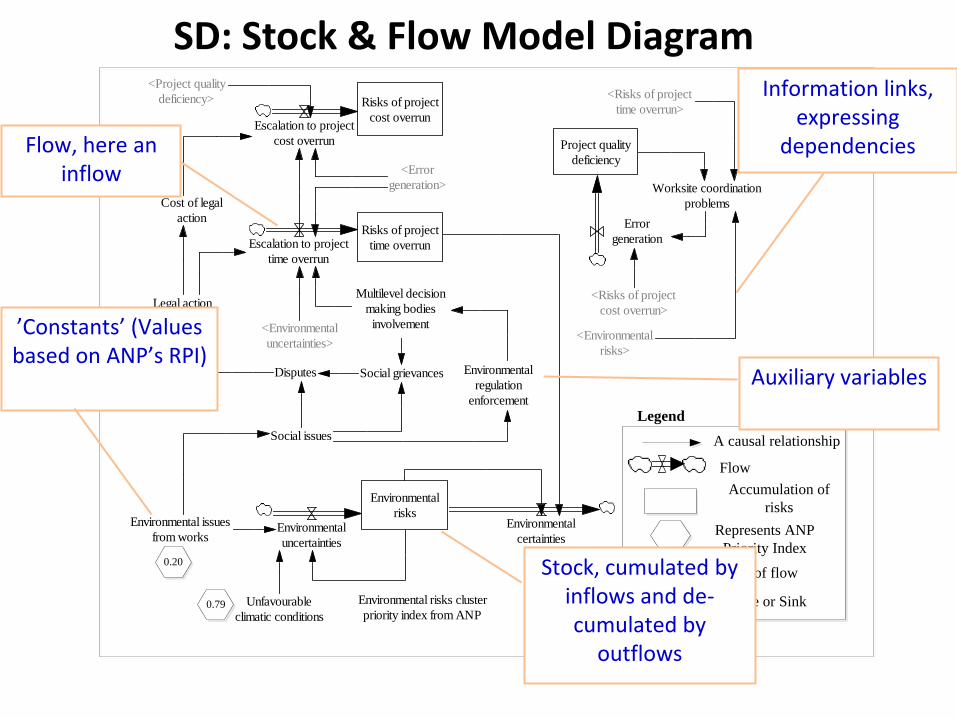
SD: Stock & Flow Model Diagram
Environmental
risks
Unfavourable
climatic conditions
Environmental issues
from worksEnvironmental
uncertainties
Environmental
certainties
Risks of project
time overrunEscalation to project
time overrun
Risks of project
cost overrunEscalation to project
cost overrun Project quality
deficiency
Error
generation
Worksite coordination
problems
<Error
generation>
<Risks of project
time overrun>
<Project quality
deficiency>
Environmental risks cluster
priority index from ANP
<Environmental
risks>
Legal action
Disputes
Multilevel decision
making bodies
involvement
Cost of legal
action
Social issues
Social grievances
<Environmental
uncertainties>
Environmental
regulation
enforcement
<Risks of project
cost overrun>
Legend
A causal relationship
Flow
Accumulation of
risks
Represents ANP
Priority Index
Valve of flow
Source or Sink..
. `;
0.20
0.79
Stock, cumulated by inflows and de-cumulated by
outflows
’Constants’ (Values based on ANP’s RPI)
Information links, expressing
dependencies
Auxiliary variables
Flow, here an inflow

a: Baserun and actual scenario simulation patterns for environmental risks
Environmental risks
0.2
0.15
0.1
0.05
0
22 2 2 2
22
2
2
2
2
2
2
2
1
11
1 1 11
1
1
1
1
1
1
1
1
2008 2009 2010 2011 2012 2013 2014 2015
Time (Year)
Dm
nl
Environmental risks : Current (Actual) 1 1 1 1 1 1 1 1 1 1 1Environmental risks : Baserun@ 0% ENV2 impact level 2 2 2 2 2 2 2 2 2
Max. PR4 impact
level @ year
2010 = 18.7%
Initial RPI for
PR4 = 16%
Min risk impact
level for PR4 =
0.07 (7%) Dynamic pattern @
ENV2 = 0% impact level
Max. PR4 @
0% ENV2
impact level
in year
2009.25 =
17%
Dynamic pattern (Actual)
b: Baserun and actual scenario simulation patterns for risks of project time overrun
Risks of project time overrun
0.6
0.45
0.3
0.15
0 22
22
22
22
22
22
22
1
11
1
1
1
1
1
1
1
1
1
1
11
2008 2009 2010 2011 2012 2013 2014 2015
Time (Year)
Dm
nl
Risks of project time overrun : Current (Actual) 1 1 1 1 1 1 1 1 1 1Risks of project time overrun : Baserun@ 0% ENV2 impact level 2 2 2 2 2 2 2 2
Max. ENV15 @ 20%
ENV1 and 79%
impact level =
55.4%
Max. ENV15 @ 20%
ENV1 and 0% ENV2
impact level = 41% Actual dynamic
pattern for Risks
of project time
overrun
Behaviour pattern for ENV15
based on 20% of ENV1 and 0% of
ENV2 impact levels
Level of
ENV15 in
2008 = 0%
9.9% (min)
48% (max)
18.7% (max)
Project completion time - 10/2013

c: Baserun and actual scenario simulation patterns for risks of project cost overrun
d: Baserun and actual scenario simulation patterns for project quality deficiency
Risks of project cost overrun
0.4
0.3
0.2
0.1
02 2 2 2
22
22
2
22
2
2
2
2
1 11
11
11
11
1
1
1
1
1
1
2008 2009 2010 2011 2012 2013 2014 2015
Time (Year)D
mn
l
Risks of project cost overrun : Current (Actual) 1 1 1 1 1 1 1 1 1 1Risks of project cost overrun : Baserun@ 0% ENV2 impact level 2 2 2 2 2 2 2 2
Project quality deficiency
0.2
0.15
0.1
0.05
02 2 2 2 2 2 2
22
22
22
2
1 1 1 1 1 11
11
11
1
1
1
1
2008 2009 2010 2011 2012 2013 2014 2015
Time (Year)
Dm
nl
Project quality deficiency : Current (Actual) 1 1 1 1 1 1 1 1 1 1Project quality deficiency : Baserun@ 0% ENV2 impact level 2 2 2 2 2 2 2 2 2
Behaviour pattern for 0% impact level
Actual dynamic behaviour pattern
Level of
ENV14 in
2008 = 0%
Max. ENV14 @ 20%
ENV1 and 79%
impact level = 35%
Max. ENV14 @ 20%
ENV1 and 79%
impact level = 28%
Max. ENV13 @
20% ENV1 and
79% impact level
= 11.37%
Max. ENV13 @
20% ENV1 and 0%
ENV2 impact level
= 8.28%
Actual dynamic
pattern for Risks
of project time
overrun
Behaviour pattern for ENV13
based on 20% of ENV1 and 0%
of ENV2 impact levels
Level of
ENV13 in
2008 = 0%
23% (max)
7.29% (max)

b: Baserun and actual scenario simulation patterns for economic risks
Economic risks
0.4
0.3
0.2
0.1
0
2
22
2 22
2
2
2
2
2
2
22
2
11
11
1 11
1
1
1
1
1
1
11
2008 2009 2010 2011 2012 2013 2014 2015
Time (Year)
Dm
nl
Economic risks : Current (Actual) 1 1 1 1 1 1 1 1 1 1 1 1Economic risks : Base run@ 0% (Exogenous) risk impact level 2 2 2 2 2 2 2 2
2010.13
Max. PR3 impact level @
year 2010.13 = 33.03%
Initial RPI for
PR3 =25%
impact level.
Dynamic
pattern
(Actual)
Min risk impact
level for PR3 =
1.72%
Dynamic
pattern (0%
impact level)
DSBP = Dynamic simulation behaviour pattern
b: Dynamic simulation scenario graphs for social risks
Social risks
0.6
0.3
0
-0.3
-0.6
5 5 5 5 5 5 5 54
4 4
44
4
44
3
33
3
33
3
3
3
22
2
2
2
2
2
2
21
1
1
11
1
1 1
1
2008 2009 2010 2011 2012 2013 2014 2015
Time (Year)
Dm
nl
Social risks : Current (Actual) 1 1 1 1 1 1Social risks : Current scenario 3 2 2 2 2 2 2Social risks : Current scenario 2 3 3 3 3 3 3Social risks : Current scenario 1 4 4 4 4 4 4 4Social risks : Current (Risk free scenario) 5 5 5 5 5 5
DSBP @ 25% of SV7
DSBP @ 100% of SV7 DSBP @ 0% of SV7
DSBP @ 75% of SV7 DSBP @ 50% of SV7

Behaviour Mode (Actual)
50% 75% 95% 100%
"Political risks."
1
0.75
0.5
0.25
02008 2009 2010 2011 2012 2013 2014 2015
Time (Year)
Dynamic Confidence Bounds Sensitivity Graph for Political Risks
Simulation interval continues to grow larger overtime
50% chance that the level of political risks will be between 15% and 55%
75% and the 95% confidence bounds suggest that the level of political risks could range from 10% to 65% and 5% to 80% respectively.

Original Project Information (OPI)
Cost (£ Million) Planned Project Budget (PPB) 545
Revised Project Budget (RPB) 776
Project Cost Variation (PCV) 231
Year of Completion Original Planned Date (OPD) 2011 (3 Years)
Expected New Date (END) 2014 (6 Years)
Completion Date Variation (CDV) 3 Years (30 month)
SDANP Simulation Project Information (SPI) Validated Project Information
Risks Level of Risk Impact on Project Performance –LRIPP (%) (OPI X SPI)
Cost (C) Time (T) Quality (Q) Total Impact Cost (£ million) Time (year)
(SPIC) (SPIT) (SPIQ) {(SPIC) x (PPB)} {(SPIT) x (OPD)}
Social 12.00 6.00 1.00 19.00 65.400 0.180
Technical 1.24 0.43 0.15 1.82 6.758 0.013
Economic 22.36 30.74 8.88 61.98 121.862 0.922
Environmental 11.43 29.3 3.35 44.08 62.294 0.879
Political 2.56 5.14 1.95 9.65 13.952 0.154
Total Impact 49.59 71.61 15.33 136.53 270.266 2.148(approx. 26 m)Source: Field Work 2013

Accuracy level = 83%
SDANP model Statisticalresearch *
Average costescalation (%)
49.59 44.70
Accuracy (%) 85.47 N/A

43/67
clear site
rough grade
drill well
water tank foundation
excavate for sewer
excavate for electrical manholes
install well pump
erect water tank
install sewer and backfill
install manhole
Work schedule Production-dep. Risks
Time-dep. Risks
High Risk Period

44/67
Well defined research methodology
A study into STEEP risks impacts on ETN project at the construction phase
A SDANP model for planning against the impact of STEEP on ETN project
More case studies for accurate prediction

45/67
SBE Heriot-Watt University
EU COST Action TU1003 MEGAPROJECTS
Edinburgh Trams

Thank You