time and attention in digital advertising
Post on 19-Oct-2014
5.547 views
DESCRIPTION
TRANSCRIPT
Eyeblaster Analytics BulletinIssue 4 | Trends of Time and Attention in Online AdvertisingJuly 2009

Pg 193 – Marketing Sherpa’s 2008
Background
Recent years saw click thru rates (CTR) dropping from 5% to way below 0.4% (or 0.1% for standard banners). This has led some to conclude that ‘display advertising is dying’. On the other hand, data such as Comscore and OPA’s recent research showed that consumers exposed to display ads spend over 50% more time on an advertiser’s site the following month, viewing over 50% more pages than average visitors. This may lead to the conclusion that display advertising is more critical than ever. What’s a marketer to do?
Human attention has become a scarce commodity. Drawing attention is the first stage in the process of converting consumers. Clicking through to a web site is one form of attention – one that consumers increasingly refuse to follow. But what happens when there is no click? At that stage, a good measure for ad effectiveness is time spent with the ad. Indeed, time spent has long been a key metric for attention in web site analytics, and new technology now allows us to analyze consumer time spent with display advertising.
Summary of findingsThe main findings in this research include the following:
Consumers are • 25 times more likely to spend meaningful time on the ad than click itWhen they do spend time, consumers •spend close to a full minute of active engagementVideo• increases Dwell Rate by 30% and Dwell Time by 200% (in the US) or 100% (globally)Consumers react to ads differently •depending on the time of day, week, or year Home-page media offers one of the •highest Dwell Rates, but lowest Dwell TimeAnd more…•
In this research we leverage a new data point called Dwell, and review trends in consumer attention consumption with rich media display advertising. Eyeblaster developed Dwell with leading advertisers and agencies worldwide in order to create a standardized metric across all ad formats and sizes. Previous time related metrics, such as expansion duration or video duration, were limited to niche formats and creative implementations. Dwell is equally applicable to all rich media formats, for the first time allowing a comprehensive and consistent analysis.

3 AnAlyTICS BUllETIn ISSUE 4 | JUly 2009
Table of contents
Methodology and Definitions ..................................................................... 4
Spending Time vs. Clicking ....................................................................... 5
Does Video Impact Dwell? ........................................................................5
What’s the Best Time for Spending Time? ................................................ 6
Dwell by Verticals ...................................................................................... 8
Trends by Region ...................................................................................... 9
Unit Sizes and Formats ............................................................................ 10
Benchmarks
Appendix 1: north America .................................................................... 13
Appendix 2: Europe ................................................................................ 14
Appendix 3: Spain .................................................................................. 15
Appendix 4: APAC .................................................................................. 16
Appendix 5: Taiwan ................................................................................ 17
4 AnAlyTICS BUllETIn ISSUE 4 | JUly 2009
Methodology and DefinitionsMethodologyThis document uses isolated data from a sample size of over 42 billion rich media impressions spanning all formats and global regions. The data was gathered in the period between September 2008 and March 2009. later in this document, where a sub-set of the data was utilized, it is highlighted as such.
Dwell Time DefinitionDwell Time is the average number of seconds consumers intentionally spend engaging with an online ad. The metric sums the following user actions: amount of time the mouse was over an ad, user-initiated video duration, user-initiated expansion duration, and any other user-initiated custom interaction duration. Unintentional dwell instances lasting less than one second are excluded.
Dwell Rate DefinitionDwell Rate is the cumulative instances of where a user interacted with the ad divided by served impressions.Many charts in this bulletin show Dwell Rate alongside Click Through Rates. As you will see, Dwell Rate is consistently higher than CTR by order of magnitude. note therefore, that such charts use a different scale for Dwell Rate and CTR, visible on corresponding sides of the graph.
CTR vs Dwell Rate

5 AnAlyTICS BUllETIn ISSUE 4 | JUly 2009
Does Video Impact Dwell?When looking at in-banner video advertising, we can see a 30% lift in Dwell Rate compared to non video rich media.
Video nearly doubles the average Dwell Time, from 37.37 seconds to 71.51 seconds!
Spending Time vs. ClickingTo begin our review of Dwell, we looked at global data and compared it to the well known CTR metric on the same sample:
0.00
10.00
20.00
30.00
40.00
50.00
60.00
70.00
80.00
0.00%
2.00%
4.00%
6.00%
8.00%
10.00%
12.00%
No Video With Video
Dw
ell T
ime
Dw
ell R
ate
Dwell Time (sec) Dwell Rate
No VVideo With Video
Video Impact on Dwell
Source: Eyeblaster Research
Video Impact on Dwell
Source: Eyeblaster Research
Source: Eyeblaster Research
CTR vs. Dwell Rate
8.71%
0.35%
0.00%
2.00%
4.00%
6.00%
8.00%
10.00%
CTRDwell Rate (sec)
Source: Eyeblaster Research
CTR vs. Dwell Rate At 0.35%, the Click Through Rate for Rich Media ads is still over three times higher than standard banners, but still a small portion of the exposed population. If we were to assume this was the extent of the impact of the display campaign, this is certainly not an impressive number. In contrast, the Dwell population measuring users with intentional active engagement is 8.71%, or 25 times higher.
These 8.71% are exposed on average to 53.08 seconds of hands-on, active engagement. This is equal to intently watching two 30 second TV spots in a row!
Video increases both the rate of engagement and duration in time. Considering the power of television to develop stories that create brand recall, what we are seeing is that video is both powerful at drawing the eye away from page content and then holding the users attention, nearly double other ad formats.It is interesting to draw a comparison between in-banner video, analyzed above, and in-stream pre-roll video ads. While pre-roll often gets a bad rap for being intrusive, its duration is a mere 15 seconds and below. Here we can see the tradeoff marketers face, when measuring active participation of 10% of the exposed audience – with no negative connotation from the intrusion aspect – and duration of engagement that is 5 times longer. So is reach more important or impact? Each brand and each campaign may require a different answer.

6 AnAlyTICS BUllETIn ISSUE 4 | JUly 2009
Resolution over WeekendUnlike workdays, during the weekend we don’t see the impact of morning coffee and lunch breaks. In looking at data across the weekend period, there is no substantial change for Dwell Rate or Dwell Time. The time consumers spend on ads is relatively flat across the board.
As a general trend, Dwell Rate is lower during weekend days, while Dwell Time remains consistent with workday peak hours. In other words, once an advert does get the consumer’s attention on the weekend, they are free to spend time with it as they are during workday break periods.
What’s the Best Time for Spending Time? Are there any variations on Dwell Time by hour, day or month?
Resolution by Part of DayThe time-of-day analysis uses a sample size based on US Eastern time zone, and focuses on browser-based ad formats, excluding Messenger formats. These criteria were defined to increase visibility to time-of-day trends.The following chart shows workday (Monday-Friday) data by hour:
During workdays, Dwell Rate is at its highest in the morning, peaking at 9am, when people are prepared to interact, but for not as long as they are at lunch-time when they generally play with ads for longer durations. The data shows CTR picking up in the early evening, and both CTR and Dwell Rate declining as the evening progress with a drop at about 8.00pm.Interestingly, we can see a spike for the insomniacs who are quite happy to play around for longer at 3.00am!
Time-of-day analysis: workdays only
Source: Eyeblaster Research
39.92
41.64
42.72
45.1344.92
42.3341.80
41.1140.67
42.46
43.59
42.44
41.34
43.8543.7543.56
42.10
41.2641.60
41.2741.0740.83
39.8139.89
0.00%
1.00%
2.00%
3.00%
4.00%
5.00%
6.00%
7.00%
8.00%
0.00%
0.05%
0.10%
0.15%
0.20%
0.25%
0.30%
0.35%
39.92
41.6441 64
42.7242 72
45.1344.9244 92
42.3341.8041 80
41.1140.6740 67
42.46
43.5943 59
42.44
41.34
43.8543 8543.7543 7543.56
42.10
41.2641.6041 60
41.2741.0740.8340.83
39.8139.8139.89
0 1 2 3 4 5 6 7 8 9 10 11 12 13 14 15 16 17 18 19 20 21 22 23
Dw
ell R
ate
CT
R
Dwell Time (sec) Dwell Rate CTR
Time-of-day analysis: workdays only
Source: Eyeblaster Research
Time-of-day analysis: weekends
Source: Eyeblaster Research
38.1838.1836.56
46.64
36.8236.0835.9535.92
37.0239.1040.2440.7742.0941.8442.3042.8842.9542.9642.7342.41
43.7944.6843.8042.69
0.00%0.05%0.10%0.15%0.20%0.25%0.30%0.35%0.45%0.50%
38.1838.1836.5636 56
46.64
36.8236.0836.0835.9535.9535.9235.92
37.0239.1039 1040.2440 2440.7742.0941.8442.3042.8842.9542.9642.7342.41
43.7943 7944.6844 6843.8043 8042.69
0.00%
1.00%
2.00%
3.00%
4.00%
5.00%
6.00%
7.00%
0 1 2 3 4 5 6 7 8 9 10 11 12 13 14 15 16 17 18 19 20 21 22 23
Dw
ell R
ate
CT
R
Dwell Time (sec) Dwell Rate CTR
Hour of the day
Time-of-day analysis: weekends
Source: Eyeblaster Research

7 AnAlyTICS BUllETIn ISSUE 4 | JUly 2009
Distribution of Dwell by Month The following chart again uses global data in order to drill down further into the metrics of when consumers are likely to dwell:
What we discover is that Dwell Time is highest in a messaging environment followed by news, technology and gaming. In terms of Dwell Rate – news, technology, and gaming sections all attract a high number of consumers to explore the advertiser’s message.Home-pages offer a very interesting finding. They are seen to generate one of the highest Dwell Rates, which might be due to the higher quality of creative on home-pages designed to catch attention (for instance, home-page takeover ads). However, the time spent on a home-page ad is generally much less than other sections, possibly because it is a jump-off page for the consumer as opposed to a destination.
Time on Ads across Media SectionsThe publisher section is relevant to the consumer’s context and offers a hint as to their state of mind. Are they leaning forward typing emails and IMs, are they scanning through news, or clicking on a home-page en route to another content destination?The following chart is based on north American ad impressions served in the top 300 publishers:
Distribution of Dwell by Month
Source: Eyeblaster Research
Dw
ell R
ate
CT
R
Dwell Time (sec) Dwell Rate CTR
7.00%
6.80%
7.20%
7.40%
7.60%
7.80%
8.00%
8.20%
0.32%0.33%0.34%0.35%
0.28%0.29%0.30%0.31%
0.36%0.37%0.38%
48.1853.06
46.66 47.5143.48 43.84 45.66
Sept Oct Nov Dec Jan Feb Mar
Distribution of Dwell by Month
Source: Eyeblaster Research
0.00%
1.00%
2.00%
3.00%
4.00%
5.00%
6.00%
7.00%
8.00%
9.00%
0.05%
0.00%
0.10%
0.15%
0.20%
0.25%
0.30%
0.35%
0.40%
0.45%
0.50%
84.24
73.54
56.98
49.82
40.28 40.0635.06 34.21 34.20
31.44 30.65 30.42 28.21 26.49 26.27 25.66
Instan
t Mes
sagin
gNew
s
Tech
nolog
y
Game
Enterta
inmen
t
Health
Lifes
tyle
Sports
Finan
ceMus
icFo
od
Movies Auto
Social
Netw
orks
Home P
age
Dw
ell R
ate
CT
R
Dwell Time (sec) Dwell Rate CTR
Time on Ads across Media Sections
Source: Eyeblaster Research
Time on Ads across Media Sections
Source: Eyeblaster Research
In looking at data across months, we see that CTR is the highest around november, possibly indicating a response aspect prior to Christmas and the holiday season. However, in January, during the post-holiday season there is a jump in the number of users wishing to engage with a brand. Additionally, in October consumers seem to be prepared to spend the longest time exploring a brand as opposed to December, which shows the lowest Dwell Time.

8 AnAlyTICS BUllETIn ISSUE 4 | JUly 2009
Dwell by Verticals
Across all sectors, Dwell Time shows that consumers are both willing to engage with brands and explore them on the page as opposed to click-away – and will do so for between 15 and 60 seconds longer than TV ads.
THINK active exploration and not just a passive exposure of the brand.
Dwell Time for the technology and internet sector is almost double compared to the lower verticals, showing that users spend 91.9 seconds ‘dwelling’.
Dwell by Vertical
Source: Eyeblaster Research
0.00%
2.00%
4.00%
6.00%
8.00%
10.00%
12.00%
0.10%
0.00%
0.20%
0.30%
0.40%
0.50%
0.60%
0.70%91.9
63.156.5
49.6 47.1 46.7 46.0 45.1 45.140.2
Tech
/Inter
net
Enterta
inmen
t
Gaming
Telec
om
Health
/Bea
uty
Finan
cial
Service
sAuto CPG
Electro
nics
Dw
ell R
ate
CT
R
Dwell Time (sec) Dwell Rate CTR
Dwell by Verticals
Source: Eyeblaster Research
nearly 10% of all ads are engaged with for an average of one-and-a-half minutes. This shows a real willingness of technology users to explore a sector that has direct bearing on their everyday experiences.Both entertainment and gaming are the next best engaged sectors, both holding 63 seconds and 56 seconds of Dwell Time respectively, with gaming gaining a higher than average CTR as a result. However, although gaming shows a peak in CTR at 0.6%, this means that for every 1000 ad impressions served only six ads are being clicked on compared to 90 ads interacted with on an average of 56.5 seconds. Most likely, if you’re an engaged gamer, you know what to expect in a game micro-site, and you are more likely to navigate. For clarity, even high clicking gaming fans are over 10x more likely to Dwell.

9 AnAlyTICS BUllETIn ISSUE 4 | JUly 2009
Trends by RegionIn the following data, Messenger ads were removed from the data source to ensure uniform comparisons across regions:
Americans are the least likely to engage with online ads, BUT when they do engage, US consumers spend far more time with the ad than in other markets, especially if the ads contain video. In the US, Dwell Time shows that the average time spent with a video ad is 85 seconds.
At 85+ seconds, north America leads the world in Dwell TimeIt would appear from the data that there is more resistance on behalf of the consumer in the US than in EMEA or APAC – which suggests in more digitally advanced regions (i.e. the US), consumers have been over-saturated with online ad formats. This, in turn has been complemented with greater brand or publisher restrictions as a result of the negativity afforded by original pop-up ads seen in the early days of online marketing.The data suggests that it is not so much shape or size or clicks that we need to address, but a potential consumer complacency, especially where the most interesting creativity is often hidden post-click ( either click-to-expand or click-to-micro-site).Thus, US designers need to work that much harder on ad creativity to get people engaged from the outset. But, the potential pay-off is once they have them engaged, US consumers really want to explore brands right where they are ‘dwelling’.The argument for creativity can be seen in the inclusion of video – as it both increases the rate of engagement and duration in time. Considering the power of television to develop stories that create brand recall, what we are seeing is that video is both powerful at drawing eye off page content and then holding the users attention, nearly double other ad formats or in the case of the US, practically triple the Dwell Time.
Regionally and globally the contribution of video cannot be ignored
Dwell Rate Dwell Time
Global General 8.71% 53.08
No Video 7.65% 37.37
With Video 10.04% 71.51
EMEA General 9.75% 54.58
No Video 8.41% 40.93
With Video 10.65% 69.54
US +CanadaGeneral 6.54% 57.58
No Video 5.56% 32.73
With Video 7.53% 85.16
APACGeneral 7.31% 41.86
No Video 6.55% 33.51
With Video 9.80% 59.94
Latin America General 12.64% 50.85
No Video 11.29% 31.02
With Video 15.24% 72.33
Trends By Region: focus on video
Source: Eyeblaster Research
Dw
ell R
ate
Dw
ell D
urat
ion
0.00%
2.00%
4.00%
6.00%
8.00%
10.00%
12.00%
14.00%
16.00%
10.00
0.00
20.00
30.00
40.00
50.00
60.00
70.00
80.00
90.00
Dwell Time (sec) Dwell Rate
No Video
WithVideo
No Video
WithVideo
No Video
WithVideo
No Video
WithVideo
Latin AmericaAPACUS+CanadaEMEA
Trends by Region: focus on video
Source: Eyeblaster Research

10 AnAlyTICS BUllETIn ISSUE 4 | JUly 2009
Dwell by Unit Sizes and FormatsTo test the correlation of consumer attention and ad size, we looked at performance of various sizes of rectangle, leaderboard banners, Messenger units, floating ads and skyscrapers.
Dwell Time and Click Rates across 10 popular unit sizes:D
wel
l Rat
e
CT
R
0
10%
5%
15%
20%
30%
35%
0
2.00%
1.50%
1.00%
0.50%
2.50%
3.00%
3.50%
4.00%
73.46
47.6155.26 58.21
66.34
82.98
6.38
42.29
50.41
37.57
300x
250
336x
280
728x
90
468x
60
234x
60
180x
150
N/A
160x
600
120x
600
300x
600
Rectangles Banners Messenger Floating Skyscraper
Dwell Time (sec) Dwell Rate CTR
Dwell by Unit Size
Source: Eyeblaster Research
Browser-based formats300x250• – the rectangle (MPU) – high Dwell Rate, high Dwell Time and average clicks728x90• – the banners – average Dwell Time, average Rate and average clicks120x600, 160x600, 300x600• – the skyscrapers – lowest Dwell Time, low interactions for 160 and 120 wide formats with an increase for 300 wide formats, but low clicks across the board468x 60 and 120x600• – two original banner/skyscraper sizes – both achieving the lowest CTR, but the banner achieves a high rate and average dwell time
Desktop formats180x150• – mostly MSn Messenger Today – high rate, high duration, yet average clicks234x60• – the half-banner in MSn Messenger –high rate, high duration and high clicks
We continue to see the huge gap between clickers and time-spenders. Roughly 10% of all ads get user attention compared to less than 0.3% clicked on.
All formats are achieving longer engagement time than the average 30 second TV spotDwell Time is not necessarily equating to shift in CTR, i.e. even if someone plays with an ad for a ‘long’ time they are not necessarily going to click-thru, indicating they have found the “immediate” answers they need.The Dwell Rate and CTR do have a level of consistency, i.e. the number of people who engage with an ad is relative to the click-ability, and is related to the size/location of the advert on the page.
looking at both Rate and Time, the top performing formats are:
Dwell by Unit Size
Source: Eyeblaster Research

11 AnAlyTICS BUllETIn ISSUE 4 | JUly 2009
The following graph aggregates the data for each category of ad sizes:
Dwell by Unit Size
Source: Eyeblaster Research
Dw
ell R
ate
CT
R
0%
5%
10%
15%
20%
25%
30%
35%
0.50%
0.00%
1.00%
1.50%
2.00%
2.50%
3.00%
3.50%
4.00%
55.82
44.24
65.30
5.51
39.05
Recta
ngles
Banner
s
Mes
senger
Float
ing
Skysc
raper
Dwell Time Dwell Rate CTR
Startling realities of Dwell Time by size and format:Around • 10% of all ads are interacted with compared to less than 0.3% clicked on. Based on 1000 ad impressions served, this means less than 3 ads are clicked on vs. around 100 ads are being played with. Once engaged, the average consumer is willing to spend •around 60 seconds actively exploring a brand message – not just 30 seconds passively receiving a message like television.
Desktop ads (Messenger ads) are outperforming browser-based categories, showing 12% increase in Dwell Rate and a 10-20 second increase in Dwell Time. Increased Dwell Time in Messenger ads is due to the length of time the user is exposed to the ad. For example, some users can be exposed to an ad for as long as all day, complemented by the potential auto-load of the software on machine restart. This is balanced against adverts contained within a browser, such as on a home-page, where the likelihood is that the user would normally be there for a few seconds before leaving the page. A comparison could be drawn in terms of standing around a bus stop versus driving past a billboard in terms of potential exposure time. However, once a consumer is engaged, they will spend a great amount of time exploring a brand.
Floating ad reveals a massive 30% Dwell Rate Floating ads represent less than 1% of Rich Media volume, but are quite useful for specific marketing applications. Dwell Rates are highest for floating ads, while Dwell Time for floating ads is lower than other rich media formats. This is probably due to the following considerations:
Floating ads by design are more intrusive, hence more •likely to ‘bust through’ consumer ad blindness, increasing Dwell Rate.The duration in time is limited because generally these ads •are designed to be on screen for a minimum amount – they are short-form adverts, typically around seven seconds and no more than 15 seconds.Users looking to close the floating ad and taking over •one second to do so, are still recorded as dwelling users and skew the data further towards higher rate, lower duration.
Dwell by Unit Size
Source: Eyeblaster Research
12 AnAlyTICS BUllETIn ISSUE 4 | JUly 2009
ConclusionWhat advertisers want to know is “are users seeing my ads?” and unlike TV, Dwell Time can answer a definitive “yes they are,” providing a key engagement measurement irrespective of click-thru. Marketers are far more excited to know that around 100 people spend more than a minute discovering their product or brand in an ad as opposed to learning that three people clicked on it. Online rich media ads encourage consumers to engage with brands in more active, explorative ways. Marketers are shifting towards creating compelling interactive stories where consumers are ‘dwelling’, as opposed to driving traffic to micro-sites. Video is an obvious enhancement to any campaign, and a move towards interactive video should be seen as a priority for advertisers wishing to engage with consumers. CTR alone has been giving us skewed data results when isolated from Dwell Time. Therefore, it is no longer sufficient to rely on clicks as a primary indication of online ad effectiveness. Consumers today are far more willing to engage with brands than we previously thought, and in more active and explorative ways. However, the limited amount of attention time means we must deliver the brand to the consumer wherever they are, and not expect the consumer to go look for the brand.
Note to Strategists Armed with this new information, take confidence in finding ways to draw the eye away from page content and into the ad format, and reward the consumer for doing so – and for their willingness to take time out. Treat them with respect, feed them information where they are, and enjoy achieving higher brand involvement than even television can deliver, both in terms of time and through active participation and exploration.

13 AnAlyTICS BUllETIn ISSUE 4 | JUly 2009
Performance Metrics (Format and Verticals)Benchmark for North America Q4 ’07 - Q3 ’08
Appendix 1
Basic Metrics Video Metrics Expandable Metrics
IRInteraction Average Duration
(Seconds)CTR
Avg. Video Duration
(Seconds)Started
Rate 50%
Played Rate
Fully Played Rate
Total Expansion
Rate
Impressions with any Panel
Expansion Rate
Avg. Expansion Duration
(Seconds)
Form
ats
Standard Banner — — 0.09% — — — — — — —Rich Media Commercial Break 13% 2.73 2.61% 5.46 72% 10% 3% — — —Expandable Banner 11% 3.87 0.30% 23.62 15% 79% 69% 11% 7% 51.46Floating Ad 3% 2.78 3.15% 6.64 48% 50% 34% — — —Floating Ad With Reminder 5% 3.00 2.80% — — — — — — —
Floating Expandable 10% 3.26 1.52% 5.26 62% 83% 70% 72% 5% 23.70In Game 13% — 4.67% 16.60 94% 71% 47% — — —Polite Banner 5% 3.36 0.17% 19.76 53% 68% 52% — — —Push Down Banner 4% 2.29 0.28% — — — — 35% 3% 18.80Video Strip 17% 4.02 0.17% 17.26 48% 59% 31% 46% 6% 70.23
IRInteraction Average Duration
(Seconds)
CTR (Rich
Media)
CTR (Standard
Media)
Avg. Video Duration
(Seconds)Started
Rate 50%
Played Rate
Fully Played Rate
Total Expansion
Rate
Impressions with any Panel
Expansion Rate
Avg. Expansion Duration
(Seconds)
Verti
cals
Apparel 12% 3.33 0.30% 0.24% 15.04 47% 74% 36% 20% 7% 30.41Auto 9% 3.35 0.23% 0.11% 19.63 16% 76% 64% 17% 9% 31.20B2B 6% 3.11 0.48% 0.17% — — — — 12% 9% 65.23Careers 10% 3.45 0.30% 0.09% — — — — 24% 16% 53.43Consumer Packaged Goods 7% 3.63 0.35% 0.11% 24.90 25% 54% 33% 9% 6% 48.21
Corporate 1% 3.09 0.09% 0.05% 22.05 7% 47% 31% 12% 8% 78.68Electronics 8% 3.71 0.24% 0.12% 19.63 20% 66% 71% 15% 11% 42.02Entertainment 11% 3.60 0.26% 0.13% 15.39 13% 61% 46% 9% 5% 49.49Financial 5% 3.35 0.15% 0.07% 13.08 56% 76% 60% 6% 4% 46.69Gaming 7% 4.35 0.63% 0.08% 59.46 17% 49% 35% 22% 8% 61.49Government/Utilities 5% 3.18 0.17% 0.07% 24.48 62% 78% 66% 16% 4% 26.07Health/Beauty 13% 3.29 0.24% 0.17% 30.80 8% 63% 41% 19% 13% 61.72Medical 6% 3.07 0.14% 0.10% 21.88 38% 72% 58% 7% 5% 36.49news/Media 10% 2.64 0.27% 0.07% — — — — 14% 9% 22.58Restaurant 1% 2.94 0.13% 0.09% 16.04 50% 39% 27% 3% 2% 33.43Retail 11% 3.09 0.29% 0.07% 23.48 11% 40% 25% 16% 9% 28.08Services 8% 3.08 0.38% 0.05% 23.23 56% 77% 63% 33% 21% 70.24Sports 7% 2.98 0.28% 0.08% 11.37 55% 68% 52% 7% 4% 44.50Tech/Internet 4% 3.59 0.17% 0.14% 14.82 51% 77% 65% 6% 4% 88.84Telecom 7% 3.28 0.18% 0.09% 23.55 34% 81% 62% 15% 10% 48.35Travel 4% 3.80 0.21% 0.08% 40.20 59% 78% 61% 13% 5% 31.28
Interaction Rate (IR) User Initiated Interactions' divided by 'Served Impressions'Click-through Rate (CTR) Frequency of Click-throughs as a percentage of served impressions. 'Clicks' divided by 'Impressions'. Avg. Video Duration The average duration the video was played, including user and auto initiated videos (in seconds).Started Rate The number of times the video started out of video's served Impressions50% Played Rate The number of videos that played over 50% of their total video length divided by 'Video Started'.Fully Played Rate The number of videos that were fully played divided by video that startedTotal Expansion Rate Total expansions divided by served impressions. Including Auto-initiated expansionsImpressions with any Panel Expansion Rate The number of impressions with at least one panel expansion.Avg. Expansion Duration The average time a panel was expanded, including user and auto initiated expansionsRich Media Ads All Eyeblaster's format excluding standard banner, wallpaper and window ads— not Available - either this measurement is not applicable to the format or there was not enough data to be statistically relevant
north America: including US and Canada. The benchmark is for a rolling year, last updated Q4 2008.

14 AnAlyTICS BUllETIn ISSUE 4 | JUly 2009
Appendix 2
Performance Metrics (Format and Verticals)Benchmark for Europe Q4 ’07 - Q3 ’08
Basic Metrics Video Metrics Expandable Metrics
IRInteraction Average Duration
(Seconds)CTR
Avg. Video Duration
(Seconds)Started
Rate 50%
Played Rate
Fully Played Rate
Total Expansion
Rate
Impressions with any Panel
Expansion Rate
Avg. Expansion Duration
(Seconds)
Form
ats
Standard Banner — — 0.14% — — — — — —Rich Media —Commercial Break 4% 2.30 3.96% 3.97 72% 48% 29% — — —Expandable Banner 35% 3.27 0.66% 44.12 25% 62% 48% 41% 17% 52.60Floating Ad 13% 2.68 4.16% 8.90 65% 51% 30% — — —Floating Ad With Reminder 6% 2.38 4.66% — — — — — — —
Floating Expandable 20% 2.58 0.48% — — — — 56% 14% 41.95In Game 19% — 5.80% 17.17 99% 93% 80% — — —Polite Banner 7% 2.95 0.21% 44.42 59% 67% 51% — — —Push Down Banner 16% 3.46 0.15% 44.72 55% 84% 78% 22% 12% 57.37Video Strip 23% 4.87 0.18% 63.20 10% 74% 60% 43% 8% 72.39
IRInteraction Average Duration
(Seconds)
CTR (Rich
Media)
CTR (Standard
Media)
Avg. Video Duration
(Seconds)Started
Rate 50%
Played Rate
Fully Played Rate
Total Expansion
Rate
Impressions with any Panel
Expansion Rate
Avg. Expansion Duration
(Seconds)
Verti
cals
Apparel 15% 3.05 0.38% 0.17% 51.92 35% 57% 44% 47% 16% 47.41Auto 14% 2.85 0.41% 0.15% 49.68 51% 68% 51% 42% 16% 55.11B2B 9% 3.01 0.44% 0.34% — — — — 12% 6% 46.55Careers 11% 3.00 0.54% 0.15% — — — — 25% 11% 51.31Consumer Packaged Goods 25% 3.58 0.57% 0.12% 39.68 31% 56% 42% 47% 18% 63.97
Corporate 18% 3.11 0.32% 0.08% — — — — 59% 26% 74.74Electronics 21% 2.90 0.35% 0.13% 46.15 36% 72% 59% 42% 17% 48.40Entertainment 28% 3.35 0.57% 0.18% 54.69 30% 62% 46% 40% 18% 39.44Financial 17% 3.03 0.30% 0.14% 33.11 45% 62% 43% 36% 17% 64.06Gaming 19% 3.48 0.68% 0.21% 74.16 39% 61% 41% 41% 17% 51.12Government/Utilities 20% 3.33 0.47% 0.08% 49.45 41% 64% 42% 41% 16% 51.84Health/Beauty 18% 2.95 0.42% 0.10% 40.92 38% 62% 45% 30% 15% 47.21Medical 12% 2.92 0.34% 0.28% 52.04 32% 50% 32% 54% 18% 57.12news/Media 8% 3.04 0.35% 0.15% 93.30 45% 60% 42% 42% 14% 30.76Restaurant 23% 3.13 0.38% 0.07% 25.33 53% 46% 37% 44% 15% 57.49Retail 21% 2.83 0.47% 0.15% 42.97 57% 63% 44% 54% 22% 57.30Services 21% 3.13 0.44% 0.08% 56.89 29% 62% 42% 42% 18% 55.09Sports 8% 3.05 0.31% 0.10% 32.58 42% 75% 53% 38% 24% 28.36Tech/Internet 15% 3.05 0.38% 0.14% 32.89 43% 82% 72% 37% 14% 46.39Telecom 22% 2.98 0.43% 0.13% 49.42 48% 56% 41% 42% 17% 51.14Travel 22% 3.15 0.49% 0.10% 42.38 59% 69% 57% 40% 14% 46.39
Interaction Rate (IR) User Initiated Interactions' divided by 'Served Impressions'Click-through Rate (CTR) Frequency of Click-throughs as a percentage of served impressions. 'Clicks' divided by 'Impressions'. Avg. Video Duration The average duration the video was played, including user and auto initiated videos (in seconds).Started Rate The number of times the video started out of video's served Impressions50% Played Rate The number of videos that played over 50% of their total video length divided by 'Video Started'.Fully Played Rate The number of videos that were fully played divided by video that startedTotal Expansion Rate Total expansions divided by served impressions. Including Auto-initiated expansionsImpressions with any Panel Expansion Rate The number of impressions with at least one panel expansion.Avg. Expansion Duration The average time a panel was expanded, including user and auto initiated expansionsRich Media Ads All Eyeblaster's format excluding standard banner, wallpaper and window ads— not Available - either this measurement is not applicable to the format or there was not enough data to be statistically relevant
Europe: including Austria, Belgium, Denmark, France, Germany, Greece, Ireland, Italy, netherlands, Poland, Portugal, Spain, Sweden, Switzerland, UK. The benchmark is for a rolling year, last updated Q4 2008.
15 AnAlyTICS BUllETIn ISSUE 4 | JUly 2009
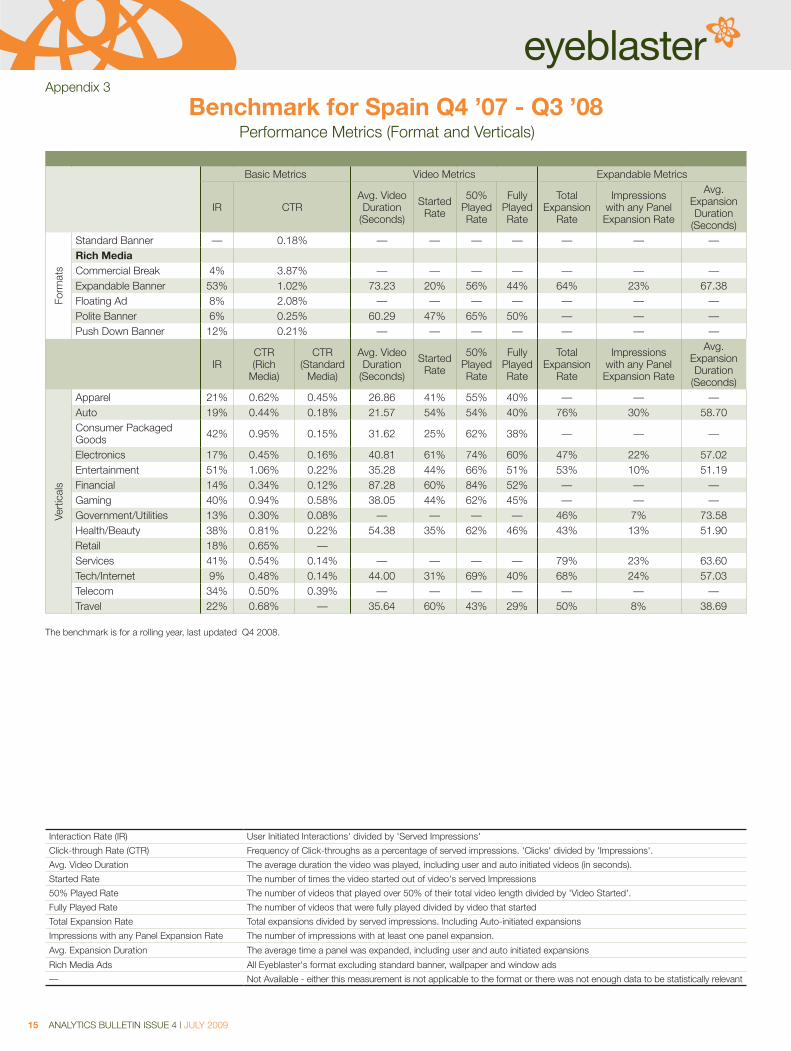
Performance Metrics (Format and Verticals)Benchmark for Spain Q4 ’07 - Q3 ’08
Appendix 3
Basic Metrics Video Metrics Expandable Metrics
IR CTRAvg. Video Duration
(Seconds)Started
Rate 50%
Played Rate
Fully Played Rate
Total Expansion
Rate
Impressions with any Panel Expansion Rate
Avg. Expansion Duration
(Seconds)
Form
ats
Standard Banner — 0.18% — — — — — — —Rich Media Commercial Break 4% 3.87% — — — — — — —Expandable Banner 53% 1.02% 73.23 20% 56% 44% 64% 23% 67.38Floating Ad 8% 2.08% — — — — — — —Polite Banner 6% 0.25% 60.29 47% 65% 50% — — —Push Down Banner 12% 0.21% — — — — — — —
IRCTR (Rich
Media)
CTR (Standard
Media)
Avg. Video Duration
(Seconds)Started
Rate 50%
Played Rate
Fully Played Rate
Total Expansion
Rate
Impressions with any Panel Expansion Rate
Avg. Expansion Duration
(Seconds)
Verti
cals
Apparel 21% 0.62% 0.45% 26.86 41% 55% 40% — — —Auto 19% 0.44% 0.18% 21.57 54% 54% 40% 76% 30% 58.70Consumer Packaged Goods 42% 0.95% 0.15% 31.62 25% 62% 38% — — —
Electronics 17% 0.45% 0.16% 40.81 61% 74% 60% 47% 22% 57.02Entertainment 51% 1.06% 0.22% 35.28 44% 66% 51% 53% 10% 51.19Financial 14% 0.34% 0.12% 87.28 60% 84% 52% — — —Gaming 40% 0.94% 0.58% 38.05 44% 62% 45% — — —Government/Utilities 13% 0.30% 0.08% — — — — 46% 7% 73.58Health/Beauty 38% 0.81% 0.22% 54.38 35% 62% 46% 43% 13% 51.90Retail 18% 0.65% —Services 41% 0.54% 0.14% — — — — 79% 23% 63.60Tech/Internet 9% 0.48% 0.14% 44.00 31% 69% 40% 68% 24% 57.03Telecom 34% 0.50% 0.39% — — — — — — —Travel 22% 0.68% — 35.64 60% 43% 29% 50% 8% 38.69
Interaction Rate (IR) User Initiated Interactions' divided by 'Served Impressions'Click-through Rate (CTR) Frequency of Click-throughs as a percentage of served impressions. 'Clicks' divided by 'Impressions'. Avg. Video Duration The average duration the video was played, including user and auto initiated videos (in seconds).Started Rate The number of times the video started out of video's served Impressions50% Played Rate The number of videos that played over 50% of their total video length divided by 'Video Started'.Fully Played Rate The number of videos that were fully played divided by video that startedTotal Expansion Rate Total expansions divided by served impressions. Including Auto-initiated expansionsImpressions with any Panel Expansion Rate The number of impressions with at least one panel expansion.Avg. Expansion Duration The average time a panel was expanded, including user and auto initiated expansionsRich Media Ads All Eyeblaster's format excluding standard banner, wallpaper and window ads— not Available - either this measurement is not applicable to the format or there was not enough data to be statistically relevant
The benchmark is for a rolling year, last updated Q4 2008.

16 AnAlyTICS BUllETIn ISSUE 4 | JUly 2009
Basic Metrics Video Metrics Expandable Metrics
IRInteraction Average Duration
(Seconds)CTR
Avg. Video Duration
(Seconds)Started
Rate 50%
Played Rate
Fully Played Rate
Total Expansion
Rate
Impressions with any Panel
Expansion Rate
Avg. Expansion Duration
(Seconds)
Form
ats
Standard Banner — — 0.11% — — — — — — —Rich Media Commercial Break 3% 2.70 3.14% — — — — — — —
Expandable Banner 21% 3.32 0.34% 22.96 6% 47% 36% 24% 11% 57.25
Floating Ad 8% 3.00 2.28% 50.89 76% 84% 78% — — —Floating Ad With Reminder 5% 2.64 1.60% 11.04 63% 64% 21% — — —
Floating Expandable 32% 2.93 0.43% — — — — 78% 32% 151.76
Polite Banner 2% 2.82 0.11% 40.54 40% 66% 50% — — —Push Down Banner 26% 2.89 0.32% 17.32 23% 63% 47% 45% 11% 24.57
IRInteraction Average Duration
(Seconds)
CTR (Rich Media)
CTR (Standard
Media)
Avg. Video Duration
(Seconds)Started
Rate 50%
Played Rate
Fully Played Rate
Total Expansion
Rate
Impressions with any Panel
Expansion Rate
Avg. Expansion Duration
(Seconds)
Verti
cals
Apparel 10% 3.11 0.36% 0.18% 17.65 17% 49% 34% 26% 12% 67.31Auto 7% 2.92 0.23% 0.22% 46.30 27% 78% 69% 17% 10% 52.91Careers 24% 3.45 0.46% 0.04% — — — — 62% 22% 36.10Consumer Packaged Goods 12% 3.27 0.33% 0.12% 24.46 25% 70% 56% 26% 13% 50.61
Corporate 5% 2.55 0.12% 0.05% — — — — 10% 5% 50.69Electronics 16% 2.88 0.32% 0.11% 34.20 34% 64% 50% 29% 15% 56.57Entertainment 11% 3.09 0.35% 0.16% 29.23 16% 68% 55% 21% 10% 56.96Financial 8% 2.76 0.15% 0.05% 19.87 22% 64% 52% 30% 8% 74.25Gaming 6% 4.60 0.30% 0.10% 33.03 20% 54% 41% 6% 3% 46.98Government/Utilities 18% 3.77 0.31% 0.18% 69.27 20% 38% 24% 25% 13% 55.22
Health/Beauty 12% 2.86 0.45% 0.11% 26.73 18% 47% 34% 23% 13% 62.54Medical 15% 2.75 0.41% 0.09% — — — — 32% 16% 55.26news/Media 11% 3.51 0.21% 0.18% — — — — 19% 11% 68.97Restaurant 27% 4.16 0.67% 0.17% — — — — 37% 17% 32.42Retail 10% 3.70 0.22% 0.11% 35.47 21% 50% 37% 21% 11% 36.07Services 9% 2.77 0.14% 0.06% 50.42 13% 51% 35% 15% 8% 53.70Sports 3% 2.36 0.40% 0.06% — — — — — — —Tech/Internet 4% 2.61 0.12% 0.10% 27.48 27% 58% 38% 23% 11% 67.82Telecom 13% 3.23 0.31% 0.09% 32.26 11% 52% 40% 34% 15% 49.93Travel 15% 2.95 0.32% 0.15% 12.99 17% 63% 51% 25% 10% 48.51
Appendix 4
Performance Metrics (Format and Verticals)Benchmark for APAC Q4 ’07 - Q3 ’08
Interaction Rate (IR) User Initiated Interactions' divided by 'Served Impressions'Click-through Rate (CTR) Frequency of Click-throughs as a percentage of served impressions. 'Clicks' divided by 'Impressions'. Avg. Video Duration The average duration the video was played, including user and auto initiated videos (in seconds).Started Rate The number of times the video started out of video's served Impressions50% Played Rate The number of videos that played over 50% of their total video length divided by 'Video Started'.Fully Played Rate The number of videos that were fully played divided by video that startedTotal Expansion Rate Total expansions divided by served impressions. Including Auto-initiated expansionsImpressions with any Panel Expansion Rate The number of impressions with at least one panel expansion.Avg. Expansion Duration The average time a panel was expanded, including user and auto initiated expansionsRich Media Ads All Eyeblaster's format excluding standard banner, wallpaper and window ads— not Available - either this measurement is not applicable to the format or there was not enough data to be statistically relevant
APAC: including Australia, China, Hong Kong, India, Japan, Korea, Malaysia, new Zealand, Pakistan, Singapore. The benchmark is for a rolling year, last updated Q4 2008.
17 AnAlyTICS BUllETIn ISSUE 4 | JUly 2009
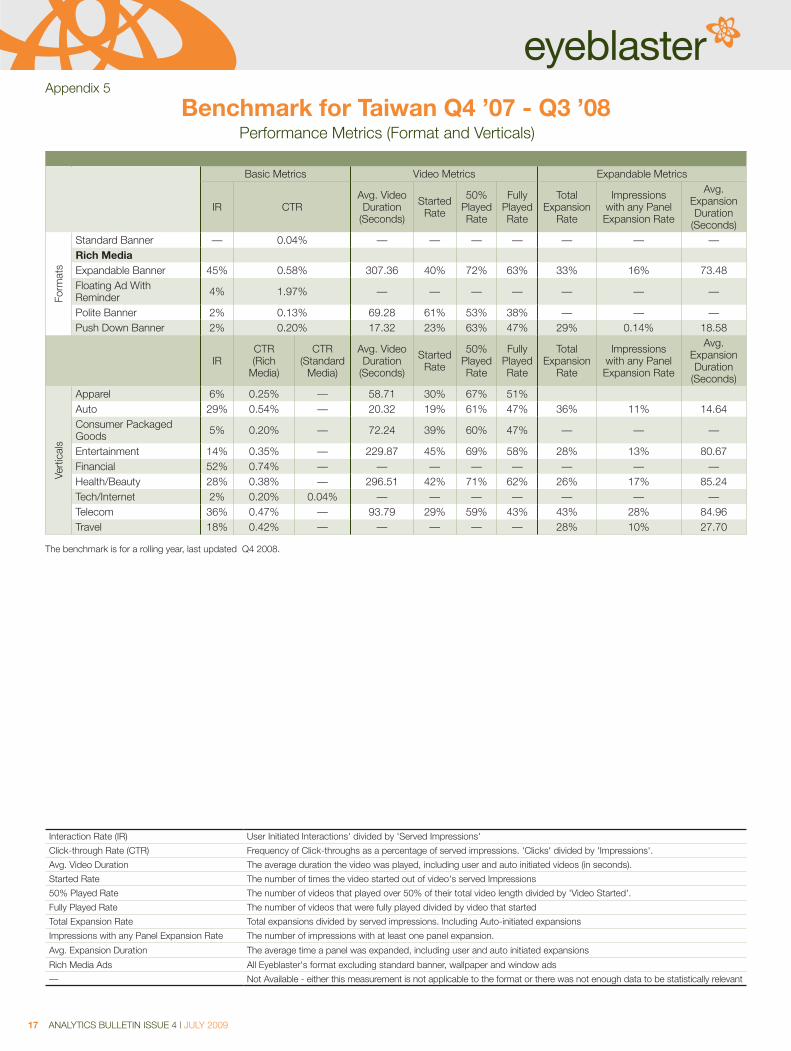
Performance Metrics (Format and Verticals)Benchmark for Taiwan Q4 ’07 - Q3 ’08
Appendix 5
Basic Metrics Video Metrics Expandable Metrics
IR CTRAvg. Video Duration
(Seconds)Started
Rate 50%
Played Rate
Fully Played Rate
Total Expansion
Rate
Impressions with any Panel Expansion Rate
Avg. Expansion Duration
(Seconds)
Form
ats
Standard Banner — 0.04% — — — — — — —Rich Media Expandable Banner 45% 0.58% 307.36 40% 72% 63% 33% 16% 73.48Floating Ad With Reminder 4% 1.97% — — — — — — —
Polite Banner 2% 0.13% 69.28 61% 53% 38% — — —Push Down Banner 2% 0.20% 17.32 23% 63% 47% 29% 0.14% 18.58
IRCTR (Rich
Media)
CTR (Standard
Media)
Avg. Video Duration
(Seconds)Started
Rate 50%
Played Rate
Fully Played Rate
Total Expansion
Rate
Impressions with any Panel Expansion Rate
Avg. Expansion Duration
(Seconds)
Verti
cals
Apparel 6% 0.25% — 58.71 30% 67% 51%Auto 29% 0.54% — 20.32 19% 61% 47% 36% 11% 14.64Consumer Packaged Goods 5% 0.20% — 72.24 39% 60% 47% — — —
Entertainment 14% 0.35% — 229.87 45% 69% 58% 28% 13% 80.67Financial 52% 0.74% — — — — — — — —Health/Beauty 28% 0.38% — 296.51 42% 71% 62% 26% 17% 85.24Tech/Internet 2% 0.20% 0.04% — — — — — — —Telecom 36% 0.47% — 93.79 29% 59% 43% 43% 28% 84.96Travel 18% 0.42% — — — — — 28% 10% 27.70
Interaction Rate (IR) User Initiated Interactions' divided by 'Served Impressions'Click-through Rate (CTR) Frequency of Click-throughs as a percentage of served impressions. 'Clicks' divided by 'Impressions'. Avg. Video Duration The average duration the video was played, including user and auto initiated videos (in seconds).Started Rate The number of times the video started out of video's served Impressions50% Played Rate The number of videos that played over 50% of their total video length divided by 'Video Started'.Fully Played Rate The number of videos that were fully played divided by video that startedTotal Expansion Rate Total expansions divided by served impressions. Including Auto-initiated expansionsImpressions with any Panel Expansion Rate The number of impressions with at least one panel expansion.Avg. Expansion Duration The average time a panel was expanded, including user and auto initiated expansionsRich Media Ads All Eyeblaster's format excluding standard banner, wallpaper and window ads— not Available - either this measurement is not applicable to the format or there was not enough data to be statistically relevant
The benchmark is for a rolling year, last updated Q4 2008.

www.eyeblaster.com