time allowed: 1 hour 45 minutes ... - physics & maths...
TRANSCRIPT

© OCR 2016 J259/03
QN: 601/8685/9 D10016/7 Turn over
GCSE (9–1) Physics B (Twenty First Century Science) J259/03 Breadth in physics (Higher Tier) Sample Question Paper
Date – Morning/Afternoon Time allowed: 1 hour 45 minutes
You must have: a ruler (in mm) the Data Sheet
You may use: • a scientific or graphical calculator
0 0 0 0 *
First name
Last name
Centre number
Candidate number
INSTRUCTIONS • Use black ink. HB pencil may be used for graphs and diagrams only. • Complete the boxes above with your name, centre number and candidate number. • Answer all the questions. • Write your answer to each question in the space provided. • Additional paper may be used if required but you must clearly show your candidate
number, centre number and question number(s). • Do not write in the bar codes.
INFORMATION • The total mark for this paper is 90. • The marks for each question are shown in brackets [ ]. • This document consists of 24 pages.
H
SPECIMEN
PMT

2
© OCR 2016 J259/03
Answer all the questions.
1 (a) (i) Define density.
……………………………………………………………………………………………............
……………………………………………………………………………………………... [1]
(ii) A volume of air measuring 3.0 m3 has a mass of 3.9 kg.
Calculate its density.
……………………..kg/m3 [2]
(b) Georgina does an experiment to test the hypothesis ‘the reason why a solid floats or sinks in a liquid depends upon both the density of the solid and the density of the liquid’.
She was given blocks of rubber and wood and bottles of maple syrup and baby oil.
Georgina concludes that the density of both the solid and the liquid affects whether it floats or sinks.
Use the data to justify Georgina’s conclusion.
Material Density (g/cm3) Rubber 1.52 Wood 0.85 Maple Syrup 1.37 Baby Oil 0.80
Material Floats in Maple Syrup Floats in Baby Oil Rubber No No Wood Yes No
………………………………………………………………………………………………………
………………………………………………………………………………………………………
………………………………………………………………………………………………………
………………………………………………………………………………………………………
..……………………………………………………………………………………………… [2]
SPECIMEN
PMT

3
© OCR 2016 J259/03 Turn over
(c) A solid block is immersed in a liquid.
Which one of the diagrams A, B, C or D, best shows the direction of all the force(s) on the solid caused by the liquid pressure?
……………….. [1]
SPECIMEN
PMT

4
© OCR 2016 J259/03
2 This is a picture of a tennis ball being hit.
(a) The racket exerts an average force of 1000 N on the tennis ball.
Complete the following table to show whether each statement about the average force exerted by the tennis ball on the racket is true or false.
Put ticks () in the correct boxes.
True False It is a vector quantity
The average force acts in the same direction as the ball is moving
The average force equals 1000 N
The average force depends upon the weight of the ball
[2]
(b) The tennis ball has a mass of 0.06 kg.
Calculate the momentum of the ball (in kg m/s) as soon as it leaves the racket at 50 m/s.
……………………..kg m/s [3]
(c) Calculate the weight in Newtons of the tennis ball. Gravitational field strength = 10N/kg.
…………………………N [3]
SPECIMEN
PMT
5
© OCR 2016 J259/03 Turn over
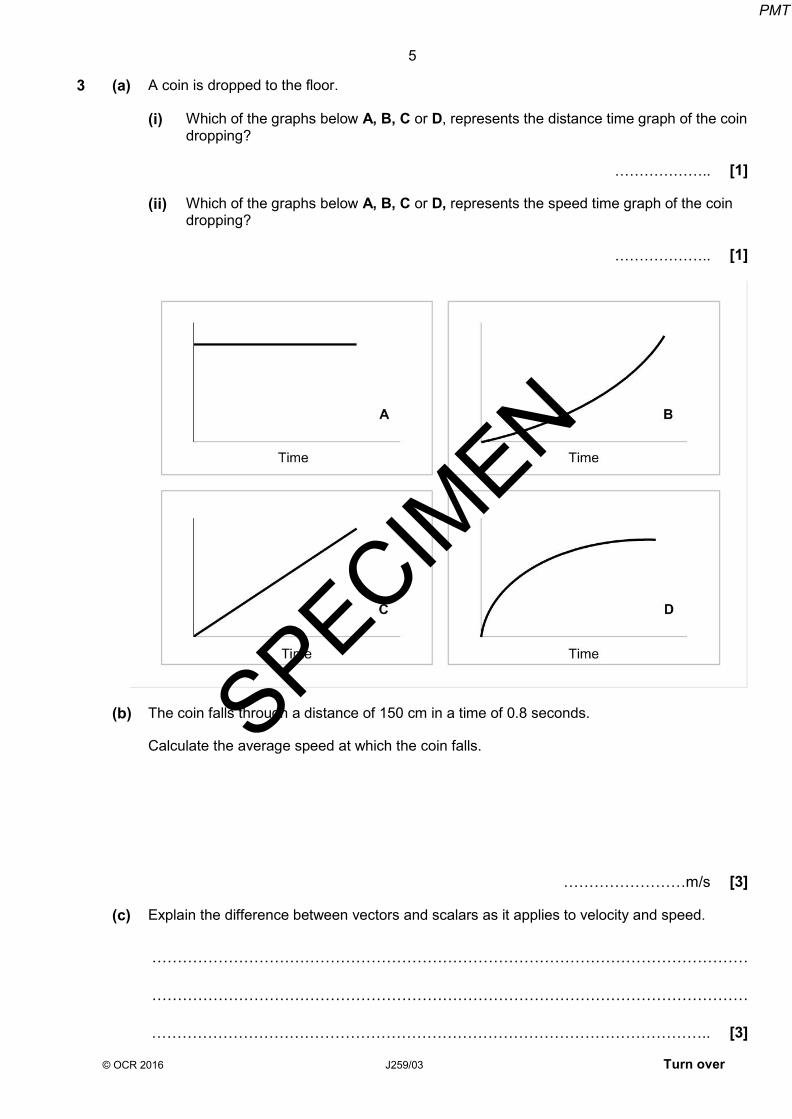
3 (a) A coin is dropped to the floor.
(i) Which of the graphs below A, B, C or D, represents the distance time graph of the coin dropping?
……………….. [1]
(ii) Which of the graphs below A, B, C or D, represents the speed time graph of the coin dropping?
……………….. [1]
(b) The coin falls through a distance of 150 cm in a time of 0.8 seconds.
Calculate the average speed at which the coin falls.
……………………m/s [3]
(c) Explain the difference between vectors and scalars as it applies to velocity and speed.
………………………………………………………………………………………………………
………………………………………………………………………………………………………
……………………………………………………………………………………………….. [3]
SPECIMEN
PMT

6
© OCR 2016 J259/03
4 Lydia is comparing series and parallel circuits in a class practical.
(a) Lydia decides to check the battery voltage in the circuits.
Using the correct circuit symbol add a meter to circuit A to show how she could do this. [1] (b) Lydia switches on both circuits.
Put a tick () in the box next to the correct answer.
The reading on A1 is less than the reading on A2.
The total resistance in circuit B is 6 Ω.
The p.d. across the 8 Ω is the same in both circuits.
The p.d. across A2 is very large
[1]
8 Ω
A
A
8 Ω
6 V 6 V
Circuit A Circuit B
A1
A2
4Ω
4Ω
SPECIMEN
PMT

7
© OCR 2016 J259/03 Turn over
(c) Lydia replaces the 4 Ω resistor with a 6 Ω resistor in each circuit. Complete the following table to show whether each statement is now true for the two circuits. Put ticks () in the correct boxes.
Statement
True for circuit
A
True for circuit
B
True for both
The current from the battery decreases
Each unit of charge does less work on the 8 Ω resistor
The current in the 8 Ω resistor does not change
[3]
SPECIMEN
PMT

8
© OCR 2016 J259/03
5 Ultrasonic testing is a technique widely used in industry to detect defects or flaws in many materials including metals and plastics.
The frequency of a sound wave is 100 kHz.
Calculate the wavelength of these waves given that their speed is 330 m/s?
……………………..m [4]
The probe sends out a sound wave into a sample of steel plate.
There are two signals displayed. One from the outgoing pulse (A) and the second due to the echo from the bottom surface (B).
B
probe steel plate
SPECIMEN
PMT

9
© OCR 2016 J259/03 Turn over
6 This question is about the magnetic effect of an electric current.
(a) (i) Which one of the diagrams correctly shows the magnetic field caused by a wire conducting an electric current (electric current flowing into the paper)?
……………….. [1]
A wire is placed between the north and south poles of a permanent magnet and at right angles to the magnetic field.
The current is switched on (electric current flowing into the paper). This creates a force on the wire in the direction shown.
(ii) Complete the diagram by labelling the North and South poles of the permanent
magnet and sketching the resulting magnetic field between the poles. [2]
(iii) The current in the wire in (ii) is 0.2 A, and the magnetic flux density is 0.036 T.
Calculate the length of wire inside the magnetic field if the force experienced is 5.4 x 10⁻⁴ N.
……………………..m [3]
A B C D
Direction of force SPECIM
EN
PMT

10
© OCR 2016 J259/03
(b) This is a diagram of a simple transformer.
The secondary coil produces an output of 12V.
Calculate the number of turns needed on the secondary coil.
number of turns = ………………………… [2]
(c) A National Grid transformer in a sub-station converts 30 000 V into 230 V to power a town of 12 000 inhabitants. The transformer is 99% efficient.
Using appropriate estimates, discuss the energy consequences for the transformer sub-station if the efficiency is less than 100%.
………………………………………………………………………………………………………
………………………………………………………………………………………………………
………………………………………………………………………………………………………
……………………………………………………………………………………………….. [2]
secondary coil 12 V
fewer turns
iron core
primary coil 230 V a.c.
27 600 turns
SPECIMEN
PMT

11
© OCR 2016 J259/03 Turn over
7 Two students are investigating springs and forces.
They begin by comparing three different springs.
They measured how much each spring stretched for a range of different weights attached.
Here are their results:
SPRING A SPRING B SPRING C Force
(N) Extension
(cm) Force
(N) Extension
(cm) Force
(N) Extension
(cm) 0.0 0.0 0.0 0.0 0.0 0.0 1.0 0.7 1.0 0.6 1.0 1.6 2.0 1.4 2.0 1.0 2.0 3.2 3.0 2.1 3.0 1.6 3.0 4.8 4.0 2.8 4.0 2.4 4.0 6.4 5.0 3.5 5.0 3.8 5.0 8.0
(a) One of the students makes a comment about the data.
Is this student correct? Use your understanding of what is meant by a linear relationship to help explain your answer.
………………………………………………………………………………………………..
………………………………………………………………………………………………..
……………………………………………………………………………………………... [2]
The data for all of the springs follow a linear relationship.
SPECIMEN
PMT

12
© OCR 2016 J259/03
(b)
They then plotted a graph of the data for spring C. (Note that the extension of the spring is in metres).
Use the graph to calculate the amount of work done (in joules) in stretching the spring over the first 8 cm (0.08 m).
……………………..J [2]
(c) When a rubber band is pulled, it stretches quite easily to start with and then becomes stiffer. Sketch a curve on the graph above to show this behaviour.
[1]
0
1
2
3
4
5
6
0.00 0.02 0.04 0.06 0.08
Forc
e ad
ded
(N)
Extension (m)
SPECIMEN
PMT

13
© OCR 2016 J259/03 Turn over
BLANK PAGE
TURN OVER FOR THE NEXT QUESTION
SPECIMEN
PMT

14
© OCR 2016 J259/03
8 This question is about changing ideas about our Universe.
(a) In 1917 scientists suggested that the Universe was not changing in size.
Explain the effect that gravity would have in a Universe that is not changing in size.
………………………………………………………………………………………………..……..
………………………………………………………………………………………………..…... [1]
(b) About this time, Edwin Hubble noticed red- shifts in the light from the galaxies. This provided evidence that galaxies were moving away from each other at high speeds.
(i) Explain what is meant by red- shift and how this shows that galaxies are receding.
………………………………………………………………………………………………..
………………………………………………………………………………………………..
……………………………………………………………………………………………... [2]
The graphs show how the speed that galaxies are moving away from us is linked to their distance from us.
30 60 90 Distance ( x 1019 km)
Later graph (galaxies up to 100 x 1019 km away)
0 3 6 Distance ( x 1019 km)
Hubble’s original data (galaxies up to 6 x 10¹⁹ km away)
SPECIMEN
PMT
15
© OCR 2016 J259/03 Turn over
(ii) Describe the trend shown in the graphs on page 14 and explain how the data provides evidence which leads to the ‘Big Bang’ model of the Universe.
………………………………………………………………………………………………..
………………………………………………………………………………………………..
………………………………………………………………………………………………..
………………………………………………………………………………………………..
………………………………………………………………………………………………..
……………………………………………………………………………………………... [3]
(iii) From graphs such as those on page 14, astronomers can work out how old the Universe is.
Assuming that the speeds of the galaxies have remained reasonably constant over time, explain how the data can be used to calculate the age of the Universe.
………………………………………………………………………………………………..
………………………………………………………………………………………………..
………………………………………………………………………………………………..
……………………………………………………………………………………………... [2]
(iv) Suggest two reasons why present day estimations over the age of the Universe are more trustworthy than Hubble’s initial values.
………………………………………………………………………………………………..
………………………………………………………………………………………………..
………………………………………………………………………………………………..
……………………………………………………………………………………………... [2]
SPECIMEN
PMT

16
© OCR 2016 J259/03
gamma radiation
9 (a) Nuclear medicine uses radioactive isotopes as tracers and to help diagnose and treat different types of cancer.
Here are some details about four radioactive isotopes of iodine.
Isotope Radiation emitted Half-life Iodine - 123 gamma 13 hours Iodine - 128 beta 25 minutes Iodine - 129 Beta and gamma 15.7 million years Iodine - 131 Beta and gamma 8 days
(i)
Iodine - 123 is widely used as a tracer. Explain why it is the most suitable out of the four listed in terms of the radiation that it emits and its half-life.
………………………………………………………………………………………………..
………………………………………………………………………………………………..
……………………………………………………………………………………………... [2]
(ii) Both iodine-129 and iodine-131 are produced by the fission of uranium atoms during the operation of nuclear reactors.
Here is a diagram of a fission reaction.
How is the energy released in this reaction carried away from the target nucleus after fission?
………………………………………………………………………………………………..
………………………………………………………………………………………………..
……………………………………………………………………………………………... [2]
SPECIMEN
PMT

17
© OCR 2016 J259/03 Turn over
(b) Describe the process of Nuclear Fusion.
………………………………………………………………………………………………………
………………………………………………………………………………………………………
……………………………………………………………………………………………….. [2]
SPECIMEN
PMT

18
© OCR 2016 J259/03
10 Richard uses the equipment below to calculate the specific heat capacity of water.
(a) (i) State one safety issue Richard needs to consider in a risk assessment and explain
what they can do to prevent this risk.
…………………………………………………………………………………………………..
……………………………………………………………………………………………. [2]
(ii) He calculates the change in thermal energy to be 12 900 J.
Calculate the specific heat capacity of water if the mass of water is 0.1 kg and the temperature change is 30°C.
……………..J/kg°C [3]
SPECIMEN
PMT

19
© OCR 2016 J259/03 Turn over
(iii) State and explain how he could improve the experiment to get a more accurate result.
………………………………………………………………………………………………..
………………………………………………………………………………………………..
…………………………………………………………………………………………. [2]
(b) Richard then does another experiment. He fills two beakers with equal masses of liquids X and Y, at the same temperature.
The temperatures of the liquids are monitored throughout the experiment.
The variation with time of the temperature of the liquids is shown below.
Use the graph to compare what happens to liquids X and Y at 55 °C. Suggest what is happening to the liquids at this temperature.
……………………………………………………………………………………………….
………………………………………………………………………………………………..
………………………………………………………………………………………… [3]
liquid X
liquid Y
Time (min)
Temperature (ºC)
SPECIMEN
PMT

20
© OCR 2016 J259/03
(c) Richard argues that liquids X and Y are the same substance. State what evidence there is to support this?
……………………………………………………………………………………………….
………………………………………………………………………………………… [1] (d) A beaker contains hot water. Richard wants to calculate the thermal energy lost
by the hot water when he puts a cold aluminium block into it.
What information will he need to make this calculation?
…………………………………………………………………………………………
…………………………………………………………………………………………
…………………………………………………………………………………………
…………………………………………………………………………………………
………………………………………………………………………………………… [3]
SPECIMEN
PMT

21
© OCR 2016 J259/03 Turn over
11 (a) In a coal burning power station large amounts of heat energy are needed to convert water to steam.
(i) Name an energy resource which does not need a furnace or boiler, as it can drive the turbine directly when generating electricity.
……………………………………………………………………………………………... [1]
(ii) Write down one advantage and one disadvantage this method of generating electricity has over a coal burning power station.
………………………………………………………………………………………………..
………………………………………………………………………………………………..
………………………………………………………………………………………………..
……………………………………………………………………………………………... [2]
(b) Some coal-burning power stations can provide some of their waste energy to heat local houses and industries. However, the efficiency of these Combined Heat and Power stations is reduced from a typical coal-burning power station.
Select one answer below to give a location where this would be useful.
Town A: small population far from power station
Town B: large population close to power station
Town C: large population far from power station
Town D: small population close to power station
[1]
SPECIMEN
PMT

22
© OCR 2016 J259/03
12 A group of students are designing an experiment to investigate the relationship between stopping distance and speed.
The apparatus The trolley has a mass of 200 g and is placed on a gently sloping ramp.
Thick carpet is used to slow down the trolley.
The metre ruler is needed to measure the stopping distance.
(a) How could the student calculate the ‘top speed’ of the trolley at the bottom of the ramp, just
before it reaches the carpet? Name the apparatus and how it should be used.
………………………………………………………………………………………………………
………………………………………………………………………………………………………
………………………………………………………………………………………………………
…………………………………………………………………………………………………… [3]
The procedure The trolley is released and allowed to run freely down the slope.
The distance it takes for the trolley to come to rest is measured.
The experiment is repeated by releasing the trolley from different positions up the ramp in
order to change the ‘top speed’.
The results
Speed (m/s)
Stopping distance (m)
0.52 0.18
0.39 0.11
0.66 0.28
0.79 0.40
0.82 0.44
0.94 0.62
Trolley
Carpet Metre ruler
Ramp
SPECIMEN
PMT

23
© OCR 2016 J259/03
(b) Complete the plotting of the points on the grid above and draw a smooth curve of best fit. [2]
(c) Describe the pattern shown on the graph.
………………………………………………………………………………………………………
………………………………………………………………………………………………………
……………………………………………………………………………………………… [2]
(d) Describe and explain how the stopping distances graph would differ if the trolley had an 800g mass placed on top of it.
………………………………………………………………………………………………………
………………………………………………………………………………………………………
………………………………………………………………………………………………………
……………………………………………………………………………………………… [3]
END OF QUESTION PAPER
0.00
0.10
0.20
0.30
0.40
0.50
0.60
0.70
0 0.2 0.4 0.6 0.8 1
Stop
ping
dis
tanc
e (m
)
Speed (m/s)
SPECIMEN
PMT

24
© OCR 2016 J259/03
Copyright Information:
© Leandro Franzoni. Image supplied by iStock, www.istockphoto.com
Image of Epoch LT Ultrasonic flaw detector reproduced with kind permission of Olympus Corporation, www.olympus-ims.com.
© MISS KANITHAR AIUMLA-OR. Image supplied by Shutterstock, www.shutterstock.com
OCR is committed to seeking permission to reproduce all third-party content that it uses in the assessment materials. OCR has attempted to
identify and contact all copyright holders whose work is used in this paper. To avoid the issue of disclosure of answer-related information to
candidates, all copyright acknowledgements are reproduced in the OCR Copyright Acknowledgements booklet. This is produced for each
series of examinations and is freely available to download from our public website (www.ocr.org.uk) after the live examination series.
If OCR has unwittingly failed to correctly acknowledge or clear any third-party content in this assessment material, OCR will be happy to correct
its mistake at the earliest possible opportunity.
For queries or further information please contact the Copyright Team, First Floor, 9 Hills Road, Cambridge CB2 1GE.
OCR is part of the Cambridge Assessment Group; Cambridge Assessment is the brand name of University of Cambridge Local Examinations
Syndicate (UCLES), which is itself a department of the University of Cambridge.
SPECIMEN
PMT