timber-processing capacity & capabilities in the western u.s
TRANSCRIPT

1
TimberTimber--processing processing Capacity & Capabilities Capacity & Capabilities
in the Western U.S.in the Western U.S.Charles E. KeeganCharles E. KeeganTodd A. MorganTodd A. MorganKrista M. GebertKrista M. GebertJason P. BrandtJason P. BrandtKeith A. Blatner Keith A. Blatner
Timothy P. SpoelmaTimothy P. Spoelma
November 16, 2004November 16, 2004
BB
ER N
ov. 2
004
draf
t

2
Capacity Study Objectives
• Quantify current and historic timber-processing capacity in the Western United States
• Estimate proportions of capacity capable of processing trees of various size classes
• Quantify current total timber use by tree size
Note: Pulpwood, industrial fuelwood, and log exports are treated separately
BB
ER N
ov. 2
004
draf
t
Specific objectives of this analysis are presented in the slide. The specific states and regions analyzed are:
•The Northern Rockies (Idaho, Montana, Wyoming)
•The Four Corners States (Arizona, Colorado, New Mexico, Utah)
•The Pacific Coast States (Alaska, California, Nevada, Oregon, and Washington)
Capacity, utilization, and capability were developed by summarizing mill level data.
The facilities included in the calculation of capacity include plants utilizing timber to manufacture:
• lumber and other sawn products;
• veneer/plywood;
•utility poles and pilings
•posts, small poles, stakes, and roundwood furniture;
• house logs and log homes;
• cedar products—shakes, shingles, and split rail fencing;
Because of their volatility and the difficulty of defining a capacity, roundwood pulpwood, industrial fuelwood, and log exports are treated separately and not included in the capacity figures. The ranges of volumes used and exported are discussed.

3
DefinitionsDefinitions
Timber-processing capacity:volume of timber that could be used by existing timber processors if demand for products were firm and sufficient raw material were available
Capability by size class:volume of trees by tree DBH class that could be processed efficiently
BB
ER N
ov. 2
004
draf
t
In this report capacity is expressed in units of timber input. Finished product output and log input were used to calculate recovery factors (unit output per unit input). These recovery factors were applied to mill capacity--expressed in units of output--to express capacity in units of timber input.
Timber-processing capacity is the volume of timber that could be used by existing timber processors if demand for products were firm and sufficient raw material were available.
Timber-processing capability by size class is the volume of trees that could be processed efficiently—at prices comparable to 1999-2001. Three tree diameter classes were identified to categorize timber use and milling capacity: trees < 7” diameter at breast height (DBH), trees 7” to 9.9” DBH, and trees ≥10” DBH.
Conversions among units were calculated based on information provided by mills and Avery and Burkhart (1994), Briggs (1994), and Hartman et al. (1981).

4
MethodsMethods
Current and historic information from periodic state censuses
Published information on the forest products industry
Interviews/discussions with mill managers, state and federal utilization specialists
BB
ER N
ov. 2
004
draf
t
The primary sources of data for this project were periodic forest industry surveys and censuses done for or by the Interior West (IW) and Pacific Northwest (PNW) Forest Inventory and Analysis (FIA) Programs of the USDA Forest Service, Rocky Mountain and Pacific Northwest Research Stations. In the Rocky Mountain States, California, and Oregon these surveys were done by the Bureau of Business and Economic Research (BBER) at The University of Montana, under joint venture agreements with the FIA units (Benson and Green 1987; FIDACS 2004; Howard and Ward 1988; Keegan et al. 2001a, b, c; Keegan et al. 1997; Keegan et al. 1995a, b; McLain 1988; McLain 1989; McLain et al. 1997; Morgan et al. 2004a, b; Morgan et al. In press; Ward et al. 2000; Ward 1997). For some previous years the FIA units did surveys. For Washington periodic industry surveys have been done by the Washington DNRC under partial sponsorship of the PNW FIA (Larsen and Aust 2000; Larsen 1990). Current Washington data were developed by Keith A. Blatner (2004) of Washington State University in cooperation with Bruce P. Glass of Washington DNRC. In Alaska PNW FIA and National Forest Systems as well as the State of Alaska have contributed to periodic surveys (Kilborn 2004).

5
Forest Industry Censuses(with IW & PNW FIA)
• Mill type, capacity, equipment
• Timber harvest volume, use, species, size, county, & ownership
• Product volume, sales, & geographic distribution
• Mill residue/wood fiber use
• Associated employment
BB
ER N
ov. 2
004
draf
t
The BBER periodic censuses are done on a state level about every five years to collect the information indicated on the slide. The Washington surveys collect much of the same information on a two-year basis. Surveys on Alaska's industry have been more variable in time frame and information collected. Because the censuses or surveys did not always provide data for the specific years used in this analysis (1986, 1996, 2003), other sources were used to update most recent survey data to 2003 (Adair 2004a,b; Blatner et al. 2004; Cohn and Blatner 2003; Ehinger 2004; Random Lengths 2004; Spelter 2002; Warren 1986-2003; WWPA 1986-2003).
The actual volumes processed in various size classes and proportions of mill capacity capable of processing trees in each of the three size classes were based on industry census information on:• Size of timber used • Mill equipment and configurations• Products producedDiscussions with mill operators, simulations of processing a range of log sizes through different mill configurations (Wagner et al. 1998 and 2000, Stewart et al. in press), and the authors’professional judgment were also incorporated.
In considering capability to efficiently process timber of various sizes, wood product prices for the period 1999-2001 were assumed.Again, the goal was to provide estimates of the capacity to utilize trees in the three size classes; in effect this meant identifying the proportion of capacity which could not efficiently process timber < 10” DBH and the portion that could process timber in the smaller size classes. Most mills capable of efficiently processing trees in the smaller categories were also capable of processing trees from larger size classes.

6
Four Corners
Northern Rockies
Pacific Coast
Capacity Study Area
~ 400 facilities in 2003
~ 240 facilities in 2003
~ 380 facilities in 2003
BB
ER N
ov. 2
004
draf
t
The state groupings were:
The Northern Rockies (Idaho, Montana, Wyoming)
The Four Corners States (Arizona , Colorado, New Mexico, Utah)
The Pacific Coast States (Alaska, California, Nevada, Oregon, and Washington)
More than 1,000 timber-processing facilities operated in these states in 2003; approximately half used some National Forest timber.

7
Changes in CapacityChanges in Capacity
Declining timber harvest levels have directly led to declining timber-processing capacity in the West.
Capacity declined despite high prices and high demand for wood products.
Declines were greatest in areas with greater dependence/use of National Forest timber (i.e. Four Corners).
BB
ER N
ov. 2
004
draf
t
Since 1986, capacity to process timber has declined in all regions.
Declining timber harvest levels have led to declining timber-processing capacity in the West.
Capacity declined sharply in many areas even during periods of high prices for lumber and other wood products.
Declines were greatest in areas with greater dependence on National Forest timber (i.e. Four Corners).
Sources: Adair 2004b; Benson and Green 1987; Ehinger 2004; FIDACS 2004; Howard and Ward 1988; Keegan et al. 2001a, b, c; Keegan et al. 1997; Keegan et al. 1995a, b; Larsen 1990; Larsen and Aust 2000; McLain et al. 1997; McLain 1989; McLain 1988; Miller Freeman 1986-1999; Morgan In press; Morgan et al. 2004a, b; Random Lengths 2001-2004; Spelter 2002; Ward et al. 2000; Ward 1997; Warren 1986-2003; WWPA 1986-2003.

0
1,000
2,000
3,000
4,000
5,000
6,000
Mill
ion
Cub
ic F
eet
1986 1996 2003
Capacity
Use
Western U.S. Timber-processing Capacity and Timber Use
37% capacity decline
78%73%
72%
BB
ER N
ov. 2
004
draf
t
West-wide there was a 37 percent decline in capacity to process timber and a 32 percent decline in timber use from 1986 to 2003. Capacity utilization increased somewhat from 72 percent to 78 percent. Most of the capacity decline (from 5.0 to 3.18 billion cubic feet) occurred between 1986 and 1996. Capacity increased 6 percent from 1996 to 2003.
In the late 1980s, the Western U.S. received about 40 percent of its timber from National Forests. In 2003, less than 10 percent of timber harvested from these states came from National Forests. Washington was the least dependent on National Forest timber at just under 20 percent in 1986. The Four Corners states were dependent on National Forest for more than 70 percent of their timber in the late 1980s.
Sources: Adair 2004b; Benson and Green 1987; Cohn and Blatner 2003; Ehinger 2004; FIDACS 2004; Howard and Ward 1988; Keegan et al. 2001a, b, c; Keegan et al. 1999; Keegan et al. 1997; Keegan et al. 1995a, b; Kilborn2004; Kuhns et al. 1997; Larsen 1990; Larsen and Aust 2000; McLain et al. 1997; McLain 1989; McLain 1988; Miller Freeman 1986-1999; Morgan In press; Morgan et al. 2004a, b; Random Lengths 2001-2004; Ward et al. 2000; Ward 1997; Warren 1986-2003; WWPA 1986-2003.

0
1,000
2,000
3,000
4,000M
illio
n C
ubic
Fee
t
1986 1996 2003
Capacity
Use
Pacific Coast Timber-processing Capacity and Timber Use
35% capacity decline
78%71%
71%
BB
ER N
ov. 2
004
draf
t
Among the Pacific Coast states (Alaska, California, Nevada, Oregon, and Washington), there was a 35 percent decline in capacity to process timber and a 29 percent decline in timber use from 1986 to 2003. Capacity utilization increased from 71 percent to 78 percent. Capacity increased 8 percent from 1996 to 2003 and the volume of timber processed increased 19 percent. California and Alaska showed declines in both capacity and utilization from 1996 to 2003; while Oregon and Washington had increases.
Washington’s capacity to process timber increased 1 percent (7 million cubic feet) from 1986 to 2003; however, log exports and roundwood pulpwood from Washington decreased by over 300 million cubic feet (MMCF).
In the late 1980s, National Forests provided about 35 percent of the region’s timber harvest. Washington was the least dependent on National Forest timber at slightly less than 20 percent in 1986. In the other states more than 40 percent of their timber harvested was from the National Forests in the late 1980s. In 2003, less than 10 percent of the timber harvest from these states came from National Forests.
Sources: Adair 2004b; Cohn and Blatner 2003; Ehinger 2004; FIDACS 2004; Howard and Ward 1988; Kilborn 2004; Larsen 1990; Larsen and Aust 2000; Miller Freeman 1986-1999; Morgan et al. 2004a; Random Lengths 2001-2004; Ward et al. 2000; Ward 1997; Warren 1986-2003; WWPA 1986-2003.
0
200
400
600
800
1,000
Mill
ion
Cub
ic F
eet
1986 1996 2003
Capacity
Use
Northern Rockies Timber-processing Capacity and Timber Use
38% capacity decline
77%
81%
78%
BB
ER N
ov. 2
004
draf
t
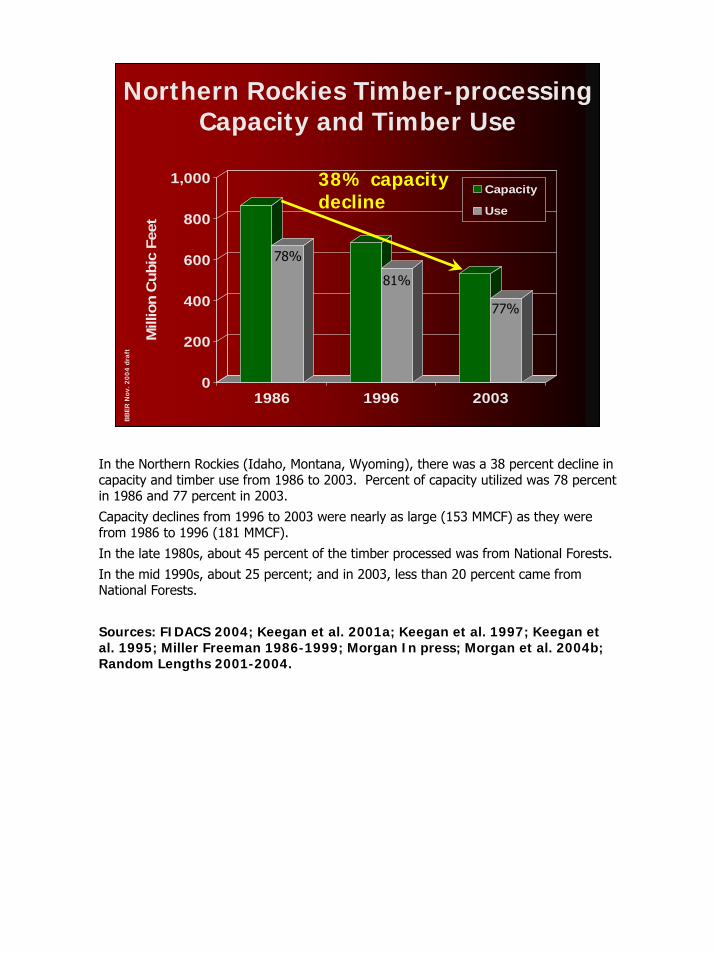
In the Northern Rockies (Idaho, Montana, Wyoming), there was a 38 percent decline in capacity and timber use from 1986 to 2003. Percent of capacity utilized was 78 percent in 1986 and 77 percent in 2003.
Capacity declines from 1996 to 2003 were nearly as large (153 MMCF) as they were from 1986 to 1996 (181 MMCF).
In the late 1980s, about 45 percent of the timber processed was from National Forests.
In the mid 1990s, about 25 percent; and in 2003, less than 20 percent came from National Forests.
Sources: FIDACS 2004; Keegan et al. 2001a; Keegan et al. 1997; Keegan et al. 1995; Miller Freeman 1986-1999; Morgan In press; Morgan et al. 2004b; Random Lengths 2001-2004.
0
100
200
300
Mill
ion
Cub
ic F
eet
1986 1996 2003
Capacity
Use
Four Corners Timber-processing Capacity and Timber Use
63% capacity decline
54%48%
67%
BB
ER N
ov. 2
004
draf
t
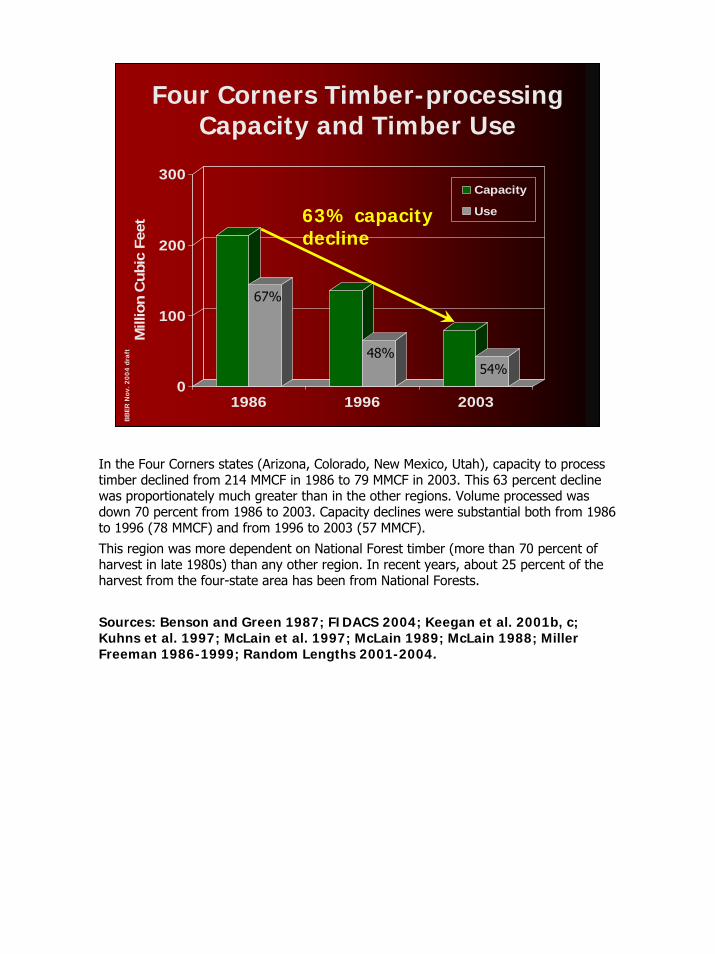
In the Four Corners states (Arizona, Colorado, New Mexico, Utah), capacity to process timber declined from 214 MMCF in 1986 to 79 MMCF in 2003. This 63 percent decline was proportionately much greater than in the other regions. Volume processed was down 70 percent from 1986 to 2003. Capacity declines were substantial both from 1986 to 1996 (78 MMCF) and from 1996 to 2003 (57 MMCF).
This region was more dependent on National Forest timber (more than 70 percent of harvest in late 1980s) than any other region. In recent years, about 25 percent of the harvest from the four-state area has been from National Forests.
Sources: Benson and Green 1987; FIDACS 2004; Keegan et al. 2001b, c; Kuhns et al. 1997; McLain et al. 1997; McLain 1989; McLain 1988; Miller Freeman 1986-1999; Random Lengths 2001-2004.

12
Unutilized22%
Utilized78%
Capacity = 3,162 MMCF
Timber-processing Capacity and Use in the Western U.S. 2003
BB
ER N
ov. 2
004
draf
t
In 2003, annual capacity to utilize timber (excluding roundwood pulpwood, log exports, and industrial fuelwood) in the Western U.S. was nearly 3.2 billion cubic feet, of which 78 percent was utilized.
Sources: Adair 2004b; Benson and Green 1987; Cohn and Blatner 2003; Ehinger 2004; FIDACS 2004; Howard and Ward 1988; Keegan et al. 2001a, b, c; Keegan et al. 1999; Keegan et al. 1997; Keegan et al. 1995a, b; Kilborn 2004; Kuhns et al. 1997; Larsen 1990; Larsen and Aust 2000; McLain et al. 1997; McLain 1989; McLain 1988; Miller Freeman 1986-1999; Morgan In press; Morgan et al. 2004a, b; Random Lengths 2001-2004; Ward et al. 2000; Ward 1997; Warren 1986-2003; WWPA 1986-2003.

State Capacity (MMCF) Use (MMCF) Percent Utilized
Alaska 47.0 6.0 13%
Oregon 1,104.0 956.0 87%
Washington 840.0 671.0 80%
12.9
California 558.7 363.1 65%
16.9
222.1
173.7
7.3
6.2
17.2
2,452.4
Arizona 18.7 69%
Colorado 35.0 48%
Idaho 264.9 84%
Montana 226.6 77%
New Mexico 12.3 59%
Utah 12.7 49%
Wyoming 41.9 41%
Total 3,161.8 78%
Timber-processing Capacity and Use, 2003
BB
ER N
ov. 2
004
draf
t
Capacity utilization in 2003 ranged from 13 percent in Alaska to 87 percent in Oregon.
Alaska, Colorado, Utah, and Wyoming utilized less than half of their capacity.
Oregon had the greatest capacity to process timber at just over 1.1 billion cubic feet. After Nevada, which had no operating mills identified in 2003, New Mexico had the least capacity at 12.3 million cubic feet.
Sources: Adair 2004b; Benson and Green 1987; Cohn and Blatner 2003; Ehinger 2004; FIDACS 2004; Howard and Ward 1988; Keegan et al. 2001a, b, c; Keegan et al. 1999; Keegan et al. 1997; Keegan et al. 1995a, b; Kilborn2004; Kuhns et al. 1997; Larsen 1990; Larsen and Aust 2000; McLain et al. 1997; McLain 1989; McLain 1988; Miller Freeman 1986-1999; Morgan In press; Morgan et al. 2004a, b; Random Lengths 2001-2004; Ward et al. 2000; Ward 1997; Warren 1986-2003; WWPA 1986-2003.

14
Capability to Capability to Process Timber by Process Timber by
Tree SizeTree Size
BB
ER N
ov. 2
004
draf
t
This next section deals with the capability of the industry to efficiently use timber from trees of various sizes.

15
10"+80%
7-9.9"18%
< 7"2%
Capacity = 3,162 MMCF
Timber-processing Capacity and Capability by Tree DBH in the Western U.S., 2003
2,526 MMCF notcapable of efficiently
using trees < 10” DBH
BB
ER N
ov. 2
004
draf
t
Excluding bioenergy and roundwood pulpwood, an estimated 2,526 MMCF (80 percent) of capacity was not capable of efficiently using trees < 10” DBH in 2003.
Sources: Adair 2004b; Benson and Green 1987; Cohn and Blatner 2003; Ehinger 2004; FIDACS 2004; Howard and Ward 1988; Keegan et al. 2001a, b, c; Keegan et al. 1999; Keegan et al. 1997; Keegan et al. 1995a, b; Kilborn 2004; Kuhns et al. 1997; Larsen 1990; Larsen and Aust 2000; McLain et al. 1997; McLain 1989; McLain 1988; Miller Freeman 1986-1999; Morgan In press; Morgan et al. 2004a, b; Random Lengths 2001-2004; Ward et al. 2000; Ward 1997; Warren 1986-2003; WWPA 1986-2003.

16
10"+82%
7 - 9.9"16%
< 7"2%
Total capacity = 2,550 MMCF
Timber-processing Capacity and Capability by Tree DBH for the Pacific Coast, 2003
BB
ER N
ov. 2
004
draf
t
The Pacific Coast possessed 81 percent of the Western U.S. capacity to process timber and 73 percent of the Western U.S. capacity to process trees < 10” DBH.
About 2,083 MMCF (82 percent) of timber-processing capacity in the Pacific Coast Region cannot efficiently process trees < 10” DBH.
A smaller proportion of capacity in the Pacific Coast is capable of efficiently processing small diameter timber -- 18 percent versus 26 percent for the Northern Rockies and 36 percent for the Four Corners.
Sources: Adair 2004b; Blatner et al. 2004; Ehinger 2004; FIDACS 2004; Howard and Ward 1988; Kilborn 2004; Larsen 1990; Larsen and Aust 2000; Miller Freeman 1986-1999; Morgan et al. 2004a; Random Lengths 2001-2004; Ward et al. 2000; Ward 1997; Warren 1986-2003; WWPA 1986-2003.

17
10"+74%
7 - 9.9"23%
< 7"3%
Total capacity = 534 MMCF
Timber-processing Capacity and Capability by Tree DBH for the Northern Rockies, 2003
BB
ER N
ov. 2
004
draf
t
The Northern Rockies contained 17 percent of the timber processing capacity in the Western U.S. Approximately 26 percent of that capacity could efficiently process trees < 10” DBH.
Sources: FIDACS 2004; Keegan et al. 2001a; Keegan et al. 1997; Keegan et al. 1995; Miller Freeman 1986-1999; Morgan In press; Morgan et al. 2004b; Random Lengths 2001-2004.

18
10"+64%
7 - 9.9"30%
< 7"6%
Total capacity = 79 MMCF
Timber-processing Capacity and Capability by Tree DBH for the Four Corners, 2003
BB
ER N
ov. 2
004
draf
t
The Four Corners Stares contained only 2 percent of the timber processing capacity in the Western U.S. However, there was proportionately more small-tree capacity in the Four Corners – 36 percent versus 26 percent in the Northern Rockies and 18 percent in the Pacific Coast.
Sources: Sources: Benson and Green 1987; FIDACS 2004; Keegan et al. 2001b, c; Kuhns et al. 1997; McLain et al. 1997; McLain 1989; McLain 1988; Miller Freeman 1986-1999; Random Lengths 2001-2004.

19
StateTree DBH
< 7.0”Tree DBH 7.0”-9.9”
Alaska <.05 2.0
Oregon 27.0 225.0
Washington 17.0 126.0
1.1
California 9.4 60.016.234.577.3
1.4
4.8
12.8561.1
Arizona 0.2
Colorado 3.0Idaho 3.9Montana 9.1
New Mexico 0.4
Utah 1.2
Wyoming 3.7Total 74.9
Small-diameter Timber-processing Capability by State (MMCF)
BB
ER N
ov. 2
004
draf
t
Only 75 MMCF out of the 636 MMCF capable of efficiently using timber < 10” DBH could efficiently use timber < 7” DBH.
Sources: Adair 2004b; Benson and Green 1987; Cohn and Blatner 2003; Ehinger 2004; FIDACS 2004; Howard and Ward 1988; Keegan et al. 2001a, b, c; Keegan et al. 1999; Keegan et al. 1997; Keegan et al. 1995a, b; Kilborn2004; Kuhns et al. 1997; Larsen 1990; Larsen and Aust 2000; McLain et al. 1997; McLain 1989; McLain 1988; Miller Freeman 1986-1999; Morgan In press; Morgan et al. 2004a, b; Random Lengths 2001-2004; Ward et al. 2000; Ward 1997; Warren 1986-2003; WWPA 1986-2003.

20
Timber Use by Timber Use by Tree SizeTree Size
BB
ER N
ov. 2
004
draf
t
This next section describes timber use by tree size classes.
A key point is that mills may have the capability to efficiently use timber of a given size but prefer larger timber when it is available.

21
< 7"1%
7 - 9.9"8%
10"+91%
Annual timber use = 2,452 MMCF
Timber Use by Tree DBH in the Western U.S., 2003
146 MMCF (6%) of trees >10”DBH are being processed by
mills capable of using trees 7-9.9”
DBH
BB
ER N
ov. 2
004
draf
t
Excluding bioenergy and roundwood pulpwood, 91 percent of the timber used in the Western U.S. during 2003 was from trees > 10” DBH.
146 MMCF (6 percent) of trees >10” DBH were being processed by mills capable of using trees 7-9.9” DBH.
Sources: Adair 2004b; Benson and Green 1987; Cohn and Blatner 2003; Ehinger 2004; FIDACS 2004; Howard and Ward 1988; Keegan et al. 2001a, b, c; Keegan et al. 1999; Keegan et al. 1997; Keegan et al. 1995a, b; Kilborn 2004; Kuhns et al. 1997; Larsen 1990; Larsen and Aust 2000; McLain et al. 1997; McLain 1989; McLain 1988; Miller Freeman 1986-1999; Morgan In press; Morgan et al. 2004a, b; Random Lengths 2001-2004; Ward et al. 2000; Ward 1997; Warren 1986-2003; WWPA 1986-2003.

22
< 7"1% 7 - 9.9"
8%
10"+91%
Annual timber use = 1,996 MMCF
Timber Use by Tree DBH for the Pacific Coast, 2003
BB
ER N
ov. 2
004
draf
t
Excluding bioenergy and pulpwood, only about 9 percent of the timber used in the Pacific Coast States in 2003 was from trees < 10” DBH.
Timber use in the Pacific Coast accounted for 81 percent of timber use throughout the Western U.S. during 2003.
Sources: Adair 2004b; Cohn and Blatner 2003; Ehinger 2004; FIDACS 2004; Howard and Ward 1988; Kilborn 2004; Larsen 1990; Larsen and Aust 2000; Miller Freeman 1986-1999; Morgan et al. 2004a; Random Lengths 2001-2004; Ward et al. 2000; Ward 1997; Warren 1986-2003; WWPA 1986-2003.

23
< 7"2% 7-9.9"
8%
10"+90%
Annual timber use = 412 MMCF
Timber Use by Tree DBH for the Northern Rockies, 2003
BB
ER N
ov. 2
004
draf
t
Similarly, about 10 percent of the timber used in the Northern Rockies during 2003 was from trees < 10” DBH.
Timber use in the Northern Rockies accounted for 17 percent of timber use throughout the Western U.S. during 2003.
Sources: FIDACS 2004; Keegan et al. 2001a; Keegan et al. 1997; Keegan et al. 1995; Miller Freeman 1986-1999; Morgan In press; Morgan et al. 2004b; Random Lengths 2001-2004.

24
< 7"5%
7 - 9.9"15%
10"+80%
Annual timber use = 43 MMCF
Timber Use by Tree DBH for the Four Corners, 2003
BB
ER N
ov. 2
004
draf
t
The Four Corners’ mills, with 20 percent of timber processed from trees < 10” DBH, utilized twice the proportion of small timber that mills in the Northern Rockies or Pacific Coast used.
Timber use in the Four Corners states accounted for 2 percent of timber use throughout the Western U.S. during 2003.
Sources: Benson and Green 1987; FIDACS 2004; Keegan et al. 2001b, c; Kuhns et al. 1997; McLain et al. 1997; McLain 1989; McLain 1988; Miller Freeman 1986-1999; Random Lengths 2001-2004.

25
StateTree DBH
< 7.0”Tree DBH 7.0”-9.9”
Alaska <.05 <.05
Oregon 9.0 115.0
Washington <.05 27.0
1.2California 0.5 13.3
3.611.420.2
0.8
1.0
1.0194.5
Arizona 0.2
Colorado 1.3Idaho 3.0Montana 2.7New Mexico 0.1
Utah 0.5
Wyoming 1.1Total 18.4
Small-diameter Timber Use by State and Tree Size Class (MMCF)
BB
ER N
ov. 2
004
draf
t
In 2003, 212.9 MMCF of trees < 10” DBH were used, excluding bioenergy and roundwood pulpwood. Of that, 9 percent (18.4 MMCF) came from trees < 7” DBH.
Sources: Adair 2004b; Benson and Green 1987; Cohn and Blatner 2003; Ehinger 2004; FIDACS 2004; Howard and Ward 1988; Keegan et al. 2001a, b, c; Keegan et al. 1999; Keegan et al. 1997; Keegan et al. 1995a, b; Kilborn2004; Kuhns et al. 1997; Larsen 1990; Larsen and Aust 2000; McLain et al. 1997; McLain 1989; McLain 1988; Miller Freeman 1986-1999; Morgan In press; Morgan et al. 2004a, b; Random Lengths 2001-2004; Ward et al. 2000; Ward 1997; Warren 1986-2003; WWPA 1986-2003.

26
Western Roundwood Pulpwood, and Industrial
FuelwoodAnnual use is variable, ranging from about 100 MMCF to nearly 300 MMCF annually.
In recent years, the total annual use of roundwood for pulp and industrial fuel has been near the low end of that range.
More than 60 percent was from live trees > 10”DBH.
BB
ER N
ov. 2
004
draf
t
Sources: FIDACS 2004; Howard and Ward 1988; Keegan et al. 1995; Keegan et al. 1997; Keegan et al. 2001; Kilborn 2004; Larsen 1990; Larsen and Aust2000; Morgan In Press; Morgan et al. 2004a, b; Ward et al. 2000; Ward 1997; Warren 1986-2003; WWPA 1986-2003.
27
Western Log ExportsWestern Log Exports
Log exports during the 1986 - 2003period ranged from over 850 MMCFannually in the late 1980s to less than200 MMCF in recent years. Virtually all of this timber has been>10” DBH.
BB
ER N
ov. 2
004
draf
t
Sources: FIDACS 2004; Howard and Ward 1988; Keegan et al. 1995; Keegan et al. 1997; Keegan et al. 2001; Larsen 1990; Larsen and Aust 2000; Morgan In Press; Morgan et al. 2004a, b; Ward et al. 2000; Ward 1997; Warren 1986-2003; WWPA 1986-2003.

28
• Capacity to process timber in the Western U.S. declined by 37 percent since 1986. The greatest capacity decline (63 percent) was in the Four Corners. This area was the most dependent on National Forest timber.
• Capacity in 2003 was 3.16 billion cubic feet, with 78 percent utilized. Capacity and utilization was substantially greater for trees > 10” DBH versus smaller trees.
• 636 MMCF (20 percent) of timber-processing capacity in the Western U.S. can efficiently process trees < 10” DBH (excluding industrial fuelwood and pulpwood). Only 75 MMCF can efficiently process trees < 7” DBH.
Summary PointsB
BER
Nov
. 200
4 dr
aft

29
Literature CitedLiterature Cited
Adair, C. 2004a. Regional Production and Market Outlook: Structural Panels and Engineered Wood Products 2004-2009. APA – The Engineered Wood Association,Tacoma, WA. E170. 56 p.
Adair, C. 2004b. Personal Communication. Market Research Director, APA – The Engineered Wood Association. Panel Production by State 1986-2003. Tacoma, WA.
Avery, T.E. and H.E. Burkhart. 1994. Forest Measurements, 4th ed. McGraw-Hill, Inc.New York, NY. 408 p.
Benson, R.E. and A.W. Green. 1987. Colorado’s timber resources. Resour. Bull. INT-48.Ogden, UT: U.S. Department of Agriculture, Forest Service, Intermountain Research Station. 53 p.
Blatner, K.A., C.E. Keegan, S.R. Shook and F.G. Wagner. 2004. Washington’s Forest Products Industry: Current Conditions and Forecast 2004. Washington State University Cooperative Extension, Pullman, WA. MISC0531. 8 p.
Briggs, D. 1994. Forest Products Measurements and Conversion Factors: With Special Emphasis on the U.S. Pacific Northwest. College of Forest Resources, Universityof Washington. Seattle, WA.
BB
ER N
ov. 2
004
draf
t

30
Literature Cited ContinuedLiterature Cited Continued
Cohn, P.J. and K.A. Blatner. 2003. Eastern Washington sawmill statistics for the first half of Calendar Year 2002. Washington State University Cooperative Extension,Pullman, WA. MISC#. 4 p.
Colorado State Forest Service (CSFS). 1999. Colorado Forest Industries Directory. Colorado State Forest Service. Fort Collins, CO. 69 p.
Ehinger, P.F. 2004. Personal Communication. Consulting Forester, Paul F. Ehinger & Associates, 2300 Oakmont Way, No. 212, Eugene, OR.
(FIDACS) Forest Industry Data Collection System. 2004. Bureau of Business andEconomic Research, The University of Montana-Missoula.
Hartman, D.A., W.A. Atkinson, B.S. Bryant, and R.O. Woodfin. 1981. Conversion Factorsfor the Pacific Northwest Forest Industry. Institute of Forest Products, College of Natural Resources, University of Washington. Seattle, WA.
Howard, J.O., and F.R. Ward. 1988. Oregon’s Forest Products Industry: 1985. Resour.Bull. PNW-RB-149. Portland, OR: U.S. Department of Agriculture, ForestService, Pacific Northwest Research Station.
BB
ER N
ov. 2
004
draf
t

31
Literature Cited ContinuedLiterature Cited Continued
Keegan C.E., K.M. Gebert, A.L. Chase, T.A. Morgan, S.E. Bodmer and D. D. Van Hooser.2001a. Montana’s Forest Products Industry: A Descriptive Analysis 1969-2000.Bureau of Business and Economic Research, The University of Montana,Missoula, MT. 68 p.
Keegan, C.E., A.L. Chase, T.A. Morgan, S.E. Bodmer, D.D. Van Hooser, and M.Mortimer. 2001b. Arizona’s forest products industry: a descriptive analysis 1998. The University of Montana-Missoula, Bureau of Business and Economic Research,Missoula, MT. 20 p.
Keegan, C.E., A.L. Chase, T.A. Morgan, S.E. Bodmer, D.D. Van Hooser, and M. Mortimer. 2001c. New Mexico’s forest products industry: a descriptive analysis 1997. The University of Montana-Missoula, Bureau of Business and EconomicResearch, Missoula, MT. 24 p.
Keegan C.E., K.A. Blatner and D.P. Wichman. 1999. Changing Use Patterns by Major Users of Mill Residue in the Inland Northwest. Forest Prod. J. 49(3):38-42.
Keegan C.E., D. P. Wichman, D. D. Van Hooser, T. G. Gorman, F. G. Wagner, P. E. Polzin and A. L. Hearst. 1997. Idaho’s Forest Products Industry: A DescriptiveAnalysis 1979-1996. Bureau of Business and Economic Research, The Universityof Montana, Missoula, MT. 68 p.
BB
ER N
ov. 2
004
draf
t

32
Literature Cited ContinuedLiterature Cited Continued
Keegan C.E., D. P. Wichman, A. L. Hearst, P. E. Polzin and D. D. Van Hooser. 1995a. Montana’s Forest Products Industry: A Descriptive Analysis 1969-1994. Bureau ofBusiness and Economic Research, The University of Montana, Missoula, MT. 49 p.
Keegan, C.E., D.P. Wichman, D.D. Van Hooser. 1995b. Utah’s Forest Products Industry: A Descriptive Analysis, 1992. Resour. Bull. INT-RB-83. Ogden, UT. U.S. Department of Agriculture, Forest Service, Intermountain Research Station. 21 p.
Kilborn, K. 2004. Personal Communication. Alaska Wood Utilization Research & Development Center. U.S. Department of Agriculture, Forest Service, Pacific Northwest Research Station. Sitka, AK.
Kuhns, M.R., A.R. Kelson, and R.J. Lilieholm. 1997. Utah and Nevada Wood Industry Directory, 1997. Department of Forest Resources, Utah State University. Logan, UT. 87 p.
Larsen, D.N., and P.M. Aust. 2000. Washington Mill Survey 1996. . Series Report #14. Washington State Department of Natural Resources. Olympia, WA.
Larsen, D.N. 1990. Washington Mill Survey 1986. Series Report #10. Washington StateDepartment of Natural Resources. Olympia, WA.
BB
ER N
ov. 2
004
draf
t

33
Literature Cited ContinuedLiterature Cited ContinuedMcLain, M.H., C.E. Keegan, and D.P. Wichman. 1997. Utah Timber Production and Mill
Residue, 1992. Resour. Bull. INT-RB-92. Ogden, UT: U.S. Department of Agriculture, Forest Service, Intermountain Research Station. 16 p.
McLain, W.H. 1989. New Mexico’s Timber Production and Mill Residue, 1986. Resour. Bull. INT-59. Ogden, UT. U.S. Department of Agriculture, Forest Service, Intermountain Research Station. 17 p.
McLain, W.H. 1988. Arizona’s timber production and mill residue, 1984. Resour. Bull.INT-55. Ogden, UT: U.S. Department of Agriculture, Forest Service, Intermountain Research Station.16 p.
Miller Freeman, Inc. 1986-1999. Directory of the Wood Products Industry. San Francisco, CA.
Morgan, T.A., T.P. Spoelma, C.E. Keegan, A.L. Chase and M.T. Thompson. (In press.)Wyoming’s forest products industry and timber harvest, 2000. Gen. Tech. Rep. RMRS-GTR-XXX. Ogden, UT: U.S. Department of Agriculture, Forest Service,Rocky Mountain Research Station. XX p.
Morgan, T.A., C.E. Keegan, T. Dillon, A.L. Chase, J.S. Fried, and M.N. Weber. 2004a. California’s Forest Products Industry: A Descriptive Analysis. PNW-GTR-615. Portland, OR: U.S. Department of Agriculture, Forest Service, Pacific NorthwestResearch Station.
BB
ER N
ov. 2
004
draf
t

34
Literature Cited ContinuedLiterature Cited Continued
Morgan, T.A., C.E. Keegan, T.P. Spoelma, T. Dillon, A.L. Hearst, F.G Wagner and L.T.DeBlander. 2004b. Idaho’s forest products industry: a descriptive analysis. Resour.Bull. RMRS-RB-4. Ogden, UT: U.S. Department of Agriculture, Forest Service, Rocky Mountain Research Station. 31 p.
Random Lengths. 2001-2004. The Buyers and Sellers Directory of the Forest ProductsIndustry. Eugene, OR. 1008 p.
Spelter, H. 2002. Sawmill Closures, Openings, and Net Capacity Changes in the Softwood Lumber Sector, 1996-2003. FPL-RP-603. Madison, WI: U.S. Department of Agriculture, Forest Service, Forest Products Laboratory. 12 p.
Stewart, H.G., K.A. Blatner, F.G. Wagner and C.E. Keegan. (In press) Risk and economic feasibility of processing small-diameter material in the US West part I: structural lumber. Forest Prod. J.
Wagner F.G., C.E. Keegan and C.E. Fiedler. 2000. Processing Value of Small-diameter Sawtimber at Conventional Stud Sawmills and Modern, High-speed Small-log Sawmills in the Western U.S.--A Comparison. Western J. of Applied Forestry 15(4):208-212.
BB
ER N
ov. 2
004
draf
t
35
Literature Cited ContinuedLiterature Cited Continued
Wagner, F.G., C.E. Keegan, R.D. Fight and S.A. Willits. 1998. Potential for Small-Diameter Sawtimber Utilization by the Current Sawmill Industry in Western North America. Forest Prod. J. 48(9)30-34.
Ward, F.R., G.J. Lettman, and B.A. Hiserote. 2000. Oregon’s Forest Products Industry: 1998. Portland, OR: U.S. Department of Agriculture, Forest Service, Pacific Northwest Research Station. Oregon Department of Forestry. 82 p.
Ward, F.R. 1997. Oregon’s Forest Products Industry: 1994. Resour. Bull. PNW-RB-216. Portland, OR: U.S. Department of Agriculture, Forest Service, Pacific Northwest Research Station. 70 p.
Warren, D.D. 1986-2003. Production, Prices, Employment, and Trade in Northwest Forest Industries, Various Years. Resour. Bull. Portland, OR: U.S. Department ofAgriculture, Forest Service, Pacific Northwest Research Station.
Western Wood Products Association (WWPA). 1986-2003. Statistical Yearbook of the Western Lumber Industry. Portland, OR.
BB
ER N
ov. 2
004
draf
t

36
Contacting UsContacting Us
•• Email: Email:
[email protected]@[email protected]@[email protected]@fs.fed.us
•• Internet:Internet:
www.BBER.umt.eduwww.BBER.umt.edu
BB
ER N
ov. 2
004
draf
t