tilburg university the challenge of retaining customers
TRANSCRIPT
Tilburg University
The challenge of retaining customers acquired with free trials
Datta, H.; Foubert, B.; van Heerde, H.J.
Published in:Journal of Marketing Research
DOI:10.1509/jmr.12.0160
Publication date:2015
Document VersionPeer reviewed version
Link to publication in Tilburg University Research Portal
Citation for published version (APA):Datta, H., Foubert, B., & van Heerde, H. J. (2015). The challenge of retaining customers acquired with free trials.Journal of Marketing Research, 52(2), 217-234. https://doi.org/10.1509/jmr.12.0160
General rightsCopyright and moral rights for the publications made accessible in the public portal are retained by the authors and/or other copyright ownersand it is a condition of accessing publications that users recognise and abide by the legal requirements associated with these rights.
• Users may download and print one copy of any publication from the public portal for the purpose of private study or research. • You may not further distribute the material or use it for any profit-making activity or commercial gain • You may freely distribute the URL identifying the publication in the public portal
Take down policyIf you believe that this document breaches copyright please contact us providing details, and we will remove access to the work immediatelyand investigate your claim.
Download date: 14. Mar. 2022
The Challenge of Retaining Customers Acquired with Free Trials
Hannes Datta
Bram Foubert
Harald J. van Heerde*
*Hannes Datta is Assistant Professor at the Department of Marketing, Tilburg University, P.O. Box 90153, 5000 LE
Tilburg, The Netherlands, [email protected]. Bram Foubert is Assistant Professor at the Department of
Marketing and Supply Chain Management, Maastricht University, P.O. Box 616, 6200 MD Maastricht, The
Netherlands, [email protected]. Harald J. van Heerde is Research Professor of Marketing, Massey
Business School,, Massey University, Private Bag 102904, Auckland 0745, New Zealand, and Extramural Fellow at
CentER, Tilburg University, The Netherlands, [email protected].
Acknowledgements. The authors gratefully acknowledge Marnik Dekimpe, Aurélie Lemmens, and Sungho Park, and
wish to thank Johannes Boegershausen, Kelly Geyskens, Caroline Goukens, Anne Klesse, and Arjen van Lin for
helpful comments on an earlier draft. The first author acknowledges the financial support of the Graduate School of
Business and Economics of Maastricht University, and the Netherlands Organization for Scientific Research (NWO
Vici Grant 453-09-004). This work was carried out on the Dutch national e-infrastructure with the support of SURF
Foundation.

1
The Challenge of Retaining Customers Acquired with Free Trials
ABSTRACT
Many service firms acquire customers by offering free-trial promotions. A crucial
challenge is to retain customers acquired with these free trials. To address this challenge, firms
need to understand how free-trial customers differ from regular customers in terms of their
decision making to retain the service. This article conceptualizes how a customer’s retention
decision is driven by marketing communication and usage behavior, and develops hypotheses
about the impact of free-trial acquisition on this process. To test the hypotheses, the authors
model a customer’s retention and usage decisions, distinguishing between usage of a flat-rate
service and usage of a pay-per-use service. The model allows for unobserved heterogeneity and
corrects for selection effects and endogeneity. Based on household panel data from a digital TV
service, the authors find systematic behavioral differences which make the average customer
lifetime value (CLV) of free-trial customers 59% lower than that of regular customers. However,
free-trial customers are more responsive to marketing communication and usage rates, which
offers opportunities to target marketing efforts and enhance retention rates, CLV, and customer
equity.
KEYWORDS: Free Trials, Customer Retention, Usage Behavior, Customer Lifetime Value,
Customer Equity, Acquisition Mode, Selection Effects, Endogeneity, Econometrics
2
A very popular way to acquire new customers, especially among service providers, is to
offer free-trial promotions. Customers on a free trial are allowed to try the service for a limited
amount of time at no charge. Well-known examples are the free trials offered by mobile
telephone operators (e.g., AT&T in the US), video streaming websites (e.g., Netflix in the US),
and digital TV providers (e.g., Sky television in Australia and New Zealand). While these free
trials may be popular with consumers, a crucial challenge to firms is to retain customers who
have been acquired with a free trial. To address this challenge, firms need to understand whether
customers attracted with free trials are systematically different from other customers. In this
article, we argue that free-trial acquisition may affect the nature of a customer’s relationship with
the service provider and, as a consequence, influence usage and retention behavior, consumers’
responsiveness to marketing activities, and ultimately customer lifetime value (CLV).
An emerging body of research has shown that the conditions under which customers are
acquired have implications for subsequent consumer behavior (e.g., Reinartz, Thomas, and
Kumar 2005; Schweidel, Fader, and Bradlow 2008). A first group of studies documents the role
of the sales channel through which customers have been attracted (e.g., Steffes, Murthi, and Rao
2011). For example, Verhoef and Donkers (2005) find that acquisition through the Internet leads
to higher retention rates than acquisition through direct mail or direct-response commercials. A
second set of papers addresses the impact of customer referral (Chan, Wu, and Xie 2011;
Schmitt, Skiera, and Van den Bulte 2011). Villanueva, Yoo, and Hanssens (2008), for instance,
show that customers acquired through word-of-mouth referral have longer lifetimes.
A third stream of research, in which we position our own work, examines the effects of
the price structure or promotional conditions under which customers were acquired. Iyengar et
al. (2011) find that customers of a telecommunication company who were acquired under a two-
3
part tariff structure have lower usage and retention rates than customers charged on a pay-per-use
basis.1 Lewis (2006) shows that acquisition discounts lead to lower retention rates, while
Anderson and Simester’s (2004) results indicate that promotionally acquired customers choose
cheaper products but buy more. Table 1 summarizes the relevant research.
[PLEASE INSERT TABLE 1 ABOUT HERE]
This article contributes to the literature in three ways. First, while previous work has
examined the impact of promotional customer acquisition on subsequent behavior, the effects of
free-trial promotion have remained largely unaddressed. A free trial involves a distinct type of
sales promotion which enables consumers to start using a service without a financial obligation
and to revise their initial adoption decision if they are not satisfied. A free trial thus allows
consumers to engage in a low-commitment relationship with the firm (Dwyer, Schurr, and Oh
1987). Relying on buyer-seller relationship theory, we will argue that this may lead to systematic
differences in behavior between free-trial and regular customers.
Although some studies examine the effects of free trials and sampling, most look at
aggregate sales (e.g., Heiman et al. 2001; Jain, Mahajan, and Muller 1995; Pauwels and Weiss
2008) or focus on immediate purchase effects (Scott 1976). Gedenk and Neslin (1999), who do
study individual customer behavior, find that sampling in the mineral water category reinforces
choice probabilities after the promotion. However, the authors do not examine retention, as this
is not relevant for FMCGs. Bawa and Shoemaker (2004) show that free samples attract new
buyers who may remain customers in subsequent periods. Yet, it is unclear whether the retention
rates of customers attracted with a sample differ from those of regular customers.
As a second contribution, we extend insights on the role of usage behavior in the
customer value generation process. Specifically, usage intensity can be an important driver of
4
retention because it reminds customers about the personal value of the service (e.g., Bolton and
Lemon 1999; Prins, Verhoef, and Franses 2009). This paper adds to these insights by examining
how free-trial acquisition influences the relationship between usage and retention. In particular,
if this relationship turns out to be particularly strong for customers acquired via free trial, it is in
the firm’s interest to encourage usage especially among these customers. An important
consideration in this respect is that many services involve two types of usage: flat-rate usage
(e.g., a regular TV subscription) and pay-per-use consumption (e.g., video-on-demand). While
both types of usage drive retention, usage of a pay-per-use service is also a direct source of
revenues (e.g., Danaher 2002; Iyengar et al., 2011). Therefore, we distinguish between flat-rate
and pay-per-use service components and examine the role of usage, not only as an antecedent of
retention but also as a direct component of CLV.
Third, a crucial yet unexplored question is whether acquisition mode affects customers’
responsiveness to the firm’s marketing communication efforts. Therefore, we evaluate the
differences in marketing responsiveness between free-trial and regular customers. Specifically,
we consider customers’ reaction to direct marketing and traditional advertising because of the
growing interest in marketing communication as a way to actively manage customers’ tenure
(e.g., Polo, Sese, and Verhoef 2011; Reinartz, Thomas, and Kumar 2005). If free-trial and
regular customers respond differently to direct marketing and advertising, firms may decide to
target retention efforts to the most receptive group to reduce churn.
In sum, we investigate whether free-trial acquisition influences retention behavior and
CLV, and how it moderates the extent to which retention is driven by service usage (flat-rate and
pay-per-use) and marketing communication. We develop econometric models for customers’
usage and retention decisions, accounting for unobserved heterogeneity and endogenous
5
marketing instruments. Importantly, because we are interested in the impact of free-trial
acquisition on a customer’s behavior, we correct for selection effects. In particular, free trials
may attract consumers with, a priori, lower valuations of the service (e.g., Lewis 2006). While
previous research on the role of acquisition mode typically ignores selection effects (see Table
1), we consider two alternative approaches to address these effects, i.e., explicit modeling of the
selection process (e.g., Thomas 2001) and matching (e.g., Gensler, Leeflang, and Skiera 2012).
Based on household panel data for more than 16,000 customers of a large European
digital TV provider, we find that free-trial customers have lower retention rates and use the
firm’s flat-rate service less intensively than regular customers. As a result, their CLV is, on
average, 59% lower than that of regular customers. However, free-trial customers are more
responsive to marketing communication and more likely to rely on their usage behavior when
deciding whether or not to retain the service. These findings offer managers opportunities to
better target their marketing efforts and improve retention rates, CLV, and customer equity.
CONCEPTUAL FRAMEWORK AND HYPOTHESES
Figure 1 presents the conceptual framework for this research. The core consists of a
customer’s usage and retention decisions, which are influenced by the acquisition mode, i.e.,
free-trial versus regular acquisition.
[PLEASE INSERT FIGURE 1 ABOUT HERE]
Core Decision Process
The core decision process involves two types of periodic (e.g., monthly) decisions. Every
period, consumers decide how intensively to use the service and whether to retain it or not.
Service usage. We distinguish between two types of service usage that are common for
subscription services: (1) usage of a flat-rate service, which is included in the subscription
6
charges, and (2) usage of a pay-per-use service, for which consumers pay per unit of
consumption. While both types of usage may foster retention, consumption of the pay-per-use
service, in addition, directly generates revenue.
Service retention. Every period, consumers decide whether to retain the service or not.
We distinguish between two sets of drivers for this decision. First, consumers rely on their usage
intensity for the flat-rate and pay-per-use component to assess the utility of retaining the service
(Bolton and Lemon 1999). As a result, a high usage intensity will stimulate retention, whereas a
low usage rate may lead to disadoption (Lemon, White, and Winer 2002). Note that, compared to
usage of the pay-per-use service, flat-rate usage may be more consequential for customers’
evaluation of the service subscription, because it is included in the fixed periodical fee (Bolton
and Lemon 1999). Second, a consumer’s retention decision is also influenced by marketing
communication (e.g., Blattberg, Malthouse, and Neslin 2009). Specifically, direct marketing and
advertising remind customers of the benefits of the service or directly persuade them to retain it.
If consumers retain the service in the current period, they go through the same usage and
retention decision process in the following period. As indicated by the dashed lines, this repeated
decision process drives customer lifetime value (CLV). In particular, the periodic retention
decisions generate a stream of fixed subscription fees (which cover flat-rate usage) while usage
of the pay-per-use service generates additional revenue.
Differences between Free-Trial and Regular Customers
Central to our study is the expectation that the decision process to use and retain the
service differs between free-trial and regular customers. Our hypotheses build on buyer-seller
relationship theory, which posits that customer behavior depends on the nature of the relationship
between customer and firm (Dwyer, Schurr, and Oh 1987; Johnson and Selnes 2004).
7
Baseline retention. Drawing on relationship theory, we expect free-trial customers to
churn sooner than regular customers. Whereas the anticipated longevity of a regular contract
encourages customers to immediately commit to the firm, subscription to a free trial resembles a
discrete transaction which merely increases a consumer’s awareness of the firm and facilitates
relationship exploration (Dwyer, Schurr, and Oh 1987; Johnson and Selnes 2004). According to
self-perception theory, free-trial customers may make post-hoc inferences about the reasons for
their behavior and hence attribute their adoption decision to the availability of a free trial rather
than to a strong commitment to the company (e.g., Dodson, Tybout, and Sternthal 1978; Gedenk
and Neslin 1999). In other words, a free trial slows down the relationship formation process
(Palmatier et al. 2013). Importantly, even after the free-trial period has expired, the firm’s
relationship with free-trial customers likely remains more fragile than that with regular
customers. In particular, research by Gilbert and Ebert (2002) and Gilbert et al. (1998) indicates
that consumers who receive the opportunity to first evaluate a product or service are more critical
than when they immediately commit to the firm, a tendency that persists after the evaluation
period. That is, the critical reflections generated during exploration of a relationship remain
active, even when the customer moves to a closer relationship level. Hence, we hypothesize that:
H1 Free-trial customers have a lower retention rate than regular customers even after
the free trial expires.
Impact of usage on retention. Because customers attracted with a free trial arguably have
a less developed relationship with the firm than regular customers, they may be more uncertain
about the service benefits (Johnson and Selnes 2004). One major factor that informs consumers
about the personal value of the service and thus helps to resolve the uncertainty, is their own
usage behavior (e.g., Bolton and Lemon 1999). A customer may wonder: Do I use the service

8
enough to stay subscribed? We expect that, to overcome their uncertainty, free-trial customers
are more inclined than regular customers to assess the service’s value on the basis of their flat-
rate and pay-per-use consumption. Regular customers, who are more committed to the firm, are
less likely to base their retention decision on usage intensity. Hence, we expect that:
H2a The impact of usage of a flat-rate service on retention is greater for free-trial
customers than for regular customers.
H2b The impact of usage of a pay-per-use service on retention is greater for free-trial
customers than for regular customers.
Impact of marketing communication on retention. We also argue that the firm’s
marketing communication, in the form of direct marketing and advertising, will be more
important to free-trial than to regular customers. Marketing communication provides free-trial
customers with information that can compensate for their relatively high uncertainty (Mitchell
and Olson 1981). Regular customers, in contrast, may be less susceptible to external information
because of confidence in their level of expertise (Brucks 1985; Hoch and Deighton 1989). In line
with these principles, Johnson and Selnes (2004) postulate that it is easier to boost commitment
among customers in a lower-level relationship with the firm than among already dedicated
customers. As a result, we expect that free-trial customers are more responsive to the firm’s
direct-marketing and advertising efforts than regular customers:
H3a The impact of direct marketing on retention is greater for free-trial customers than
for regular customers.
H3b The impact of advertising on retention is greater for free-trial customers than for
regular customers.
Baseline usage. Free-trial acquisition may also affect customers’ usage intensity. On the

9
one hand, free-trial customers are less committed to the firm and less convinced of the service
benefits, such that they may have lower usage rates than regular customers. In fact, usage is one
of the most tangible reflections of engagement with the firm (Van Doorn et al. 2010). This holds
true in particular for usage of the flat-rate service, which is the main object of the contractual
relationship (Bolton and Lemon 1999). On the other hand, exactly because free-trial customers’
relationship with the firm is more exploratory in nature (Dwyer, Schurr, and Oh 1987; Gilbert et
al. 1998), they may use the service more frequently to become more certain about the service’s
benefits. These opposing principles do not allow us to develop unidirectional expectations
regarding the impact of free-trial acquisition on usage of the flat-rate and pay-per-use services.
DATA
Study Context
We test the hypotheses based on a household panel data set from a large European
interactive TV (iTV) provider. iTV is a technology that enables customers to interact with their
TV, for example, by browsing an electronic program guide or watching video-on-demand
(VOD). Furthermore, iTV offers enhanced image quality over regular TV. To use the iTV
service, customers need a broadband DSL Internet connection from the same company and a
set-top box which decodes the digital signal. The focal company is the only provider of digital
TV via DSL and, at the end of the observation period, had a market share of 31% in the digital
TV market. Its main competitor, which offers digital TV via cable, had a market share of 40%.2
Under regular conditions, the company’s customers formally commit to a 12-month
subscription period. They have the possibility to cancel the service earlier, in which case they
pay a penalty (€50, plus €6 for every remaining month until the end of the contractual period).
After the first twelve months, the contract is automatically renewed but can be terminated each

10
month without penalty. Customers are charged a one-time setup fee for hardware and activation
(on average €16.24) and pay for service usage according to a two-part tariff structure (e.g.,
Ascarza, Lambrecht, and Vilcassim 2012; Iyengar et al. 2011). Specifically, the fixed monthly
subscription fee of €15.95 covers unlimited usage of the basic iTV service (€9.95) and rent of the
set-top box (€6). Additionally, customers can make use of a video-on-demand (VOD) service,
for which they are charged on a pay-per-use basis. They can select VODs from an electronic
catalogue containing movies, live concerts, and soccer games. VOD rental for 24 hours costs
around €3, with some limited variation in price due to differences in genre and length.
The company’s acquisition strategy offers a unique setting to study the impact of
free-trial acquisition. For a period of 10 months (months 10 till 19 after launch of the service),
the company offered free trials parallel to its regular subscriptions. Adoption of the free trial (as
opposed to the regular subscription) is largely driven by consumers’ awareness of the ongoing
free-trial promotion, which was mainly promoted via direct marketing. Customers acquired with
a free trial did not pay setup costs and were not charged monthly subscription fees for the usage
of the flat-rate service during a three-month period. VOD usage, however, was not free of
charge. Free-trial customers could revise their adoption decision by returning the set-top box to
one of the company stores before the end of the trial period, without paying a penalty. If the
product was not returned by the end of the three-month trial period, the subscription was
converted into a paid one, such that the next nine months were considered part of a regular
contract.
Data set
From the initial sample of close to 21,000 customers who adopted iTV when both the free
trial and regular subscription were available, we retain a subset based on several criteria.

11
Specifically, we eliminate customers who had missing socio-demographics, were employees of
the focal company, or did not speak the local language (and thus could not understand the
advertising and direct-marketing messages). We thus retain 16,512 customers of which 12,612
(76%) were acquired with free trials and the balance of 3,900 (24%) signed a regular contract.
We observe customers’ retention and usage behavior until two years after launch of the
service. 6,079 (48%) of the free-trial customers churn before the end of the observation period,
while of the regular customers only 1,327 (34%) do so. Furthermore, the data set includes two
types of usage: (1) flat-rate usage of the basic interactive TV service, which is measured by a
customer’s monthly number of channel zaps,3 and (2) usage of the VOD service, for which we
use the monthly number of VODs the customer has watched. Compared to regular customers,
free-trial customers have an average usage intensity that is 11% lower for the flat-rate service
(169 versus 189 zaps per month), but 26% higher for the video-on-demand service (.73 versus
.58 VODs per month). However, these retention and usage measures are only indicative, because
they do not account for selection effects or the impact of marketing activities.
The company uses two types of marketing communication: direct marketing and mass
advertising. We operationalize direct marketing as the monthly number of direct-marketing
contacts with a given customer (via phone, e-mail, or regular mail). On average, free-trial and
regular customers are contacted .34 and .16 times per month, respectively. In the analyses, we
account for these systematic differences in contact frequency. In addition, the data set includes a
measure for the company’s spending on mass advertising (via TV, print media, radio, and the
Internet). In particular, this variable quantifies the company’s advertising expenditures for a
given region in a given month, relative to the total advertising spending for the same region and
month by the company and its main competitor. This share-of-voice advertising measure varies
12
between 0 and 1, and has an average of .74 for free-trial and .79 for regular customers. Table 2
lists summary statistics of the variables in the data set, while Web Appendix A reports the
correlations between the independent variables. We give more details on the control variables
and socio-demographic variables when we discuss the model.
[PLEASE INSERT TABLE 2 ABOUT HERE]
MODEL
We specify a set of equations that incorporates the interrelationships between customers’
usage (flat-rate and pay-per-use) and retention decisions. We account for unobserved customer
heterogeneity, the endogeneity of marketing communication, and selection effects.
Retention
The probability of retention is modeled with a binomial Probit model. Each customer i
decides at the end of every month t after acquisition whether to retain the service (rit = 1) or
disadopt (rit = 0). We write the utility vit of retaining the service as follows:
(1) vit = 0i + 1iTriali + 2iUsageFRit + 3iUsagePPUit + 4iDMit + 5iAdvit +
6iUsageFRit×Triali + 7iUsagePPUit×Triali + 8iDMit×Triali + 9iAdvit×Triali +
10,iInitialit + 11,iFeeitsub + 12,iPenaltyit + 13,iTempit+ 14,i log(Timeit) + it
Thus, the utility of retaining the service at the end of month t is influenced by the dummy Triali
(1 if customer i was acquired with a free-trial; 0 otherwise). This allows us to test whether free-
trial acquisition increases a customer’s churn rate (H1). Other drivers include the customer’s
usage of the flat-rate (UsageFRit, measured in monthly channel zaps divided by 100) and pay-
per-use services (UsagePPUit, measured in number of VODs) in month t. Retention also depends
on the company’s monthly direct-marketing efforts (DMit, the number of direct-marketing

13
contacts received by customer i) and advertising intensity (Advit, the company’s share-of-voice
in customer i's region).4 Equation 1 also includes the interactions between Triali and the usage
and marketing-communication variables to test H2a,b and H3a,b, which posit that the impact of
usage and marketing communication is stronger for free-trial than for regular customers.
Finally, the equation includes a set of control variables. The model accounts for a general
pattern of high defection rates during the first four months of a customer’s tenure through the
dummy variable Initialit. The subscription fee for customer i in month t, Feeitsub, captures the
influence of price on a customer’s retention decision (Ascarza, Lambrecht, and Vilcassim 2012).
Variation in Feeitsub is due to temporary price reductions and the zero-price in the beginning of a
free-trial customer’s tenure. Moreover, we include the variable Penaltyit to account for the fact
that customers were able to cancel their 12-month subscription by paying an early-termination
fee. We assume that customers trade off the termination fee against future subscription fees
within the current contractual period. Hence, Penaltyit equals the termination fee for immediate
disadoption minus the sum of all future subscription fees that the customer would have to pay
during the remaining months of the contractual period. The higher Penaltyit, the more likely it is
that the customer retains the service.
Importantly, the variables Feeitsub and Penaltyit control for the systematically higher
defection rates of free-trial customers, compared to regular customers during the free-trial period.
In this period, free-trial customers face zero subscription and cancelation fees compared to
nonzero subscription and cancelation fees for regular customers. Hence these control variables
allow us to obtain a clean test of H1 via the trial dummy in Equation 1, which equals one for a
free-trial customer even after the free-trial period is over.
We include the monthly average temperature (Temperatureit) to control for seasonality,5
14
and the log of time-since-adoption (Timeit) to accommodate fluctuations in the baseline retention
probability (Prins, Verhoef, and Franses 2009). The model coefficients 0i, …, 14,i are
customer-specific and normally distributed. Finally, the Probit error term it is normally
distributed with a standard deviation set equal to 1 for identification purposes.
Usage of the Flat-Rate Service
We model flat-rate usage (UsageFRit) as a log-log regression to account for the skewed
nature of this variable (Iyengar et al. 2011):
(2) log(UsageFRit+1) = 0i + 1iTriali + 2ilog(UsageFRi,t-1+1) + 3ilog(Feeitsub+1) +
4ilog(Tempit) + 5ilog(Timeit) + it
The free-trial acquisition dummy Triali captures differences in flat-rate usage between free-trial
and regular customers. The lagged dependent variable UsageFRi,t-1 accounts for persistence in
usage behavior. We also include the control variables subscription fee, average temperature, and
time-since-adoption.6 Before taking the logarithm, we add 1 to all variables for which zeros
occur (e.g., Iyengar et al. 2011). 0i, …, 5i are normally distributed customer-specific
coefficients and it is an error term following a normal distribution, N(0, 2).
Usage of the Pay-per-Use Service
We model usage of the pay-per-use component, i.e., a consumer’s monthly number of
VODs, with a zero-inflated Poisson model, in which the zero inflation accommodates the spike
at zero in the VOD usage variable:
(3) UsagePPUit = UsagePPUit* ~ Poisson(λit) with probability qi
UsagePPUit = 0 with probability 1 qi
where qi is the probability that customer i is a potential user of the VOD service, modeled with a
Probit structure with customer-specific normally distributed intercept; UsagePPU*it is the number

15
of VODs watched by customer i in period t, given that the customer is a potential VOD user. The
expected number of VODs, λit, is specified as an exponential function to ensure a positive sign:
(4) λit = exp(γ0i + γ1iTriali + 2iUsagePPUi,t-1 + γ3iFeeitsub + γ4iTempit + γ5ilog(Timeit) +
γ6iCreditit).
Similar to the model for flat-rate usage, the expected number of videos watched is a function of
acquisition mode (Triali), a customer’s past usage (UsagePPUi,t-1), and the variables Feeitsub,
Tempit, and log(Timeit). Creditit is the VOD credit for customer i in month t (measured in €).
This VOD credit is granted by the company for a maximum period of four months to stimulate
service usage. γ0i, …, γ6i are normally distributed customer-specific coefficients.
Customer Heterogeneity
We include customer heterogeneity by modeling all response parameters (intercepts and
slope coefficients) as normally distributed across customers. To incorporate interdependence
between the different model components, we allow for correlations between the intercepts.7 The
expected values of the retention and usage intercepts α0i, 0i, and 0i are functions of the
concomitant customer characteristics age, household size, income (e.g., Rust and Verhoef 2005),
and time-to-adoption (Prins, Verhoef, and Franses 2009; Schweidel, Fader, and Bradlow 2008):
(5) (
E(α0i)
E(β0i)
E(γ0i)) = (
α0,0 + α0,1Agei + α0,2Hhsizei + α0,3Incomei + α0,4Adopttimeiβ0,0 + β0,1Agei + β0,2Hhsizei + β0,3Incomei + β0,4Adopttimeiγ0,0 + γ0,1Agei + γ0,2Hhsizei + γ0,3Incomei + γ0,4Adopttimei
)
where Agei, is the age of customer i (in years, shortly after service launch), Hhsizei, is the size of
customer i’s household (in number of persons), Incomei is the average income in the census
block to which customer i belongs (in €10,000), and Adopttimei is the time-to-adoption of
customer i (measured in months following the launch of the iTV service).

16
Correction for Endogeneity of Marketing Instruments
Endogeneity due to temporal correlation. The first type of endogeneity that we address
involves temporal correlation of DMit and Advit with the error term of the retention equation. For
example, the company may counteract expected increases in the churn rate by boosting its
marketing efforts. Following Park and Gupta (2012) and Schweidel and Knox (2013), we use
Gaussian copulas to model the correlation between marketing and the error term. While classical
methods to correct for endogeneity rely on instrumental variables (IVs) to partial out the
exogenous variation in the endogenous regressors, copulas do not require IVs (Park and Gupta
2012; Schweidel and Knox 2013). In line with Park and Gupta (2012, p. 573), we add the
following regressors to Equation 1:
(6) DMit = Φ−1(HDM(DMit)) and
Advit = Φ−1(HAdv(Advit)),
where -1 is the inverse of the normal cumulative distribution function and HDM(·) and HAdv(·)
represent the empirical cumulative distribution functions of direct marketing and advertising,
respectively.8 For identification purposes, the endogenous regressors must be non-normally
distributed (Park and Gupta 2012), which a Shapiro-Wilk test shows to be the case (direct
marketing: W = .8255, p < .001; advertising: W = .7948, p < .001).
Endogeneity due to cross-sectional correlation. Second, endogeneity may arise from
cross-sectional correlation of the marketing activities with the random intercept. Specifically, the
company may target its direct-marketing efforts on the basis of consumer characteristics
(unobserved to the researcher) that correlate with customers’ churn rates. To address this type of
endogeneity, we follow Mundlak (1978) and include the average number of direct-marketing
contacts per customer, DMi, as a covariate in Equation 1 (e.g., Risselada, Verhoef, and Bijmolt
17
2014). Because the focal firm uses advertising as a mass-communication device, Advit is not
subject to this type of endogeneity. In the estimation, we assess the added value of the Mundlak
correction for cross-sectional endogeneity, on top of the correction for temporal endogeneity.9
Correction for Selection
Selection model. We use two alternative approaches to correct for selection effects: a
selection model and matching. The selection model approach estimates the retention and usage
models jointly with an additional model for consumers’ selection into the free-trial or regular
customer group. By allowing for correlation between the error of the selection equation and the
random intercepts of the usage and retention models, we account for selection effects due to
unobserved variables (Thomas 2001). Since the selection is a single event (sign up as a free-trial
or regular customer), we need to allow for correlations with the random intercepts in retention
and usage rather than with the time-varying error terms. To model whether a customer was
acquired with a free-trial (Triali = 1) or not (Triali = 0), we use a binary probit structure and write
the underlying utility of free-trial acquisition as follows:
(7) wi = ω0 + ω1Agei + ω2Hhsizei + ω3Incomei + ω4Adopttimei + ω5DMi* + ω6Advi
* +
ω7Feei* + ζi
The drivers include age, household size, income, time-to-adoption, and three marketing
variables. DMi* represents the average number of direct-marketing contacts received by customer
i in the three months before signing up. Because the free trial was often promoted in direct-
marketing contacts (e.g., in outbound telephone calls), DMi* likely has a positive impact on
consumers’ awareness of the trial offer. Advi* is the average share-of-voice for customer i in the
three months before signing up. Because advertising usually promoted the regular offer, we
expect Advi* to decrease the probability that a customer was acquired through a free trial. Feei
*

18
refers to the total fees for a regular 12-month subscription at the time of customer i’s signup.
Higher fees for the regular subscription may lead consumers to search longer for a special deal or
push harder when in touch with a customer service agent, such that Feei* should have a positive
effect on the probability of free-trial acquisition. Finally, ζi is a standard-normal error term.
Matching procedure. As an alternative to jointly estimating the selection, retention, and
usage models, we apply a matching procedure which pairs free-trial customers with the most
comparable regular customers. We estimate the models on this matched data set such that
differences in retention and usage behavior can be attributed to the acquisition mode rather than
to differences in sample composition (Gensler, Leeflang, and Skiera 2013; Gensler, Leeflang,
and Skiera 2012). To match subjects, we first estimate Equation 7 to compute customers’
propensities of adopting the service on a free trial. Following Gensler, Leeflang, and Skiera
(2013), we apply a hybrid procedure which combines subjects not only on the basis of their
propensity scores but also on the basis of drivers of the selection process, i.e., the variables DMi*,
Advi*, and Feei
*. Next, we compute the Mahalanobis distances among consumers on the basis of
their propensity scores and these three variables.10 Finally, we use the one-nearest neighbor
algorithm to identify 12,610 pairs of free-trial customers and their most comparable regular
customers (Gensler, Leeflang, and Skiera 2012).
EMPIRICAL RESULTS
We use simulated maximum likelihood with Halton draws to calibrate the usage and
retention models. Before discussing parameter estimates, we check model performance and the
robustness of the results across alternative approaches to tackling endogeneity and selection. We
then evaluate model fit for the selected approach in detail and discuss the estimation results.

19
Robustness Checks and Model Selection
We compare two ways to correct for marketing endogeneity – copula and Mundlak terms
versus a more parsimonious approach with just the copula terms – and two ways to address
selection effects – the selection model versus matching. We discuss model performance and the
robustness of the results across all four combinations. To assess model performance, we evaluate
the retention model’s in-sample fit and out-of-sample fit (cross-sectional and longitudinal) on
three fit measures: hit probability (Gilbride, Allenby, and Brazell 2006), top-decile lift, and Gini
coefficient (Lemmens and Croux 2006). While in- and out-of-sample fit are not suited to
compare models with and without endogeneity correction, they can be used to validate different
approaches that all correct for endogeneity (Ebbes, Papies, and Van Heerde 2011). Table 3
shows that model M1 based on matched samples and including both copula and Mundlak terms
outperforms the other models for seven out of nine fit criteria. Therefore, the rest of our
discussion focuses on model M1. Notice, however, that the four models yield very comparable
outcomes for the hypotheses tests, underlining the robustness of the results.
[PLEASE INSERT TABLES 3-5 ABOUT HERE]
Estimation Results
Table 4 reports in-sample and out-of-sample fit measures for the selected model M1 in
more detail. In addition to the measures for the retention model, we use the correlation between
actual and predicted values as a fit measure for usage of the flat-rate and pay-per-use services.
Overall, the different measures suggest a good in- and out-of-sample model fit, for both free-trial
and regular customers. The fit of the auxiliary propensity model (Equation 7) is adequate (hit
probability: 66.71%) and the parameter estimates, reported in Web Appendix B, are face-valid.
Table 5 presents the parameter estimates for the focal models. For the heterogeneous

20
parameters, we focus on the population means. We first discuss the relationships of the
conceptual framework and then address the effects of the control variables. Hypothesis tests are
one-sided while the remaining tests are two-sided.
Core decision process. The results confirm the expectations for the core retention
decision process. Retention is positively affected by flat-rate usage and usage of the pay-per-use
service (2 = .728, p < .001 and 3 = .039, p < .001, respectively). Usage drives retention
because to the consumer it is an indication of the personal value of the service (e.g., Lemon,
White, and Winer 2002). The impact of both direct marketing (4 = 1.565, p < .001) and
advertising (5 = .310, p < .001) on retention is positive, which is consistent with earlier findings
that marketing communication creates interest in the service and increases retention (e.g., Polo,
Sese, and Verhoef 2011). The significant coefficients of the copula and Mundlak terms suggest
that correcting for marketing endogeneity is indeed required (α15 = –.596, p < .001; α16 = –.017,
p < .001, α17 = –2.111, p < .001).
Differences between free-trial and regular customers. In support of H1, acquisition via
free trials has a direct negative impact on retention (1 = –.278, p < .001), even after controlling
for higher churn during the free-trial period.11 This is in line with the expectation that free-trial
customers are less confident about retaining the service, because they are in a tentative
relationship with the firm and are likely to attribute their subscription to extrinsic incentives (i.e.,
the trial), resulting in lower commitment (Dwyer, Schurr, and Oh 1987).
The positive interaction between the free-trial dummy and usage variables indicates that
the usage effects are stronger for free-trial than for regular customers, which confirms H2a and
H2b (6 = .040, p < .001 for the flat-rate service and 7 = .013, p < .001 for the pay-per-use
service). This is in line with the notion that free-trial customers, because of their lower
21
commitment, are more uncertain about the service’s benefits and therefore rely more on their
usage behavior when making retention decisions (Bolton and Lemon 1999).
In support of H3a and H3b, free-trial customers are more responsive to marketing
communication instruments than regular customers (8 = .133, p < .001 for direct marketing and
9 = .154, p < .001 for advertising). Similar to usage, advertising and direct marketing provide
free-trial customers with cues that make them more secure about the service’s value and assist
them in their retention decision (Mitchell and Olson 1981).12
Free-trial customers use the flat-rate service less intensively than regular customers
(1 = –.269, p < .001). This is in line with the notion that free-trial customers are less committed
to the service’s benefits. Interestingly, however, they use the pay-per-use service more
intensively than regular customers (1 = .113, p < .001). Because free-trial customers make less
use of the flat-rate service, they may dedicate more time to exploring the paid add-on service
(Schary 1971). In addition, they may perceive the free trial as a windfall gain, enticing them to
spend more on the pay-per-use service (e.g., Heilman, Nakamoto, and Rao 2002).
Figure 2 shows plots of the average predicted and observed values for retention (Panel a),
flat-rate usage (Panel b), and usage of the pay-per-use service (Panel c). The plots show that the
model fits the retention and usage data well for both free-trial and regular customers. In Panel a,
the predicted retention rates after the trial look very similar for free-trial and regular customers.
However, the model unveils that these predicted retention rates are obtained in a very different
way for these two customer groups. For free-trial customers, the baseline retention rate is lower,
because the main effect of Triali on retention utility is α1 = –.278. However, this lower baseline
rate is compensated by free-trial customers’ stronger marketing responsiveness (see Table 5) and
by the higher levels of direct marketing they received (see Table 2).

22
[PLEASE INSERT FIGURE 2 ABOUT HERE]
Control variables. The control variables have significant and face-valid effects. TV usage
drops in warmer months for obvious reasons, and the VOD credit increases usage of the VOD
service. In addition, we find positive carry-over effects for both usage components (e.g., Bolton
and Lemon 1999).13 Higher subscription fees reduce a customer’s probability to retain and use
the service (e.g., higher fees reduce customers’ budget and, as a result, decrease their paid VOD
consumption). The concomitant consumer characteristics also play a significant role. For
example, all else equal, larger families are likely to use the service more intensively (both the
flat-rate and pay-per-use component). Finally, the table in Web Appendix C indicates that there
are significant correlations between the random intercepts of the retention and usage equations.
IMPLICATIONS FOR CUSTOMER LIFETIME VALUE AND CUSTOMER EQUITY
To examine how the estimated effects influence CLV, we compare the CLV of free-trial
and regular customers, and compute the elasticities of CLV with respect to changes in marketing
communication efforts and customers’ usage intensities. Throughout the calculations, we use
customer-specific posterior parameter distributions (Train 2009).
For maximum comparability between free-trial and regular customers, we use the same
global means for the marketing variables. Furthermore, to avoid comparing the behavior of
(relatively tentative) free-trial customers in their first three months with (relatively confident)
regular customers, we only analyze those customers who survived the first three months,
retaining 8,624 free-trial customers and 3,145 regular customers. On top of that, in the
simulations, we shock marketing or usage in the first month after the trial period (i.e., in month
4 of a customer’s tenure). We now explain how we derive CLV from customers’ retention and
usage behavior.

23
Calculating Net CLV
We simulate customers’ usage and retention behavior over a three-year time horizon.
Previous research on other high-tech products and services uses the same simulation horizon,
arguing that most of a customer’s value is typically captured during these first three years
(Kumar et al. 2008; Rust, Kumar, and Venkatesan 2011). We compute Net CLV as the total
revenue stemming from a customer’s consecutive retention and usage decisions minus the costs
to acquire and retain that customer. For a given month, revenue consists of the fixed subscription
fee and the pay-per-use fees for watching VODs (corrected for content costs) if the customer
retains the iTV service, or the early-termination fee if the customer disadopts. On the cost side,
we distinguish between direct-marketing and advertising expenditures to acquire and retain the
customer. Other costs are not directly related to the number of customers or their usage intensity
(e.g., the network infrastructure is owned by the company), and can thus be ignored in the
computation of Net CLV. To compute the present value of future cash flows, we use an annual
discount rate of 8.5%, which is common in this industry (e.g., Cusick et al. 2014).14 Web
Appendix D provides the equations for the Net CLV calculations.
Survival times. As a first step towards calculating Net CLV, we investigate customers’
expected survival times during the three-year simulation period. Figure 3 shows that free-trial
customers churn much earlier than regular customers. The survival times are also characterized
by considerable consumer heterogeneity, especially for free-trial customers. Thus, we can expect
substantial differences in Net CLV between but also within the two customer groups.
[PLEASE INSERT FIGURES 3-6 ABOUT HERE]
Net CLV for free-trial and regular customers. The Net CLV results are shown in Figure
4. Panel a presents average revenues, costs, and the resulting CLV for both groups. The major
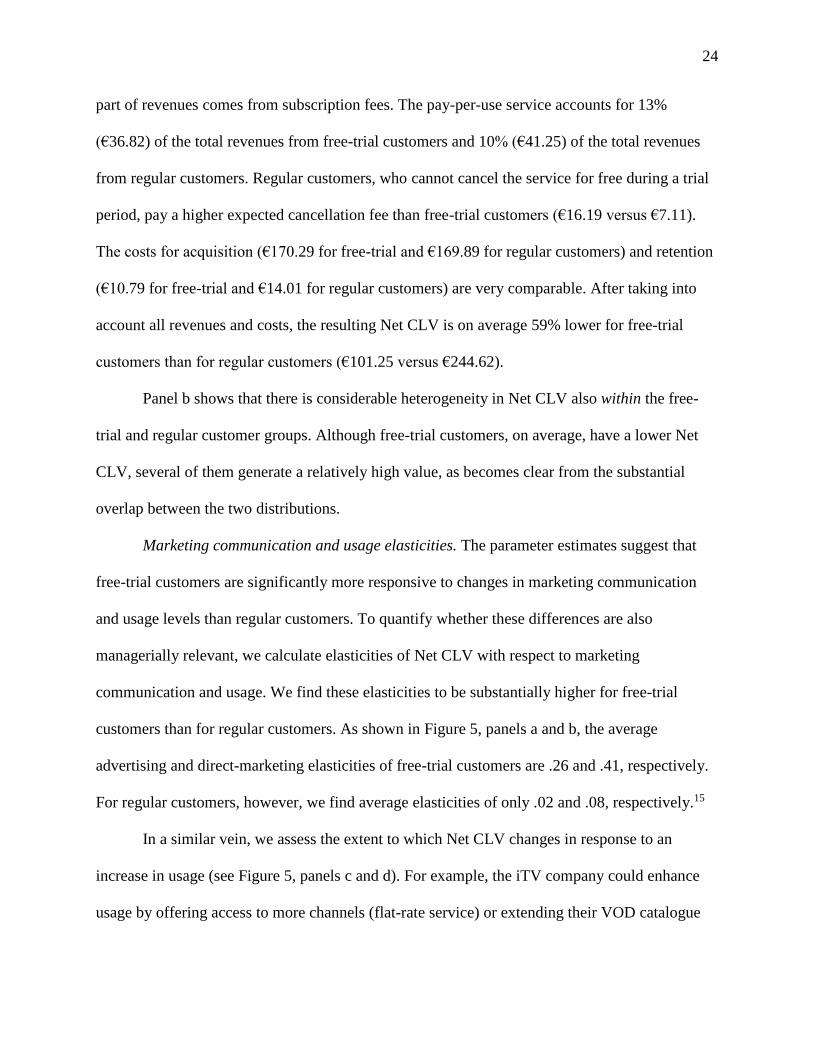
24
part of revenues comes from subscription fees. The pay-per-use service accounts for 13%
(€36.82) of the total revenues from free-trial customers and 10% (€41.25) of the total revenues
from regular customers. Regular customers, who cannot cancel the service for free during a trial
period, pay a higher expected cancellation fee than free-trial customers (€16.19 versus €7.11).
The costs for acquisition (€170.29 for free-trial and €169.89 for regular customers) and retention
(€10.79 for free-trial and €14.01 for regular customers) are very comparable. After taking into
account all revenues and costs, the resulting Net CLV is on average 59% lower for free-trial
customers than for regular customers (€101.25 versus €244.62).
Panel b shows that there is considerable heterogeneity in Net CLV also within the free-
trial and regular customer groups. Although free-trial customers, on average, have a lower Net
CLV, several of them generate a relatively high value, as becomes clear from the substantial
overlap between the two distributions.
Marketing communication and usage elasticities. The parameter estimates suggest that
free-trial customers are significantly more responsive to changes in marketing communication
and usage levels than regular customers. To quantify whether these differences are also
managerially relevant, we calculate elasticities of Net CLV with respect to marketing
communication and usage. We find these elasticities to be substantially higher for free-trial
customers than for regular customers. As shown in Figure 5, panels a and b, the average
advertising and direct-marketing elasticities of free-trial customers are .26 and .41, respectively.
For regular customers, however, we find average elasticities of only .02 and .08, respectively.15
In a similar vein, we assess the extent to which Net CLV changes in response to an
increase in usage (see Figure 5, panels c and d). For example, the iTV company could enhance
usage by offering access to more channels (flat-rate service) or extending their VOD catalogue
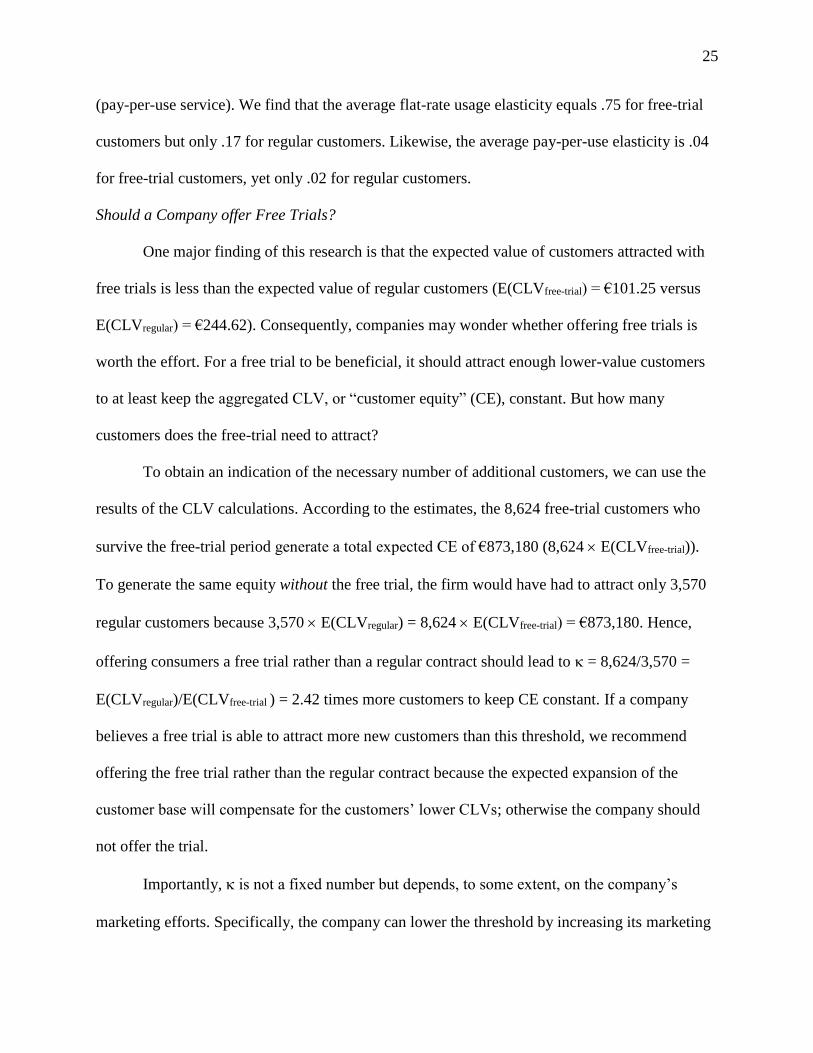
25
(pay-per-use service). We find that the average flat-rate usage elasticity equals .75 for free-trial
customers but only .17 for regular customers. Likewise, the average pay-per-use elasticity is .04
for free-trial customers, yet only .02 for regular customers.
Should a Company offer Free Trials?
One major finding of this research is that the expected value of customers attracted with
free trials is less than the expected value of regular customers (E(CLVfree-trial) = €101.25 versus
E(CLVregular) = €244.62). Consequently, companies may wonder whether offering free trials is
worth the effort. For a free trial to be beneficial, it should attract enough lower-value customers
to at least keep the aggregated CLV, or “customer equity” (CE), constant. But how many
customers does the free-trial need to attract?
To obtain an indication of the necessary number of additional customers, we can use the
results of the CLV calculations. According to the estimates, the 8,624 free-trial customers who
survive the free-trial period generate a total expected CE of €873,180 (8,624 E(CLVfree-trial)).
To generate the same equity without the free trial, the firm would have had to attract only 3,570
regular customers because 3,570 E(CLVregular) = 8,624 E(CLVfree-trial) = €873,180. Hence,
offering consumers a free trial rather than a regular contract should lead to = 8,624/3,570 =
E(CLVregular)/E(CLVfree-trial ) = 2.42 times more customers to keep CE constant. If a company
believes a free trial is able to attract more new customers than this threshold, we recommend
offering the free trial rather than the regular contract because the expected expansion of the
customer base will compensate for the customers’ lower CLVs; otherwise the company should
not offer the trial.
Importantly, is not a fixed number but depends, to some extent, on the company’s
marketing efforts. Specifically, the company can lower the threshold by increasing its marketing
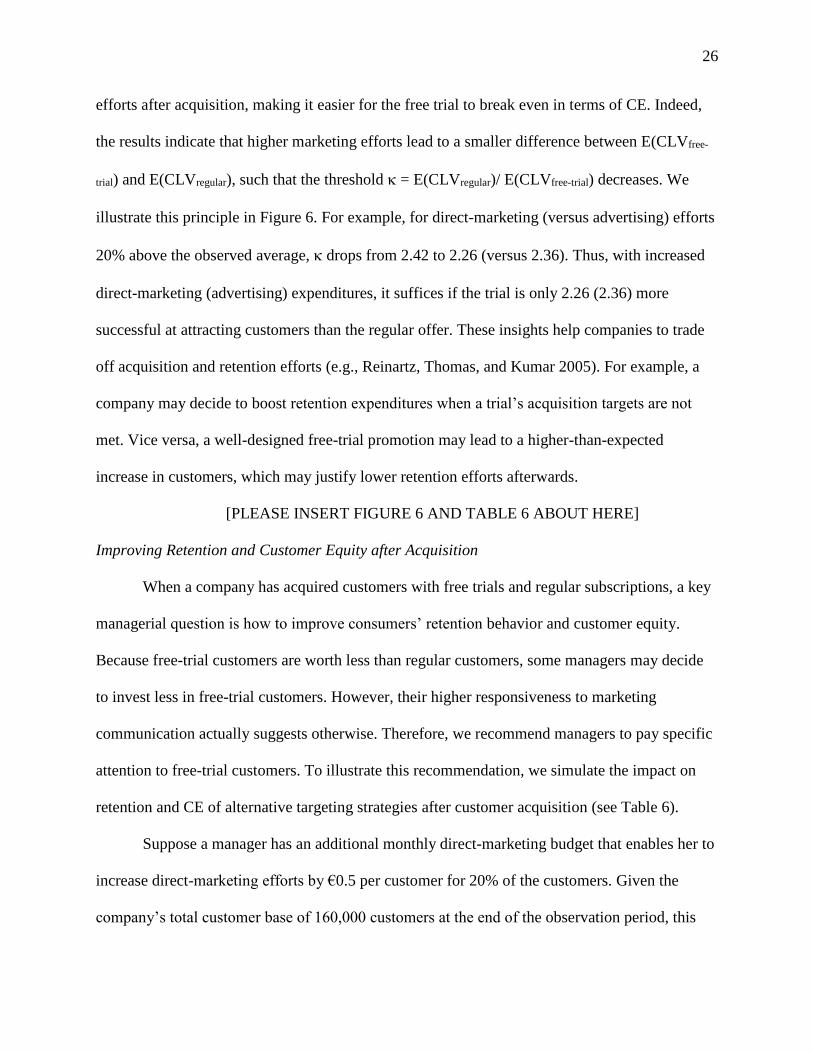
26
efforts after acquisition, making it easier for the free trial to break even in terms of CE. Indeed,
the results indicate that higher marketing efforts lead to a smaller difference between E(CLVfree-
trial) and E(CLVregular), such that the threshold = E(CLVregular)/ E(CLVfree-trial) decreases. We
illustrate this principle in Figure 6. For example, for direct-marketing (versus advertising) efforts
20% above the observed average, drops from 2.42 to 2.26 (versus 2.36). Thus, with increased
direct-marketing (advertising) expenditures, it suffices if the trial is only 2.26 (2.36) more
successful at attracting customers than the regular offer. These insights help companies to trade
off acquisition and retention efforts (e.g., Reinartz, Thomas, and Kumar 2005). For example, a
company may decide to boost retention expenditures when a trial’s acquisition targets are not
met. Vice versa, a well-designed free-trial promotion may lead to a higher-than-expected
increase in customers, which may justify lower retention efforts afterwards.
[PLEASE INSERT FIGURE 6 AND TABLE 6 ABOUT HERE]
Improving Retention and Customer Equity after Acquisition
When a company has acquired customers with free trials and regular subscriptions, a key
managerial question is how to improve consumers’ retention behavior and customer equity.
Because free-trial customers are worth less than regular customers, some managers may decide
to invest less in free-trial customers. However, their higher responsiveness to marketing
communication actually suggests otherwise. Therefore, we recommend managers to pay specific
attention to free-trial customers. To illustrate this recommendation, we simulate the impact on
retention and CE of alternative targeting strategies after customer acquisition (see Table 6).
Suppose a manager has an additional monthly direct-marketing budget that enables her to
increase direct-marketing efforts by €0.5 per customer for 20% of the customers. Given the
company’s total customer base of 160,000 customers at the end of the observation period, this
27
corresponds to a substantial marketing investment of about €576,000 (160,000 × 20% × €0.5 ×
36 months). The question then becomes how to select the 20% target customers. Using the
customers in the simulation data set, we consider different scenarios. In scenario 1, the manager
simply selects customers from the company’s database by chance, yielding an increase in
retention (158.0%) and Net CE (115.9%) for the 20% targeted customers. The impact across the
entire customer base is also substantial: 31.6% for retention, 23.0% for Net CE.
Alternatively, bearing in mind our finding that acquisition mode influences customers’
response to marketing communication, a manager could follow scenario 2 and target a random
subset of free-trial customers. Such a strategy would improve retention and Net CE of the
selected customers even more (186.7% for retention and 136.0% for Net CE). These returns
stand in sharp contrast to scenario 3 in which the manager invests only in a random selection of
regular customers, leading to an increase of 95.6% for retention and 75.6% for Net CE. Finally,
a manager could opt for scenario 4 in which individual-level response coefficients are used to
select customers with the highest responsiveness to direct-marketing. Such an optimal strategy
would improve retention and Net CLV by 181.4% and 132.9% for targeted customers, and
36.3% and 26.6% for all customers. Notice that targeting free-trial customers (scenario 2) leads
to results that come close to the optimal ones.
DISCUSSION
Recent research suggests that the way in which customers are acquired may have an
enduring impact on their behavior, even long after adoption (e.g., Villanueva, Yoo, and Hanssens
2008). While some studies have found differences between customers attracted with sales
promotions and regular customers (Anderson and Simester 2004; Lewis 2006), the challenge of
retaining customers acquired through free-trial promotions is not well understood. Crucial
28
questions have remained unanswered: How do free-trial customers differ from regular customers
in their retention rates, marketing responsiveness, and lifetime value? Should free-trial customers
be managed in a different way?
To answer these questions, we model a customer’s decisions to use and retain the service
– decisions that influence CLV – and examine how free-trial acquisition affects this decision
process. We explicitly account for selection effects (i.e., customers attracted with free trials may
differ intrinsically from other customers) and for the endogeneity of marketing communication.
The model is estimated on a unique panel data set, covering monthly usage (of flat-rate and
pay-per-use services) and retention decisions for 16,512 customers of an interactive digital TV
service provider. We then use the parameter estimates to simulate CLV and quantify its
sensitivity to changes in marketing communication and usage rates.
Throughout the analyses, we find strong evidence for systematic differences in behavior
between free-trial and regular customers. In line with buyer-seller relationship theory, which
suggests that free trials may slow down the relationship formation process, free-trial promotions
are associated with higher defection rates, even beyond the free-trial period. Similarly, flat-rate
usage – an important driver of customers’ retention decisions – turns out to be lower among free-
trial subscribers. Interestingly, however, free-trial customers have a higher pay-per-use
consumption rate. Apparently, they readily reallocate the time they gain (due to their lower flat-
rate consumption) and the money they save (due to the free trial) to the pay-per-use service.
These results add to the growing understanding of the role of usage in the value generation
process (e.g., Bolton and Lemon 1999; Iyengar et al. 2011).
Managerial Implications
Our study has a number of key managerial implications. Because of their higher churn
29
rate, free-trial customers are worth considerably less than regular customers. Specifically, we
find the Net CLV of free-trial customers to be 59% lower than that of regular customers.
Managers and business analysts may thus have to temper profit expectations if the customer base
includes a substantial share of free-trial subscribers. At the same time, we find free-trial
customers to be more “malleable” than regular customers. Because they have a less-developed
relationship with the firm, free-trial customers are more uncertain about the service benefits. As a
result, they rely more on marketing communication and their own usage behavior when deciding
whether or not to retain the service. We find that, compared to regular customers, the Net CLV
of free-trial customers is much more responsive to direct marketing, advertising, flat-rate usage,
and pay-per-use usage.
Therefore, companies should target direct marketing and advertising more to free-trial
than to regular customers. In these marketing communications, it is advised to remind free-trial
customers about their usage rates, especially when they are high, to make these customers even
more likely to retain the service. For example, mobile phone providers could use direct
marketing to communicate for how many minutes the customer has used the flat-rate service in
the past period, cementing the relevance of the service. Companies could also try to enhance the
actual usage of the service. For example, in the context of digital TV, firms could enhance usage
opportunities by offering recorded TV shows or providing apps to watch TV on mobile devices.
Other service providers can estimate our retention and usage models to calculate the
expected CLV for every customer, acquired by a free trial or not. They can then focus their
marketing efforts on those customers with the highest expected return on marketing investment.
If the estimation of the models is not feasible, our results suggest managers can rely on usage
intensity as an indicator of customer value and a criterion for marketing allocation decisions.

30
This allows managers to distinguish between (likely) high- and low-value customers, especially
within the free-trial group, because this group is most responsive to usage levels.
Our analysis also offers insights on the factors playing a role when considering the launch
of a free-trial campaign. We show how the company can obtain an indication of the free trial’s
required expansion effect on the customer base to compensate for free-trialists’ lower lifetime
value and make the free-trial campaign worthwhile. Specifically, relative to a situation with only
the regular offer, the number of adopters should increase by a factor that can be calculated as the
expected CLV of regular customers divided by the expected CLV of free-trial customers. If the
company expects the free trial to attract more customers than this factor prescribes, the trial offer
may be a viable strategy. Importantly, the company can lower this break-even factor through
targeted retention efforts after acquisition.
Future Research
Our work is the first to investigate the effects of free-trial acquisition on customer
behavior and CLV, and therefore leaves several opportunities for further research. First, because
this study is based on observational data, we need to control for selection effects – a challenge
intrinsic to many studies examining the behavior of distinct customer groups (e.g., Gensler,
Leeflang, and Skiera 2012). Alternatively, researchers may use controlled field experiments. One
setting particularly suited for field experiments are online services, where individual consumers
can be randomly assigned to different offers, and where the likelihood of consumers becoming
aware of alternative offers is limited. At the same time, such an approach would still not
guarantee full comparability of free-trial and regular customers because the researcher cannot
force consumers to accept an offer.
Second, controlled experiments would also allow for the uncovering of the underlying

31
psychological processes that are likely to play a role. One interesting observation worthy of
further attention is that free-trial customers are more heterogeneous than regular customers, for
example in terms of CLV and responsiveness to marketing and usage. We speculate that the
segment of free-trial customers includes not only people who are truly doubtful about their
commitment, but also opportunistic consumers who would have adopted the service anyhow and
just subscribe to the trial to enjoy the free months. Future research can further investigate the
heterogeneity in the motivations of free-trial and regular consumers.
Third, future work could replicate this research in other contexts. Many Internet
companies currently operate under a freemium model, in which customers can choose between a
“free service” and a “premium service” which comes at a fee but provides enhanced functionality
(Pauwels and Weiss 2008). For example, the on-demand streaming service Spotify offers
temporary one-month free trials for their premium service, next to its (permanent) free service.
Fourth, future research may give a more complete account of the profitability
implications of free-trial and regular acquisition. For example, for a news site, usage may be a
source of advertising revenues (e.g., the number of page views may determine advertising
income). Furthermore, it may be worthwhile to also include other value-creating behaviors
(Verhoef, Reinartz, and Krafft 2010). Notably, one could examine whether free-trial and regular
customers differ in the extent to which they engage in word-of-mouth communication.
In summary, we uncover the implications of free-trial acquisition for customer retention
and CLV. We show how service usage and marketing activities drive consumers’ retention
decisions and CLV, and how free-trial acquisition moderates these relationships. Our findings
offer managers new insights on how to retain customers acquired through free trials.
32
REFERENCES
Anderson, Eric. T. and Duncan I. Simester (2004), “Long-Run Effects of Promotion Depth on
New Versus Established Customers: Three Field Studies,” Marketing Science, 23 (1), 4-
20.
Ascarza, Eva, Anja Lambrecht and Naufel Vilcassim (2012), “When Talk Is “Free”: The Effect
of Tariff Structure on Usage Under Two- and Three-Part Tariffs,” Journal of Marketing
Research, 49 (6), 882-99.
Bawa, Kapil and Robert Shoemaker (2004), “The Effects of Free Sample Promotions on
Incremental Brand Sales,” Marketing Science, 23 (3), 345-63.
Blattberg, Robert C., Edward C. Malthouse and Scott A. Neslin (2009), “Customer Lifetime
Value: Empirical Generalizations and Some Conceptual Questions,” Journal of
Interactive Marketing, 23 (2), 157-68.
Bolton, Ruth N. and Katherine N. Lemon (1999), “A Dynamic Model of Customers’ Usage of
Services: Usage as an Antecedent and Consequence of Satisfaction,” Journal of
Marketing Research, 36 (2), 171-86.
Brucks, Merrie (1985), “The Effects of Product Class Knowledge on Information Search
Behavior,” Journal of Consumer Research, 12 (1), 1-16.
Chan, Tat Y., Chunhua Wu and Ying Xie (2011), “Measuring the Lifetime Value of Customers
Acquired from Google Search Advertising,” Marketing Science, 30 (5), 837-50.
Cusick, Philip, Richard Choe, Eric Pan, and Ava Zhang (2014), “DirecTV: Takeways from DTV
Management Meetings - US and Latam [J.P. Morgan Research],” Thomson ONE Banker
Analytics (accessed 30 September 2014), http://banker.thomsonib.com/
Dodson, Joe A., Alice M. Tybout and Brian Sternthal (1978), “Impact of Deals and Deal

33
Retraction on Brand Switching,” Journal of Marketing Research, 15 (1), 72-81.
Dwyer, F. Robert, Paul H. Schurr and Sejo Oh (1987), “Developing Buyer-Seller Relationships,”
Journal of Marketing, 51 (2), 11-27.
Ebbes, Peter, Dominik Papies and Harald J. Van Heerde (2011), “The Sense and Non-Sense of
Holdout Sample Validation in the Presence of Endogeneity,” Marketing Science, 30 (6),
1115-22.
Gedenk, Karen and Scott A. Neslin (1999), “The Role of Retail Promotion in Determining
Future Brand Loyalty: Its Effect on Purchase Event Feedback,” Journal of Retailing, 75
(4), 433-59.
Gensler, Sonja, Peter Leeflang and Bernd Skiera (2012), “Impact of Online Channel Use on
Customer Revenues and Costs to Serve: Considering Product Portfolios and Self-
Selection,” International Journal of Research in Marketing, 29 (2), 192-201.
_____ (2013), “Comparing Methods to Separate Treatment from Self-Selection Effects in an
Online Banking Setting,” Journal of Business Research, 66 (9), 1272-78.
Gilbert, Daniel T., Timothy D. Wilson, Elizabeth C. Pinel, Stephen J. Blumberg, and Thalia P.
Wheatley (1998), “Immune Neglect: A Source of Durability Bias in Affective
Forecasting,” Journal of Personality and Social Psychology, 75 (3), 617-38.
Gilbert, Daniel. T. and Jane E. J. Ebert (2002), “Decisions and Revisions: The Affective
Forecasting of Changeable Outcomes,” Journal of Personality and Social Psychology, 82
(4), 503-14.
Gilbride, Timothy J., Greg M. Allenby and Jeff D. Brazell (2006), “Models for Heterogeneous
Variable Selection,” Journal of Marketing Research, 43 (3), 420-30.
Heilman, Carrie M., Kent Nakamoto and Ambar G. Rao (2002), “Pleasant Surprises: Consumer

34
Response to Unexpected In-store Coupons,” Journal of Marketing Research, 39 (2), 242-
52.
Heiman, Amir, Bruce McWilliams, Zhihua Shen, and David Zilberman (2001), “Learning and
Forgetting: Modeling Optimal Product Sampling over Time,” Management Science, 47
(4), 532-46.
Hoch, Stephen J. and John Deighton (1989), “Managing What Consumers Learn from
Experience,” Journal of Marketing, 53 (2), 1-20.
Iyengar, Raghuram, Kamel Jedidi, Skander Essegaier, and Peter J. Danaher (2011), “The Impact
of Tariff Structure on Customer Retention, Usage, and Profitability of Access Services,”
Marketing Science, 30 (5), 820-36.
Jain, Dipak, Vijay Mahajan and Eitan Muller (1995), “An Approach for Determining Optimal
Product Sampling for the Diffusion of a New Product,” Journal of Product Innovation
Management, 12 (2), 124-35.
Johnson, Michael D. and Fred Selnes (2004), “Customer Portfolio Management: Toward a
Dynamic Theory of Exchange Relationships,” Journal of Marketing, 68 (2), 1-17.
Kumar, V., Rajkumar Venkatesan, Tim Bohling, and Denise Beckmann (2008), “Practice Prize
Report—The Power of CLV: Managing Customer Lifetime Value at IBM,” Marketing
Science, 27 (4), 585-99.
Lemmens, Aurélie and Christophe Croux (2006), “Bagging and Boosting Classification Trees to
Predict Churn,” Journal of Marketing Research, 43 (2), 276-86.
Lemon, Katherine N., Tiffany Barnett White and Russell S. Winer (2002), “Dynamic Customer
Relationship Management: Incorporating Future Considerations into the Service
Retention Decision,” Journal of Marketing, 66 (1), 1-14.
35
Lewis, Michael (2006), “Customer Acquisition Promotions and Customer Asset Value,” Journal
of Marketing Research, 43 (2), 195-203.
Luo, Xueming, Sascha Raithel and Michael A Wiles (2013), “The Impact of Brand Rating
Dispersion on Firm Value,” Journal of Marketing Research, 50 (3), 399-415.
Mitchell, Andrew A. and Jerry C. Olson (1981), “Are Product Attribute Beliefs the Only
Mediator of Advertising Effects on Brand Attitude?,” Journal of Marketing Research, 18
(3), 318-32.
Mundlak, Yair (1978), “On the Pooling of Time Series and Cross Section Data,” Econometrica,
46 (1), 69-85.
Palmatier, Robert W., Mark B. Houston, Rajiv P. Dant, and Dhruv Grewal (2013), “Relationship
Velocity: Toward a Theory of Relationship Dynamics,” Journal of Marketing, 77 (1), 13-
30.
Park, Sungho and Sachin Gupta (2012), “Handling Endogenous Regressors by Joint Estimation
Using Copulas,” Marketing Science, 31 (4), 567-86.
Pauwels, Koen and Allen Weiss (2008), “Moving from Free to Fee: How Online Firms Market
to Change Their Business Model Successfully,” Journal of Marketing, 72 (3), 14-31.
Polo, Yolanda, F. Javier Sese and Peter C. Verhoef (2011), “The Effect of Pricing and
Advertising on Customer Retention in a Liberalizing Market,” Journal of Interactive
Marketing, 25 (4), 201-14.
Prins, Remco, Peter C. Verhoef and Philip Hans Franses (2009), “The Impact of Adoption
Timing on New Service Usage and Early Disadoption,” International Journal of
Research in Marketing, 26 (4), 304-13.
Reinartz, Werner J., J. S. Thomas and V. Kumar (2005), “Balancing Acquisition and Retention
36
Resources to Maximize Customer Profitability,” Journal of Marketing, 69 (1), 63-79.
Risselada, Hans, Peter C. Verhoef and Tammo H.A. Bijmolt (2014), “Dynamic Effects of Social
Influence and Direct Marketing on the Adoption of High-Technology Products,” Journal
of Marketing, 78 (2), 52-68.
Rust, Roland T., V. Kumar and Rajkumar Venkatesan (2011), “Will the Frog Change into a
Prince? Predicting Future Customer Profitability,” International Journal of Research in
Marketing, 28 (4), 281-94.
Rust, Roland T. and Peter C. Verhoef (2005), “Optimizing the Marketing Interventions Mix in
Intermediate-Term CRM,” Marketing Science, 24 (3), 477-89.
Schary, Philip B. (1971), “Consumption and the Problem of Time,” Journal of Marketing, 35 (2),
50-55.
Schmitt, Philipp, Bernd Skiera and Christophe Van den Bulte (2011), “Referral Programs and
Customer Value,” Journal of Marketing, 75 (1), 46-59.
Schweidel, David A., Peter S. Fader and Eric T. Bradlow (2008), “Understanding Service
Retention Within and Across Cohorts Using Limited Information,” Journal of Marketing,
72 (1), 82-94.
Schweidel, David A. and George Knox (2013), “Incorporating Direct Marketing Activity into
Latent Attrition Models,” Marketing Science, 32 (3), 471-87.
Scott, Carol A. (1976), “The Effects of Trial and Incentives on Repeat Purchase Behavior,”
Journal of Marketing Research, 13 (3), 263-69.
Steffes, Erin M., B.P.S. Murthi and Ram C. Rao (2011), “Why are some Modes of Acquisition
more Profitable: A Study of the Credit Card Industry,” Journal of Financial Services
Marketing, 16 (2), 90-100.

37
Thomas, Jacquelyn S. (2001), “A Methodology for Linking Customer Acquisition to Customer
Retention,” Journal of Marketing Research, 38 (2), 262-68.
Train, Kenneth (2009), Discrete Choice Methods with Simulation: Cambridge University Press.
Van Doorn, Jenny, Katherine N. Lemon, Vikas Mittal, Stephan Nass, Doreen Pick, Peter Pirner,
and Peter C. Verhoef (2010), “Customer Engagement Behavior: Theoretical Foundations
and Research Directions,” Journal of Service Research, 13 (3), 253-66.
Verhoef, Peter C. and Bas Donkers (2005), “The Effect of Acquisition Channels on Customer
Loyalty and Cross-Buying,” Journal of Interactive Marketing, 19 (2), 31-43.
Verhoef, Peter C., Werner J. Reinartz and Manfred Krafft (2010), “Customer Engagement as a
New Perspective in Customer Management,” Journal of Service Research, 13 (3), 247-
52.
Villanueva, Julian, Shijin Yoo and Dominique M. Hanssens (2008), “The Impact of Marketing-
Induced Versus Word-of-Mouth Customer Acquisition on Customer Equity Growth,”
Journal of Marketing Research, 45 (1), 48-59.

38
FOOTNOTES
1 According to economic theory, the lower marginal consumption cost of a two-part (as opposed to pay-per-use) tariff
structure should lead to higher usage rates. Iyengar et al. (2011) explain their counterintuitive finding by pointing out that
partitioned prices draw consumer’s attention and make them more price-sensitive. 2 The remaining 29% is captured by smaller players, operating through satellite or via cable. 3 We measure a customer’s active use of the flat-rate service by using monthly zaps. We also have a partially observed
measure of a customer’s passive use. Specifically, for a period of just 6 months, we observe the variable hours, capturing
the monthly number of hours that the set-top box was switched on. However, this may not be an accurate indication of the
time that the customer actively watched TV. In fact, it was technically possible to switch off the TV while leaving the set-
top box switched on, making this variable less than ideal. For the months in which we have both zaps and hours, we find a
significant positive correlation of .66 (p < .01). 4 We also estimate a retention model with lagged effects of DM and Adv., leaving model fit virtually unaffected (Hit
probability = .0002, Top-decile lift = .0418, Gini = .0016). We thus opt for the more parsimonious model (1). 5 To account for differences in the length of each month and the occurrence of holidays, we also estimate retention and
usage models with monthly dummy variables. However, the results are very similar and model fit hardly changes (Hit
probability = .0004, Top-decile lift = .0748, Gini = .0009, Flat-rate = .0242, Pay-per-use = .0031). In addition, the
model becomes cumbersome to estimate with 66 seasonality parameters (11 heterogeneous month coefficients in three
equations). We therefore stick to the more parsimonious model (1). 6 We also estimate models in which we allow direct marketing and advertising to affect service usage but this does not
lead to a notable improvement in model performance (Flat-rate = .0020, Pay-per-use = .0137). 7 To check whether we should structurally account for any correlation between the slope coefficients, we inspect the
correlations between the consumer-specific posterior slopes (Train 2009) and find the mean absolute correlation to be very
small (.0084). Further, the low correlation between the residuals of the usage models (.0970) suggests that, after
controlling for cross-sectional correlation, there is not much interdependency between the error terms left. 8 Following Park and Gupta (2012, footnote 3 and expression 10), we use empirical instead of estimated densities to
generate DMit and Advit. To keep estimations tractable, we treat DM as a continuous variable and use regular standard
errors instead of bootstrapped ones (shown to be virtually the same, see Park and Gupta 2012). We test the retention model
on a simulated data set with endogenous regressors and recover the true parameters well. 9 In the models in which we correct for both temporal and cross-sectional correlation, we compute DMit using the mean-
centered direct-marketing variable: mean-centering ensures that we only retain that part of the original direct-marketing
variable that may be correlated with the error term it in Equation 1 (Mundlak 1978). 10 From the 12,612 free-trial customers in the data set, we eliminate two customers because their propensity scores do not
lie within the region of common support, a region defined as the overlap between the propensity score distributions of the
two customer groups (Gensler, Leeflang, and Skiera 2012). 11 Because free-trial customers may be particularly likely to churn in their first three months, we re-estimate the model
only with customers who “survived” the first three months. The results are robust to this alternative specification
(1 = .040, z = 3.390, p < .001). 12 We test whether the marketing response estimates are affected by the inclusion of customers who churn already during
the first months after acquisition. Leaving out these customers yields comparable results (8 = .046, z = 2.30, p < .05;
9 = .08, z = 5.11, p < .001, both one-tailed). 13 The carry-over coefficients for the two usage components are not directly comparable because we use a log-log
regression for flat-rate usage and a zero-inflated Poisson model for the pay-per-use service. Nonetheless, the relative
magnitude of the coefficients suggests that the flat-rate service is characterized by higher state-dependence than the pay-
per-use service. This is consistent with the idea that consumers get used to watching the same television shows or series
(flat-rate usage) but rather irregularly consume unrelated content from the VOD service (pay-per-use). 14 The relative results remain the same when we vary the simulation horizon or discount rate. 15 We compute customer-specific arc elasticities for a 1% increase in the focal variable in the first period after acquiring
the customer, and apply a 95% Winsorization on estimated Net CLV elasticities to make sure that the summary statistics
are not driven by outliers (Luo, Raithel, and Wiles 2013). Differences in elasticities between free-trial customers and
regular customers are higher than what perhaps could be expected on the basis of the estimated coefficients (e.g., .310 for
regular customers, and .310 + .154 for free-trial customers in the case of advertising). However, due to differences in the
Net CLV base levels between the two customers groups, the same absolute lift in Net CLV represents a much higher
percentage lift for a free-trial customer than for a regular customer.
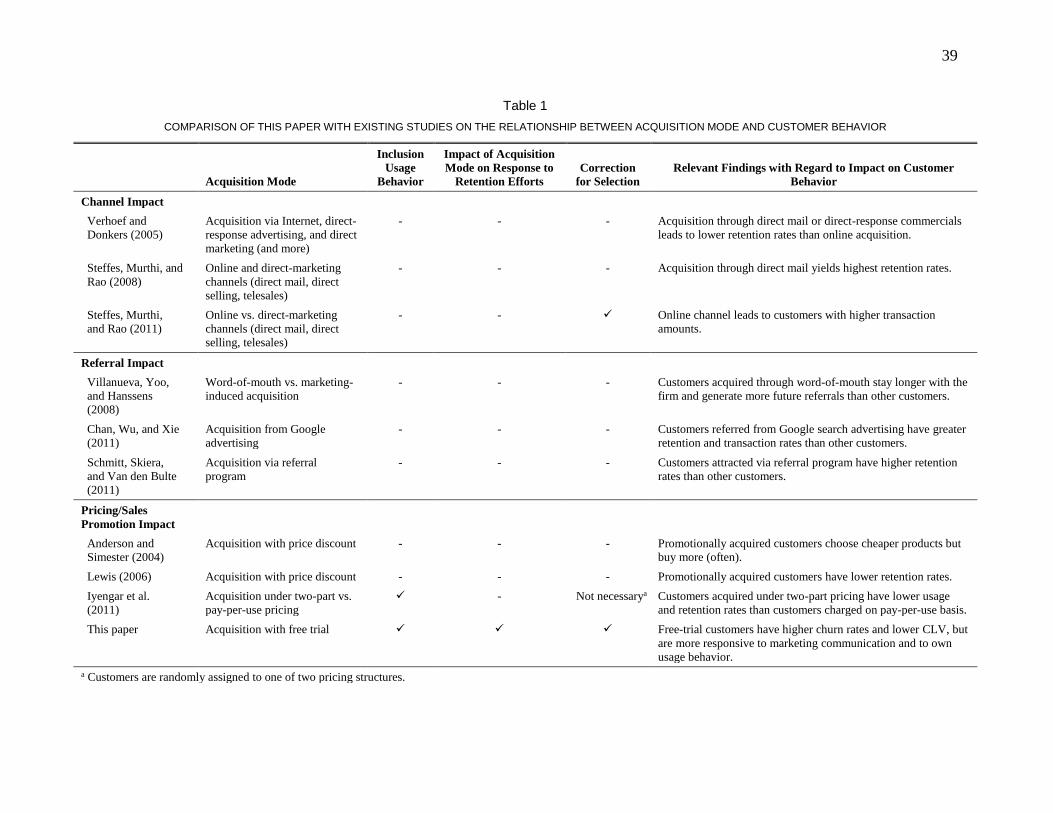
39
Table 1
COMPARISON OF THIS PAPER WITH EXISTING STUDIES ON THE RELATIONSHIP BETWEEN ACQUISITION MODE AND CUSTOMER BEHAVIOR
Acquisition Mode
Inclusion
Usage
Behavior
Impact of Acquisition
Mode on Response to
Retention Efforts
Correction
for Selection
Relevant Findings with Regard to Impact on Customer
Behavior
Channel Impact
Verhoef and
Donkers (2005)
Acquisition via Internet, direct-
response advertising, and direct
marketing (and more)
- - - Acquisition through direct mail or direct-response commercials
leads to lower retention rates than online acquisition.
Steffes, Murthi, and
Rao (2008)
Online and direct-marketing
channels (direct mail, direct
selling, telesales)
- - - Acquisition through direct mail yields highest retention rates.
Steffes, Murthi,
and Rao (2011)
Online vs. direct-marketing
channels (direct mail, direct
selling, telesales)
- - Online channel leads to customers with higher transaction
amounts.
Referral Impact
Villanueva, Yoo,
and Hanssens
(2008)
Word-of-mouth vs. marketing-
induced acquisition
- - - Customers acquired through word-of-mouth stay longer with the
firm and generate more future referrals than other customers.
Chan, Wu, and Xie
(2011)
Acquisition from Google
advertising
- - - Customers referred from Google search advertising have greater
retention and transaction rates than other customers.
Schmitt, Skiera,
and Van den Bulte
(2011)
Acquisition via referral
program
- - - Customers attracted via referral program have higher retention
rates than other customers.
Pricing/Sales
Promotion Impact
Anderson and
Simester (2004)
Acquisition with price discount - - - Promotionally acquired customers choose cheaper products but
buy more (often).
Lewis (2006) Acquisition with price discount - - - Promotionally acquired customers have lower retention rates.
Iyengar et al.
(2011)
Acquisition under two-part vs.
pay-per-use pricing
- Not necessarya Customers acquired under two-part pricing have lower usage
and retention rates than customers charged on pay-per-use basis.
This paper Acquisition with free trial Free-trial customers have higher churn rates and lower CLV, but
are more responsive to marketing communication and to own
usage behavior.
a Customers are randomly assigned to one of two pricing structures.

40
Table 2
DESCRIPTIVE STATISTICS FOR FREE-TRIAL AND REGULAR CUSTOMERS
Free-Trial Customers Regular customers
Mean (SD) Mean (SD)
Dependent variables
Retention probability .93 (.25) .96 (.19)
Usage of flat-rate service (channel zaps) 169.35 (176.90) 189.28 (183.80)
Usage of pay-per-use service (number of videos-on-demand) .73 (2.19) .58 (1.91)
Marketing communication
Direct marketing (number of direct-marketing contacts) .34 (.55) .16 (.41)
Advertising (share-of-voice) .74 (.28) .79 (.26)
Customer-specific variables
Age (years) 46.22 (12.64) 44.89 (12.60)
Household size 2.98 (1.48) 2.88 (1.53)
Annual income (in €10,000) 2.44 (.56) 2.43 (.59)
Time-to-adoption (in months following the launch of the service) 13.14 (2.45) 12.38 (2.20)
Control variables
Monthly subscription fee (in €) 9.66 (7.80) 13.22 (4.85)
Cancellation penalty (Termination Fees – Future Fees, in €) -59.80 (68.08) -8.14 (25.02)
VOD credit (in €) 5.50 (8.90) 1.38 (5.08)
Temperature (in °C) 12.82 (4.97) 12.83 (4.99)
Time-since-adoption (in months) 5.34 (3.52) 5.95 (3.68)
Direct-marketing contacts prior to acquisition .62 (.61) .26 (.48)
Advertising (share-of-voice) prior to acquisition .73 (.27) .76 (.27)
Total fees for regular 12-month contract at the time of acquisition (in €) 193.83 (50.04) 181.97 (44.79)
Number of customers 12,612 3,900
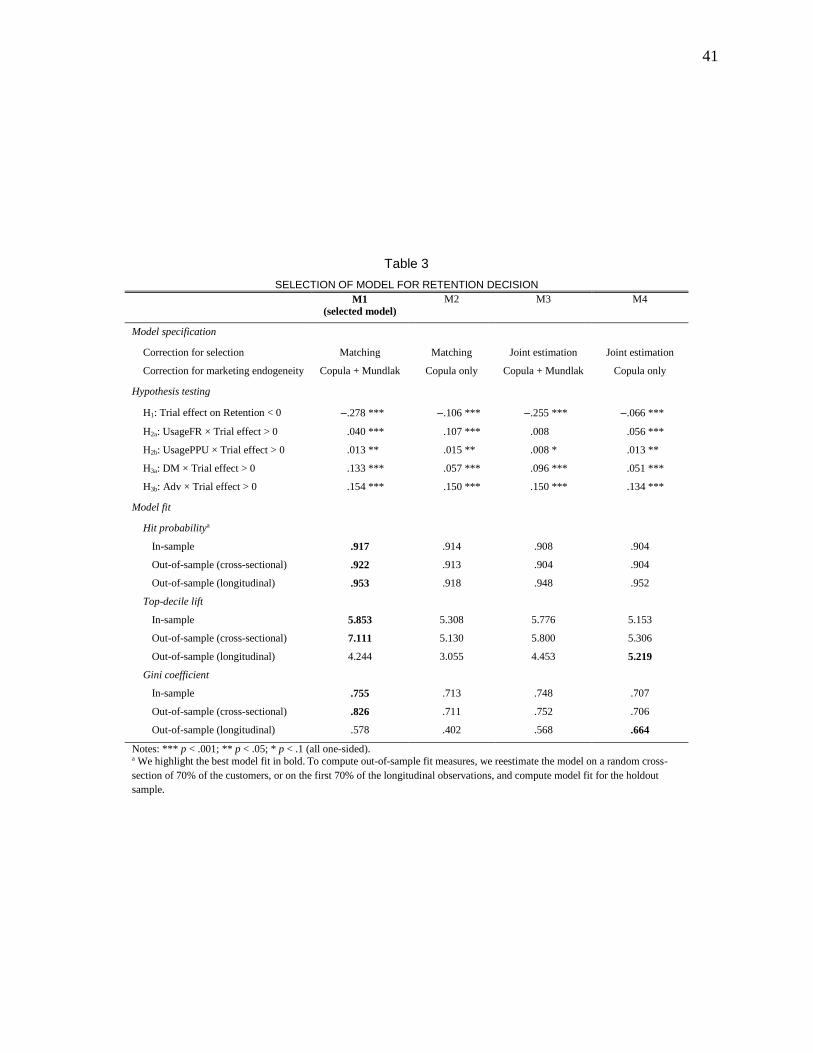
41
Table 3
SELECTION OF MODEL FOR RETENTION DECISION
M1
(selected model)
M2 M3 M4
Model specification
Correction for selection Matching Matching Joint estimation Joint estimation
Correction for marketing endogeneity Copula + Mundlak Copula only Copula + Mundlak Copula only
Hypothesis testing
H1: Trial effect on Retention < 0 .278 *** .106 *** .255 *** .066 ***
H2a: UsageFR × Trial effect > 0 .040 *** .107 *** .008 .056 ***
H2b: UsagePPU × Trial effect > 0 .013 ** .015 ** .008 * .013 **
H3a: DM × Trial effect > 0 .133 *** .057 *** .096 *** .051 ***
H3b: Adv × Trial effect > 0 .154 *** .150 *** .150 *** .134 ***
Model fit
Hit probabilitya
In-sample .917 .914 .908 .904
Out-of-sample (cross-sectional) .922 .913 .904 .904
Out-of-sample (longitudinal) .953 .918 .948 .952
Top-decile lift
In-sample 5.853 5.308 5.776 5.153
Out-of-sample (cross-sectional) 7.111 5.130 5.800 5.306
Out-of-sample (longitudinal) 4.244 3.055 4.453 5.219
Gini coefficient
In-sample .755 .713 .748 .707
Out-of-sample (cross-sectional) .826 .711 .752 .706
Out-of-sample (longitudinal) .578 .402 .568 .664
Notes: *** p < .001; ** p < .05; * p < .1 (all one-sided). a We highlight the best model fit in bold. To compute out-of-sample fit measures, we reestimate the model on a random cross-
section of 70% of the customers, or on the first 70% of the longitudinal observations, and compute model fit for the holdout
sample.

42
Table 4
MODEL FIT FOR SELECTED MODEL (M1)
Retention Flat-rate usage Pay-per-use
Hit probability Top-decile lift Gini
coefficient
Correlation between
actual and predicted
Correlation between
actual and predicted
In-sample fit
Free-trial customers .899 5.696 0.750 .811 .750
Regular customers .932 5.634 0.750 .815 .740
Out-of-sample fit (cross-sectional)a
Free-trial customers .906 6.946 0.821 .809 .724
Regular customers .936 7.052 0.819 .815 .727
Out-of-sample fit (longitudinal)b
Free-trial customers .948 4.526 0.599 .751 .673
Regular customers .958 3.785 0.545 .778 .593
a We reestimate the model on a random draw of 70% of the customers and compute model fit for the holdout sample. b We reestimate the model on the first 70% of the longitudinal observations, and predict usage and retention for the holdout sample.

43
Table 5
ESTIMATION RESULTSa
Population Mean
Standard Deviation
Estimate (SE)
Estimate (SE)
Retention
Intercept 3.034 (.006) .025 (.018)
Age .002 (.000)
Household size .037 (.002)
Income .059 (.002)
Time-to-adoption .002 (.000)
Trial H1: effect < 0 .278 (.008) .016 (.021)
Flat-rate usage .728 (.006) .333 (.006)
× Trial H2a: effect > 0 .040 (.009) .159 (.015) Pay-per-use usage .039 (.004) .015 (.005)
× Trial H2b: effect > 0 .013 (.005) .010 (.007)
Direct marketing 1.565 (.012) .190 (.034) × Trial H3a: effect > 0 .133 (.014) .086 (.043)
Advertising .310 (.008) .000 (.027)
× Trial H3b: effect > 0 .154 (.011) .080 (.033)
Copula correction term for DM .596 (.005)
Copula correction term for Adv .017 (.002)
Mundlak correction term for DM 2.111 (.014)
Control variables
Initial period 1.377 (.007) .040 (.016)
Monthly subscription fee .008 (.000) .001 (.001)
Cancellation penalty .003 (.000) .000 (.000)
Temperature .012 (.000) .000 (.001)
log(Time-since-adoption) .572 (.004) .022 (.014)
Flat-rate usage (log zaps)
Intercept 5.609 (.006) .881 (.005) Age .000 (.000)
Household size .036 (.002)
Income .034 (.002)
Time-to-adoption .048 (.000)
Trial .269 (.008) .081 (.014)
Control variables
log(Monthly subscription fee) .033 (.002) .004 (.004)
log(Temperature) .417 (.002) .016 (.004)
log(Time-since-adoption) .319 (.003) .340 (.004)
lagged log(Flat-rate usage) .242 (.001) .005 (.002)
log(sigma) .007 (.002)
Pay-per-use (VODs)
Intercept (incidence) -.140 (.006) 1.410 (.004)
Intercept (amount) .243 (.007) 1.245 (.018)
Age .014 (.000)
Household size .090 (.002)
Income .042 (.003)
Time-to-adoption .018 (.001)
Trial .113 (.010) .016 (.015)
Control variables
Monthly subscription fee .006 (.000) .001 (.000)
VOD credit .005 (.001) .008 (.001)
Temperature .005 (.000) .015 (.001)
log(Time-since-adoption) .053 (.003) .156 (.004)
lagged Pay-per-use .023 (.000) .008 (.000)
Log-likelihood: 310,958; N: 196,251; BIC: 622,892; AIC: 622,077. a Numbers in bold are significant at the p < .05 level (two-sided).
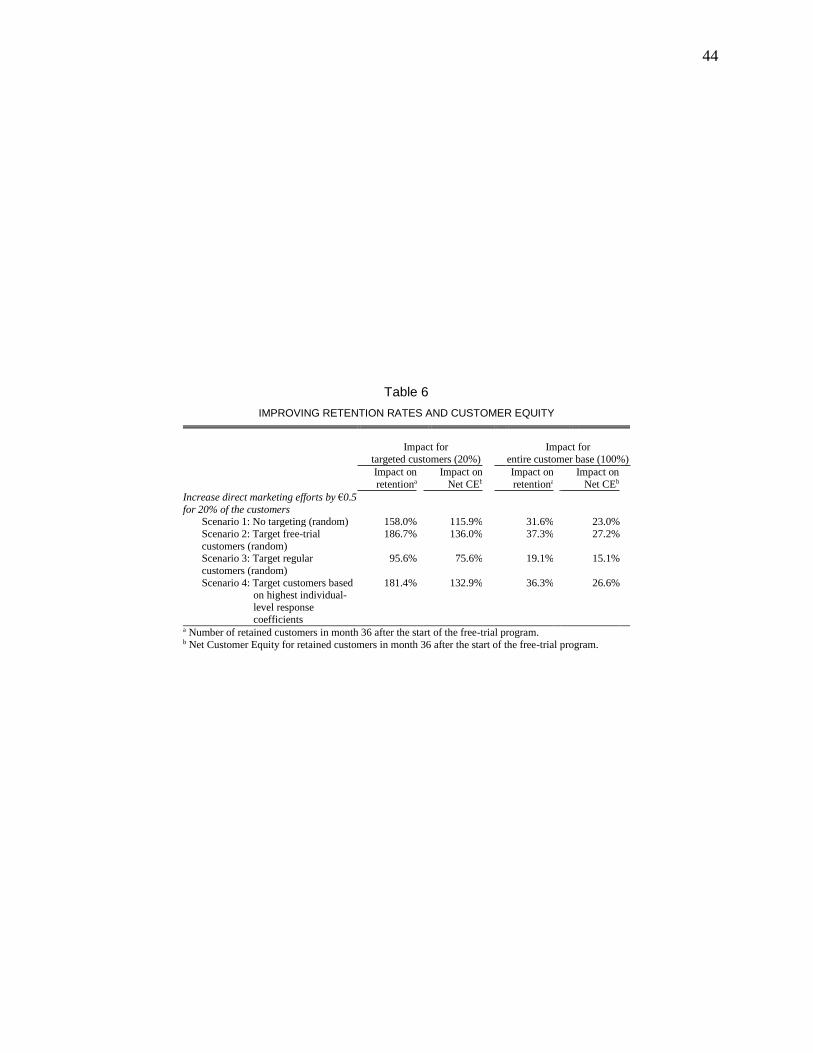
44
Table 6
IMPROVING RETENTION RATES AND CUSTOMER EQUITY
Impact for
targeted customers (20%)
Impact for
entire customer base (100%)
Impact on
retentiona
Impact on
Net CEb
Impact on
retentiona
Impact on
Net CEb
Increase direct marketing efforts by €0.5
for 20% of the customers
Scenario 1: No targeting (random) 158.0% 115.9% 31.6% 23.0%
Scenario 2: Target free-trial
customers (random)
186.7% 136.0% 37.3% 27.2%
Scenario 3: Target regular
customers (random)
95.6% 75.6% 19.1% 15.1%
Scenario 4: Target customers based on highest individual-
level response coefficients
181.4% 132.9% 36.3% 26.6%
a Number of retained customers in month 36 after the start of the free-trial program. b Net Customer Equity for retained customers in month 36 after the start of the free-trial program.

45
Figure 1
CONCEPTUAL FRAMEWORK
Retention
Usage of
pay-per-use service
Usage of
flat-rate service
CLV
H1
H3a
H3b
H2b
H2a
Direct marketing Advertising
Acquisition mode:
Free-trial or regular

46
Figure 2
MODEL FIT
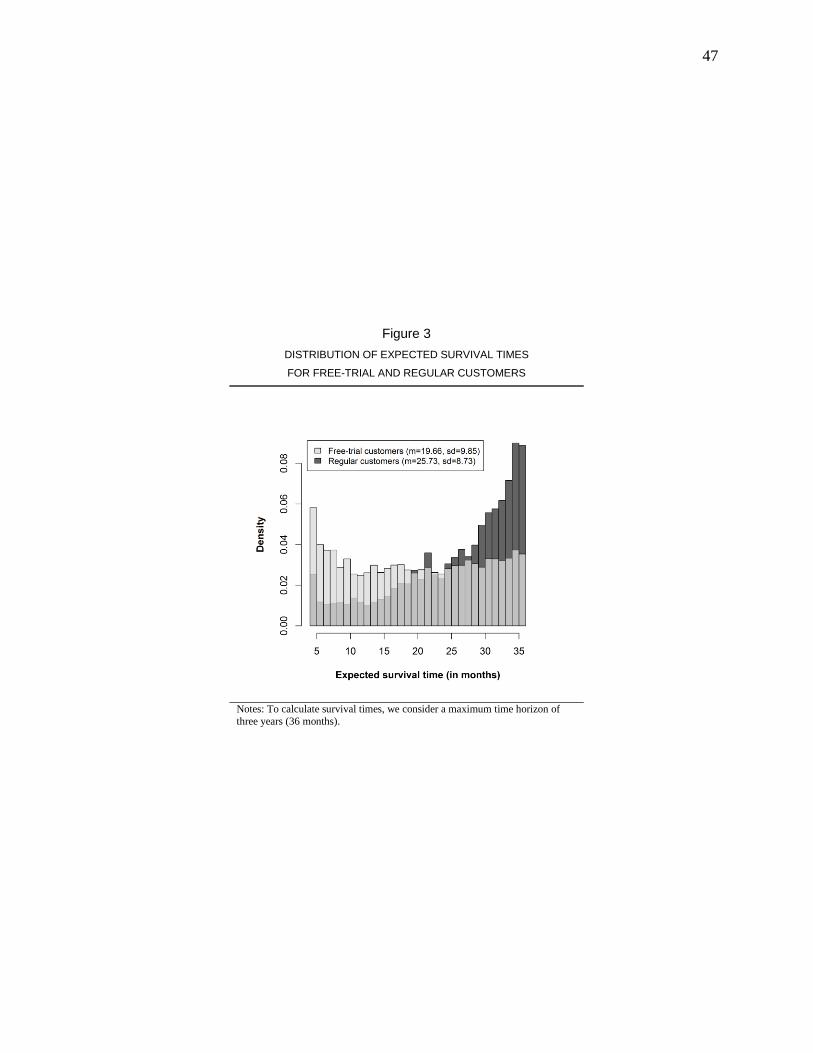
47
Figure 3
DISTRIBUTION OF EXPECTED SURVIVAL TIMES
FOR FREE-TRIAL AND REGULAR CUSTOMERS
Notes: To calculate survival times, we consider a maximum time horizon of
three years (36 months).
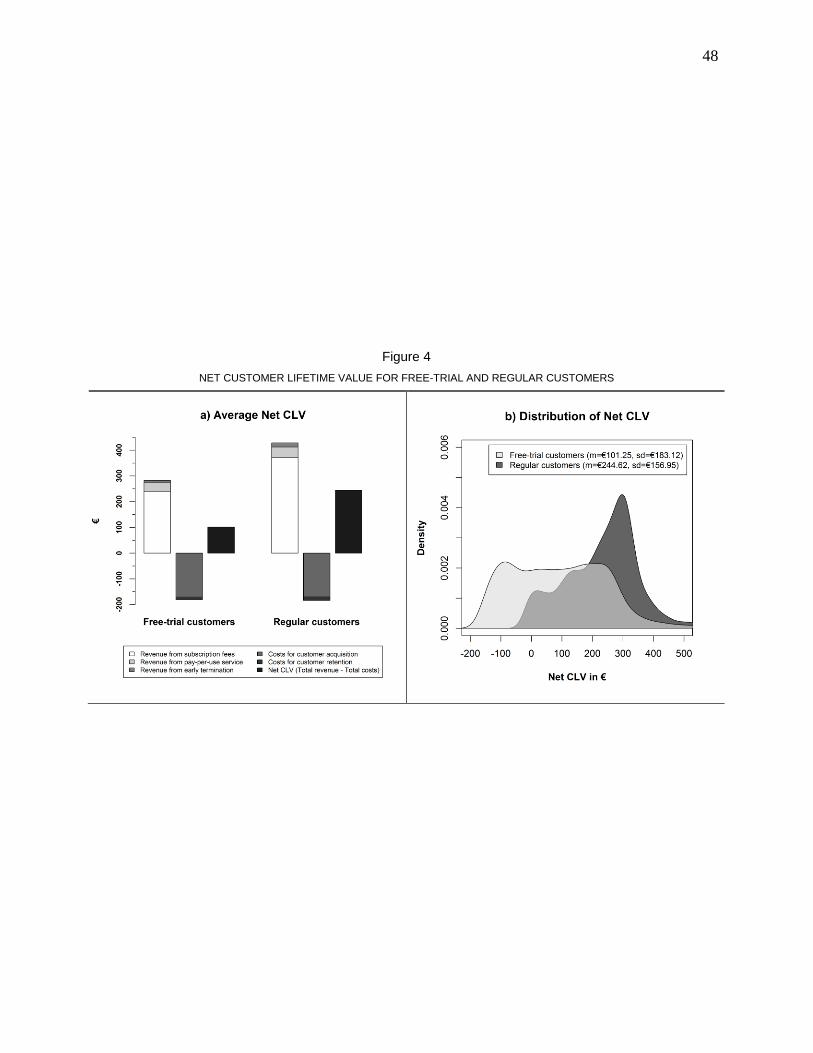
48
Figure 4
NET CUSTOMER LIFETIME VALUE FOR FREE-TRIAL AND REGULAR CUSTOMERS

49
Figure 5
RESPONSIVENESS TO MARKETING COMMUNICATION
Notes: We compute arc elasticities for a 1% increase in, respectively, advertising, direct marketing, and usage levels in month 4 after acquiring
the customer (i.e., after the trial period).
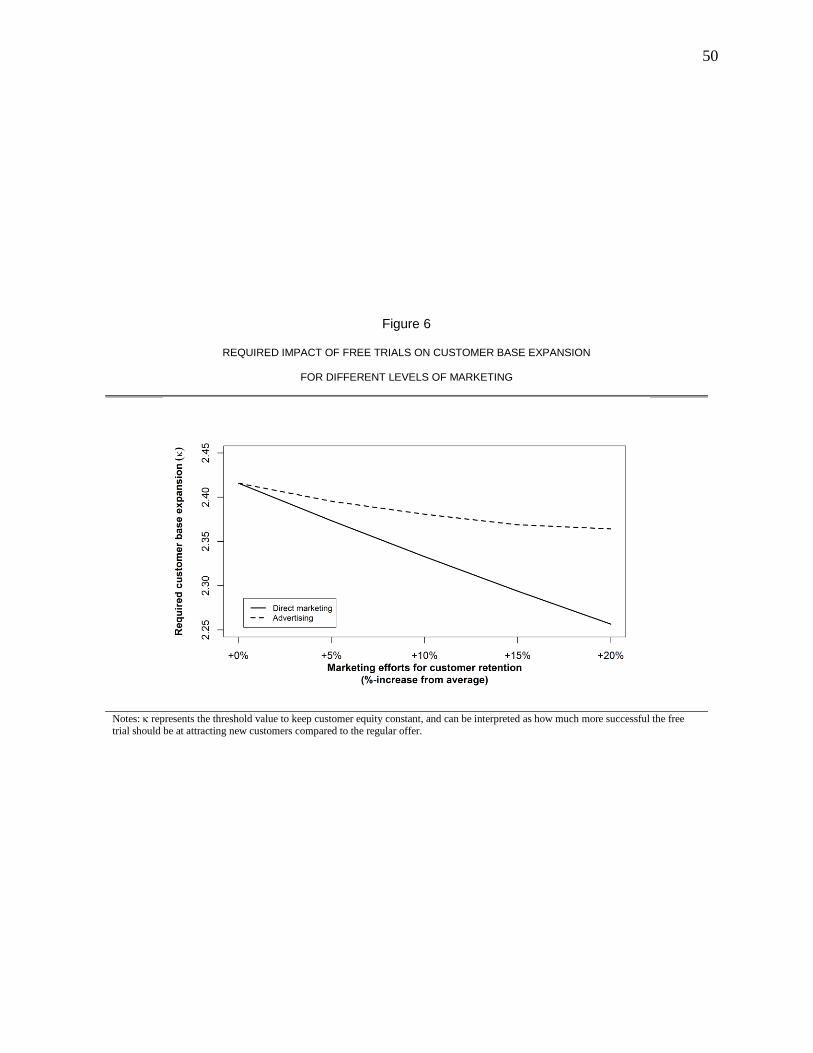
50
Figure 6
REQUIRED IMPACT OF FREE TRIALS ON CUSTOMER BASE EXPANSION
FOR DIFFERENT LEVELS OF MARKETING
Notes: represents the threshold value to keep customer equity constant, and can be interpreted as how much more successful the free trial should be at attracting new customers compared to the regular offer.

51
WEB APPENDIX
A. Correlations Between Independent Variables
CORRELATION MATRIX
1 2 3 4 5 6 7 8 9 10 11 12
1. Trial dummy 1.00
2. Direct marketing .15*** 1.00
3. Advertising .08*** .04*** 1.00
4. Age .05*** .03*** .09*** 1.00
5. Household size .03*** .02*** .00 .10*** 1.00
6. Income .01 .04*** .24*** .11*** .04*** 1.00
7. Time-to-adoption .14*** .15*** .00 .01*** .07*** .02*** 1.00
8. Subscription Fee .22*** .09*** .03*** .02*** .03*** .00 .14*** 1.00
9. Cancellation penalty .36*** .11*** .00 .03*** .04*** .01** .26*** .76*** 1.00
10. VOD credit .22*** .07*** .02*** .00 .04*** .00 .27*** .70*** .62*** 1.00
11. Temperature .00 .08*** .07*** .00 .01 .01 .21*** .31*** .25*** .20*** 1.00
12. Time-since-adoption .08*** .07*** .03*** .02*** .04*** .01*** .29*** .71*** .79*** .56*** .17*** 1.00
Significance levels (two-tailed): *** p < .001, ** p < .01. The corresponding variance inflation factors (VIFs) do not exceed 10 in any of the models (Hair et al. 2010).
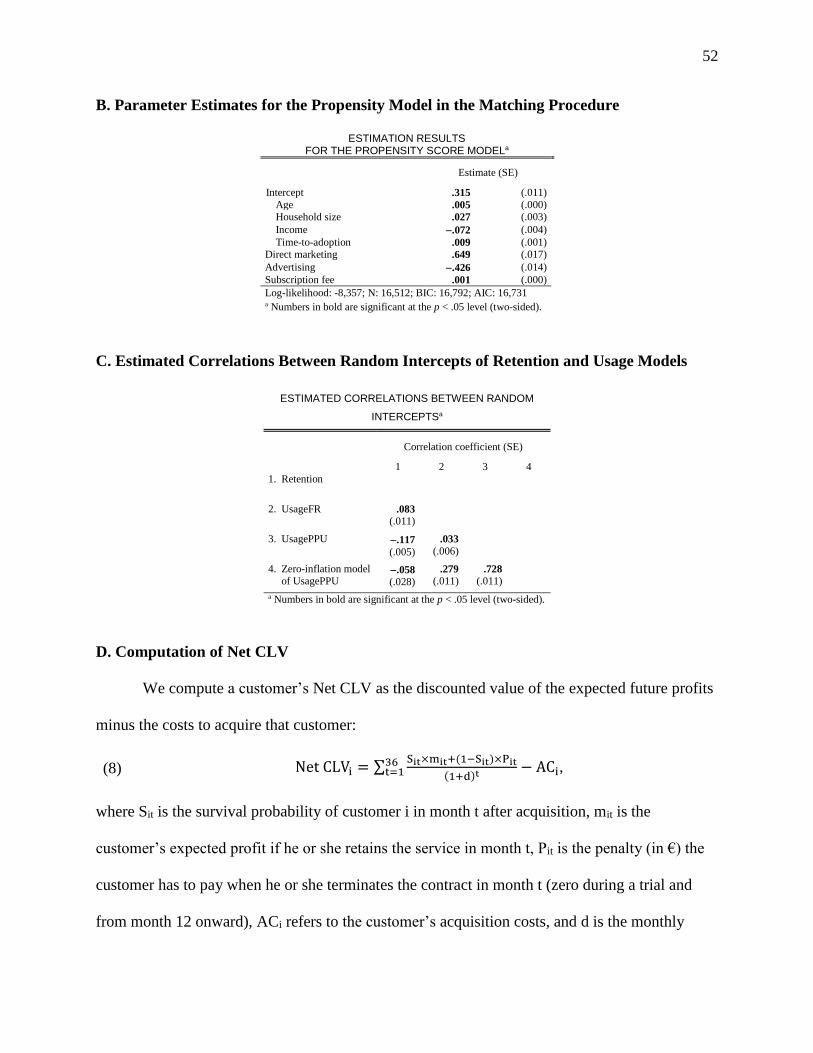
52
B. Parameter Estimates for the Propensity Model in the Matching Procedure
ESTIMATION RESULTS FOR THE PROPENSITY SCORE MODELa
Estimate (SE)
Intercept .315 (.011)
Age .005 (.000) Household size .027 (.003)
Income .072 (.004)
Time-to-adoption .009 (.001) Direct marketing .649 (.017)
Advertising .426 (.014)
Subscription fee .001 (.000)
Log-likelihood: -8,357; N: 16,512; BIC: 16,792; AIC: 16,731 a Numbers in bold are significant at the p < .05 level (two-sided).
C. Estimated Correlations Between Random Intercepts of Retention and Usage Models
ESTIMATED CORRELATIONS BETWEEN RANDOM
INTERCEPTSa
Correlation coefficient (SE)
1 2 3 4
1. Retention
2. UsageFR .083 (.011)
3. UsagePPU .117
(.005)
.033
(.006)
4. Zero-inflation model of UsagePPU
.058 (.028)
.279 (.011)
.728 (.011)
a Numbers in bold are significant at the p < .05 level (two-sided).
D. Computation of Net CLV
We compute a customer’s Net CLV as the discounted value of the expected future profits
minus the costs to acquire that customer:
(8) Net CLVi = ∑Sit×mit+(1−Sit)×Pit
(1+d)t36t=1 − ACi,
where Sit is the survival probability of customer i in month t after acquisition, mit is the
customer’s expected profit if he or she retains the service in month t, Pit is the penalty (in €) the
customer has to pay when he or she terminates the contract in month t (zero during a trial and
from month 12 onward), ACi refers to the customer’s acquisition costs, and d is the monthly

53
discount factor. d corresponds to an annual rate of 8.5%, which is a common value for the
weighted average cost of capital of TV content providers such as Netflix, Comcast, and DirecTV
(e.g., Cusick et al. 2014; Swinburne, Khadilkar, and Yeh 2014).
Notice that the survival probability Sit in month t is based on the customer’s retention
decisions in the preceding months: Sit = Prob(ri,0, …, ri,t-1 = 1). Furthermore, the expected margin
mit in a given month equals the revenue generated by the customer, less the costs to retain the
customer (Reinartz, Thomas, and Kumar 2005):
(9) mit = Feeitsub + FeePPU × UsagePPUit⏟
Revenue
− CostsDM × DMit − CostsAdv ⏟
Costs
,
where Feeitsub is the monthly subscription fee of €15.95 that customer i has to pay in month t
(zero during a free-trial period), FeePPU is the average per-unit fee for the pay-per-use service
corrected for average per-unit content cost (€3 minus €.25 throughout the simulation period1),
UsagePPUit refers to the customer’s expected consumption amount (in units) of the pay-per-use
service in month t, DMit is the number of direct-marketing contacts with the customer in month t,
CostsDM is the average cost for a single contact, and CostsAdv is the average monthly advertising
cost per customer.
To determine ACi, CostsDM , and CostsAdv , we need to allocate the observed marketing
efforts between acquisition and retention (Gupta, Lehmann, and Stuart 2004). Because we
observe consumer-specific direct-marketing efforts before and after acquisition, we can readily
compute the acquisition and retention direct-marketing costs for each customer by multiplying
1 To obtain an estimate of content costs for streamed VODs, we divide Netflix’s cost of revenue in 2013 ($2.6bn) by
the number of hours of watched content in that year (12bn), resulting in content costs of $.22 per streamed hour
(Netflix 2014). At an average length of 90 minutes per VOD (Huang, Li, and Ross 2007), content costs amount to
$.33 per VOD (approximately €.25).

54
the relevant number of direct-marketing contacts by the average delivery cost of €.37.2 Notice
that the average observed monthly number of marketing contacts for customer acquisition is .62
for free-trial, and .26 for regular customers. The company uses direct marketing less often for
customer retention: once acquired, free-trial and regular customers are contacted on average .34
and .16 times per month, respectively. In line with Gupta, Lehmann, and Stuart (2004), we use
these average retention efforts when simulating future behavior beyond the observation period.
We also need to split the expenditures on mass advertising into retention and acquisition
costs. We divide the monthly total advertising budget between retention and acquisition
proportionally to the numbers of iTV adopters and non-adopters in the company's total customer
base (see Gupta, Lehmann, and Stuart 2004). We then distribute the acquisition advertising
budget over the company’s new customers and the retention advertising budget over the already
acquired customers. On average, the company spends €169.61 on advertising to acquire a new
customer. This number is close to the US$181.8 reported in Libai, Muller, and Peres (2009) for
another telecommunication provider in the same geographical region. The monthly advertising
cost for retaining a customer is €.51, and thus substantially lower than the acquisition cost (see
Thomas 2001). Other fixed costs are not directly related to the number of customers or their
usage intensity (e.g., the network infrastructure which is owned by the company), and hence can
be ignored in the computation of Net CLV.
2 The number of iTV customers was small relative to the company’s entire customer base (which mainly includes
telephone and Internet subscribers), so that we can safely assume that the already existing service employees
handled iTV customers as well. As a result, direct-marketing costs correspond to the actual delivery costs of the
messages. There are three channels for direct marketing in the data set: postal mail, outbound calls, and e-mail. We
take actual postal fees of the National Post in 2004 (€.44 for non-priority delivery), contact time of the average
phone call (6.39 minutes for non-technical inquiries; Sun and Li 2011) multiplied by the per-minute call fee of the
national carrier in 2004 (€.051), and a nominal amount of €.01 to reflect the small delivery costs of emails (Danaher
and Dagger 2013). Finally, we weight the delivery costs by the relative occurrence of the respective channels in the
data set and arrive at an average direct-marketing cost of €.37 per contact.

55
References
Cusick, Philip, Richard Choe, Eric Pan, and Ava Zhang (2014), “DirecTV: Takeways from DTV
Management Meetings - US and Latam [J.P. Morgan Research],” Thomson ONE Banker
Analytics (accessed 30 September 2014), http://banker.thomsonib.com/
Danaher, Peter J. and Tracey S. Dagger (2013), “Comparing the Relative Effectiveness of
Advertising Channels: a Case Study of a Multimedia Blitz Campaign,” Journal of
Marketing Research, 50 (4), 517-34.
Gupta, Sunil, Donald R. Lehmann, and Jennifer Ames Stuart (2004), “Valuing Customers,”
Journal of Marketing Research, 41 (1), 7-18.
Hair, Joseph F., William C. Black, Barry J. Babin, and Rolph E. Anderson (2010), Multivariate
Data Analysis (7th ed.). Upper Saddle River, New Jersey: Pearson.
Huang, Cheng, Jin Li and Keith W. Ross (2007), “Can Internet Video-on-Demand be
Profitable?,” Proceedings of ACM SIGCOMM 2007.
Kumar, V., Rajkumar Venkatesan, Tim Bohling, and Denise Beckmann (2008), “Practice Prize
Report—The Power of CLV: Managing Customer Lifetime Value at IBM,” Marketing
Science, 27 (4), 585-99.
Libai, Barak, Eitan Muller, and Renana Peres (2009), “The Diffusion of Services,” Journal of
Marketing Research, 46 (2), 163-75.
Netflix, Inc. (2014). Form 10-K 2013 (Annual Report).
Reinartz, Werner J. and V. Kumar (2003), “The Impact of Customer Relationship Characteristics
on Profitable Lifetime Duration,” Journal of Marketing, 67 (1), 77-99.
Reinartz, Werner J., J. S. Thomas, and V. Kumar (2005), “Balancing Acquisition and Retention
Resources to Maximize Customer Profitability,” Journal of Marketing, 69 (1), 63-79.
56
Swinburne, Benjamin, Hersch Khadilkar and Thomas Yeh (2014), “Netflix Inc: Europe Gives,
and Europe Takes Away [Morgan Stanley Research],” Thomson ONE Banker Analytics
(accessed 30 September 2014), http://banker.thomsonib.com/
Sun, Baohong and Shibo Li (2011), “Learning and Acting on Customer Information: A
Simulation-based Demonstration on Service Allocations with Offshore Centers,” Journal
of Marketing Research, 48 (1), 72-86.
Thomas, Jacquelyn S. (2001), “A Methodology for Linking Customer Acquisition to Customer
Retention,” Journal of Marketing Research, 38 (2), 262-68.
Venkatesan, Rajkumar and V. Kumar (2004), “A Customer Lifetime Value Framework for
Customer Selection and Resource Allocation Strategy,” Journal of Marketing, 68 (4),
106-25.