til logistics group limited news/2018 news/final pres - til... · freight forwarding services. ......
TRANSCRIPT

TIL LOGISTICS GROUP LIMITED
HY18 INTERIM RESULTS PRESENTATION
FOR THE SIX MONTHS TO 31 DECEMBER 2017
1

ABOUT TIL LOGISTICS GROUP
• One of New Zealand’s largest domestic freight and logistics platforms
• Nationwide network of branches, depots and warehouses with 60 locations and over 150,000m2 of warehousing space
• Dedicated team of over 1,700 employees and contractors
• Fleet of some 900 trucks, 1,110 trailers, 310 forklifts and 170 light vehicles
• Operates one of the largest petroleum product Dangerous Goods (DG) road tanker fleets in the country
2TIL Logistics Group HY18 Interim Results Presentation
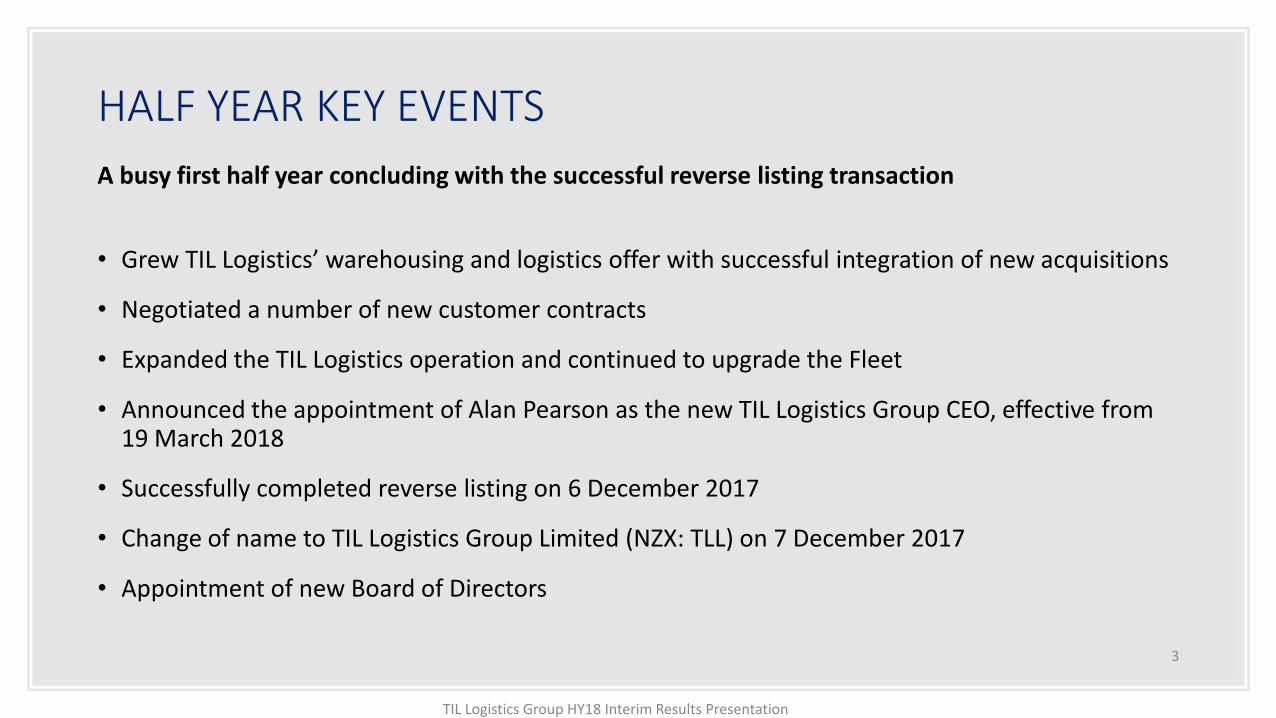
HALF YEAR KEY EVENTS
A busy first half year concluding with the successful reverse listing transaction
• Grew TIL Logistics’ warehousing and logistics offer with successful integration of new acquisitions
• Negotiated a number of new customer contracts
• Expanded the TIL Logistics operation and continued to upgrade the Fleet
• Announced the appointment of Alan Pearson as the new TIL Logistics Group CEO, effective from 19 March 2018
• Successfully completed reverse listing on 6 December 2017
• Change of name to TIL Logistics Group Limited (NZX: TLL) on 7 December 2017
• Appointment of new Board of Directors
3
TIL Logistics Group HY18 Interim Results Presentation

HALF YEAR RESULTS SUMMARY
4TIL Logistics Group HY18 Interim Results Presentation
OUTLOOK FOR 2H 2018: The first half year results are encouraging and give the Board every confidence that the full year pro forma PFI targets (excluding non-trading costs) indicated in the Listing Profile will be achieved.
*Non-trading costs of $6.5m associated with the reverse listing process, $11.4m in share based payments and $3.4m relating to revaluation of deferred consideration for acquisitions in the prior period.
See page 24 of the TLL HY18 Interim Report for a reconciliation of non-GAAP to GAAP measures.
See pages 56 to 61 of the Listing Profile for prospective pro forma financial information for FY18, available at www.til.kiwi/investor-centre-menu/til-transaction.html
Revenue $ 164.0 million
EBITDA $(7.0) million
EBITDA excluding non-trading costs*
$14.3 million
NLAT $(15.7) million
NPAT excluding non-trading costs*
$5.6 million
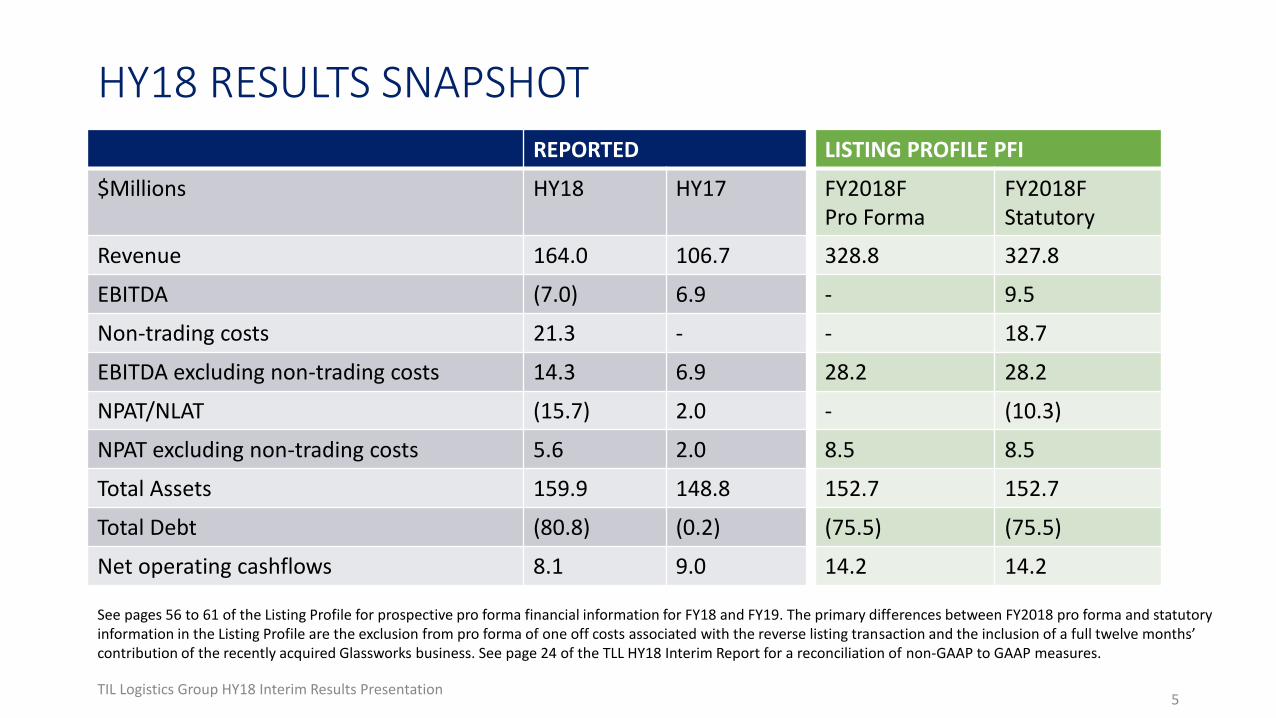
HY18 RESULTS SNAPSHOTREPORTED
$Millions HY18 HY17
Revenue 164.0 106.7
EBITDA (7.0) 6.9
Non-trading costs 21.3 -
EBITDA excluding non-trading costs 14.3 6.9
NPAT/NLAT (15.7) 2.0
NPAT excluding non-trading costs 5.6 2.0
Total Assets 159.9 148.8
Total Debt (80.8) (0.2)
Net operating cashflows 8.1 9.0
5TIL Logistics Group HY18 Interim Results Presentation
See pages 56 to 61 of the Listing Profile for prospective pro forma financial information for FY18 and FY19. The primary differences between FY2018 pro forma and statutory information in the Listing Profile are the exclusion from pro forma of one off costs associated with the reverse listing transaction and the inclusion of a full twelve months’ contribution of the recently acquired Glassworks business. See page 24 of the TLL HY18 Interim Report for a reconciliation of non-GAAP to GAAP measures.
LISTING PROFILE PFI
FY2018FPro Forma
FY2018FStatutory
328.8 327.8
- 9.5
- 18.7
28.2 28.2
- (10.3)
8.5 8.5
152.7 152.7
(75.5) (75.5)
14.2 14.2
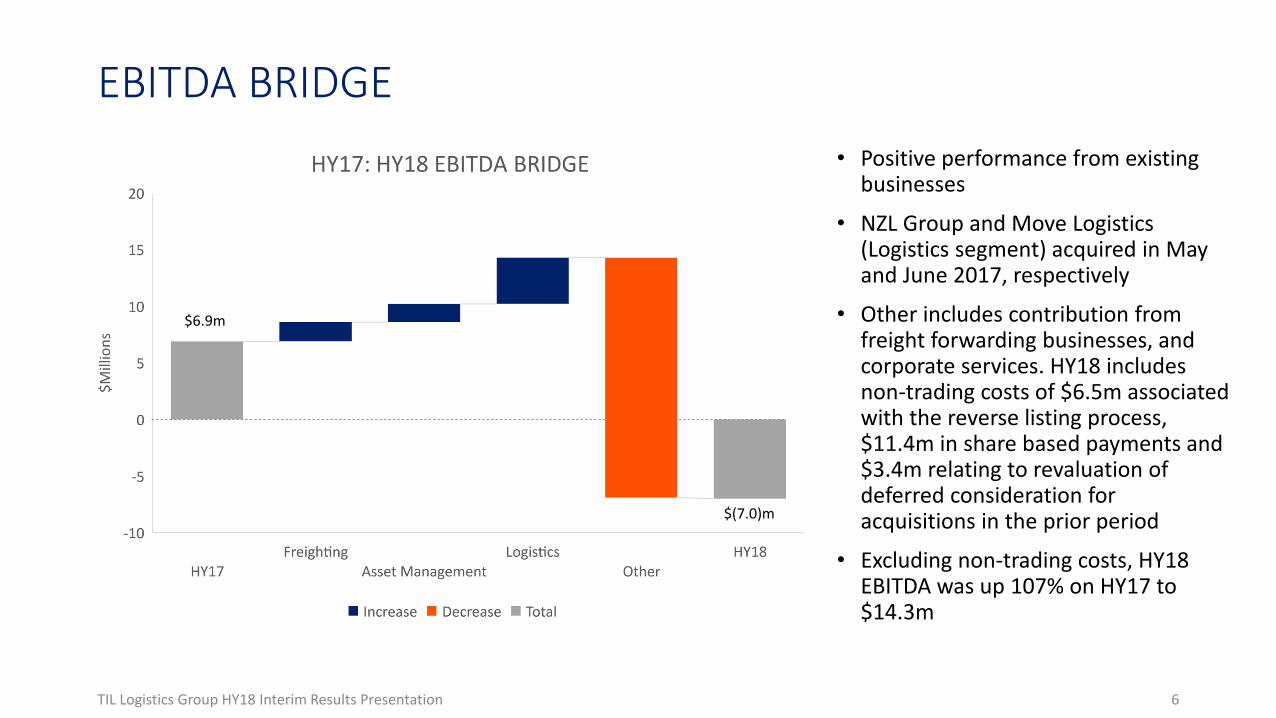
EBITDA BRIDGE
• Positive performance from existing businesses
• NZL Group and Move Logistics (Logistics segment) acquired in May and June 2017, respectively
• Other includes contribution from freight forwarding businesses, and corporate services. HY18 includes non-trading costs of $6.5m associated with the reverse listing process, $11.4m in share based payments and $3.4m relating to revaluation of deferred consideration for acquisitions in the prior period
• Excluding non-trading costs, HY18 EBITDA was up 107% on HY17 to $14.3m
6TIL Logistics Group HY18 Interim Results Presentation
$6.9m
$(7.0)m

CAPITAL MANAGEMENT
Focus on debt reduction:
• Utilisation of working capital
• Investigating release of assets through increase in owner-drivers
The increase in reported Total Debt from HY17 ($0.2m) to HY18 reflects the acquisition of businesses under the reverse listing transaction.
7TIL Logistics Group HY18 Interim Results Presentation
See page 56 of the Listing Profile for an explanation of pro forma adjustments for debt
$80.8m
$75.5m
$63.8m
0
10
20
30
40
50
60
70
80
90
Actual HY18 Proforma FY18 Fcast Proforma FY19 Fcast
$M
illio
ns
TOTAL DEBT

SEGMENT REVENUE AND EARNINGS
0
50
100
150
200
250
HY17 HY18
$ M
illio
ns
REVENUE
8TIL Logistics Group HY18 Interim Results Presentation
0
5
10
15
HY17 HY18
$ M
illio
ns
ADJUSTED EBITDA
HY18 REVENUE
HY18 ADJ EBITDA
Adjusted EBITDA excludes non-trading costs of $6.5m associated with the reverse listing process, $11.4m in share based payments and $3.4m relating to revaluation of deferred consideration for acquisitions in the prior period. See page 24 of the TLL HY18 Interim Report for a reconciliation of non-GAAP to GAAP measures.
Freighting: Good performance from existing businesses.
Logistics: Primarily comprises NZL Group and Move Logistics, acquired since the previous first half year, both of which are performing well
Asset Management: Revenue generated from leasing of trucks and trailers to TIL Logistics businesses
Other: Includes small contribution from freight forwarding services.

9TIL Logistics Group HY18 Interim Results Presentation

FREIGHTINGRevenue $111.9m Adjusted EBITDA $4.4m
TIL Logistics is one of the largest freight transport companies in New Zealand and has a nationwide network with regional strength and speciality services
• Grew the client base and welcomed a number of new clients
• Continued to upgrade the TIL Logistics fleet with around 30 new vehicles, including trucks and trailers, entering the operation
• Focus on expansion of specialist trucking operations
• Investigating opportunities to develop new services within the Group
• Looking to increase the number of owner-operators within the fleet
10TIL Logistics Group HY18 Interim Results Presentation

LOGISTICSRevenue $48.4m Adjusted EBITDA $4.1m
TIL Logistics’ expanded warehousing offering provides tangible opportunities for increased customer engagement and growth
• Successfully integrated NZL Group and MOVE Logistics into the Group
• Signed new customer contracts including freight handling ventures between MOVE Logistics and the Ports of Auckland and Lyttelton Port
• Acquired Seamount Enterprises’ fleet and Glassworks Logistics’ logistics and supply services businesses which have been integrated into MOVE Logistics
11TIL Logistics Group HY18 Interim Results Presentation
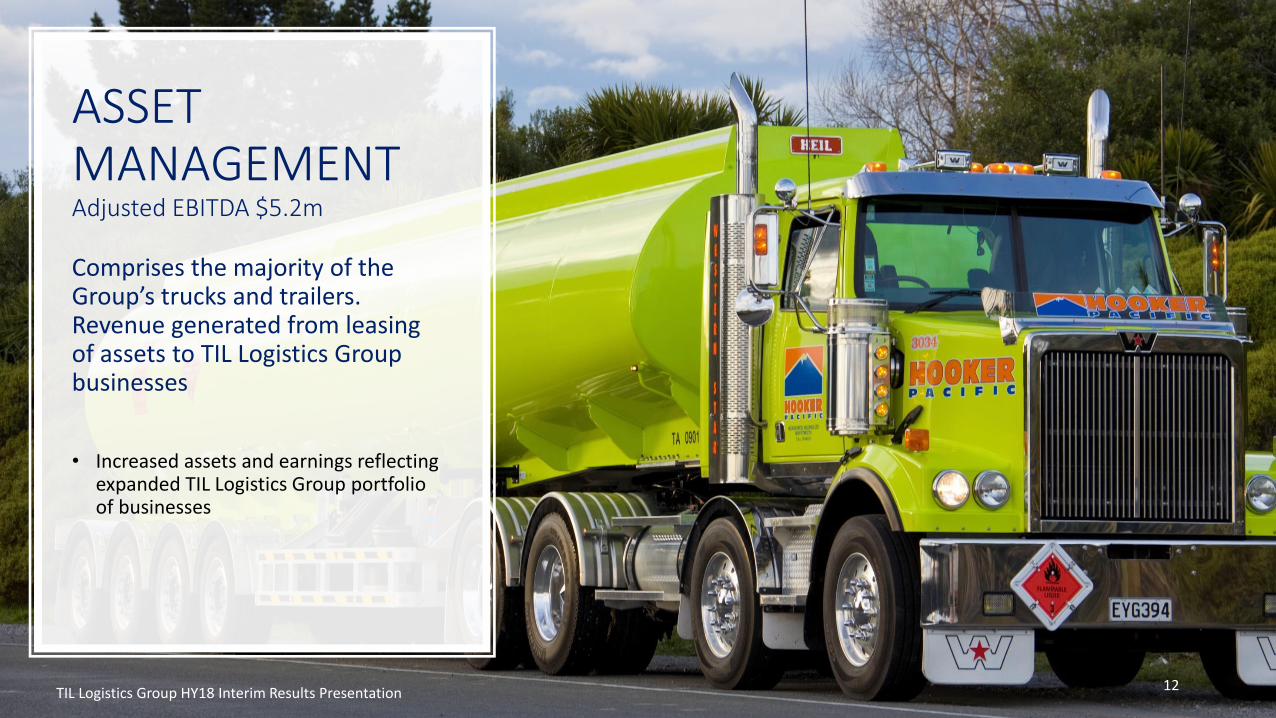
ASSET MANAGEMENTAdjusted EBITDA $5.2m
12
Comprises the majority of the Group’s trucks and trailers. Revenue generated from leasing of assets to TIL Logistics Group businesses
• Increased assets and earnings reflecting expanded TIL Logistics Group portfolio of businesses
TIL Logistics Group HY18 Interim Results Presentation
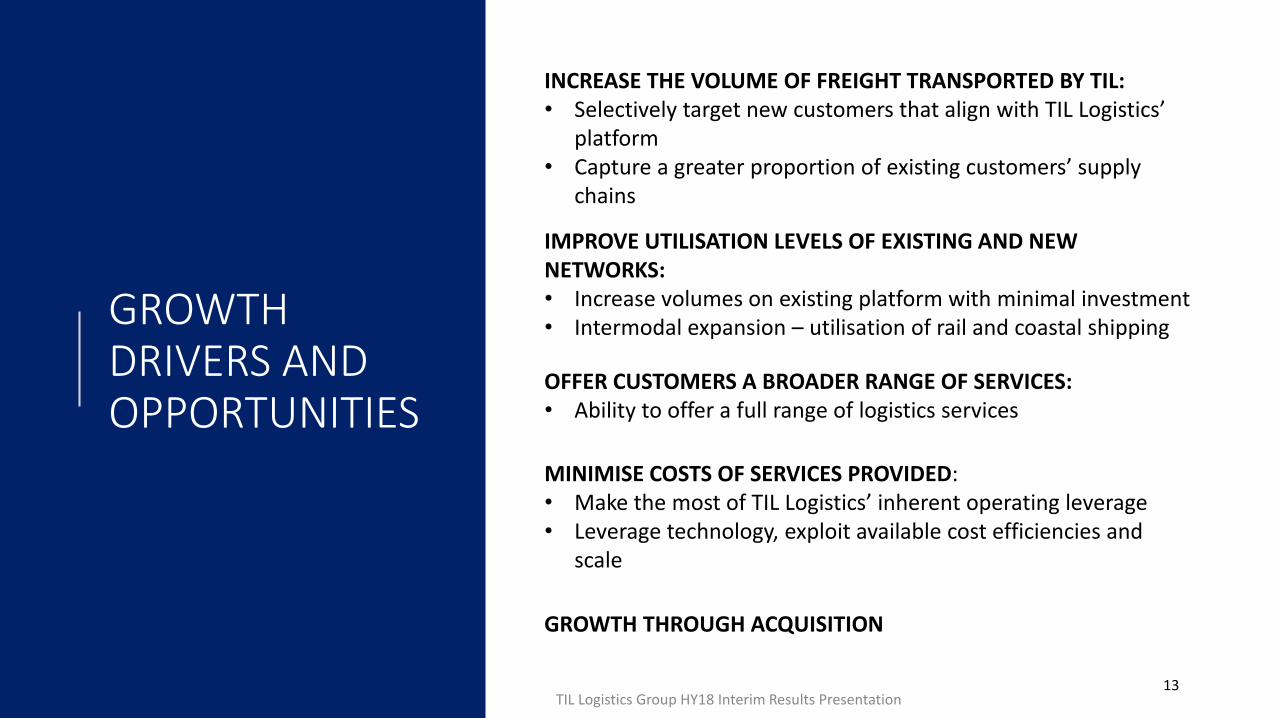
GROWTH DRIVERS AND OPPORTUNITIES
13
INCREASE THE VOLUME OF FREIGHT TRANSPORTED BY TIL:• Selectively target new customers that align with TIL Logistics’
platform• Capture a greater proportion of existing customers’ supply
chains
IMPROVE UTILISATION LEVELS OF EXISTING AND NEW NETWORKS:• Increase volumes on existing platform with minimal investment• Intermodal expansion – utilisation of rail and coastal shipping
MINIMISE COSTS OF SERVICES PROVIDED:• Make the most of TIL Logistics’ inherent operating leverage• Leverage technology, exploit available cost efficiencies and
scale
OFFER CUSTOMERS A BROADER RANGE OF SERVICES:• Ability to offer a full range of logistics services
GROWTH THROUGH ACQUISITION
TIL Logistics Group HY18 Interim Results Presentation

STRONG BOARD AND MANAGEMENT TEAM
BOARD
• Trevor Janes, Independent Chair
• Greg Kern, Non-executive Director
• Lorraine Witten, Independent Director
• Danny Chan, Independent Director
• Jim Ramsay, Executive Director
TIL Logistics’ Board comprises highly experienced Directors with particular strength in corporate governance and oversight of growing companies.
EXECUTIVE LEADERSHIP
• Alan Pearson, CEO as at 19 March 2018Alan has over 35 years commercial experience in both public and private companies, including ten years as Managing Director of Halls Group Limited, which is one of New Zealand’s largest transport & logistics companies (primarily involved with temperature controlled supply chains for both domestic and export food markets)
• Greg Whitham, CFO
• Alan Terris, International & Group Marketing Director
14TIL Logistics Group HY18 Interim Results Presentation

CONTACT
15

See page 56 to 61 of the TIL Listing Profile for Explanatory Notes
16
SELECTED FINANCIAL INFORMATION
TIL Logistics Group HY18 Interim Results Presentation

GLOSSARY
• Pro forma historical financial information has been sourced from audited and unaudited financial statements and management reports that are available on the TIL Logistics Website under Investor Centre/TIL Transaction. Details of consolidation and other pro forma adjustments can be found in the Supplementary Financial Information on the TIL Logistics website under Investor Centre/TIL Transaction.
• EBITDA refers to Earnings Before Interest, Tax, Depreciation and Amortisation excluding income from associates. EBITDA and pro forma EBITDA are non-GAAP profit measures. TIL considers that pro forma EBITDA, which normalises performance for certain structural changes within the business and removes the impact of a number of non-recurring items, allows for a better comparison of operating performance over the historical and PFI period and for comparison with that of other company. Reconciliations between pro forma EBITDA and GAAP profit measures are contained within the Supplementary Financial Information.
• NPAT/NLAT refers to net profit/loss after tax. Pro forma NPAT in FY2015-FY2018F represents NPAT after allowing for pro forma adjustments as discussed under the heading “Financial Information Presented” above. There are no pro forma adjustments included in the FY2019F NPAT. Pro forma NPAT is a non-GAAP measure. Reconciliations between pro forma NPAT and GAAP profit measures are contained within the Supplementary Financial Information.
• Pro forma net cash flows from operating activities is a non-GAAP profit measure. Pro forma net cash flows from operating activities have been calculated as net cash flows from operating activities adjusted for the cash impact of the pro forma adjustments. The Supplementary Financial Information contains reconciliations between pro forma net cash flows from operating activities and GAAP profit measures.
17TIL Logistics Group HY18 Interim Results Presentation
18
DISCLAIMER
This presentation has been prepared by TIL Logistics Group Limited (“TLL”). The information in this presentation is of a general nature only. It is not a complete description of TLL.
This presentation is not a recommendation or offer of financial products for subscription, purchase or sale, or an invitation or solicitation for such offers.
This presentation is not intended as investment, financial or other advice and must not be relied on by any prospective investor. It does not take into account any particular prospective investor’s objectives, financial situation, circumstances or needs, and does not purport to contain all the information that a prospective investor may require. Any person who is considering an investment in TLL securities should obtain independent professional advice prior to making an investment decision, and should make any investment decision having regard to that person’s own objectives, financial situation, circumstances and needs.
Past performance information contained in this presentation should not be relied upon (and is not) an indication of future performance. This presentation may also contain forward looking statements with respect to the financial condition, results of operations and business, and business strategy of TLL. Information about the future, by its nature, involves inherent risks and uncertainties. Accordingly, nothing in this presentation is a promise or representation as to the future or a promise or representation that an transaction or outcome referred to in this presentation will proceed or occur on the basis described in this presentation. Statements or assumptions in this presentation as to future matters may prove to be incorrect.
A number of financial measures are used in this presentation and should not be considered in isolation from, or as a substitute for, the information provided in the TLL Listing Profile.
TLL and its related companies and their respective directors, employees and representatives make no representation or warranty of any nature (including as to accuracy or completeness) in respect of this presentation and will have no liability (including for negligence) for any errors in or omissions from, or for any loss (whether foreseeable or not) arising in connection with the use of or reliance on, information in this presentation.
TIL Logistics Group HY18 Interim Results Presentation