ti no . 70 -2 - missouri · 2 details of test beams 3 comparison of ultimate loads ... ultimate...
TRANSCRIPT

TE:. 50~2
• • ti 8 J.t3 no . 70 - 2
222
~--..rn:-1SOURI COOPERATIVE HIGHWAY RESEARCH PROGRAM
/,, ~
REPORT
L--
Pr0oerty of
MoDOT TRANSPORTATION LIBRARY
/ "STATIC AND FATIGUE
PROPERTIES OF HIGH-STRENGTH BOLT SHEAR CONNECTORS",,
FINAL REPORT
MISSOURI STATE HIGHWAY DEPARTMENT
UNIVERSITY OF MISSOURI-COLUMBIA
BUREAU OF PUBLIC ROADS
Ti~ S-o 1;)
. fYl ti/ 3 /J rJ.
7 o- :2
MISSOURI COOPERATIVE HIGHWAY RESEARCH PROGRAM REPORT 70-2
uSTATIC AND FATIGUE PROPERTIES OF
HI GH-STRENGTH BOLT SHEAR CONNECTORSu
FINAL REPORT
MISSOURI STATE HIGHWAY DEPARTMENT
UNIVERS1TY OF MISSOURI - COLUMBIA
BUREAU OF PUBLIC ROADS

I I
I
I I I
I I I I I I I
"STATIC AND FATIGUE PROPERTIES 0
HIGH-STRENGTH BOLT SHEAR CONNECTOR"
STUDY 68-4 FINAL REPORT
Prepared for
MISSOURI STATE HIGHWAY DEPARTMENT
by
LAWRENCE N, DALLAM
DEPARTMENT OF CIVIL ENGINEERING
UNIVERSITY OF MISSOURI
COLUMBIA, MISSOURI
JUNE, 1970
in cooperation with
U,S, DEPARTMENT OF TRANSPORTATION
FEDERAL HIGHWAY ADMINISTRATION
BUREAU OF PUBLIC ROADS
JUN 2 9 1973
--"'&."' ... _.!
The opinions, findings, and conclusions
expressed in this publication are not necessarily
those of the Bureau of Public Roads.

I
I
I I
I
I I
I
I I I
Table of Contents
Preface . . . . . . . . . . . . . . . . . . . . . . . . . . . . 1
Static Behavior of Connector Positive Moment Region
Pushout Tests Beam Tests
Negative Moment Region Pushout Tests Beam Tests
Fatigue Behavior of Connector
Pushout Tests Continuous Beam Tests
Design Recommendations References
Appendix: Pushout and Beam Notation
2
2
3
5
5
6
7
9
47
48

I
I I
I
I
LIST OF FIGURES
FIGURE
1 Detai 1 of Push out Specimens . . . . . . 2 Load-Average Slip Curves of 3/4-inch Bolts 3 Details of Composite Beams ..... 4 Slip Distribution Along Beam NFB4B2. 5 Load vs. Deflection for 12 Series . . 6 Load vs. Deflection for 21 Series . 7 Strain Profile at Section 43.5 inches from South End
of NFB4B2 . . . . . . . . . . . . . 8 Force per Shear Connector vs. Slip for NFB4B2 9 Force per Shear Connector vs. Slip for NFB5Bl
10 Force per Shear Connector vs. Slip for NFB6Bl . 11 Force per Shear Connector vs. Slip for LFB6Bl 12 Details of Tension Pushout Specimen 13 Load Versus Slip - N6T4TBla,b 14 Instrumenta t ion - NCB6Bl .... . 15 Instrumentation - NCB6B2 .... . 16 Instrumentation - NCB6B3 . . . 17 Cross Sections at the Negative Supports ... 18 Comparison of Deflections - NCB6Bl and NCB6B2 19 Comparison of Slips - NCB6Bl and NCB6B2 . 20 Overhang Deflection - NCB6B3 . . . 21 Strain Profile - NCB6B3 . . . . 22 Dimensions and Instrumentation of NCB6FBl .. 23 Dimensions and Instrumentation of NCB6FB2 24 Deflection at Load Points . . . . . . 25 Working Strain Profile at Section C ... 26 Slip Distribution at Working Load of NCB6FBl 27 Load-Slip at a Typical Connector 28 Applied Load vs. Negative Moment 29 Comparative Cracking Patterns .
PAGE
12 13 14 15 16 17
18 19 20 21 22 23 24 25 26 27 28 29 30 31 32 33 34 35 36 37 38 39 40

I I
I I I I I I I I I I I I I I I
LIST OF TABLES
TABLE
1 Canpression Pushout Test Results
2 Details of Test Beams
3 Comparison of Ultimate Loads
4 Critical Load of Shear Connectors
5 Tension Pushout Test Results
6 Results of Beam Tests
7 Fatigue Results of Pushout Tests
PAGE
. • 41
42
43
43
44
45

I
I I I I I I I
I
I I
I I I
11 STATIC AND FATIGUE PROPERTIES OF HIGH-STRENGTH
BOLT SHEAR CONNECTORS 11
PREFACE
An experimental investigation, cosponsored by the State Highway
Commission of Missouri and the Bureau of Public Roads, was undertaken
at the University of Missouri-Columbia campus to determine the static
and fatigue properties of high-strength bolts when used as shear con
nectors in concrete-on-steel composite beams.
The investigation was performed in four phases over a four-year
period. The first phase consisted of the testing of a series of push
out specimens to determine the feasibility (from a strength point-of
view) of using bolts as shear connectors (1). From the results of these
tests, six full-scale, simply-supported beams were tested to study the
behavior of bolts in the positive-moment region of composite beams
subjected to static loads (2). The third phase was designed to study
the behavior of the connector in the negative-moment region of composite
beams (3). Three full-scale overhanging beams were tested under static
loading, two with connectors and one without, and a series of tension
pushout specimens were tested. The fourth phase was designed to study
the behavior of the bolt connector under fatigue and dynamic loading (4).
A series of pushout specimens and two two-span continuous composite
beams were tested with repeated loading. The beams were also subjected
to a final static loading.
An explanation of the notation used to identify the pushout and
beam specimens mentioned in this report is given in the Appendix.

I I I I I I I I I I I
I I I I I I
2
STATIC BEHAVIOR OF CONNECTOR
The behavior of the connector under static loading depends upon
whether the slab is in compression or tension. The discussion will be
limited to A325 high-strength bolts embedded about four inches in a
six-inch slab.
Positive Moment Region
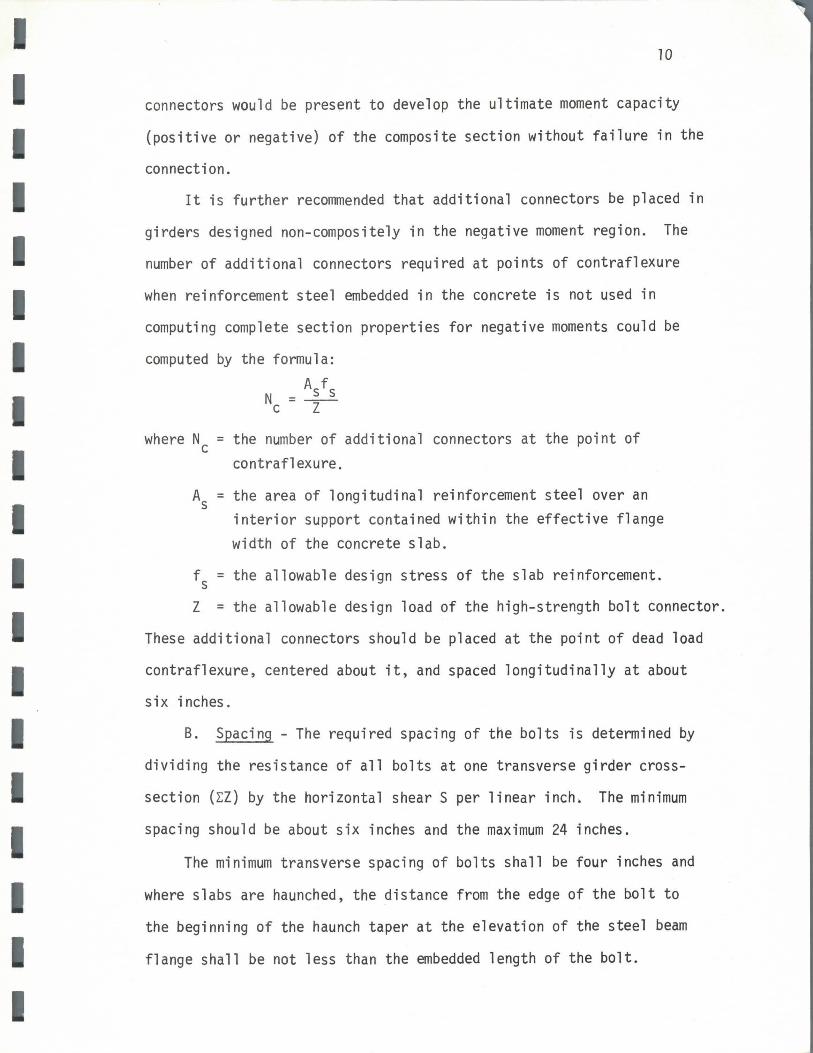
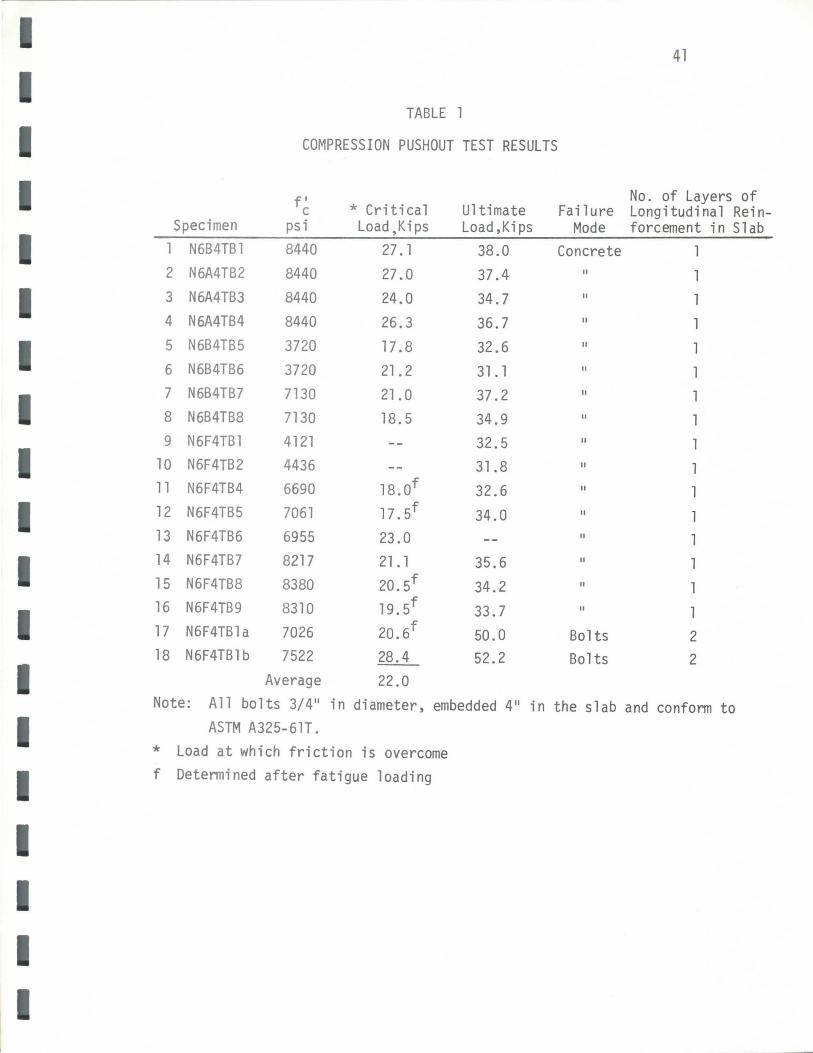
Pushout Tests - In the course of the study, eighteen pushout tests
were perfonned with 3/4-inch diameter bolts. The test specimens (Figure
1) were similar except for the amount of reinforcing steel in the slab.
In specimens 1 through 8 (Table 1) the longitudinal steel was 2 - #3
bars; in specimens 9 through 16 it was 3 - #5 bars and in specimens 17
and 18 there were two layers (one top and one bottom) of 3 - #5 bars.
The test results are shown in Table 1 and it is seen that the ultimate
load for specimens 17 and 18 is considerably higher (about 50%) than
the other specimens. The presence of the additional longitudinal and
transverse reinforcing steel in the bottom of the slab improves the
stress condition in the concrete in the neighborhood of the bolts. The
ultimate load for specimens 1 through 16 was limited by the strength of
the concrete, but by adding steel in the bottom of the slab to better
approximate the conditions in an actual composite girder, the ultimate
load for specimens 17 and 18 was limited by the shearing strength of
the bolts. It is also of interest to note that the flanges of specimen
17 were oiled to prevent the development of any bond between the steel
and concrete.
Typical load-slip curves are shown in Figure 2 and it is apparent
that there is practically zero slip in the connection until friction is
I I I I I I I I I I I I I I I I I I I
3
overcome.
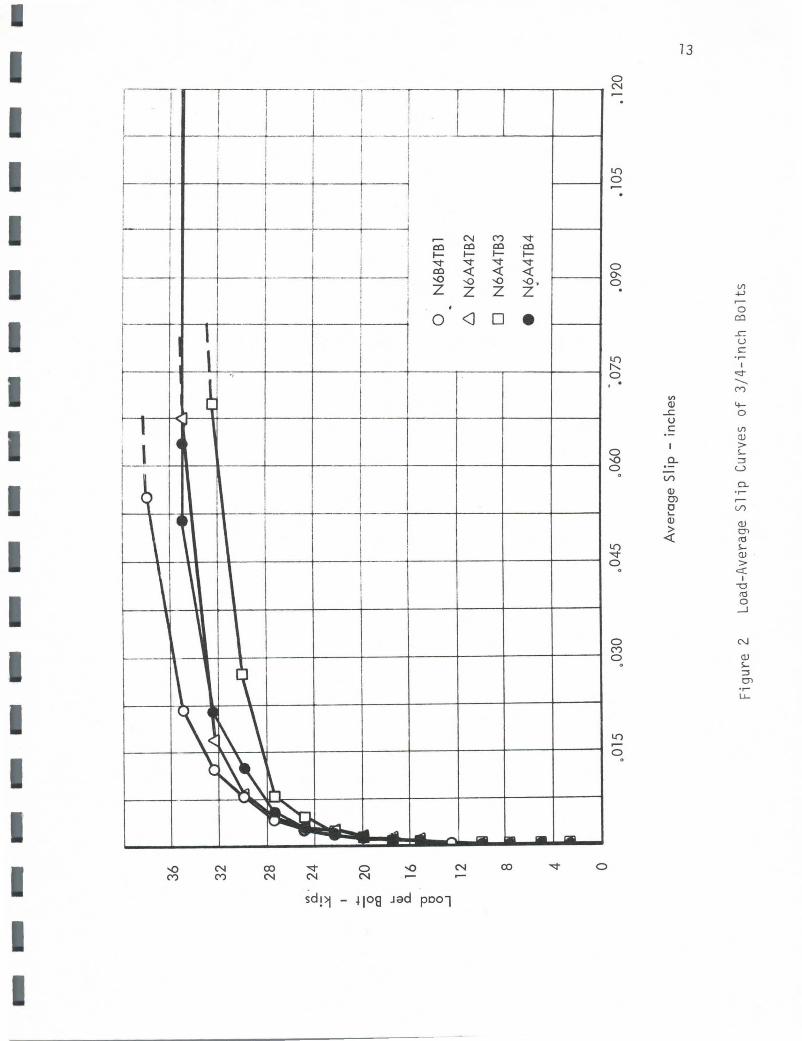
Beam Tests - The details of the beams are shown in Figure 3 and
Table 2. The purpose of the tests was to: (A) compare elementary beam
theory with experimental behavior, (B) compare the behavior of the
bolt as a shear connector in a beam with its behavior in the pushout
specimen, and (C) to compare ultimate strength theory with experimental
behavior.
(A) Elementary beam theory assumes no slip between the concrete
slab and steel beam. Figure 4 shows the distribution of measured slip
along beam NFB4B2 and is typical of the six beams tested. It is noted
that there was essentially zero slip throughout the elastic range of
the beam. Since there was practically no slip in the elastic range,
the predicted instantaneous deflection and strain values based upon
complete interaction should have compared very favorably with the
measured values and Figures 5,6 and 7 show this to be true. The
variations in Figure 5 are due to the number of connectors in each
beam. Beams NFB4Bl and NFB5Bl were designed to fail in the connector
and NFB4B2 was not.
(B) An important aspect of this phase of the testing program was
to measure the force and slip in a connector in the beam and compare
this relationship with that of a connector in a pushout test. Figures
8, 9, 10 and 11 show these comparisons. Because the connection is
the friction-type, it is not surprising that the behavior in the
working range (before friction is overcome) in the beam is almost
exactly the same as that in the pushout. The load-slip behavior
beyond the critical load also compares favorably with that of the pushout,
especially for the 1/2 and 5/8-inch diameter bolts in Figures 8 and 9.

I I I I I
I I I I I I
I I I I I I
4
The 3/4-inch diameter bolts (Figures 10 and 11) appear to be stronger in
the beam than in the pushout, but, as previously discussed, this is
because the beams had two layers of reinforcing steel in the slab
(top and bottom) whereas the pushouts only had one layer (top). The
measured ultimate force in the connector was about 50 kips in the beam
test (Figures 10 and 11) which compares very favorably with the ultimate
load of 50.0 and 52.2 kips obtained in the pushout specimens that had
two layers of reinforcing steel in their slabs.
(C) The composite beams were analyzed using the usual ultimate
strength theory (5) for beams with adequate connectors or a modified
version for beams with inadequate connectors (6), whichever was applic
able. The calculated and measured ultimate loads are listed in Table 3
where it is seen that in the first three beams (1/2-inch or 5/8-inch
diameter bolts) there is very good agreement between the calculated and
measured values. However, in the last three beams (3/4-inch diameter
bolts) the measured load is much higher than the calculated, because
the values for the ultimate strength of the bolts were obtained from
the pushout tests which did not have the same percentage of reinforcing
steel in the slab as did the beam (seep. 3). If an ultimate strength
of 50 kips per bolt is used, then the values under 11 adequate connection 11
would be applicable and they compare favorably with the measured values.
Table 4 further demonstrates the accuracy of both the elementary
beam theory and pushout tests in predicting the behavior of composite
beams when bolts are used as shear connectors. The calculated (predicted)
load at which friction is overcome is based upon pushout test results
and e.l ementary beam theory (complete interaction and a transformed
section). It is seen that the predicted load is quite close to the

I I I I I I I I I I I I I I I I I I
measured load.
Negative Moment Region
5
Pushout Tests - Eight pushout specimens were prepared such that
the slab would be in tension (Figure 12). The results of the tests
are shown in Table 5 and compare favorably with the compression push
out test results (Table 1). The load-slip relationship (see, for
example, Figure 13) is also similar to that of the compression push
out specimen.
Beam Tests - Three composite overhanging beams were tested to
detennine the behavior of the composite section in the negative
moment region. The test beam details are shown in Figures 14, 15, 16
and 17. Beam NCB6Bl was designed as composite in the negative moment
region with an inadequate amount of reinforcing steel to develop the
ultimate possible moment capacity of the section (that is, to fully
yield the steel beam section). Beam NCB6B2 was similar to NCB6Bl
except no shear connectors were placed in the negative moment region.
Beam NCB6B3 was designed with sufficient reinforcing steel to fully
yield the steel beam section (theoretically).
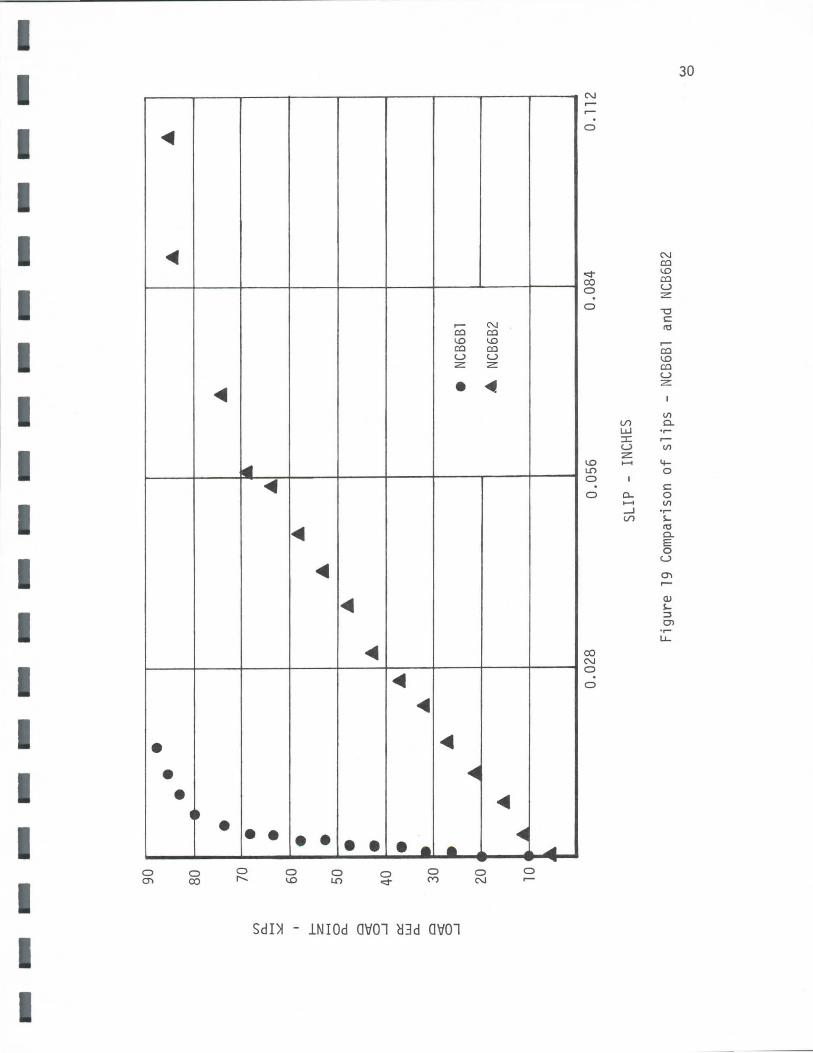
It is of particular interest to compare the behavior of beams
1 and 2 (with and without shear connectors in the negative moment region)
as to the degree of composite action developed. From a comparison of
deflections (Figure 18) at the working load of NCB6Bl (about 32k), the
beam without connectors experienced 28% more deflection than the beam
with connectors. A more graphic picture of the degree of composite
action in each beam is shown in Figure 19, where the slip at the inter
face of the slab and steel beam is plotted at a point eight inches to
the right of the support for each beam. It is clearly apparent that

I I I I I I I I I I I I I I I I I I I
6
the shear connectors were performing as indicated by the tension push
out tests and almost full composite action is present in the working
range of the beam.
This observation holds true for the third beam tested as seen in
Figures 20 and 21, which show the deflection curve and strain profile
(eight inches to the right of the support).
A comparision of predicted and measured values of working, first
yield and ultimate load is given in Table 6. The agreement is very
good, considering that the predicted or theoretical values are based
upon a fully cracked slab and therefore neglect the tension in the
slab between cracks . Beam NCB6B3 did not quite attain the predicted
ultimate load because of premature failure by buckling of the bottom
flange of the steel beam section.
FATIGUE BEHAVIOR OF CONNECTOR
Pushout Tests Ten pushout specimens (Figure 1) were subjected to
repeated loading in order to determine the fatigue life of 3/4-inch
diameter high-strength bolts. The main variables were the range of
shear stress in the bolts and the strength of the concrete. Of the
ten specimens tested, two were damaged by inadvertent overloading
and the results of the other eight are shown in Table 7. The following
observations can be made from these tests:
(1) the concrete strength was not a factor in the fatigue life
(2) the high-strength pretensioned bolt did not fail at load
ranges below the critical load of the bolt (friction not overcome) and
applied ten million times.

I I I I I I I I I I I I I I I I I I I
7
In only one specimen (N6F4TB3) was a fatigue failure obtained and
that by loading considerably beyond the critical load. This specimen
had also been subjected to ten million cycles in the working range and
700,000 cycles at a range of stress of 40 ksi before the final failure
range of stress (54.6 ksi) was applied .120,000 cycles.
Specimen N6F4TB7 was loaded to its critical load (22.98 kips)
two million times without failure.
Continuous Beam Tests Two, full-scale, two-span-continuous beams
were tested under fatigue and static loading. Both beams had shear
connectors in the positive moment regions but beam NCB6FB1 (Figure 22)
did not have connectors in the negative moment region whereas beam
NCB6FB2 (Figure 23) did.
Each beam was loaded to its approximate working load two million
times with no apparent distress in the connection or in the tension
flange of the steel beam over the center support of NCB6FB2 (there
were holes in the tension flange). The reason for this absence of
distress in the connection and in the tension flange with holes is
that the shear force at the interface was less than the critical load
of the bolts and therefore friction was not overcome and there was
practically no slip. It should be noted that the number and spacing
of the connectors was detennined using an allowable value of 20 kips
per bolt and a maximum spacing of 24 inches. This means that there
was essentially no factor of safety against slip in the test beams.
Upon conclusion of the fatigue loading, each beam was loaded
statically to attain the anticipated ultimate negative moment at the
center support and to compare the behavior of continuous composite
beams with and without shear connectors in the negative moment region.

I I I I I I I I I I I I I I I I I I I
8
The behavior will be discussed in tenns of deflection, strain, slip,
distribution of bending moment and degree of cracking.
(1) Deflection - The midspan deflection of beam #1 (without
connectors) was 11% greater than beam #2 (with connectors) in the working
range of the beams (Figure 24).
(2) Strain - A comparison of the strain at a section 35 inches
from the center support is shown in Figure 25. The strain in beam #1
is about 20% greater than that of beam #2, in the working range.
(3) Slip - Figure 26 very clearly shows the great difference in
slip in the two beams and the effectiveness of the shear connectors
in beam #2. It is also of interest to compare the load-slip behavior
of the first pair of connectors in the positive moment region of beam
#1 with those at the same location in beam #2 (Figure 27). It is seen
that the connectors in beam #1 (no connectors in negative moment region)
must carry much more force than those in beam #2.
(4) Distribution of Bending Moment - The placement of shear con
nectors in the negative moment region of a continuous beam will in
crease the moment of inertia of the section in that region and therefore
the bending moment should also increase. Figure 28 shows that there
was an increase in moment in beam #2 (compared to beam #1) of about
7% at its working load and also shows that the moment in beam #1 is
slightly larger than the theoretical moment, due to the existence of
some composite action.
(5) Degree of Cracking - The effect of placing high-strength bolt
shear connectors in the negative moment region on the cracking behavior
of the slab was to reduce the number of cracks formed but to increase
their width (Figure 29). That is,to design compositely in the negative

I I I I I I I I I I I I I I I I I I I
9
moment region wil l produce fewer but wider cracks. The maximum crack
width at the working load of beam #2 was .4mm (.016 inches), which is
not serious.
DESIGN RECOMMENDATIONS
A. Shear - From the results of this testing program, it is
evident that fatigue consideration is not the governing factor in the
design of the connection between the concrete slab and the steel beam.
It is also evident that elementary beam theory using the transformed
section is quite accurate in predicting the behavior of the composite
girder. It is therefore recommended that the horizontal shear to be
transferred by the shear connectors be computed by the formula
s = YQ I
whose terms are identical to those in section 1.7. 101 of the 1965
AASHO Standard Specifications for Highway Bridges.
It is recommended that the allowable design load "Z" of a 3/4-
inch diameter A325 high-strength pretensioned bolt embedded a minimum
of four inches in a concrete slab whose 28-day compressive cylinder
strength is at least 4000 psi, be as follows:
Z = 12.00 kips per bolt
and this value be used in both the positive and negative moment regions.
This value (Z = 12.0) was determined by applying a factor of .55
to the average critical load (22 kips) determined from pushout tests.
The application of the factor .55 results in the same factor of safety
against significant slip in the connection as is present in the beam
against yielding (.55F ). It also insures that a sufficient number of y
I I I I I I I I I I I I I I I I I I I
10
connectors would be present to develop the ultimate moment capacity
{positive or negative) of the composite section without failure in the
connection.
It is further recommended that additional connectors be placed in
girders designed non-compositely in the negative moment region. The
number of additional connectors required at points of contraflexure
when reinforcement steel embedded in the concrete is not used in
computing complete section properties for negative moments could be
computed by the formula: A f
N =~ C 2
where N = the number of additional connectors at the point of C
contra flexure.
As= the area of longitudinal reinforcement steel over an interior support contained within the effective flange width of the concrete slab.
fs = the allowable design stress of the slab reinforcement.
Z = the allowable design load of the high-strength bolt connector.
These additional connectors should be placed at the point of dead load
contraflexure, centered about it, and spaced longitudinally at about
six inches.
B. Spacing - The required spacing of the bolts is determined by
dividing the resistance of all bolts at one transverse girder cross
section (~Z) by the horizontal shear S per linear inch, The minimum
spacing should be about six inches and the maximum 24 inches.
The minimum transverse spacing of bolts shall be four inches and
where slabs are haunched, the distance from the edge of the bolt to
the beginning of the haunch taper at the elevation of the steel beam
flange shall be not less than the embedded length of the bolt.

I
I I I I I I I I I I I I I I I I I
11
C. Installation - The preparation of the holes and the tensioning
of the bolts shall conform with the current specifications (7) for
structural joints fastened by high-strength bolts. It is recormnended
that the bolts be tightened only after the concrete has attained a
minimum of 75% of its 28-day cylinder compressive strength.
D. Fatigue Stress in Steel Beam - It is recommended that the
allowable fatigue stress in the flange of the steel beam be determined
according to the current AASHO Specifications for 11 Base Metal adjacent
to friction type fastener 11•

I I I I I I I I I I I
I I
Wlr1es
µ--r;--
ELEVATION
. · ..... ;;.~·-. • ••I .,,, . .
• V • . . . : fJ : . : <(f · • • • . . . .
w SECTION A-A
Figure l Detail of Pushout Specimens
12
----
--
----
--36
I -
TlI
-1:
----..-
-J
r=
1-_,
----
--
32
28
a_'
24
~
I .... 20
0 co
... Cl)
v--
-----
rt'
-n-~
-"
·-t-
--I
~ V
..
~~
J ----
---·-
'~
.r
I rt
--+~J
I I
·--
----
l I
c..
16
-u
0 0
----
------
--
----
t --
-ti
N6B
4TB
1 I
. 0
_J
12
~
)
6 N
6A
4T
B2
y
8 0
N6
A4
TB
3
I I e
N{>
A4T
B4
4 i
0 .0
15
.03
0
.045
.0
60
·.0
75
.09
0
.105
• 1
20
Av
erag
e S
lip
-in
ches
__
, w
Fig
ure
2 L
oad-
Ave
rage
S
lip
Cur
ves
of 3
/4-i
nch
Bol
ts

I I I I I I I I I I I I I I I I I I
p
/2W-27
s'-o" s '-o"
12 SERIES
p p
2/W-5S
..Je 4'-0 11 4'-0 11
21 SERIES
SECTION A-A
1fseARS@ :ff3BARS @ 10 11
1011
TOP AND o BOTTOM ex,
2~5 BARS @I0 11EACH
0 C\I
SI DE .. rzzt.~ ______ _.__
SECTION 8-8
Figure 3 Details of Composite Beams.
14
12 11
~1211

--
---
---
---
-0
.25
I •
• •
• •
• 2
0 K
W
OR
KIN
G
LOA
D
• 0
.20
~
• 3
4.I
K
SL
IP L
OA
D
• o
38
K
YIE
LD L
OA
D
• •
50
.2K
U
LTIM
AT
E L
OA
D
I (/
) 0
.15
lL
J X
I •
0 z - I £l.
0.10
..J
(/
) I
•
0.0
5
0 If
I P
I
ffl
>P
I H
I
P
I H
I
P
I JI
W
P
I
p
10
8 6
4 2
0 2
4 6
8 10
N
OR
TH
D
IST
AN
CE
F
RO
M
CE
NT
ER
LIN
E -
FE
ET
S
OU
TH
__
. u
,
Figu
re
4 S
lip
Dis
trib
utio
n A
long
Bea
m N
FB4B
2

-------------------
50
r
• •
CO
MP
LE
TE
•
• IN
TE
RA
CT
ION
6
• •
• 4
0
• •
• •
• en
•
Q.
• -
• •
~
• •
• •
I 3
0
• •
-~
(.)
I I
• <
(
201
r /WO
RK
ING
LO
AD
J a::
: 2
0 K
IPS
w
Q
.
f N
FB
4B
I •
C
<(
• N
FB
4B
2
0 Io
rr
....J
• N
FB
5B
I
0--
----
----
....
....
._ _
__
__
__
__
__
__
_ 0
0.8
1.
6 2
.4
3.2
4
.0
4.8
5
.6
6.4
__.
MID
-SP
AN
D
EF
LE
CT
ION
-IN
CH
ES
°'
Fig
ure
5 Lo
ad
Vs.
Def
lect
ion
for
12 S
erie
s

----
----
----
----
-5
0 I
••
• •
• ..
CO
MP
LET
E
• •
• •
• 4
0
INT
ER
AC
TIO
N
• •
• en
..
• •
a..
• •
• •
-•
~
•••
I 3
0
... ~
... 0
• <X
-:
, a::
2o
r ~
WO
RK
ING
LO
AD
L1
J a..
1r15K
IPS
• N
F8
68
1
C
• N
F 8
68
2
<X
0 IO
I /
• L
F 8
68
1
--'
0--
----
----
----
----
----
-._
__
_ .......
0 2
3 4
5 6
7 8
MID
-SP
AN
D
EF
LE
CT
ION
-IN
CH
ES
_
. -..
.J
Fig
ure
6 Lo
ad
Vs.
Def
lect
ion
for
21
Ser
ies
_.

-- Cl)
18
uJ
:c
1
6r ~
0 2 • 14
t ~
2 0 I-12
0 uJ
C
l)
10
uJ
I- - Cl)
8 0 0
-~
6~
~
0 0 lL
4 0 :c
2~
~ I- 0
-uJ
0
0 -0
.00
.06
---
---
----
---
-0.0
00
3
0 S
TR
AIN
TH
EO
RE
TIC
AL
E
XP
ER
IME
NT
AL
1-2
0 K
2
-34
.1 K
3
-38
K
4-5
0.2
K
• 2
0K
•
34
.IK
0
38
K
• 5
0.2
K
0.0
00
3
0.0
00
6
0.0
00
9
0.00
12
0.00
15
AC
RO
SS
S
EC
TIO
N-
INC
HE
S
/ IN
CH
Figu
re
7 S
trai
n P
rofi
le a
t S
ecti
on
43.5
in
ches
fr
om
Sout
h En
d of
NFB
4B2
0.00
18
__,
CX
)

----
----
---
----
--2
0
16
0 6
o o
• •
Cl)
Cl.
~
12 1 •
• A>
•
IP
I I
B A
a::
I
/o
0
~/.
~ 9
" .....
(.
) 1
0'-
0"
w
z z
8 !
0 •
N4
B4
TB
6
(.) a::
• N
48
4T
B7
w
4~
N4
B4
T8
S
Cl.
• w
F
e -F
A
(.)
0 0:
: 0
-A
VE
RA
GE
O
F P
US
HO
UT
S
LL
0-----..
....
._ _
__
__
__
_..._
__ _
__
__
__
_
0 0
.03
0
.06
0
.09
0.
12
0.15
0.
18
0.21
0
.24
S
LIP
-IN
CH
ES
__
. I..
O
Fig
ure
8 Fo
rce
Per
Shea
r C
onne
ctor
Vs.
Sli
p Fo
r N
FB48
2

----
----
----
----
---
40
0
30
en
(l
.
~
0
I •
• Cl:
:'. 0 •
I-~
-0
(.
)
• 1P
w
z
20
/
d B
A
z
• 0 (.
)
I •,,-
• I
10
'-o
" 0
a::
w
(l.
~ •
N5B
4TB
5 w
•
N5B
4TB
6 (.
) a::
0
10 ~'-
• N
584T
B7
LL
o F
8-F
A
-AV
ER
AG
E
OF
PUSH
OU
TS
t 0
0 0
.03
0
.06
0
.09
0.
12
0.15
0.
18
0~21
0
.24
S
UP
-IN
CH
ES
N
0
Figu
re
9 Fo
rce
Per
Shea
r C
onne
ctor
V
s. S
lip
For
NFB5
Bl

---
----
----
----
---
50
.
0
0 6
(/)
•
Q.
I 6
-4
0
~
I 0
D
a:
0 0
D
6 0
I-0
0 3
0
D
0 ~
· -
Ave
rag
e
of
Pu
sho
uts
1.1
.1 z I
0 z 0 0
20
a:
1.1
.1 Q
. -
• N
68
4T
B5
1.1
.1 1
0
• N
68
4T
B6
0
o F
-F
: a:
B
A
0
6 Fe
-F
e
u..
o F
o-F
c 0
0 0
.03
0
.06
0
.09
0.
12
0.15
0.
18
0.21
0
.24
SL
IP-
INC
HE
S
N _.
Fig
ure
10
Forc
e Pe
r S
hear
Con
nect
or V
s. S
lip
for
NFB6
Bl

----
----
---
----
---
U) a.. ~
I a:
0 ~
(.)
lJJ z z 0 (.) a:
lJJ a..
lJJ
(.) a:
0 LL
50
r 0
0
a 0
0
40
0
D
..L.
p ..L
. p
j_ p
0
I A
B
C
D
~
6
30
0 ~
32
" 1
6" 2
0"
24
" •
,..o .
Ie
12
'-o
''
6 •
L6
84
TB
I
20
•
L6
84
TB
2
0 Fe
-F
A
6 Fe
-F
e
10
0 Fo
-F
e
-A
VE
RA
GE
O
F
PU
SH
OU
TS
0-----..
..._
_ __
__
_ _.
,_ _
__
__
__
__
__
__
_ 0
0.03
0
.06
0
.09
0.
12
0.15
O
JS
SLI
P -
INC
HE
S
Figu
re
11
Forc
e Pe
r Sh
ear
Con
nect
or V
s. S
lip
for
LFB6
Bl
0.21
0.
24
N
N

I I I I I I I I I I I I I I I I I I I
STRAIN GAGE
t
--- SLIP DIALS _ .. __ .... _
A
I 5 1/3 11
---r-4- - - -t-r - -
I ---
t
---23 11
--- A 20 11 - J:..l
--1-j r --- l 011
~L--... --~....L.L------'------'T"T"-_ ....1..---1.--
411
# 4 BARS • 8"
24 11
311
# 7 BARS--....L.......-. •--------' 411
SECTION A-A
Figure 12 Details of Tension Pushout Specimen
23

I I I I I I I I I I I I I I I I I I I
4111111
rd ,-co I-<d'" I-
~ I.O z
• ...
·• ~
~
• •
LO CV)
41. ,. ' .. ~ 1
0 CV)
LO N
~ .. ~ -- ,..
0 N
...... --
SdI~ - 1109 ~3d 3J~0~
.0 ,-co I-<d'" I-I.O z
~
- - ..... _,.
"" - ....- ~
0 CV)
0
LO N
0
0 N
0
LO ...-0
0 ,-. 0
LO 0
0
(/) LLJ :c u z ......
I-__J
0 co ~ LLJ 0.
0. ...... __J (/)
24
.0
rd ,-co I-<d'" I-I.O z
0. .,.... ,-(/)
VI ::l VI s.. QJ
> -0 rd 0
__J
CV) ,-
QJ S;.. ::l m .,....
LL.

---
----
----
----
A
-0-
-0-
2/W
-55
A
@
l'""t-
---~
----
12'
16
II CO
NNEC
TOR
SPA
CIN
G
@ 1
8"
(PA
IRS)
-•
STRA
IN G
AGE
i DE
FLEC
TION
DI
AL
(j)
STRA
IN
PROF
ILE
--0
-0
SLIP
DI
ALS
PRO
FILE
@
SECT
ION
A-A -0
-
6'
p B
•
a p
-0-T
T
-0-
-0-
-0-
Q)
@(j
) B
m
~II 81
1~1~
6'
6'
_
_ __
µl'
13"
CONN
ECTO
R SP
ACI
NG
@
811
(PA
IRS)
1
6 II
1 •
1 12
.25
11
m
3.84
"
8.5
2"
10
.36
11
PROF
ILES
G
) @
Q)
SECT
ION
B-B
8.4
811
l O. 2
811
Fig
ure
14
Inst
rum
enta
tion
-NC
B6Bl
-- N
(.]1

--
----
----
---
A
-0-
-0-
-0-
?/f
f55
A
l IQ
)
l',-
--~
~~
~~
~
12'
16
II C
ON
NEC
TOR
SP
AC
ING
@
18
11
(PA
IRS
)
-•
STRA
IN
GAGE
A
DEF
LECT
ION
D
IAL
G)
STRA
IN
PRO
FILE
-0-
8 SL
IP
DIA
L
~ Q
SEPA
RATI
ON
D
IAL
PRO
FILE
Q
) SE
CTIO
N
A-A
p p
s ...
...
-0-
-0-
-0-
-0-
-0-
-0
B ,
-Cg
) I G)
~·~
a·l 6'
6
' 6
' l
1
I •
• 13
.191
1 w
,3
.8
111
8.49
11 8.
4911
l 0. 3
311
l O
. 33
11
PRO
FI L
E CD
Cg)
SECT
ION
B
-B
Fig
ure
15
Inst
rum
enta
tion
-N
CB6B
2 N
°'

----
----
----
----
---
A
-0-
-0-
-0-
ZI J.
1r"5
5
A
l' '"
t""""~
~~
~~
~
12 I
6 I
l 6
II
CONN
ECTO
R SP
ACI
NG
@
18
11
(PA
IRS)
.. •
ST
RAIN
GAG
E A
DE
FLEC
TION
DI
AL
G)
STRA
IN P
ROFI
LE
-<:>
-8
SLIP
DI
AL
~ Q
SEPAR
ATIO
N DI
AL
PROF
ILE
@
SECT
ION
A-A
B..
L
-0-
B
G)
G)
a) I
la· a"l
a•,
6'
l 3 II
CONN
ECTO
R SP
ACI
NG
(P
AIR
S)
8.70
11
~~
10. 1
211
PROF
ILES
CD
cg:
i@
SECT
ION
B-B
Figu
re 1
6 In
stru
men
tati
on -
NCB6
B3
6'
@
31
1
A
I I 1
'
l 6 II
1. 9
511
4.37
11
8.48
11
10. 2
811
N
'-J

I I I I I I
11 I I I I I I I I I I I
111 ~
NCB6Bl
111
NCB6B2
111
NCB6B3
--3611
48 11
l 211
29''
5.5 11 5.5" 5.5"
1111
28
4 I.S.@ 6 in. centers
4 H.S. ·
# 4 I.S. @ 6 in. centers
# 4 H. S.
centers # 4 H.S.
6 in.
Figure 17 Cross Sections at the Negative Supports

--10
0 80
Vl
0..
.....
. ::.::
:: 16(
) I- z:
......
0 0..
Cl
c::x:
0 _J
40
a:::
LLJ
0..
Cl
c::x:
0 _J
20· -
----
----
----
--
I I I I I
• I
l •
I I
I I
I I
I •
• I
i •••
• Co
m~l
clc.-
I •1
•
/lkr
ac l-10
. I " ~ #
o k
h~
cho
n
.i I&
/ I
I I
I e
NCB6
Bl
t~
I I
I I
• NC
B6B2
1
OVER
HANG
DEF
LECT
ION
-IN
CHES
Figu
re
18 C
ompa
rison
of
Def
lect
ions
-
NCB6
Bl
and
NCB6
B2
,. • 2
N
\0
I I I I I I I I I I I I I I I I I I
~
•
0 CJ')
~
• • 4-
0 co
~
•
~
~
~
~
• • • •
~
0 LC')
•
~
•
~
~
• • 0 (Y)
,--ca \.0 ca u z
•
~
•
SdI~ - 1NI0d OVOl ~3d OVOl
N ca \.0 ca u z
~
....
0 N
~
... ~
~
0 ,--
N ,-,--. 0
q-co 0
0
\.0 LC')
0 . 0
co N 0 . 0
30
N ca \.0 ca u z -0 t: rt!
,--ca \.0 ca u z
Vl (/) 0. LJ.J •r-::c ,--u Vl z ...... '+-
0
t: 0.. 0 ...... Vl ....J •r-(/) s...
rt! 0. E 0 u CJ') ,--
QJ s... ::, O'>
•r-LL

----
---
----
----
--1 Q
Q I
I I
el
I I
• I
I •
• • I •
-80
I CO
MPL
ETE
I
• IN
TERA
CTIO
N -•
EXPE
RIM
ENTA
L Y
I EL
DING
LO
AD
(./)
I
~I •
0...
60
-~ I
I- z: -
40 ~
EX
PE
RIM
EN
TA
L W
ORKI
NG L
OAD
0 0...
Cl
<
0 _J
0::
w
0.
..
Cl <
0 _J
20
.6
1. 2
DEF
LECT
ION
-
INCH
ES
Fig
ure
20
Ove
rhan
g D
efle
ctio
n -
NCB
683
1. 8
w
_,

----
----
----
----
---
24
L-
co
<(
__
J
Vl
I V
l 21
w
:c
u z .....
. 18
z 0 .....
. I-
15
u w
Vl
w
I-
12
.......
V)
0 Q..
gl ~
:::
E <
(
0 w
u
co
LL.
0 :c
6 I-
Q..
w
C
l
3
1200
-. TH
EOR
. EX
P.
CD
• 0
•
800
400
0 -4
00
STR
AIN
-
(IN
CH
ES/
INC
H)
x 10
6
Fig
ure
21
S
train
P
rofi
le
-N
CB68
3
WOR
KI ~I
G L
(no
YIE
LDIN
G
LOA:
:J
-800
-1
200
w
N

---
---
-p
SYM.A
? p
2 2
?I f
tr5
5"
2"
40
11
16
'+1
74
--3
5"
l811
r5
911
108
11
10
811
~1
.. 4
@2
411
1s
j1or
-3@
9"
f---
48
11
~
11~-
4@11
11
-11
2
.06
11
T,I :
;
";·': •r
~,\:
U I
4.3
1"
4.8
8"
___t
__
• :!
I! •
~ I
I I
I • l 0 •
LO
AD
C
EL
L
DE
FL
EC
TIO
N
DIA
L
0.0
01
11
DIA
L
0.0
00
111
D
IAL
GD2
PE
R
CR
OS
S
SE
CT
ION
ST
RA
IN
GA
GE
Fig
ure
22
Dim
ensi
ons
and
Inst
rum
enta
tion
of
NCB6
FB1
--
w
w

--
----
----
---
---
p
~
?IW
-55
2"
40
11
1 sll+1
1t1e"
108"
----~
~----
, .
. sf 14·t
~ 1e4g ,.
_.__
1
----
48
11
I 11
--··
4
@1
1"
., .
. ~
1.44
11
----
4@
) 2
4 "---
3@9"
10
811
P
>t
.. LO
AD
C
EL
L
A
DE
FLE
CT
ION
D
IAL
0 0
.00
1"
DIA
L
• 0
.00
01
" D
IAL
•2 P
ER
C
RO
SS
S
EC
TIO
N
-S
TR
AIN
G
AG
E
6" I e
I
,,
• ,,
-~ e
II
II
_j_
I
:t/J
L
• v
t t1
-2~0
6~.3
( 4
.88
I
< T
t
f f
20
.66
11
IL
"' ""
'""'
'--#
5
#4
#5
n 1
0.3
411
!
Figu
re 2
3 D
imen
sion
s an
d In
stru
men
tati
on o
f NC
B6FB
2 u.>
,i>

----
----
----
----
---
20
0
• •
• •
• (/
) a.
• •
~
150
I ••
I- z 0
••
a.
01
00
<
l ••
FUL
L
0 ...J
• a:
: N
O
w
~TEy:~
INT
ER
AC
TIO
N
• a.
0 <
l 0 ...
J
50
/•
;)
0 0
0.2
0
.4
0.6
MID
-S
PA
N
DE
FL
EC
TIO
N -
IN C
HE
S
Fig
ure
24
Def
lect
ion
at L
oad
Poi
nts
•
NC
B6
FB
I
NC
B6
FB
2
0.8
1.
0
w
Ul

----
----
----
----
---
CJ)
w
:::c
0 z I
24
z 18
0 .... 0 w
C
J)
w
t-12
C
J)
0 a.
::E
0 0 u...
6 0 :::c
.... a.
w
m
c:i
....J
CJ)
TH
EO
RE
TIC
AL
EX
PE
RIM
EN
TA
L
~
c:i w
m
Ci)
0 N
CB
6F
Bl(
ci)
70
K
@
• N
CB
6F
B2
(a)
70
K
@
6 N
CB
6F
BI
(a)
12
0k
@
&
NC
B6
FB
2(a
) 12
0K
/1
I ///
0 Q
I
I I
<
1 ll
A
I O
A
I
l I
I I
I I
-40
0
-30
0
-20
0
-10
0
0 1
00
2
00
3
00
ST
RA
IN
AC
RO
SS
S
EC
TIO
N -
(IN
CH
ES
/ I N
CH
) x
IO 6
Figu
re 2
5 W
orki
ng
Str
ain
Pro
file
at
Sec
tion
C
w °'

----
----
----
----
---
Cl)
La
J :I
: u 2 - I Cl. - ....J
Cl)
.01
50
r------------------------------
.01
00
.00
50
ol --
~--·-·'
· ..
. ---
---I
"-o
-'"
' p
= 7
0K
-.0
05
0 ~
~
NC
B6
FB
I
-•-
NC
B6
FB
2
16
12
8 4
l 4
8 12
16
DIS
TA
NC
E
FRO
M
CE
NT
ER
S
UP
PO
RT
-
FE
ET
Fig
ure
26
Sli
p D
istr
ibut
ion
at W
orki
nq
Load
of
NCB
6FB1
w
'.
J

----
----
----
----
---
20
0
U)
CL
15
0
- :::.:: I .....
2 •
0 CL
10
0 ._.
0 <1'.
0 •
&
...J n::
w
50
CL
•
&
0 ••
<1
'. 0 _
J
• 0
0
• •
&
&
• &
• &
&
p I
1 A
t
A
. &
'
. .
r 59
'~5
9'-
!.t
&
NC
B6
FB
I
• N
CB
6F
B2
.01
.02
.03
.0
4
.05
AV
ER
AG
E
SL
IP
AT
S
EC
TIO
N
11A
11-
INC
HE
S
Fig
ure
27
Loa
d-S
lip
at a
Typ
ical
C
onne
ctor
& p l .06
.. l
.07
.t
w
CD

----
----
----
----
---
20
0t---------------------t-----+
----
,< I
•
• I 5
0 t------+
------+
-----+
------'7
""'1
t--......-'-
---t-----+
--------1
en
a..
~ /
I /
~
/. z
10
0
/ 0
•
•
a..
. T
HE
OR
ET
ICA
L
EX
PE
RIM
EN
TA
L C
<
( 0 _
J
a:
w
a..
C
<(
0 _J
NC
B6
FB
I •
50
1------+
----,.
-""--+
-----+
-~
N
CB
6F
B2
•
0 -------------'-
----'-
----...._
_ _
_ __
_._ _
__
--J.-_
_ __
_.
0 1
00
0
20
00
3
00
0
40
00
5
00
0
60
00
7
00
0
NE
GA
TIV
E
MO
ME
NT
O
VE
R
CE
NT
ER
S
UP
PO
RT
-I N
CH
-K
IPS
Fig
ure
28
App
lied
Load
vs
N
egat
ive
Mom
ent
l.,J
I.O

----
--M
ax.
W=
.20
mm
N~
Pw
=7
0K
Ma
x.
W=
.40
mm
Pw
=IO
OK
----
----
----
Ma
x. W
= .3
0m
m
P
= 1
20
k
y
NC
B6
FB
I
Ma
x.W
=.5
8m
m
----
----
. .
. .
----
----
Py=
15
0K
NC
B6
FB
2
Figu
re 2
9 C
ompa
rativ
e C
rack
ing
Pat
tern
s
Ma
x. W
=.4
6m
m
-M--
----
p =
2Q
QK
Ma
x.W
= 1
.0 m
m
----
- . . --
--- p
=2Q
QK
.
.i:,
.
0
I I I I I I I I I I I I I I
I I I
41
TABLE 1
COMPRESSION PUSHOUT TEST RESULTS
f' No. of Layers of C * Critical Ultimate Failure Longitudinal Rein-
Specimen psi Load,Kips Load,Kips Mode forcement in Slab l N684TB1 8440 27.1 38.0 Concrete 1 2 N6A4TB2 8440 27.0 37.4 II 1 3 N6A4TB3 8440 24.0 34.7 II 1 4 N6A4TB4 8440 26.3 36.7 II 1 5 N684TB5 3720 17.8 32.6 II 1 6 N6B4TB6 3720 21. 2 31. l II 1 7 N6B4TB7 7130 21.0 37.2 II 1 8 N6B4TB8 7130 18.5 34.9 II 1 9 N6F4TB1 4121 32.5 II 1
10 N6F4TB2 4436 31.8 II 1 11 N6F4TB4 6690 18.of 32.6 II 1 12 N6F4TB5 7061 17.5f 34.0 II 1 13 N6F4TB6 6955 23.0 II l 14 N6F4TB7 8217 21. 1 35.6 II 1 15 N6F4TB8 8380 20.5f 34.2 II 1 16 N6F4TB9 8310 19.5f 33.7 II l 17 N6F4TBla 7026 20.6f 50.0 Bolts 2 18 N6F4TBlb 7522 28.4 52.2 Bolts 2
Average 22.0 Note: All bolts 3/4 11 in diameter, embedded 411 in the slab and conform to
ASTM A325-61T.
* Load at which friction is overcome f Determined after fatigue loading

--
Sp
ecim
en
(B
eam
an
d
Pu
sho
ut)
NF
B4
Bl
N4B
4TB
5
NF
B4B
2 N
4B4T
B6
N4B
4TB
7 N
4B4T
B8
NF
B5B
l N
5B4T
B5
NS
B4T
B6
NS
B4T
B7
NF
B6B
l N
6B4T
B5
N6B
4TB
6
NF
B6B
2 N
6B4T
B7
N6B
3TB
8
LF
B6
Bl
L6B
4TB
1 L
6B4T
B2
Seri
es
12
12
12
21
21
21
--
----
----
Age
at
Test
day
s
90
89
77
1
87
1
90
3
5
13
9
21
1
21
2
21
3
28
3
1
17
1
59
5
8
13
8
56
5
2
52
Tab
le
2
Deta
ils
of
Test
Bea
ms
Dia
mete
r o
f B
olt
s
inch
es
1/2
1/2
5/8
3/4
3/4
3/4
Nu
mb
er
of
Bo
lts
12
28
12
28
28
28
Heig
ht
of
Bo
lts
inch
es
4-1
/2
4 4-1
/2
4-1
/2
4 4
Sp
acin
g o
f B
olt
s
on
H
alf
o
f B
eam
2@20
"
6@9"
2@20
"
3@
16
",
2@
24
",
1@26
"
3@
16
",
2@
24
",
1@26
"
3@16
II
f 2@
24 II
f
1@26
II
Dis
tan
ce
fro
m L
ast
Bo
lts
to
cL
inch
es
70
63
70
14
14
14
~
N

I I
I I
I
I
I I
I
Specimen
NFB4Bl NFB4B2 NFB5Bl NFB6B 1 NFB6B2 LFB6Bl
TABLE 3
Comparison of Ultimate Loads
Predicted Ultimate Load
Adequate Connection
kips per jack
51. 7 53.5 53.9 40. 1 43.3 43.7
Furnished Connection
kips per jack
34.8 49.6 42.8 37. l* 39.9* 38.3*
43
Measured Ultimate
Load kips per
jack
34.9 50.2 41. 6 42.0 47.0 45.3
* Based upon an ultimate load of 33 kips per bolt (see p.4)
Specimen
NFB4Bl NFB4B2 NFB5Bl NFB6B 1
NFB6B2
LFB6Bl
Critical
TABLE 4
Load of Shear Connectors*
Measured Load per Jack
~
17.4 34.1 24.6 26.0 26.0 29.7
* Load on beam when friction is overcome in connection
Calculated Load per Jack
kips
16. 5 34.9 24.2 27.0 25.3 31. 1

I I I I I I I I I I I I I I I I I I I
Specimen
N6T4TB1a N6T4TB1b
N6T4TB2a N6T4TB2b
N6T4TB3a N6T4TB3b N6T4TB4a N6T4TB4b
TABLE 5
TENSION PUSHOUT TEST RESULTS
f' C
Critical Load psi Kips
7953 23.8 7953 19. 7 8292 19.0 8292 19.3
6523 17. 4 6523 20.8 6700 22.6 7168 22.3
Average 20.6
44
Ultimate Load Kips
34.4 37.3
38.2 30.2
27.5 32.7 30.9 31. 5 32.8

I I
45
I TABLE 6
RESULTS OF BEAM TESTS
I NCB6Bl Theoreti ca 1 Experimental
I Working Load 31.6 (kips) 33.0 (kips)
I Yielding Load 59.8 52.5
Ultimate Load 80.8 87.3
I I NCB6B2 Theoretical Experimental
I Working Load 27.5 27.3
Yielding Load 53.9 52. 1
I Ultimate Load 66.2 84.7
I I
NCB6B3 Theoreti ca 1 Experimenta 1
I Working Load 36.7 39. l
I Yielding Load 65.5 67.3
Ultimate Load 103.5 l 01. 3
I I I I I

11 I I I I I I I I I I I I I I I I I I
TABLE 7
FATIGUE RESULTS OF PUSHOUT TESTS
f' Load Range C Min Max. S* Specimen
psi K/Bo lt K/Bolt Ksi
N6F4TB1 4121 .885 5.30 10.0 .885 14. 14 30.0
N6F4TB3 4253 .885 18.58 40.0 .885 25.00 54.6
N6F4TB4 6690 4.425 17.68 30.0 N6F4TB5 7061 .885 18.58 40.0 N6F4TB7 8217 .885 22.98 50.0 N6F4TB8 8380 .885 15.30 32.6 N6F4TB9 8310 .885 15.30 32.6 N6F4TB1 a 7026 .885 15. 30 32.6
* Range of shear stress in bolt
46
No. of Cycles Failure
X l 06
5.00 - - - - ~ -- - · H
10.00
0.70
0. 12 Bolts 10.00 2.40 2.00 2.00 2.00
2.00

I I I I I I
I I I I I I I I
I I I
REFERENCES
1. Dallam, L. N., "Pushout Tests With High-Strength Bolt Shear Connectors", Missouri Cooperative Highway Research Program Report 68-7, Engineering Experiment Station, University of Missouri-Columbia, 1968.
47
2. Dallam, L.N., and Harpster, J. L., "Composite Beam Tests With High-Strength Bolt Shear Connectors", Missouri Cooperative Highway Research Program Report 68-3. Engineering Experiment Station, University of Missouri-Columbia, 1968.
3. Dallam, L. N. and Gaudini, P.B., "Static Behavior in the Negative-Moment Region of Composite Beams Using Bolts as Shear Connectors", Missouri Cooperative Highway Research Program Report 69-3, Engineering Experiment Station, University of Missouri-Columbia, 1969.
4. Dallam, L. N., and Guran, R., "Static and Fatigue Behavior of Continuous-Composite Beams with High-Strength Bolts as Shear Connectors'', Missouri Cooperative Highway Research Program Report 70-1, Engineering Experiment Station, University of Missouri-Columbia, 1970.
5. Slutter, R. G. and Driscoll, G. C., Jr., "Flexural Strength of Steel and Concrete Composite Beams", Journal Structural Division, ASCE, Vol. 91, No. ST2, April 1965, p.84.
6. Ibid. p. 91
7. 11 Speci fi cati ans for Structural Joints Using ASTM A325, or A490 Bolts", American Institute of Steel Construction, Research Council on Riveted and Bolted Structural Joints of the Engineering Foundation, New York, 1964.

I I I I I I I I I I I I I I I I I I I
APPENDIX
PUSHOUT NOTATION
There were three types of pushout specimens tested in this investi
gation: compression, tension and fatigue. In each type, the first
letter indicates the kind of concrete used; N for normal weight or
L for lightweight. The second character is a number which denotes
the diameter of the bolt in eighths of an inch. The third character
distinguishes between the three types of specimens; B denotes the
compression specimen, T the tension specimen and F the fatigue
specimen. The next character is a number indicating how many bolts
were on the specimen. The next two letters, TB, stand for a tensioned
bolt, that is, a pre-tensioned high strength bolt, to differentiate
the specimen from others using a different type of connector. The
last character(s) distinguish between specimens with otherwise
identical notation.
For example, an N6F4TB2 pushout specimen had slabs made of
normal weight concrete and were connected to the steel beam stub
by four 6/8-inch diameter high strength pre-tensioned bolts. The
specimen was tested under fatigue loading and was the second of
a series.
BEAM NOTATION
There were three types of full-scale beam specimens: simple
span, overhang and two-span continuous. Each was designed to test
the shear connection with a particular type of loading: that which
produces static positive curvature, static negative curvature and

I
I I
I I I I I I I I I
I I
fatigue and dynamic positive and negative curvatures. The adopted
notation reflects the type of concrete used in the slab, the type of
beam, the diameter of the shear connector, the type of loading and
the type of connector.
Simple Span Series - NFB5Bl - The first letter denotes the type of
concrete (normal weight, N, or lightweight, L); the next two, FB,
indicate that the specimen is a full-scale simply supported beam.
The next character is a number specifying the diameter, in eighths of
an inch, of the shear connectors. The next letter, B, indicates that
the connectors are bolts and the final character is a number which
distinguishes between beams with otherwise identical notation. The
loading is, in all cases, static.
Overhang Series - NCB6Bl - The notation is identical to the simple span
beams, except for the second letter, C, which indicates that the beam
is continuous over one support.
Two-Span Continuous Series - NCB6f.Bl - The notation has the same meaning
as the other beam series, except the letter F was inserted to indicate
that the loading was repeated and dynamic (fatigue) in nature and that
the beams were two-span continuous.

'II~
r,,,.--. -
t ·-
TE
5092.M8A
3 I 1'\'.
no. 7
0-Z
~
---------------------
. Form
DO
T
F 17
"OR
.ME
fl.\.."1
FO
RM
I