thyroid sonography in 3d with emphasis on perfusion
TRANSCRIPT

16
Thyroid Sonography in 3D with Emphasis on Perfusion
Roy Moncayo and Helga Moncayo WOMED, Innsbruck,
Austria
1. Introduction
Ultrasound examination of the thyroid gland is an essential diagnostic element in daily clinical practice. The aim of this chapter is to describe the advanced clinical value of conducting 3D ultrasound examinations putting emphasis on the quantitative evaluation of perfusion characteristics of the thyroid gland and to relate these results to therapeutic interventions aimed at diminishing inflammation.
2. Historical aspects of ultrasound
The term echo (Greek: Hχώ, Ēkhō; "Sound") refers to the persistence of sound after its source has stopped. Greek mythology tells from an Oread (a mountain nymph) who pined away for love of Narcissus (in Ovid, Metamorphoses). The phenomenon of air being sent back by a wall was described by Aristotles (384-322 BCE). The Greek word echo came into German writings in the 16th century. Athanasius Kircher (1602 – 1680) used the principle of “Echometria” to determine the depth of a well. His book was entitled: “Neue Hall- und Thon-Kunst oder Mechanische Gehaim-Verbindung der Kunst und Natur durch Stimme und Hall” and appeared 1684. At this time he was able to measure the speed of sound propagation.
On May 25th, 1842 Christian Doppler (born in Salzburg, Austria) presented in Prague his talk on “Abhandlung Über das farbige Licht der Doppelsterne und einiger anderer Gestirne des Himmels“ (Eng. On the coloured light of the binary stars and some other stars of the heavens) at the Prague Polytechnic [1]. The Doppler effect is a main stand of many examinations today.
In 1880 Pierre and Jacques Curie discovered the piezoelectric effect and postulated the generation of ultrasound waves [2]. They found that applying an electric current to a crystal would produce a vibration which could in turn produce sound waves. In turn, sound waves striking a crystal would produce an electric voltage. In 1917 Langevin constructed for the first time a piezoelectric ultrasound transducer based on quartz elements and which was called sandwich-style. This product was oriented towards military use in World War I, i.e. the detection of submarines. The Langevin-type transducers were utilized in depth sounding devices [3]. More details on the work of Langevin is found elsewhere [4]. In 1921 Behm in Vienna described the Echolot which was used to determine the water depth for ships [5].
www.intechopen.com

Sonography
274
Source: http://echo.mpiwg-berlin.mpg.de/ECHOdocuView?url=/mpiwg/online/permanent/library/ 1EZGRF6Y/pageimg&viewMode=images&pn=6&mode=imagepath
Fig. 1. An image from Kircher’s book depicting air reflection
www.intechopen.com

Thyroid Sonography in 3D with Emphasis on Perfusion
275
Source: http://en.wikipedia.org/wiki/File:Christian_Doppler.jpg
Fig. 2. C. Doppler, born november 29th, 1803 in Salzburg, public domain
Following these fundamental developments, clinical applications began to develop. The first clinical applications of ultrasound are credited to the Austrian neurologist Karl Theo Dussik [6]. In the introduction of his article he mentions that he was motivated to investigate the medical importance of ultrasound in 1937 after having read a review on use of underwater ultrasound techniques (Echolotung) as well as the use of ultrasound for the detection of material flaws in industrial settings by Sokolov [7]. He goes on to discuss the properties of auscultation, which in the end works because changes in tissue density, relative water content, and colloidal structure have occured. Further references on the basic physics of ultrasound can be found in the paper. The initial clinical indications according to Dussik were the ventricle system of the brain and the spinal bones in a procedure called hyperphonography. Further fields of application were liver, kidneys, testicles, and the extremities.
Some of the data mentioned above have been extracted from the publication by Frentzel-Beyme [8]. Additional information has been obtained via Wikipedia.
2.1 Modern history of ultrasound including thyroid examinations
General articles on the historical aspects and developments of ultrasound can be found in recent publications [8-10]. In addition to this some useful clinical publications on thyroid examinations are those of Ruchala and Szczepanek [11] and Sholosh and Borhani [12]. The physics of ultrasound have been presented by Kossoff [13].
In the 1950’s Howry and Bliss presented their device which was used for the ultrasonic visualization of body soft tissue structures [14,15]. Some interesting images can be found in their publication [15]: Figure 3 shows the apparatus called “Somascope”. Due to its use of a cattle drink tank it was also called the “cattle tank scanner”. Figure 4 in shows the anatomical structures of the neck at the C5 level. Figure 5 depicts the findings of a case thyroid carcinoma where liver metastases were present.
www.intechopen.com

Sonography
276
Fig. 3. Case 1. Normal thyroid seen in 3-D power Doppler modus using a vaginal transducer. The thick vessel corresponds to a laryngeal artery
Fig. 4. Case 2. Chronic recurrent thyroiditis in 3-D power Doppler modus using a vaginal transducer. Note the increased vascularity as compared to Figure. 3
www.intechopen.com

Thyroid Sonography in 3D with Emphasis on Perfusion
277
Fig. 5 (a-f). Case 3. Both lobes of a normal thyroid shown in gray, color, and power Doppler modus. The VFI value of 0.09 is reflected by the almost complete absence of perfusion signs. Such cases do not require quantitative evaluation of perfusion
www.intechopen.com
Sonography
278
(a) (b)
(c) (d)
(e) (f)
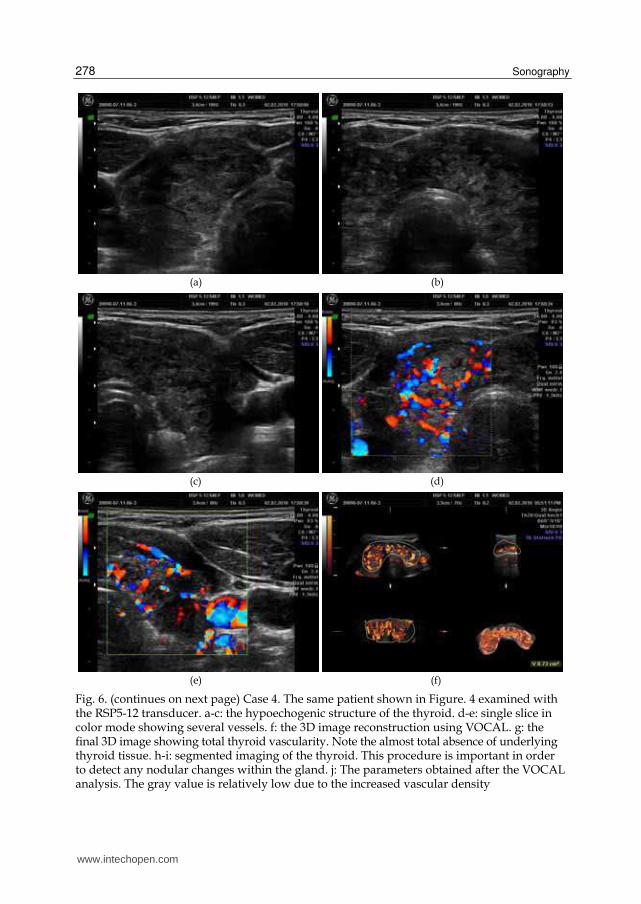
Fig. 6. (continues on next page) Case 4. The same patient shown in Figure. 4 examined with the RSP5-12 transducer. a-c: the hypoechogenic structure of the thyroid. d-e: single slice in color mode showing several vessels. f: the 3D image reconstruction using VOCAL. g: the final 3D image showing total thyroid vascularity. Note the almost total absence of underlying thyroid tissue. h-i: segmented imaging of the thyroid. This procedure is important in order to detect any nodular changes within the gland. j: The parameters obtained after the VOCAL analysis. The gray value is relatively low due to the increased vascular density
www.intechopen.com

Thyroid Sonography in 3D with Emphasis on Perfusion
279
(g) (h)
(i) (j)
Fig. 6. (continued) Case 4. The same patient shown in Figure 4 examined with the RSP5-12 transducer. a-c: the hypoechogenic structure of the thyroid. d-e: single slice in color mode showing several vessels. f: the 3D image reconstruction using VOCAL. g: the final 3D image showing total thyroid vascularity. Note the almost total absence of underlying thyroid tissue. h-i: segmented imaging of the thyroid. This procedure is important in order to detect any nodular changes within the gland. j: The parameters obtained after the VOCAL analysis. The gray value is relatively low due to the increased vascular density
In 1967 Fujimoto et al. published their data on US examination of the thyroid [16]. The authors described 4 basic echo patterns: cystic, sparsely spotted, strong internal echoes, and the lack of internal echoes. In 1971 the first paper by Blum et al. documented the use of A-mode sonography [17]. In 1972 Blum [18] published an article entitled: “Clinical applications of thyroid echography“ which described the data on 122 patients who had had thyroid surgery. Both A-mode and B-mode sonography was done with a 5 megahertz apparatus. In the one dimensional A-mode imaging a water-soluble gel was interposed between the transducer and the skin. For 2-dimensional B-mode imaging a mineral oil was used as coupling agent. During the examination the gain was changed in order to detect structures that had a maximal reflection while using low-sensitivity and finally high gain in order to detect lower amplitude echoes. Examples of these examinations can be seen in Figures 2-5 [18]. Acoustic dense structures were described in an adenoma (Fig. 6). Solid masses (benign or malignant) as well as thyroiditis appeared to be sonographically indistinguishable.
www.intechopen.com

Sonography
280
(a) (b)
(c) (d)
(e)
Fig. 7. Case 5. A female patient with a cystic nodule. The cyst has clear limits, no vessels penetrate the cavity. a: the 3D image set. b: enlarged view of the 3D reconstruction. c-e: segmentation of the cyst
www.intechopen.com

Thyroid Sonography in 3D with Emphasis on Perfusion
281
In subacute thyroiditis and Graves’ disease the authors found very uniform low-amplitude echoes which were only visible at high-gain setting in the A-mode. The image of B-mode was described as having a very fine stippling. According to Blum the basic purposes for conducting thyroid ultrasound examinations were: to determine whether a solitary cold nodule was cystic or solid, to document changes in size of solitary nodules even under suppressive therapy, to evaluate the depth dimension [18]. According to Australian specialists the development of ultrasound techniques for thyroid examinations is based on a breast ultrasound examination apparatus installed at the Royal North Shore Hospital in Sydney. The publication by Crocker and Jellins appeared in 1978 [19].
After the first definitions on the use of ultrasound for thyroid investigations, the notion of adding data on the depth of the nodule was presented by Thijs et al. [20]. The authors combined digital scintigraphy with ultrasound. The classification of nodules into hot, warm, cool, and cold was also advanced. The feature of sonolucent halo of adenomatous nodules was demonstrated by Scheible et al. in 1979 [21]. In 1988 Ralls et al. coined the term “thyroid inferno” to describe the characteristics of color-flow Doppler sonography in patients with Graves’ disease [22]. Their study did not include patients with thyroiditis nor with latent hypothyroidism. In 1992 Miyakawa et al. described a pattern of decreased echogenicity in cases of silent thyroiditis. Such patients had a high T3 to T4 ratio [23].
In 1994-1995 Rubin reported the development of Power Doppler technology [24,25]. This development was considered an improvement of color Doppler which can detect fractional moving blood volume. A demonstration of the applicability of this technique for the detection of inflammatory changes in joints was already published 1994 [26]. The authors described increased blood flow as being suggestive of mild inflammation of the tendon examined, and marked hyperemia with vascular blush in severe changes (Fig. 2 in [26]).
The following general considerations on the characteristics of ultrasound investigations are taken from Rose and Nelson [27]. In brightness mode or gray scale US the velocity of US wave propagation in fluids and soft tissues is approximately 1540 meters per second. The time delay between the pulse sent and that of the returned wave is the basis for the determination of the reflector depth. The intensity of the reflected US wave is given as brightness of the image. Spatial resolution is dependent on the wavelength of the US wave. US attenuation increases with increased frequency. Deep structures require low frequencies in the range of 2.5-3.5 MHz, while superficial structures can be investigated within the range of 7-10 MHz. Signals are transmitted by the transducer and at the same time echo reflections are registered. According to the structure of the tissues, some portions of the sound is reflected back to the surface. Dense echoes are reflected from structures with different acoustic densities. Homogeneous liquids transmit sound without reflections. Air-filled structures do not transmit ultrasound. Attenuation of waves can be due to body fat and fascial structures [27]. In thyroid examinations such attenuation can occur due to the cervical fasciae.
2.2 Historical aspects of 3D ultrasound – The Kretz story
The beginnings of Kretz can be traced back to early 1947 when the company started the production of resistance-welded wired goods. The founder of the company was engineer Paul Kretz. Some of the products included glass balloon baskets, milk bottle carriers and potato baskets. The company started in the old rooms of the old brewery in Zipf, Austria. In 1952 the first own building was built.
www.intechopen.com

Sonography
282
(a) (b)
(c) (d)
(e)
Fig. 8. Case 6. A female patient with a compensated autonomous adenoma. a: demonstration of the vessels surrounding the adenoma. In gray modus these vessels appear as a halo. b-e: segmentation of the nodule that shows lack of vascularity within the nodule
www.intechopen.com

Thyroid Sonography in 3D with Emphasis on Perfusion
283
In 1950 the company started to develop Echolot (echo sounding) machines for the purpose of material testing. By 1957 the material testing machines became the main stand of the company.
In 1962 medical professionals start tests on the clinical use of the available material test apparatus. One of the first users was Prof. Kratochwil who used the technology for gynecological examinations, i.e. “ultrasonic placentography” (1962) [28]. In the time between 1967 and 1977 the ultrasound machines were used in gynecology, ophthalmology, neurology, and radiology based on A-mode, B-mode, time-motion and Doppler techniques. Some of the early models which were developed were: Combison 200 (1975-1978), and the improved Combison 202/R, the Minifason (1973-1977) – a hand-held Doppler for fetal heart investigations. The Combison 100 (1977) was the first real-time sector scanner of the world equipped with the first single element rotating transducer. The Combison 310 released in 1987 was a compact ultrasound machine. The following Combison 320 included computer technology.
In 1987 the first images of 3D scanning began. This technology was included in the first generation of 3D machines, having the Combison 330 in 1989. In 1992 the Combison 520 appeared. This was the 2nd generation of 3D machines to be produced in series. Between 1996 and 2001 Kretztechnik and Medison (Korea) fused and brought out the Voluson 530D in 1997. In 2001 Kretztechnik was taken over by G.E. The Austrian press reported: “Medical Systems, a subsidiary of US group General Electric (GE), acquired a 65.4% majority in Austrian Kretztechnik from Korean Medison. GE paid EUR 97.5mn, or EUR 12 per share, for Medison's stake. GE offers to buy widespread shares for EUR 17 per share in the coming two weeks. Zipf-based Kretztechnik is the world market leader for modern ultrasound systems, i.e. three-dimensional real-time imaging systems”. The following models were those of the Voluson 730 series. In 2011 the Voluson S8 and S6 were released.
The accomplishments of Carl Kretz were honored in 1999 when he received the Ian Donald Gold Medal for Technical Development by the International Society of Ultrasound in Obstetrics and Gynecology [29]. The publication by Chiou et al. on 3D thyroid investigations provides some additional information as to the development of 3D imaging in general [30].
(a) (b)
Fig. 9. Case 7. A female patient with Graves’ disease presenting bilateral thyroid associated ophthalmopathy. a: 3D reconstruction. b: detail of the 3D reconstruction. VFI 14.8
www.intechopen.com

Sonography
284
(a) (b)
(c)
Fig. 10. Case 8. A female patient with Graves’ disease prior to treatment with selenomethionine and Mg. a-b: low echogenic signal of the thyroid. c: demonstration of increased total vascularity, VOCAL reconstruction, VFI 10.91
The paper describing the characteristics of quantified blood flow analysis using these machines was published by Pairleitner in 1999 [31]. The original definition of the indices states: “VI measures the number of color voxels in the cube, representing the vessels in the tissue (Figure 3). FI, a mean color value of all blood flow or induced flow intensities, represents the intensity of flow at the time of the three dimensional sweep. FI is not an indicator of perfusion, so it cannot give information on the volume of blood pumped through the vessels during a certain period of time. VFI is a combination of vascularization and flow information relating the weighted color values (weighted by their amplitudes) to the cube. Therefore, VFI represents both blood flow and vascularization”. The automatic procedure for the quantification of vascularization indices was called VOCALTM. VOCAL stands for the 3D virtual organ computer-aided analysis program developed by Kretz. Data on the reliability of the VOCAL analysis as well as on the parametric setting for the examinations in gynecological applications have been presented by Bordes and Raine-Fenning [32,33].
www.intechopen.com

Thyroid Sonography in 3D with Emphasis on Perfusion
285
3. 3D-Ultrasound thyroid examination
3D-Ultrasound examinations in this paper were done using a General Electrics Voluson 730 Pro ultrasound machine equipped with a RealTime 4D linear transducer (RSP5-12, GE Healthcare, Waukesha, WI 53188, USA). Data analysis was done using the VOCALTM software (4DView Version 5.x, GE Medical Systems - Kretztechnik GmbH & Co OHG) installed on the ultrasound machine. Both the gray-scale values and the color values were normalized from 0 to 100, 100 being the highest intensity. The analysis of the 3D Doppler data sets provided the following indexes: VI, FI, and VFI [31]. The examination was done with the patients lying supine and with a light hyperextension of the neck. The transducer was placed on the midline of the neck having the whole gland inside the field of view. The mean time of data acquisition for the thyroid studies was approximately 20 seconds. The study had to be repeated only when movement artifacts arising from the patients (coughing or swallowing) had occurred. The drawing of the area of the thyroid gland was carried out using manual trace at 15° steps [34]. During drawing care was taken not to include laryngeal vessels which are typically seen on the medial border of the thyroid.
(a) (b)
(c)
Fig. 11. Case 8. A female patient with Graves’ disease after treatment with selenomethionine and Mg. a-b: normal echogenic signal of the thyroid. c: demonstration of less total vascularity, VOCAL reconstruction, VFI 3.49
www.intechopen.com

Sonography
286
4. Clinical cases: Normal thyroid, nodular disease, cystic disease, latent hypothyroidism, hypothyroidism, hyperthyroidism
The ultrasound data presented here have been obtained during examinations carried out at our Institution WOMED in Innsbruck, Austria. A total of 140 examinations were carried out. The procedures were carried in accordance with the Declaration of Helsinki [35]. The list of representative demonstration cases presented in this chapter is shown in the Table. The initial ultrasound examinations (cases 1 and 2) were done by both authors based on the previous experience of HM in the field of reproductive medicine. These first 2 studies were carried out using a vaginal transducer. Two cases with nodular disease are presented in order to demonstrate the capability of 3-volume visualization of the thyroid. The most relevant perfusion parameter for hypo- and hyperthyroidism, i.e. VFI, is shown.
(a) (b)
Fig. 12. Case 9. A female patient with latent hypothyroidism prior to treatment with selenomethionine and Mg. a: 3D reconstruction. b: 3D VOCAL reconstruction, VFI 4.22. Compare with Figure 13 (post-treatment images)
(a) (b)
Fig. 13. Case 9. A female patient with latent hypothyroidism after treatment with selenomethionine and Mg. a: 3D reconstruction. b: 3D VOCAL reconstruction, VFI 1.21. Compare with Figure 12 (pre-treatment images)
www.intechopen.com

Thyroid Sonography in 3D with Emphasis on Perfusion
287
Case Sex Diagnosis VFI 1 m Normal thyroid – (study done with a vaginal transducer) n.d. 2 f Chronic recurrent thyroiditis – (study done with a vaginal transducer) n.d. 3 m Normal thyroid 0.09 4 f Chronic recurring thyroiditis 23.97 5 f Cystic adenoma n.d. 6 f Autonomous adenoma n.d. 7 f Graves‘ disease and thyroid associated orbitopathy 14.8 8 f Graves‘ disease pre-treatment 10.91 9 f Graves‘ disease after treatment 3.49 10 f Latent hypothyroidism pre-treatment 4.22 11 f Latent hypothyroidism post-treatment 1.21
Table 1.
82
normal hypothyroid hyperthyroid treated thyroiditis treated hyperthyroid thyroiditis
Dg
83
60.00
50.00
40.00
30.00
20.00
10.00
0.00
VFI
Fig. 14. The VFI value in different thyroid conditions. The first two bars correspond to single observations. The following groups of 2-bars each demonstrate the VFI changes following therapy with selenomethionine and Mg citrate (p<0.01)
Based on the results of previous investigations [36-40] supportive treatment included selenomethionine and Mg-citrate. Supplementation with selenomethionine (200 µg/d, Pure
www.intechopen.com

Sonography
288
Encapsulations ©, pro medico HandelsGmbH, Graz Austria) was prescribed if the serum levels were less than 80µg/l. Magnesium substitution was prescribed if the serum level was lower than 0.8 mmol/l (Magnesium Verla©, 60mg of Mg-citrate/Mg-L-glutamate, Kwizda Pharma GmbH, Vienna) at a dose of 360mg/day. This treatment was given over a period of 3 months in cases 8 and 10. The changes in thyroid morphology and VFI are given as cases 9 and 11. Statistical analysis of the 140 observations revealed that VFI was the most relevant parameter showing significant changes after our therapy approach (Figure 14).
5. Discussion
Studies with 3D technology concerning thyroid function are scarce. Only 2 publications have addressed this issue [30,41]. The paper by Chiou et al. is the first one in the literature to deal with the same technology as us [30]. This study included patients with Hashimoto’s disease as well as Graves’ disease. In Figure 1 the authors present the VFI value of a patient with Graves’ disease (VFI = 30.7). This value is similar that the ones we have obtained. Unfortunately further individual data are not presented. The authors present exhaustive data on correlation analyses. The second publication on 3D ultrasound of the thyroid by Slapa et al. is centered on nodular thyroid disease [41]. This publication has no comparable data to our results. All together it can be said that 3D perfusion studies of the thyroid are rare.
3D perfusion studies, however, has found much wider application in the field of reproductive medicine since the original publication of the qualitative analysis method by Pairleitner et al. [31]. Data on the reliability of the VOCAL analysis as well as on the parametric setting for the examinations have been presented by Bordes and Raine-Fenning [32,33]. Concerns regarding power Doppler signal attenuation as discussed by Raine-Fenning [33] should not be relevant in thyroid examinations since the distance between the transducer and the organ is relatively constant (app. 1 to 1.5 cm).
Since more data is available from the gynecological field we will mention some data related to ovarian perfusion studies. Examination of the ovaries as reported by in Rainne-Fenning [33] revealed mean VFI values for the ovary of 2.076 and 2.074 (2 observers). Changes in ovarian vascularization during the menstrual cycle has been reported by Järvelä et al. [42]. In Table 2 of [42] a comparison of vascularization parameters between the right and left ovaries is shown. The mean values for VI, FI, VFI, and mean grayness were: 6.2/7.4, 43.4/46.5, 2.8/3.7, and 45.8/46.0, respectively. In 2002 Pan et al. compared the vascularization characteristics between patients with polycystic ovarian syndrome and controls [43]. The mean values for VI, FI, and VFI for normals and PCO patients were: 0.8/2.1, 44.44/50.26, and 1.44/3.99, respectively. In 2003 Pan et al. [44] described a stimulatory effect of HRT on the ovarian vascularization parameters in postmenopausal women (!). The mean values for VI, FI, and VFI before and after HRT were: 0.31/1.12, 30.47/38.41, and 0.13/0.59, respectively. This finding implies a stimulatory effect of conjugated equine estrogen on these parameters. The same group of investigators described increased vascularization parameters in women that showed a hyper-response to stimulation protocols for IVF [45]. Hyperresponders had higher levels of estradiol (>3000 pg/ml) or had more than 15 oocytes retrieved. The mean values for VI, FI, and VFI for patients with a “normal” and patients with an increased response to stimulation were: 1.25/2.27, 43.19/50.23, and 0.63/1.18, respectively.
Comparing the image material presented in the above mentioned citations with our images, it can be clearly recognized that the thyroid gland has a wider range of variation in the
www.intechopen.com

Thyroid Sonography in 3D with Emphasis on Perfusion
289
degree of vascularization. The VFI values seen in thyroiditis and Graves’ disease are generally higher than in different conditions of ovarian function. These differences cannot be taken as absolute ones. Data variability between different publications has 2 main sources of error. The first one is the use of different Kretz machines (Combison, Voluson). The second one is the fact that each investigator or each machine has different examination settings for carrying out the studies. We recommend the continuous use of the same settings in order to produce comparable results. These facts have been mentioned by de Ziegler [46]. De Ziegler points out the weakness of early studies which were arbitrary and subjective in interpretation [46]. Some of the open expectations mentioned by de Ziegler included the “desire for an understanding of the mechanisms at play” as well as whether ovarian function had a relation to perfusion values. As we show in Figure 12, the relevant parameter VFI decreases significantly following the combined treatment with selenomethionine and magnesium. We postulate that the VFI represents an inflammatory process that is present in several thyroid entities. Initially we had described this as a “low grade connective tissue inflammation” in patients with thyroid associated ophthalmopathy [39]. In this publication we discussed amply the role of Se in inflammation. Data concerning Mg and inflammation can be found in the literature [47-60]. The initial invitation of the Editors of this book was indeed to elaborate on these pathophysiological connections.
6. Conclusions
Increased perfusion characteristics in 3D modus provide an exact picture of the underlying inflammatory changes in the thyroid. This description is better than that of indirect signs said to be associated with such changes (simple Doppler imaging, pulsed Doppler). This technical enhancement will allow the clinician to gain immediate access to the basic underlying processes of thyroid disease, i.e. inflammation. This process of inflammation is directly related to the available body resources of substances that regulate inflammatory processes. Effectiveness of treatment can be uniquely evaluated by the quantitative 3D power Doppler perfusion study of the thyroid.
7. Acknowledgements
Historical data on the development of GE Kretztechnik was kindly provided by GE Austria.
8. References
[1] Doppler C: Abhandlung Über das farbige Licht der Doppelsterne und einiger anderer Gestirne des Himmels. Abh K Bohm Ges Wissen Prag 1842, 465-482.
[2] Curie J, Curie P: Development par pression de l'electricite polaire dans les cristaus hemidres a faces inclinees. C R Acad Sci Paris 1880, 91: 294-295.
[3] Mason WP: Piezoelectricity, its history and applications. J Acoust Soc Am 1981, 70: 1561-1566. [4] Paty P: Paul Langevin (1872-1946), la relativité et les quanta. Bull Soc Fr Phys 1999, 119: 15-20. [5] Behm A: Das Behm-Echolot. Ann Hydrogr 1921, 49: 241-247. [6] Dussik KT: Über die Möglichkeit, hochfrequente mechanische Schwingungen als
diagnostisches Hilfsmittel zu verwerten. Z Gesamte Neurol Psychatr 1941, 174: 153-168. [7] Sokolov SY: On the problem of the propagation of ultrasonic oscillations in various
bodies. Elek Nachr Tech 1929, 6: 454-460.
www.intechopen.com

Sonography
290
[8] Frentzel-Beyme B: [From echo-sounding to color doppler sonography. The history of diagnostic ultrasonic diagnosis.]. Radiologe 2005, 45: 363-370.
[9] Jecker P, Frentzel-Beyme B: [The history of head and neck sonography]. Laryngorhinootologie 2002, 81: 900-905.
[10] Levine RA: Something old and something new: a brief history of thyroid ultrasound technology. Endocr Pract 2004, 10: 227-233.
[11] Ruchala M, Szczepanek E: Thyroid ultrasound - a piece of cake? Endokrynol Pol 2010, 61: 330-344.
[12] Sholosh B, Borhani AA: Thyroid ultrasound part 1: technique and diffuse disease. Radiol Clin North Am 2011, 49: 391-416.
[13] Kossoff G: Basic physics and imaging characteristics of ultrasound. World J Surg 2000, 24: 134-142.
[14] Howry DH, Bliss WR: Ultrasonic visualization of soft tissue structures of the body. J Lab Clin Med 1952, 40: 579-592.
[15] Holmes JH, Howry DH, Posakony GJ, Cushman CR: The ultrasonic visualization of soft tissue structures in the human body. Trans Am Clin Climatol Assoc 1954, 66: 208-225.
[16] Fujimoto Y, Oka A, Omoto R, Hirose M: Ultrasound scanning of the thyroid gland as a new diagnostic approach. Ultrasonics 1967, 5: 177-180.
[17] Blum M, Weiss B, Hernberg J: Evaluation of thyroid nodules by A-mode echography. Radiology 1971, 101: 651-656.
[18] Blum M, Goldman AB, Herskovic A, Hernberg J: Clinical applications of thyroid echography. N Engl J Med 1972, 287: 1164-1169.
[19] Crocker EF, Jellins J: Grey scale ultrasonic examination of the thyroid gland. Med J Aust 1978, 9: 244-248.
[20] Thijs LG, Roos P, Wiener JD: Use of ultrasound and digital scintiphoto analysis in the evaluation of solitary thyroid nodules. J Nucl Med 1972, 13: 504-509.
[21] Scheible W, Leopold GR, Woo VL, Gosink BB: High-resolution real-time ultrasonography of thyroid nodules. Radiology 1979, 133: 413-417.
[22] Ralls PW, Mayekawa DS, Lee KP, Colletti PM, Radin DR, Boswell WD et al.: Color-flow Doppler sonography in Graves disease: "thyroid inferno". Am J Roentgenol 1988, 150: 781-784.
[23] Miyakawa M, Tsushima T, Onoda N, Etoh M, Isozaki O, Arai M et al.: Thyroid ultrasonography related to clinical and laboratory findings in patients with silent thyroiditis. J Endocrinol Invest 1992, 15: 289-295.
[24] Rubin JM, Bude RO, Carson PL, Bree RL, Adler RS: Power Doppler US: a potentially useful alternative to mean frequency-based color Doppler US. Radiology 1994, 190: 853-856.
[25] Rubin JM, Adler RS, Fowlkes JB, Spratt S, Pallister JE, Chen JF et al.: Fractional moving blood volume: estimation with power Doppler US. Radiology 1995, 197: 183-190.
[26] Newman JS, Adler RS, Bude RO, Rubin JM: Detection of soft-tissue hyperemia: value of power Doppler sonography. AJR Am J Roentgenol 1994, 163: 385-389.
[27] Rose SC, Nelson TR: Ultrasonographic modalities to assess vascular anatomy and disease. J Vasc Interv Radiol 2004, 15: 25-38.
[28] Kratochwil A: [Possibilities of ultrasonic diagnosis in labor gynecology]. Wien Klin Wochenschr 1966, 78: 190-191.
[29] Kratochwil A: Presentation of the Ian Donald Gold Medal for Technical Development to Carl Kretz. Ultrasound Obstet Gynecol 2000, 16: 107-108.
www.intechopen.com

Thyroid Sonography in 3D with Emphasis on Perfusion
291
[30] Chiou SC, Hsieh MH, Chen HY, Lin JD, Chen CC, Hsu WH et al.: The reproducibility of the virtual organ computer-aided analysis program for evaluating 3-dimensional power Doppler ultrasonography of diffuse thyroid disorders. J Endocrinol Invest 2009, 32: 139-146.
[31] Pairleitner H, Steiner H, Hasenoehrl G, Staudach A: Three-dimensional power Doppler sonography: imaging and quantifying blood flow and vascularization. Ultrasound Obstet Gynecol 1999, 14: 139-143.
[32] Bordes A, Bory AM, Benchaïb M, Rudigoz RC, Salle B: Reproducibility of transvaginal three-dimensional endometrial volume measurements with virtual organ computer-aided analysis (VOCAL) during ovarian stimulation. Ultrasound Obstet Gynecol 2002, 19: 76-80.
[33] Raine-Fenning NJ, Campbell BK, Clewes JS, Kendall NR, Johnson IR: The reliability of virtual organ computer-aided analysis (VOCAL) for the semiquantification of ovarian, endometrial and subendometrial perfusion. Ultrasound Obstet Gynecol 2003, 22: 633-639.
[34] Mercé LT, Gómez B, Engels V, Bau S, Bajo JM: Intraobserver and interobserver reproducibility of ovarian volume, antral follicle count, and vascularity indices obtained with transvaginal 3-dimensional ultrasonography, power Doppler angiography, and the virtual organ computer-aided analysis imaging program. J Ultrasound Med 2005, 24: 1279-1287.
[35] World Medical Association Declaration of Helsinki: ethical principles for medical research involving human subjects. JAMA 2000, 284: 3043-3045.
[36] Moncayo R, Moncayo H, Kapelari K: Nutritional treatment of incipient thyroid autoimmune disease. Influence of selenium supplementation on thyroid function and morphology in children and young adults. Clin Nutr 2005, 24: 530-531.
[37] Moncayo R, Rudisch A, Kremser C, Moncayo H: 3D-MRI rendering of the anatomical structures related to acupuncture points of the Dai mai, Yin qiao mai and Yang qiao mai meridians within the context of the WOMED concept of lateral tension: Implications for musculoskeletal disease. BMC Musculoskelet Disord 2007, 8: 33.
[38] Moncayo R, Rudisch A, Diemling M, Kremser C: In-vivo visualisation of the anatomical structures related to the acupuncture points Dai mai and Shen mai by MRI: A single-case pilot study. BMC Med Imaging 2007, 7: 4.
[39] Moncayo R, Moncayo H: A musculoskeletal model of low grade connective tissue inflammation in patients with thyroid associated ophthalmopathy (TAO): The WOMED concept of lateral tension and its general implications in disease. BMC Musculoskelet Disord 2007, 8: 17.
[40] Moncayo R, Kroiss A, Oberwinkler M, Karakolcu F, Starzinger M, Kapelari K et al.: The role of selenium, vitamin C, and zinc in benign thyroid diseases and of Se in malignant thyroid diseases: low selenium levels are found in subacute and silent thyroiditis and in papillary and follicular carcinoma. BMC Endocrine Disorders 2008, 8: 2.
[41] Slapa RZ, Jakubowski WS, Slowinska-Srzednicka J, Szopinski KT: Advantages and disadvantages of 3D ultrasound of thyroid nodules including thin slice volume rendering. Thyroid Res 2011, 4: 1.
[42] Järvelä IY, Sladkevicius P, Kelly S, Ojha K, Nargund G, Campbell S: Three-dimensional sonographic and power Doppler characterization of ovaries in late follicular phase. Ultrasound Obstet Gynecol 2002, 20: 281-285.
www.intechopen.com

Sonography
292
[43] Pan HA, Wu MH, Cheng YC, Li CH, Chang FM: Quantification of Doppler signal in polycystic ovary syndrome using three-dimensional power Doppler ultrasonography: a possible new marker for diagnosis. Hum Reprod 2002, 17: 201-206.
[44] Pan HA, Li CH, Cheng YC, Wu MH, Chang FM: Quantification of ovarian stromal Doppler signals in postmenopausal women receiving hormone replacement therapy. Menopause 2003, 10: 366-372.
[45] Pan HA, Wu MH, Cheng YC, Wu LH, Chang FM: Quantification of ovarian Doppler signal in hyperresponders during in vitro fertilization treatment using three-dimensional power Doppler ultrasonography. Ultrasound Med Biol 2003, 29: 921-927.
[46] de Ziegler D: Uterine Doppler studies: technology driven data, or answers to our pathophysiological queries? Hum Reprod 2004, 19: 2615-2618.
[47] Brautbar N, Carpenter C: Skeletal myopathy and magnesium depletion: cellular mechanisms. Magnesium 1984, 3: 57-62.
[48] Weglicki WB, Phillips TM: Pathobiology of magnesium deficiency: A cytokine/neurogenic inflammation hypothesis. Am J Physiol 1992, 263: R734-R737.
[49] Garcia LA, Dejong SC, Martin SM, Smith RS, Buettner GR, Kerber RE: Magnesium reduces free radicals in an in vivo coronary occlusion-reperfusion model. J Am Coll Cardiol 1998, 32: 536-539.
[50] Tejero-Taldo MI, Chmielinska JJ, Gonzalez G, Mak IT, Weglicki WB: N-methyl-D-aspartate receptor blockade inhibits cardiac inflammation in the Mg2+-deficient rat. J Pharmacol Exp Ther 2004, 311: 8-13.
[51] Bo S, Durazzo M, Guidi S, Carello M, Sacerdote C, Silli B et al.: Dietary magnesium and fiber intakes and inflammatory and metabolic indicators in middle-aged subjects from a population-based cohort. Am J Clin Nutr 2006, 84: 1062-1069.
[52] Guerrero-Romero F, Rodríguez-Morán M: Hypomagnesemia, oxidative stress, inflammation, and metabolic syndrome. Diabetes Metab Res Rev 2006, 22: 471-476.
[53] Almoznino-Sarafian D, Berman S, Mor A, Shteinshnaider M, Gorelik O, Tzur I et al.: Magnesium and C-reactive protein in heart failure: an anti-inflammatory effect of magnesium administration? Eur J Nutr 2007, 46: 230-237.
[54] Mazur A, Maier JA, Rock E, Gueux E, Nowacki W, Rayssiguier Y: Magnesium and the inflammatory response: potential physiopathological implications. Arch Biochem Biophys 2007, 458: 48-56.
[55] Evangelopoulos AA, Vallianou NG, Panagiotakos DB, Georgiou A, Zacharias GA, Alevra AN et al.: An inverse relationship between cumulating components of the metabolic syndrome and serum magnesium levels. Nutr Res 2008, 28: 659-663.
[56] Balage M, Averous J, Rémond D, Bos C, Pujos-Guillot E, Papet I et al.: Presence of low-grade inflammation impaired postprandial stimulation of muscle protein synthesis in old rats. J Nutr Biochem 2010, 21: 325-331.
[57] Nielsen FH: Magnesium, inflammation, and obesity in chronic disease. Nutr Rev 2010, 68: 333-340.
[58] Weglicki WB, Mak IT, Chmielinska JJ, Tejero-Taldo MI, Komarov AM, Kramer JH: The role of magnesium deficiency in cardiovascular and intestinal inflammation. Magnes Res 2010, 23: 199-206.
[59] Bo S, Milanesio N, Schiavone C, Villois P, Durazzo M, Gentile L et al.: Magnesium and trace element intake after a lifestyle intervention. Nutrition 2011, 27: 108-110.
[60] Nielsen FH, Johnson LK, Zeng H: Magnesium supplementation improves indicators of low magnesium status and inflammatory stress in adults older than 51 years with poor quality sleep *. Magnes Res 2011, 23: 158-168.
www.intechopen.com

SonographyEdited by Dr. Kerry Thoirs
ISBN 978-953-307-947-9Hard cover, 346 pagesPublisher InTechPublished online 03, February, 2012Published in print edition February, 2012
InTech EuropeUniversity Campus STeP Ri Slavka Krautzeka 83/A 51000 Rijeka, Croatia Phone: +385 (51) 770 447 Fax: +385 (51) 686 166www.intechopen.com
InTech ChinaUnit 405, Office Block, Hotel Equatorial Shanghai No.65, Yan An Road (West), Shanghai, 200040, China
Phone: +86-21-62489820 Fax: +86-21-62489821
Medical sonography is a medical imaging modality used across many medical disciplines. Its use is growing,probably due to its relative low cost and easy accessibility. There are now many high quality ultrasoundimaging systems available that are easily transportable, making it a diagnostic tool amenable for bedside andoffice scanning. This book includes applications of sonography that can be used across a number of medicaldisciplines including radiology, thoracic medicine, urology, rheumatology, obstetrics and fetal medicine andneurology. The book revisits established applications in medical sonography such as biliary, testicular andbreast sonography and sonography in early pregnancy, and also outlines some interesting new and advancedapplications of sonography.
How to referenceIn order to correctly reference this scholarly work, feel free to copy and paste the following:
Roy Moncayo and Helga Moncayo (2012). Thyroid Sonography in 3D with Emphasis on Perfusion,Sonography, Dr. Kerry Thoirs (Ed.), ISBN: 978-953-307-947-9, InTech, Available from:http://www.intechopen.com/books/sonography/thyroid-sonography-in-3d-with-emphasis-on-perfusion

© 2012 The Author(s). Licensee IntechOpen. This is an open access articledistributed under the terms of the Creative Commons Attribution 3.0License, which permits unrestricted use, distribution, and reproduction inany medium, provided the original work is properly cited.