thurston county waste composition study
TRANSCRIPT

THURSTON COUNTY WASTE COMPOSITION STUDY DECEMBER 2014
GREEN SOLUTIONS

THURSTON COUNTY WASTE COMPOSITION STUDY
2013 - 2014
prepared for
Thurston County Solid Waste Olympia, Washington
360-867-2491 www.ThurstonSolidWaste.org
prepared by
Green Solutions, LLC South Prairie, Washington 98385
360-897-9533 [email protected]
DECEMBER 2014


Thurston County Waste Composition Study iii Table of Contents
T A B L E O F C O N T E N T S Executive Summary Introduction .................................................................................... E-1 Overview of the Methodologies Used ......................................... E-1 Results and Conclusions ................................................................ E-3 Recommendations ...................................................................... E-11 I. Introduction A. Scope and Objectives .............................................................. 1 B. Background ................................................................................ 1 C. Contents of this Report ............................................................. 2 II. Characterization of Thurston County’s Waste Stream A. Introduction ................................................................................ 3 B. Overview of Procedures ........................................................... 3 C. Results, Waste Quantities .......................................................... 6 D. Results, Waste Composition ..................................................... 9 E. Weight of Materials Disposed ................................................ 19 F. Wood, C&D and Special Wastes ........................................... 19 G. Additional Data and Observations ....................................... 19 III. Mixed Organics Results A. Introduction .............................................................................. 25 B. Overview of Procedures ......................................................... 25 C. Quantity Results for Mixed Organics ..................................... 26 D. Composition Results for Mixed Organics .............................. 27 E. Total Amount of Edible Food Discarded .............................. 27 Iv. Conclusions and Recommendations A. Conclusions .............................................................................. 29 B. Recommendations .................................................................. 41 Glossary Introduction ................................................................................. G-1 A. Waste Generators .................................................................. G-1 B. Waste Sorting Categories ..................................................... G-2 C. Mixed Organics Definitions ................................................... G-7 Appendices A. Waste Composition Data for the City of Olympia B. Composition Data for Thurston County Buildings C. Mixed Organics Results D. Statistical Certainty of Results

Thurston County Waste Composition Study iv Table of Contents
L I S T O F T A B L E S
Executive Summary E-1 Quantities of Disposed Wastes .............................................. E-4 E-2 Composition of Disposed Wastes ......................................... E-6
Section II - Characterization of Thurston County’s Waste Stream 1 Annual Quantities by Customer Type ..................................... 7 2 Annual Quantities of Disposed Wastes by Source and Type of Generator .......................................................... 8 3 Allocation of Samples by Type of Generator ........................ 9 4 Waste Composition Results .................................................... 11 5 Weight of Disposed Materials ................................................ 20 6 Breakdown of Wood, C&D and Special Wastes ................. 21 7 Number of Times Hazardous Wastes were Found ............... 22 8 Amount of Carryout Bags ....................................................... 23 9 Amount of Edible Food Disposed in Thurston County ......... 24
Section III - Mixed Organics Results 10 Quarterly and Annual Amounts of Mixed Organics ............ 26 11 Composition Results for Mixed Organics .............................. 28
Section IV - Conclusions and Recommendations 12 Comparison of Results to Previous Studies ........................... 30 13 Recycling Potential Assessment ....................................... 35, 36
L I S T O F F I G U R E S
Executive Summary E-1 Waste Composition Results ................................................... E-5 E-2 Disposal Trends, Annual Tons by Material .......................... E-10 E-3 Disposal Trends, Per Capita Amounts ................................ E-10
Section II - Characterization of Thurston County’s Waste Stream 1 Waste Composition Results .................................................... 12 2 Residential Self-Haul Waste .................................................... 13 3 Rural Dropbox Waste .............................................................. 14 4 Single-Family Waste ................................................................. 15 5 Multi-Family Waste ................................................................... 16 6 Non-Residential Self-Haul Waste ............................................ 17 7 Commercial Waste ................................................................. 18
Section IV - Conclusions and Recommendations 8 Disposal Trends, Annual Tons by Material ............................. 31 9 Disposal Trends, Annual Tons Disposed ................................. 32 10 Disposal Trends, Per Capita Amounts ................................... 32 11 Recycling Potential Assessment ............................................. 37

Thurston County Waste Composition Study E-1 Executive Summary
E X E C U T I V E S U M M A R Y
INTRODUCTION This report provides the results of a study of the quantity and composition of solid waste (garbage) and “mixed organics” collected in Thurston County, Washington during 2013 - 2014. The primary objectives of this study were to provide:
Accurate data on the composition and quantity of disposed materials for evaluating current waste diversion programs, including waste diversion activities at the Thurston County Waste and Recovery Center (WARC).
Accurate data on the composition and quantity of mixed organics (yard debris and food scraps) collected in Thurston County.
Data that can be used for planning future waste diversion programs for recyclables and organics.
Data for specific County buildings and for the City of Olympia.
This waste composition study was conducted by the environmental consulting firm of Green Solutions, with assistance from two subconsultants, Environmental Practices and DGB Consulting. Additional assistance was provided by Waste Connections, Thurston County and the City of Olympia. This study was primarily organized by Thurston County, but the City of Olympia provided funds for additional data collection to allow better data to be provided about the City’s residential and commercial waste streams (see Appendix A). OVERVIEW OF THE METHODOLOGIES USED This study examined mixed municipal solid waste (MSW) disposed at Thurston County’s transfer facilities. Mixed municipal solid waste is a term commonly used for residential and commercial wastes, including the waste collected by garbage haulers and waste delivered directly to disposal sites by the waste generators themselves (self-haul). This study also examined the mixed organics (food scraps and yard debris) brought to WARC for transfer to other facilities. This study did not examine source-separated recyclable materials or specially-handled materials such as large appliances. The intent of this study was to provide data for the County’s entire waste stream and for the mixed organics stream, but the sampling and data collection procedures also allowed data to be collected on the quantity and composition of waste disposed by specific sources as well. In addition, the study was designed to allow data to be collected separately for the City of Olympia for three of the sources. For the waste

Thurston County Waste Composition Study E-2 Executive Summary
disposed through the Thurston County system, the sources (waste generators) analyzed by this study included:
Residential Self-Haul: waste brought to WARC by the homeowner or renter who generated the load of waste, typically transported using a car or pickup truck.
Rural Dropboxes: waste brought to one of the two satellite facilities: the Rainier
Dropbox and Rochester Dropbox. This waste can be assumed to be primarily Residential Self-Haul because the acceptance policies at these sites limit the size and type of loads.
Single-Family: waste collected by Waste Connections or the City of Olympia
from single-family homes.
Multi-Family: waste collected by Waste Connections or the City of Olympia from apartment buildings.
Non-Residential Self-Haul: waste from businesses or contractors that was
brought in by an employee of that business. A substantial amount of this waste stream consists of loads of construction and demolition wastes brought in by contractors.
Commercial: waste from businesses (commercial and industrial) and institutions
(schools, hospitals, government offices, etc.). These wastes are typically collected using front-loading garbage trucks (for emptying dumpsters) or trucks carrying roll-off containers and compactors.
County Offices: samples were taken each quarter from three Thurston County
facilities in order to provide data to the County on the results of in-house recycling and waste reduction programs.
For the mixed organics stream, the sources were divided into two collection systems, Waste Connections and the City of Olympia, and into two sources within each system, residential and commercial. The quantity (tonnage) of solid waste disposed by each type of generator was determined by applying data from a survey of the incoming traffic to the scalehouse records. The survey data was used to allocate self-haul tonnages into Residential and Non-Residential, and to allocate hauler tonnages (for the City of Olympia and Waste Connections) into Single-Family, Multi-Family and Commercial wastes. The composition of the County's solid waste stream was determined by randomly selecting and sorting samples of waste and mixed organics at WARC (see photo of

Thurston County Waste Composition Study E-3 Executive Summary
sorting crew). Sampling was conducted for six days each quarter for MSW and for one or two days each quarter for the mixed organics. Each sample of MSW was sorted into 88 categories of materials, and the samples of organics were sorted into 25 categories. The Glossary provides additional detail on the definitions used for the categories of materials. This study was conducted over the course of a year to encompass seasonal variations in the quantities and composition of the County’s waste stream. The fieldwork for this study was conducted in October, 2013, and in January/February, May, and August 2014. The mixed organics tests were added partway into this project, so sampling of this material was not conducted in the first quarter (October 2013).
Sorting crew working on a sample at WARC, May 21, 2014.
RESULTS AND CONCLUSIONS Waste Quantities The waste quantity results are summarized in Table E-1. As shown Table E-1, residential sources disposed of slightly more waste (51.4% of the County’s annual amount) than non-residential sources (48.6%). For individual sources, Commercial waste generators disposed of the greatest quantity (37.0% of the total annual amount).

Thurston County Waste Composition Study E-4 Executive Summary
Table E-1 QUANTITIES OF DISPOSED WASTES
Type of Generator Annual Amounts Tons Percent
Residential Self-Haul 21,490 13.5%
Rural Dropboxes 3,440 2.2%
Single-Family 46,890 29.5%
Multi-Family 9,690 6.1%
Residential Subtotal 81,500 51.4%
Non-Residential Self-Haul 18,480 11.6%
Commercial 58,720 37.0%
Non-Residential Subtotal 77,200 48.6%
Total 158,700 100.0%
Waste Composition Results Waste composition results for the entire County are summarized in Figure E-1, and Table E-2 shows the data for each type of waste generator (see also Table 4 of the main report). The noteworthy results for each generator are:
Residential Self-Haul: self-haul loads from residential sources have more wood and construction debris but less food waste than other residential sources, reflecting activities such as remodeling and the other special projects that are often the source of self-haul waste. The largest categories of materials in this waste stream are wood (18.1%), food waste (11.1%), furniture (6.0%), construction and demolition wastes (5.2%), and mixed metals (4.9%). Residential Self-Haul customers deliver only 13.5% of the total waste stream, but because of their small loads this type of customer represents more than half (55%) of the transactions at WARC for incoming waste loads, or about 90,660 loads per year of waste. Residential Self-Haul waste contains 18.1% of materials that could be recycled through a typical curbside recycling program (more than Single-Family but less than Multi-Family generators), and another 24.9% of this waste stream consists of organic materials that could be composted. Other types of potentially-recyclable materials contribute 30.8%, leaving only 26.2% of this waste stream that actually needs to be treated as waste.
Rural Dropboxes: the wastes brought to the two rural stations are similar to
Residential Self-Haul wastes (in other words, consisting of a blend of household garbage and waste from special projects). Wood waste is the material present in the largest quantity (14.4%) in this waste stream, followed by construction and
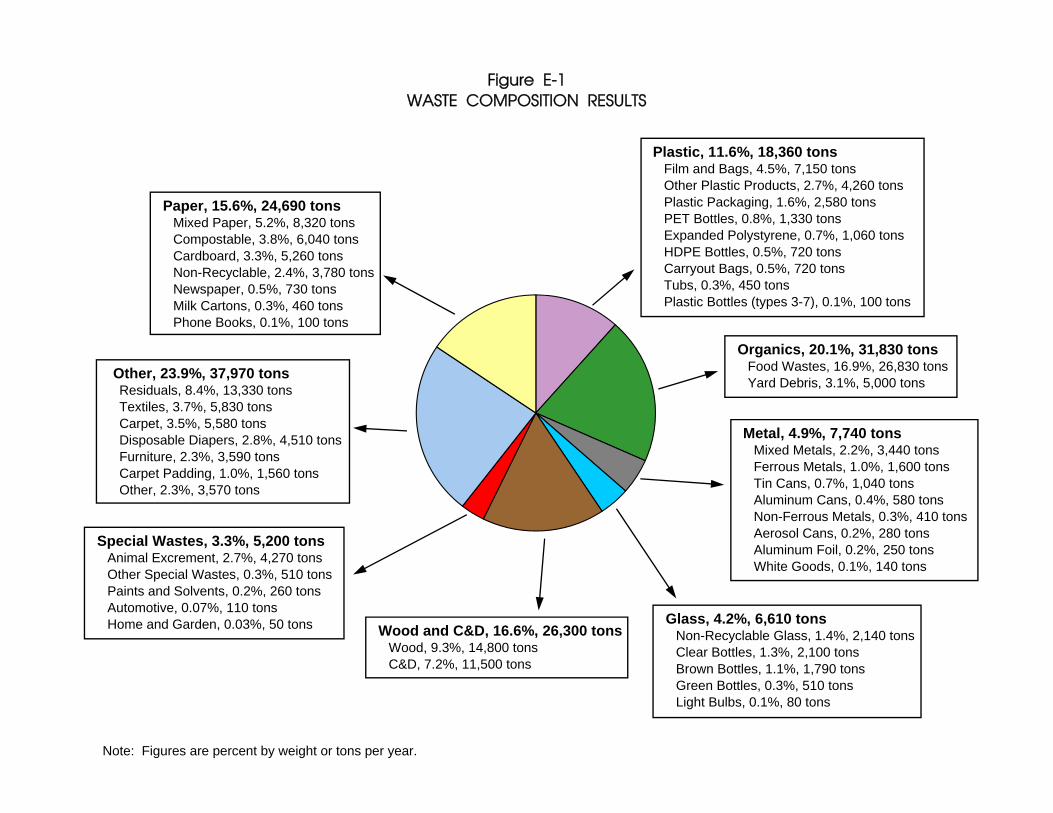
Paper, 15.6%, 24,690 tons Mixed Paper, 5.2%, 8,320 tons Compostable, 3.8%, 6,040 tons Cardboard, 3.3%, 5,260 tons Non-Recyclable, 2.4%, 3,780 tons Newspaper, 0.5%, 730 tons Milk Cartons, 0.3%, 460 tons Phone Books, 0.1%, 100 tons
Plastic, 11.6%, 18,360 tons Film and Bags, 4.5%, 7,150 tons Other Plastic Products, 2.7%, 4,260 tons Plastic Packaging, 1.6%, 2,580 tons PET Bottles, 0.8%, 1,330 tons Expanded Polystyrene, 0.7%, 1,060 tons HDPE Bottles, 0.5%, 720 tons Carryout Bags, 0.5%, 720 tons Tubs, 0.3%, 450 tons Plastic Bottles (types 3-7), 0.1%, 100 tons
Metal, 4.9%, 7,740 tons Mixed Metals, 2.2%, 3,440 tons Ferrous Metals, 1.0%, 1,600 tons Tin Cans, 0.7%, 1,040 tons Aluminum Cans, 0.4%, 580 tons Non-Ferrous Metals, 0.3%, 410 tons Aerosol Cans, 0.2%, 280 tons Aluminum Foil, 0.2%, 250 tons White Goods, 0.1%, 140 tons
Glass, 4.2%, 6,610 tons Non-Recyclable Glass, 1.4%, 2,140 tons Clear Bottles, 1.3%, 2,100 tons Brown Bottles, 1.1%, 1,790 tons Green Bottles, 0.3%, 510 tons Light Bulbs, 0.1%, 80 tons
Organics, 20.1%, 31,830 tons Food Wastes, 16.9%, 26,830 tons Yard Debris, 3.1%, 5,000 tons
Special Wastes, 3.3%, 5,200 tons Animal Excrement, 2.7%, 4,270 tons Other Special Wastes, 0.3%, 510 tons Paints and Solvents, 0.2%, 260 tons Automotive, 0.07%, 110 tons Home and Garden, 0.03%, 50 tons
Figure E-1 WASTE COMPOSITION RESULTS
Note: Figures are percent by weight or tons per year.
Other, 23.9%, 37,970 tons Residuals, 8.4%, 13,330 tons Textiles, 3.7%, 5,830 tons Carpet, 3.5%, 5,580 tons Disposable Diapers, 2.8%, 4,510 tons Furniture, 2.3%, 3,590 tons Carpet Padding, 1.0%, 1,560 tons Other, 2.3%, 3,570 tons
Wood and C&D, 16.6%, 26,300 tons Wood, 9.3%, 14,800 tons C&D, 7.2%, 11,500 tons

Thurston County Waste Composition Study E-6 Executive Summary
Table E-2 COMPOSITION OF DISPOSED WASTES
Type of Material
Annual Average by Waste Generator Residential Self-Haul
Rural Dropboxes
Single-Family
Multi-Family Non-Res. Self-Haul
Commercial Total Waste
Stream
Recyclable Paper 9.4 6.4 7.3 11.3 5.6 12.0 9.4 Compostable Paper 1.5 1.3 4.0 3.5 0.5 5.8 3.8 Non-Recyclable Paper 1.0 2.4 1.9 2.6 1.4 3.5 2.4 Plastic Bottles 1.2 1.1 1.4 3.0 0.2 1.5 1.4 Plastic Bags and Film 2.6 3.0 5.8 5.0 1.2 6.5 5.0 Other Plastics 5.1 6.0 4.9 4.6 4.5 5.9 5.3 Metals 8.4 12.3 3.9 4.8 2.8 4.6 4.9 Food Waste 11.1 7.7 22.9 22.4 0.6 19.0 16.9 Yard Debris 2.1 3.7 7.3 2.2 1.1 1.0 3.2 Recyclable Glass 6.1 2.7 3.4 5.5 0.4 1.4 2.8 Other Glass 1.7 0.2 0.3 0.3 4.6 1.5 1.4 Disposable Diapers 0.6 2.1 5.0 6.0 0.1 2.3 2.8 Textiles 4.4 3.9 4.8 5.8 0.8 3.1 3.7 Carpet and Padding 5.9 4.7 0.4 1.7 7.0 6.9 4.5 Furniture and Mattresses 7.7 3.1 0.6 1.1 8.7 0.7 2.6 Wood Waste 18.1 14.4 2.5 3.2 24.2 7.6 9.3 Construction/Demolition 5.2 8.6 1.3 0.9 34.5 5.1 7.2 Animal Excrement 1.0 1.1 7.0 4.8 0.1 0.5 2.7 Other Special Wastes 1.5 0.4 0.7 0.5 0.1 0.4 0.6 Other Materials 5.6 14.9 14.8 11.0 2.0 10.7 10.3
Totals 100.0 100.0 100.0 100.0 100.0 100.0 100.0
Notes: All figures are percentages by weight. The sum of the figures may not equal exactly 100% due to rounding.

Thurston County Waste Composition Study E-7 Executive Summary
demolition wastes (8.6%), food (7.7%), mixed metals (7.5%), tires (4.9%), and carpet (4.6%).
The waste from the Rural Dropboxes contains only 11.4% of the curbside recyclable materials, but another 22.1% is organic materials that could be composted and an additional 39.1% consists of other materials that could potentially be recycled through a variety of different programs. Only about one-quarter of this waste stream (27.4%) actually needs to be treated as waste.
Single-Family: the largest category of material in this waste stream is food
waste (22.9%), followed by yard debris (7.3%), animal excrement (or “kitty litter,” 7.0%), plastic bags and film (5.8%), disposable diapers (5.0%), mixed waste paper (5.0%), and textiles (4.8%).
Significant quantities of recyclable materials remain in this waste stream despite the widespread availability of recycling and organics collection programs for single-family homes. If residents recycled all of the materials currently accepted through existing recycling and organics collection programs, an additional 48.7% of the Single-Family waste stream could be recycled. This is the equivalent of 22,840 tons per year of additional recyclable and compostable materials. If residents also diverted other potentially-recyclable materials, then less than one-third (32.6%) of the current amount of waste would actually need to be disposed.
Multi-Family (apartments): the largest categories of materials in this waste
stream are food waste (22.4%), mixed waste paper (7.1%), disposable diapers (6.0%), textiles (5.8%), plastic bags and film (5.0%), and animal excrement (4.8%). The percentage of recyclable materials in apartment wastes is higher than for single-family homes, although the tonnage of recyclable materials disposed is lower due to the lower total amount of waste from apartments. The Multi-Family waste stream contains 22.6% of the typical curbside recyclables, 28.9% organics, and 20.6% other potentially-recyclable materials, leaving only 27.9% of the current waste that actually needs to be disposed.
Non-Residential Self-Haul: like self-haul waste from residential sources, Non-
Residential Self-Haul loads are often the result of construction activities or other special projects. The primary materials in this waste stream include construction and demolition waste (34.5%), wood (24.2%), furniture (8.3%), carpeting (6.3%), and cardboard (4.7%). The Non-Residential Self-Haul waste stream only contains 20.2% of the typical recyclable and compostable materials, or about 3,740 tons per year. The wood, other types of construction materials and other potentially-recyclable materials in this waste stream, however, add up to 53.9% or 9,970 tons per year. Diverting all

Thurston County Waste Composition Study E-8 Executive Summary
of the recyclable and compostable materials would only leave one-quarter (25.9%) of this waste stream remaining for disposal as waste.
Commercial: the largest categories of materials in the Commercial waste stream
are food waste (19.0%), wood waste (7.6%), mixed waste paper (6.9%), plastic bags and film (6.5%), compostable paper (5.8%), and carpet (5.4%). The Commercial waste stream contains 16.2% recyclable materials, or about 9,500 tons per year, and even more organics that could be composted, at 26.9% or 15,790 tons per year. Other materials that could potentially be recycled add up to 30.0% or 17,640 tons per year, leaving only about one-quarter (26.9%) of this waste stream that actually needs to be disposed as waste.
Total Waste Stream: overall, the County’s waste stream contains significant
amounts of food waste (16.9%), wood waste (9.3%), construction and demolition waste (7.2%), mixed waste paper (5.2%), and plastic bags and film (5.0%). The County’s waste stream contains 15.0% or 23,720 tons per year of material that could be handled through typical recycling programs, plus an additional 27.4% or 43,480 tons per year of organic materials that could be diverted to composting programs. Other types of recycling programs could potentially handle another 29.2%, or 46,330 tons per year, leaving only 28.5% of the waste from Thurston County that actually needs to be handled as a waste.
Carryout Bags As of July 1, 2014, many types of plastic bags were banned from use at retail stores in most of Thurston County. In anticipation of this ban, a category for “carryout bags” was added to the list of materials measured by this study. The results for this category show a decrease in the amount of carryout bags for all generator types. Overall, there was a 53% decrease in the amount of bags found in the Thurston County waste stream. This represents a decrease of 382 tons per year. Edible Food To supplement the data being collected on mixed organics (see below), a category for ”edible food” was added for the waste samples. This was done by dividing the original category of “food waste” into “edible food” (meaning food that had been edible when it was disposed or at some point prior to that) and “inedible food” (scraps resulting from food preparation and other food-related items that were never intended for human consumption). The results of this part of the analysis shows that 43% of the food waste

Thurston County Waste Composition Study E-9 Executive Summary
in Thurston County’s waste stream could have been eaten at some point prior to being placed in the garbage. This is the equivalent of 12,488 tons of food per year. Mixed Organics Results Mixed organics collected in Thurston County are brought to WARC for transfer to one of several processing facilities. Sampling and analysis of these mixed organics was conducted as part of the waste sorting study, and this part of the project is described in greater detail in a separate report (see Appendix C). Comparing those results to the results of this waste composition study shows that only 4.6% of the food waste and 8.0% of the compostable paper is being diverted to the mixed organics program, while 82.3% of the yard debris is being diverted from disposal. Comparison to Previous Studies This is the fourth waste composition study that Thurston County has conducted over the past fifteen years. Figure E-2 compares the results of these four studies by material category. Figure E-3 shows these results on the basis of Thurston County’s population, which highlights the fact that tonnages have decreased despite increases in population. Drawing firm conclusions from this data is difficult because several factors can influence these results, but the following general observations can be made:
Paper: the amount of newspaper in Thurston County’s waste stream has shown a steady decline over the years, as can be expected from increased participation in recycling programs and lower subscription rates, but other paper grades first dropped, then increased and then dropped again, both in terms of percentages and total tonnages. The decrease found in the current study appears to be tied to an overall decrease in Thurston County’s waste stream.
Plastic: the overall amount of plastic and most of the plastic categories were
displaying steady increases for the previous ten years but have dropped significantly in the current study. The decrease found in the current study could be due in part to the overall decrease in Thurston County’s wastes, although increased recycling of plastic bottles could also be a contributing factor.
Metal: the amount of metal in the waste stream has generally been in decline
over the previous three studies, but most of the metal categories show sharp declines in both percentages and tonnages for the current study. The tonnage of ferrous metal in particular has dropped in the current study. This appears to be primarily the result of decreases in ferrous metals for the Non-Residential, Commercial and Rural Dropbox sources, but the other waste generators also show decreases in this material.

Thurston County Waste Composition Study E-10 Executive Summary
Figure E-2 DISPOSAL TRENDS, ANNUAL TONS BY MATERIAL
0
5,000
10,000
15,000
20,000
25,000
30,000
35,000
40,000
To
ns
per
Yea
r
1999
2004
2009
2014
Figure E-3 DISPOSAL TRENDS, PER CAPITA AMOUNTS
0
200
400
600
800
1000
1200
1400
1600
1800
1999 2004 2009 2014
Po
un
ds
per
Per
son
per
Yea
r
Special
Wood, C&D
Other
Organics
Glass
Metal
Plastic
Paper

Thurston County Waste Composition Study E-11 Executive Summary
Food Waste: the amount of food waste in the County’s waste stream has varied somewhat on a percentage basis over the four studies, but the current tonnages show a decrease compared to the 2009 study. This decrease in tonnages reverses the trend that had been occurring for steadily-increasing tonnages of food waste.
Yard Debris: the percentages and tonnages of yard debris in the County’s waste
stream have been relatively steady over the years, although there was a spike in tonnages that occurred in the 2004 study. About two-thirds (64.6%) of the current tonnages of yard waste is being disposed by Single-Family generators from outside of Olympia.
Glass: the amount of glass bottles in the waste stream has varied over the years
but has generally declined, probably due to changes in consumer packaging and increased recycling levels. The exception to this observation is brown bottles, which increased significantly in the current study. This increase is due to increases that occurred for all of the residential categories (Residential Self-Haul, Rural Dropbox, Single-Family and Multi-Family), while Commercial tonnages for brown bottles dropped.
Wood and Construction/Demolition (C&D) Wastes: the percentage and
tonnages of wood and C&D wastes in the County’s waste stream showed a sharp decrease in the previous study, and the combined total amount of wood and C&D wastes is still at that lower level despite an increase in construction activities in the past year. The amount of wood waste has dropped even farther since 2009, indicating that a portion of the wood waste is possibly being diverted to other facilities for recycling.
R E C O M M E N D A T I O N S The following recommendations are based on the results of this study: There continues to be a significant amount of recyclable materials disposed in
Thurston County’s waste stream, and a few of the materials (brown glass bottles and non-ferrous metals) have actually increased in tonnages since the previous study. Increased education and other steps could help increase the recycling rate for these materials, although these increases would be incremental. If Thurston County desires to increase the recycling rate substantially over current levels, a different approach may be needed. Alternative approaches could include mandatory recycling, increasing the tipping fee at WARC (which provides an incentive to recycle), disposal bans, and an increased focus on new materials (carpet, textiles, construction and demolition wastes, etc.).

Thurston County Waste Composition Study E-12 Executive Summary
The County should continue to explore options to divert other recoverable products from the waste stream such as carpet, carpet padding, mattresses and textiles.
Single-family customers in Thurston County are disposing of significant amounts of
yard debris, despite the options for handling this material on-site and the availability of collection programs for it. Additional education and other steps should be considered to encourage the diversion of this material.
There continues to be a significant amount of wood and C&D in the waste stream.
The County should continue to explore options to expand waste reduction options for these materials and to promote the availability of recycling services in the region.
Recent steps have been taken in Thurston County to increase food waste diversion,
but for now large amounts of this material remain in the waste stream. More publicity about the programs for food waste should be considered.
The ban on plastic bags appears to have had a significant impact on the number of
plastic bags disposed. Additional steps should be taken to monitor the impact of the bag ban, including monitoring the number of littered bags and the amount found in recyclables.
The part of this study that examined the mixed organics program also made a number of recommendations, including addressing the need to increase the amount of food waste diverted from disposal through public education and other steps; the desirability of recycling cardboard and other paper rather than placing these materials into the mixed organics program; and continuing education for the mixed organics program to minimize contamination.

Thurston County Waste Composition Study 1 Introduction
S E C T I O N I I N T R O D U C T I O N
A . S C O P E A N D O B J E C T I V E S This report provides the results of a study of the quantity and composition of solid waste (garbage) and “mixed organics” collected in Thurston County, Washington during 2013 - 2014. The primary objectives of this study were to provide:
Accurate data on the composition and quantity of disposed materials for evaluating current waste diversion programs, including waste diversion activities at the Thurston County Waste and Recovery Center (WARC).
Accurate data on the composition and quantity of mixed organics (yard debris and food scraps) collected in Thurston County.
Data that can be used for planning future programs.
Data for specific County buildings and for the City of Olympia.
This waste composition study was conducted by the environmental consulting firm of Green Solutions, with assistance from two subconsultants, Environmental Practices and DGB Consulting. Additional assistance was provided by Waste Connections, Thurston County and the City of Olympia. This study was primarily organized by Thurston County, but the City of Olympia provided funds for additional data collection to allow better data to be provided about the City’s residential and commercial waste streams (see Appendix A). B . B A C K G R O U N D Previous waste characterization studies have been conducted in Thurston County in 1999, 2004, and 2009, so that Thurston County now has four studies spanning the past fifteen years. The materials examined by these studies have changed slightly over the years in response to evolving interests and issues, and also in response to changes that have occurred in the waste stream itself. Changes in the waste stream have occurred as a result of:
A more extensive recycling and composting system that is diverting a wider variety of materials from the waste stream,
Changes in packaging and consumer choices, and
The emergence of new types of materials and new product categories.

Thurston County Waste Composition Study 2 Introduction
C . C O N T E N T S O F T H I S R E P O R T This report consists of the following sections:
Section 2, Characterization of Thurston County’s Waste Stream – this section provides data on the quantity and composition of the County’s waste stream, including detailed data on the breakdown of three of the waste categories (wood, construction/demolition and special wastes). This section also provides additional data on the breakdown for light bulbs and hazardous wastes, and on the findings for carryout bags and edible food. Section 3, Mixed Organics Results – this section provides a summary of the results for the quantity and composition of the mixed organics stream in Thurston County. Section 4, Conclusions and Recommendations – this section discusses the interpretation and analysis of the results, and provides recommendations for possible future steps by the County. Glossary – provides the definitions used for the sorting categories. Appendix A, Waste Composition Data for the City of Olympia – provides results specific to Olympia’s waste collection system. Appendix B, Composition Data for Thurston County Offices – provides the results of quarterly samples taken from three county facilities. Appendix C, Mixed Organics Results – provides more detailed results for the samples taken of the mixed organics collected separately in Thurston County. Appendix D, Statistical Certainty of Results – provides data on the confidence intervals associated with the waste composition results.

Thurston County Waste Composition Study 3 Characterization of Thurston County’s Waste Stream
S E C T I O N I I CHARACTERIZATION OF THURSTON COUNTY’S WASTE STREAM
A . I N T R O D U C T I O N This section provides the waste quantity and composition results for the solid wastes collected and disposed in Thurston County, as well as additional information collected on the County’s waste stream during the fieldwork for this study. B . O V E R V I E W O F P R O C E D U R E S This study examined mixed municipal solid waste disposed at Thurston County’s transfer facilities. Mixed municipal solid waste (MSW) is a term commonly used for residential and commercial garbage, including the waste collected by garbage haulers and waste delivered directly to disposal sites by the waste generators themselves (“self-haul”). This study also examined the mixed organics (food scraps and yard debris) collected in Thurston County. The results of the mixed organics sampling are summarized in the next section of this report. This study did not examine other source-separated recyclable materials or specially-handled materials. The Thurston County Solid Waste System The solid waste collection and transfer system for Thurston County consists of one large transfer station, the Thurston County Waste and Recovery Center (WARC), and two satellite stations (or rural dropboxes). The two rural dropboxes are the Rainier Dropbox and Rochester Dropbox. WARC is owned by Thurston County and operated by Waste Connections. This facility includes:
A waste transfer operation, where waste is compacted into transfer trailers and exported out of the county to the Allied Waste landfill in Klickitat County, Washington.
An extensive recycling drop-off center.
A yard debris and mixed organics collection and transfer operation.
A moderate risk waste collection facility (the “HazoHouse”).
Special collection programs for electronic wastes, appliances and other materials.
This section of the report addresses only the wastes that are handled at WARC, including the wastes brought there from the rural dropboxes.

Thurston County Waste Composition Study 4 Characterization of Thurston County’s Waste Stream
Types of Waste Generators The intent of this part of the study was to provide data for the County’s entire waste stream, but the sampling and data collection procedures also allowed data to be collected on the quantity and composition of waste disposed by specific sources as well. In addition, the study was designed to allow data to be collected separately for the City of Olympia for three of the sources. For the waste disposed through the Thurston County system, the sources (waste generators) analyzed by this study included:
Residential Self-Haul: waste delivered to WARC by the homeowners and renters who generated the load of waste, although in some cases they may be assisting a family member, neighbor or acquaintance who actually generated the waste. This type of waste is typically transported to WARC using a car or pickup truck. There is a clear pattern in the timing of such deliveries, with much of the self-haul waste being brought to WARC on the weekends or in the evenings.
Rural Dropboxes: waste from the two satellite facilities: the Rochester and Rainier Dropbox sites. This waste can be assumed to be primarily Residential Self-Haul because the acceptance policies at these sites limit the size of the loads.
Single-Family: waste collected by Waste Connections or the City of Olympia from single-family homes. This waste is typically bagged before collection, consists primarily of small pieces of many different types of materials, and is delivered to the disposal site most often between mid-morning and mid-afternoon Monday through Friday (Tuesday through Friday on alternating weeks for the City of Olympia loads). Additional samples were taken for Single-Family waste from Olympia to allow this source to be analyzed separately.
Multi-Family: waste collected by Waste Connections or the City of Olympia from apartment buildings. This waste is often bagged before collection, consists primarily of small pieces of many different types of materials, and is delivered to the disposal site most often between early morning and mid-afternoon Monday through Friday. Multi-Family waste is almost always mixed with Commercial waste when collected because both types of customers use dumpsters for garbage collection, but part of the Multi-Family waste is also collected separately using roll-offs and compactors. Additional samples were taken for Multi-Family waste from Olympia to allow this source to be analyzed separately.
Non-Residential Self-Haul: waste from businesses or contractors that is brought in by an employee of that business. The pattern in the delivery of this waste tends to be the opposite of Residential Self-Haul wastes, occurring primarily during regular work hours, and is typically brought in with larger vehicles (dump trucks, pickup trucks with trailers, and other trucks). A substantial amount of this waste stream consists of loads of construction and demolition wastes brought in by construction contractors.

Thurston County Waste Composition Study 5 Characterization of Thurston County’s Waste Stream
Commercial: waste from businesses (commercial and industrial) and institutions (schools, hospitals, government offices, etc.). These wastes are typically collected using front-loading garbage trucks (for emptying dumpsters) or trucks carrying roll-off containers and compactors, and are usually delivered early morning through mid-afternoon Monday through Friday. A small amount of Commercial waste is also collected by the City of Olympia and Waste Connections from carts using side- and rear-loaders. Additional samples were taken for Commercial waste from Olympia to allow this source to be analyzed separately.
Thurston County Offices: samples were taken each quarter from three Thurston County facilities to provide data on the results of recycling and waste reduction programs in those facilities. These results are shown in Appendix B.
Construction and demolition (C&D) wastes and other special wastes were included in the above categories as appropriate for the source and delivery method. C&D wastes are often delivered by employees of a construction company and so were frequently included with Non-Residential Self-Haul waste, but C&D wastes are also delivered by homeowners (which is defined as Residential Self-Haul waste), or by waste haulers from construction sites (Commercial waste), or even by waste haulers delivering roll-off containers from do-it-yourself home remodeling projects (Single-Family waste). Waste Quantity Procedures The quantity (tonnage) of waste disposed by each type of generator was determined by applying the results of a survey of the incoming traffic to data from scalehouse records. The survey data was used to allocate self-haul tonnages into Residential and Non-Residential, and to allocate hauler tonnages (for the City of Olympia and Waste Connections) into Single-Family, Multi-Family and Commercial wastes. Tonnages for a two-week period each season were determined in this way, and those tonnages were used to determine annual weighted averages for each type of waste generator by combining quarterly data for individual generators. The annual amount of Multi-Family waste for the City of Olympia was adjusted based on data from the City. The annual amounts for each generator and the annual weighted average for the entire county were determined by an in-depth analysis of a year’s worth of transaction records. The 12-month period of September 1, 2013 through August 31, 2014 was used for this analysis as this most closely corresponded to the sorting periods used for this study. This data initially consisted of 237,322 rows of transaction data, including date, gross tons, tare tons, net tons, customer name, truck number and other information for each transaction. After deleting outbound loads, there remained 191,612 transaction records for inbound loads of waste and yard waste (or mixed organics). This data was sorted by customer type and the survey data for each type applied to that category to allocate tonnages by generator type.

Thurston County Waste Composition Study 6 Characterization of Thurston County’s Waste Stream
Waste Composition Procedures The composition of the County's solid waste stream was determined by randomly selecting and sorting samples of waste at WARC. Sampling was conducted for six days each quarter. Each sample was sorted into 88 categories of materials. The Glossary provides additional detail on the definitions used for the categories of materials. C . R E S U L T S , W A S T E Q U A N T I T I E S Total Waste Quantities Table 1 shows the results of the analysis of a year’s worth of transaction records for the inbound loads at WARC. This data is shown by customer type, and was converted to the waste generator categories used in this study primarily by applying the waste quantity survey data gathered at the scalehouse and supplemented with additional research in some cases. The results of converting this data to the waste generator categories used for this study are shown in Table 2. Waste disposal rates are often expressed on a per capita basis. Based on an estimated population of 260,100 people in 2013 (from the Thurston Regional Planning Commission) and a total waste quantity of 158,701 tons per year, Thurston County’s waste disposal rate is 0.61 tons per person per year. This is the equivalent of 3.3 pounds per person per day or 1,220 pounds per person per year. This is a significant decrease from the previous two waste composition studies, which showed 0.82 tons per person per year in 2004 and 0.71 tons per person per year in 2009. A more precise approach for waste disposal rates is to express residential waste quantities on the basis of population figures and non-residential waste quantities on the number of employees (see below). Residential Waste Quantities Waste Quantities: The residential waste stream accounts for 51.4% of the County's total waste. This is up slightly from the 47.8% found in the previous waste composition study in 2009. Single-Family generators contribute 57.5% of the total residential waste stream, Multi-Family accounts for 11.9%, and Residential Self-Haul (including the Rural Dropboxes) accounts for 30.6% of the residential waste quantities. Residential Per Capita Disposal Rates: Based on 81,499 tons of residential waste per year and the County’s 2013 population (260,100 people), the current residential per capita disposal rate for Thurston County is 0.31 tons per person per year or 1.72 pounds per person per day.

Thurston County Waste Composition Study 7 Characterization of Thurston County’s Waste Stream
Table 1 ANNUAL QUANTITIES BY CUSTOMER TYPE
Type of Customer Type of Material Number of Transactions Weight, TPY
Cash Customers
MSW
C&D
Asbestos
Yard Waste
MSW by the Cubic Yard
92,374
21,263
21
22,848
19,684
17,465
12,814
15.3
5,381
NA1
Rural Dropboxes MSW 781 3,435
Waste Connections MSW and C&D
All Yard Waste2
16,249
2,164
89,298
13,213
City of Olympia MSW
Yard Waste
Blended Yard Waste2
4,917
175
832
25,996
482
5,842
Non-Residential Charge Customers
MSW
C&D
Asbestos
Vactor Waste
Yard Waste
MSW by the Cubic Yard
2,158
5,609
25
35
1,226
161
2,604
6,570
32.7
310
665
NA1
Other Charge Customers
Residential Self-Haul
Res. SH, Yard Waste
Multi-Family (MF)
MF Yard Waste
237
4
9
3
516
1.4
4.3
3.4
Other Landfill Maintenance
Christmas Trees
327
501
1,369
51
Subtotal, MSW and C&D 163,442 158,701
Subtotal, Organics 27,753 25,639
Subtotal, Other Wastes 408 1,727
TOTALS 191,612 186,067
Notes: The annual amounts shown above are for the period from September 1, 2013 through August
31, 2014. Asbestos, vactor wastes, and landfill maintenance wastes were not included in this study, but are shown here because these materials were included in the transaction records.
1. The category “MSW by the Cubic Yard” is for customers of the rural dropboxes. Weights are not known for these customers, but the aggregate weight for these customers is included in the Rural Dropboxes category.
2. “Blended yard waste” denotes mixed yard debris and food scraps. For Waste Connections, the figures for “all yard waste” include both blended yard waste and regular yard waste.

Thurston County Waste Composition Study 8 Characterization of Thurston County’s Waste Stream
Table 2 ANNUAL QUANTITIES OF DISPOSED WASTES BY SOURCE AND TYPE OF GENERATOR
Type of Generator
Annual Amount by Source, Tons Annual Amounts (2013-2014)
City of Olympia Waste
Connections Self-Haul Total Tons Percent
Residential Self-Haul NA NA 21,490 21,490 13.5%
Rural Dropboxes NA NA 3,435 3,435 2.2%
Single-Family 6,105 40,783 NA 46,888 29.5%
Multi-Family 4,324 5,362 NA 9,686 6.1%
Residential Subtotal 10,429 46,145 24,925 81,499 51.4%
Non-Residential Self-Haul NA NA 18,479 18,479 11.6%
Commercial 15,566 43,157 NA 58,723 37.0%
Non-Residential Subtotal 15,566 43,157 18,479 77,202 48.6%
Totals 25,996 89,302 43,403 158,701 100.0%
Percent of the Total Waste Stream
16.4% 56.3% 27.3%
The annual amounts shown above are for the period from September 1, 2013 through August 31, 2014, as this period most closely corresponds to the timing of this study. The annual amount for Olympia Multi-Family is a 2013 figure provided by the City.

Thurston County Waste Composition Study 9 Characterization of Thurston County’s Waste Stream
Non-Residential Waste Quantities Waste Quantities: The non-residential waste stream accounts for 48.6% of Thurston County's total waste. 23.9% of this, or 18,479 tons, was Non-Residential Self-Haul waste, and 76.1%, or 58,723 tons, was Commercial waste. Disposal Rates per Employee: Based on 77,202 tons of non-residential waste and the County’s estimated 2014 employment level of 103,700 workers (for August, 2014, from Workforce Explorer), the current non-residential disposal rate for Thurston County is 0.74 tons per employee per year or 5.8 pounds per employee per day (based on 255 workdays per year). D . R E S U L T S , W A S T E C O M P O S I T I O N Number of Samples The composition of the County’s waste stream was determined by randomly selecting and sorting a total of 252 samples of waste. These samples were allocated between the different types of generators based on the need to examine certain types in greater detail. Additional samples were also taken for three of the generators (Single-Family, Multi-Family and Commercial) to allow separate results to be reported for the City of Olympia. The number of samples taken each season is shown in Table 3.
Table 3 ALLOCATION OF SAMPLES BY TYPE OF GENERATOR
Type of Generator Oct. 2013
Jan. 2014
May 2014
August 2014
Total Samples Number Percent
Residential Self-Haul 11 10 10 10 41 16% Rural Dropboxes 4 4 4 4 16 6% Single-Family 11 11 11 11 44 18% Multi-Family 8 9 9 9 35 14%
Residential Subtotal 34 34 34 34 135 54%
Non-Residential Self-Haul 11 11 11 11 44 18% Commercial 15 15 15 15 60 24%
Non-Residential Subtotal 26 26 26 26 104 41%
County Buildings 3 3 3 3 12 5%
TOTALS 63 63 63 63 252 100%

Thurston County Waste Composition Study 10 Characterization of Thurston County’s Waste Stream
Waste Composition Results Table 4 shows the annual averages for each generator and for the entire County. As can be seen in this table, there are marked differences in the waste streams of the different types of waste generators. The results for the entire County are also illustrated in Figure 1. It should be noted that the figures shown in Table 4 have a specific degree of error associated with them. As with all sampling and survey procedures, a certain degree of error is unavoidable but quantifiable (see Appendix D for more details). Residential Waste Composition As can be seen in Table 4, there are substantial differences in the composition of wastes from the different residential sources. These differences can be explained by the different activities that created the wastes. Residential Self-Haul waste contains some “regular” household garbage but also contains a large amount of construction debris and other materials that are the result of special projects, since it is these projects that often motivate people to bring loads to the transfer station. The waste from the Rural Dropboxes is similar to Residential Self-Haul. Single-Family waste is influenced by the activities associated with owning and maintaining a home. The waste from apartments (Multi-Family) reflects a more mobile lifestyle and lower recycling participation (as indicated by the amounts of aluminum cans, plastic bottles and glass bottles that are higher than in Single-Family wastes). The results for each residential generator are illustrated in Figures 2 through 5. Non-Residential Waste Composition There are also significant differences between the two types of non-residential wastes. As with residential wastes, this can be explained by the different activities and sources for these wastes. The Commercial waste stream in Thurston County is influenced by various manufacturing activities and by the presence of the State Capitol and related offices, while the Non-Residential Self-Haul waste stream is dominated by construction activities. Ample evidence of the influence of construction activities is provided by the fact that over half of the Non-Residential Self-Haul waste stream is comprised of wood waste (24.2%) and construction/demolition waste (34.5%). The results for each non-residential generator are illustrated in Figures 6 and 7.

Newspaper 0.55% 0.13% 0.42% 1.03% 0.03% 0.53% 0.46%Cardboard 4.38% 1.74% 1.54% 2.65% 4.73% 4.10% 3.31%Mixed Waste Paper 4.30% 4.35% 4.95% 7.09% 0.86% 6.94% 5.24%Phone Books 0.06% 0% 0.09% 0.17% 0% 0.04% 0.06%Milk Cartons, Other 0.10% 0.13% 0.33% 0.35% 0.01% 0.40% 0.29%Compostable 1.47% 1.30% 3.96% 3.53% 0.49% 5.77% 3.81%Non-Recyclable Paper 1.02% 2.40% 1.91% 2.56% 1.38% 3.54% 2.38%Paper Subtotal 11.89% 10.05% 13.21% 17.38% 7.49% 21.34% 15.56%PET Bottles 0.83% 0.61% 0.87% 1.93% 0.17% 0.86% 0.84%HDPE Bottles 0.28% 0.40% 0.47% 0.91% 0.03% 0.56% 0.45%Bottles 3-7 0.10% 0.04% 0.06% 0.11% 0.01% 0.05% 0.06%Tubs 0.17% 0.16% 0.44% 0.36% 0.07% 0.26% 0.28%Carryout Bags 0.33% 0.36% 0.74% 0.93% 0.04% 0.33% 0.46%Bags and Film 2.25% 2.63% 5.09% 4.02% 1.14% 6.11% 4.51%Plastic Packaging 1.24% 1.25% 1.67% 1.71% 0.27% 2.17% 1.63%Other Plastic Products 3.33% 4.39% 2.22% 1.76% 1.88% 3.12% 2.68%Expanded Polystyrene 0.36% 0.19% 0.58% 0.76% 2.25% 0.36% 0.67%Plastic Subtotal 8.90% 10.03% 12.15% 12.49% 5.85% 13.83% 11.57%Aluminum Cans 0.37% 0.35% 0.29% 1.11% 0.05% 0.41% 0.37%Aluminum Foil 0.13% 0.36% 0.23% 0.28% 0.04% 0.11% 0.16%Tin Cans 0.64% 0.55% 1.00% 1.20% 0.05% 0.49% 0.66%Mixed Metals 4.87% 7.53% 1.35% 1.67% 0.72% 2.05% 2.17%Ferrous Metals 1.86% 2.62% 0.60% 0.22% 1.11% 1.03% 1.01%White Goods 0% 0.65% 0% 0% 0.63% 0% 0.09%Non-Ferrous Metals 0.31% 0.07% 0.16% 0.06% 0.15% 0.39% 0.26%Aerosol Cans 0.21% 0.21% 0.22% 0.24% 0.05% 0.16% 0.18%Metal Subtotal 8.39% 12.34% 3.85% 4.77% 2.80% 4.64% 4.87%Food Waste 11.07% 7.71% 22.92% 22.42% 0.60% 19.00% 16.91%Yard Debris 2.08% 3.71% 7.27% 2.17% 1.06% 1.03% 3.15%Organics Subtotal 13.15% 11.43% 30.20% 24.59% 1.66% 20.03% 20.06%Clear Bottles 2.37% 1.02% 1.63% 3.08% 0.27% 0.75% 1.32%Brown Bottles 3.44% 1.37% 1.23% 1.54% 0.05% 0.46% 1.13%Green Bottles 0.31% 0.34% 0.53% 0.85% 0.05% 0.15% 0.32%Light Bulbs 0.16% 0.02% 0.05% 0.02% 0.02% 0.03% 0.05%Non-Recyclable Glass 1.52% 0.15% 0.21% 0.26% 4.53% 1.44% 1.35%Glass Subtotal 7.79% 2.91% 3.64% 5.75% 4.91% 2.84% 4.17%E-Waste 0% 0% 0% 0.07% 0% 0.01% 0.01%Other Electronics 0.23% 0.21% 0.09% 0.09% 0% 0.13% 0.12%Tires 0.11% 4.88% 0.03% 0.32% 0% 0% 0.15%Rubber 0.36% 2.80% 0.60% 0.14% 0.56% 0.58% 0.57%Cosmetics 0.33% 0.11% 0.33% 0.41% 0.01% 0.10% 0.21%Pharmaceuticals 0.07% 0.01% 0.11% 0.06% 0% 0.02% 0.05%Diapers 0.58% 2.12% 4.98% 6.04% 0.08% 2.35% 2.84%Textiles 4.39% 3.87% 4.76% 5.79% 0.76% 3.10% 3.67%Carpet 3.82% 4.65% 0.41% 0.53% 6.27% 5.44% 3.51%Carpet Padding 2.05% 0.03% 0.01% 1.17% 0.69% 1.47% 0.98%Furniture 6.03% 0.33% 0.57% 0.55% 8.31% 0.72% 2.26%Mattresses 1.68% 2.78% 0% 0.52% 0.35% 0% 0.36%Ash, Dust 1.19% 1.78% 0.19% 0.20% 0.001% 0.42% 0.42%Miscellaneous Organics 0.03% 0.13% 0.04% 0.01% 0% 0.05% 0.04%Miscellaneous Inorganics 0.21% 0.18% 0.27% 0.37% 0.07% 0.48% 0.32%Residuals 3.01% 4.83% 13.10% 9.35% 1.33% 8.89% 8.40%Other Wastes Subtotal 24.09% 28.71% 25.50% 25.60% 18.45% 23.77% 23.92%Wood 18.10% 14.40% 2.53% 3.22% 24.19% 7.57% 9.32%Construction, Demolition 5.24% 8.61% 1.30% 0.91% 34.49% 5.12% 7.25%Wood, C&D Subtotal 23.35% 23.01% 3.83% 4.13% 58.67% 12.70% 16.57%Paints and Solvents 0.88% 0.09% 0.01% 0.11% 0.02% 0.08% 0.16%Automotive 0.04% 0.18% 0.02% 0.002% 0% 0.14% 0.07%Home and Garden 0.004% 0% 0.11% 0.001% 0% 0% 0.03%Other Special Wastes 1.51% 1.25% 7.49% 5.16% 0.15% 0.65% 3.02%Actual Hazardous Wastes 0.19% 0.16% 0.04% 0.01% 0.02% 0.16% 0.10%Special Waste Subtotal 2.44% 1.53% 7.63% 5.28% 0.16% 0.86% 3.28%
TOTALS 100.0% 100.0% 100.0% 100.0% 100.0% 100.0% 100.0%
Pounds of Samples Sorted: 8,024 3,372 9,510 7,512 8,738 11,873 46,758 (1)Number of Samples Sorted: 41 16 44 35 44 60 252 (1)
Notes: All figures are percent by weight (except for the bottom two rows).1. The total number of samples and pounds sorted includes 12 samples and 1,828 pounds for specific County buildings.
PLASTIC
METAL
ORGANICS
GLASS
OTHER WASTES
WOOD and C&D
SPECIAL WASTES
Residential Average forSelf-Haul Dropboxes Family Self-Haul
Table 4WASTE COMPOSITION RESULTS
PAPER
Non-Res.CommercialFamily
Rural Single- Multi-Entire County
Thurston County Waste Composition Study 11 Characterization of Thurston County's Waste Stream
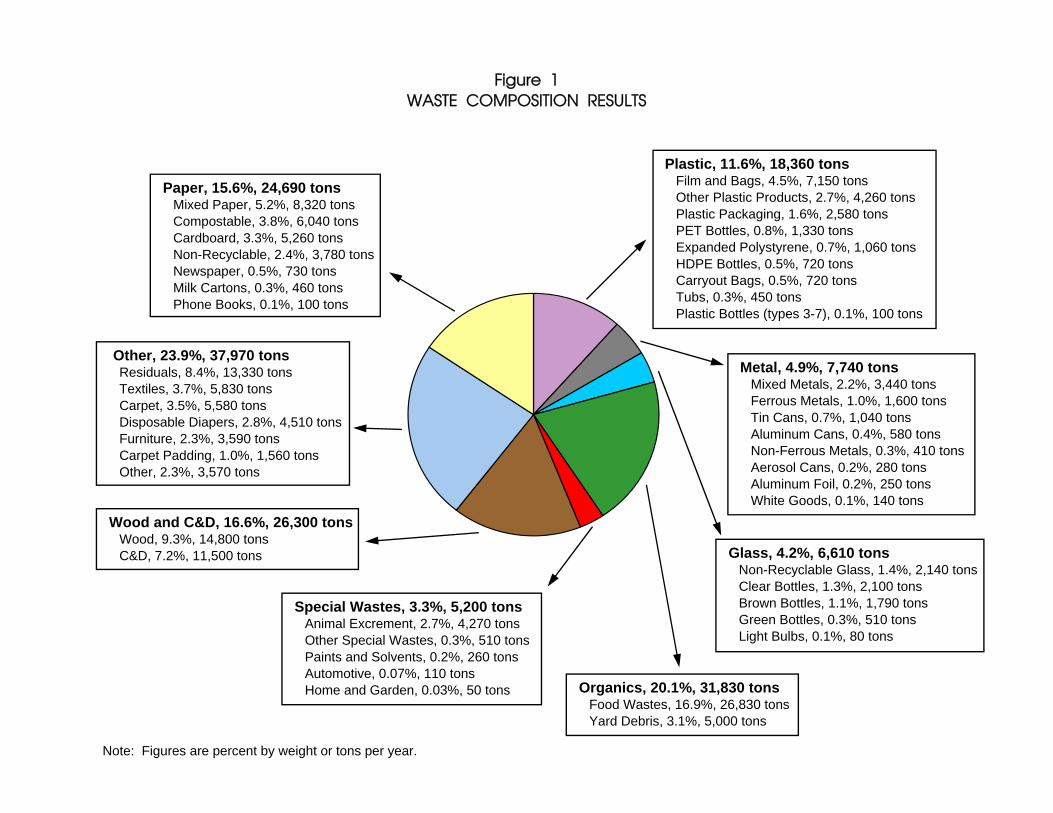
Paper, 15.6%, 24,690 tons Mixed Paper, 5.2%, 8,320 tons Compostable, 3.8%, 6,040 tons Cardboard, 3.3%, 5,260 tons Non-Recyclable, 2.4%, 3,780 tons Newspaper, 0.5%, 730 tons Milk Cartons, 0.3%, 460 tons Phone Books, 0.1%, 100 tons
Plastic, 11.6%, 18,360 tons Film and Bags, 4.5%, 7,150 tons Other Plastic Products, 2.7%, 4,260 tons Plastic Packaging, 1.6%, 2,580 tons PET Bottles, 0.8%, 1,330 tons Expanded Polystyrene, 0.7%, 1,060 tons HDPE Bottles, 0.5%, 720 tons Carryout Bags, 0.5%, 720 tons Tubs, 0.3%, 450 tons Plastic Bottles (types 3-7), 0.1%, 100 tons
Metal, 4.9%, 7,740 tons Mixed Metals, 2.2%, 3,440 tons Ferrous Metals, 1.0%, 1,600 tons Tin Cans, 0.7%, 1,040 tons Aluminum Cans, 0.4%, 580 tons Non-Ferrous Metals, 0.3%, 410 tons Aerosol Cans, 0.2%, 280 tons Aluminum Foil, 0.2%, 250 tons White Goods, 0.1%, 140 tons
Glass, 4.2%, 6,610 tons Non-Recyclable Glass, 1.4%, 2,140 tons Clear Bottles, 1.3%, 2,100 tons Brown Bottles, 1.1%, 1,790 tons Green Bottles, 0.3%, 510 tons Light Bulbs, 0.1%, 80 tons
Organics, 20.1%, 31,830 tons Food Wastes, 16.9%, 26,830 tons Yard Debris, 3.1%, 5,000 tons
Special Wastes, 3.3%, 5,200 tons Animal Excrement, 2.7%, 4,270 tons Other Special Wastes, 0.3%, 510 tons Paints and Solvents, 0.2%, 260 tons Automotive, 0.07%, 110 tons Home and Garden, 0.03%, 50 tons
Figure 1 WASTE COMPOSITION RESULTS
Note: Figures are percent by weight or tons per year.
Other, 23.9%, 37,970 tons Residuals, 8.4%, 13,330 tons Textiles, 3.7%, 5,830 tons Carpet, 3.5%, 5,580 tons Disposable Diapers, 2.8%, 4,510 tons Furniture, 2.3%, 3,590 tons Carpet Padding, 1.0%, 1,560 tons Other, 2.3%, 3,570 tons
Wood and C&D, 16.6%, 26,300 tons Wood, 9.3%, 14,800 tons C&D, 7.2%, 11,500 tons

SUMMARY OF WASTE COMPOSITION RESULTS:
PAPER Percent TPY WOOD AND C&D Percent TPYNewspaper 0.6% 120 Wood 18.1% 3,890Cardboard 4.4% 940 Construction, Demolition 5.2% 1,130Other Recyclable Paper 4.5% 960 Wood, C&D Subtotal 23.3% 5,020Compostable Paper 1.5% 320Non-Recyclable Paper 1.0% 220 SPECIAL WASTESPaper Subtotal 11.9% 2,550 Animal Excrement 1.0% 200
Other Special Wastes 1.5% 320PLASTIC Special Waste Subtotal 2.4% 520Plastic Bottles 1.2% 260Film and Bags 2.6% 560 ORGANICSOther Plastic 5.1% 1,100 Food Waste 11.1% 2,380Plastic Subtotal 8.9% 1,910 Yard Debris 2.1% 450
Organics Subtotal 13.2% 2,830METALAluminum Cans 0.4% 80 OTHER
Tin Cans 0.6% 140 Disposable Diapers 0.6% 120Other Metals 7.4% 1,590 Textiles 4.4% 940Metal Subtotal 8.4% 1,800 Carpet and Padding 5.9% 1,260
Miscellaneous (1) 13.3% 2,850GLASS Other Subtotal 24.1% 5,180
Glass Bottles 6.1% 1,310Other Glass 1.7% 360 TOTALS 100.0% 21,490Glass Subtotal 7.8% 1,670
Notes: Percentage figures are percent by weight. TPY = tons per year.
1) "Miscellaneous" includes e-waste, other electronics, tires, other rubber products, cosmetics, pharmaceuticals,
furniture, mattresses, ash, dust, miscellaneous organics, miscellaneous inorganics and residuals.
Figure 2RESIDENTIAL SELF - HAUL WASTE
Plastic8.9%
Metal8.4%
Glass7.8%
Organics13.2%
Special Wastes2.4%Wood and C&D
23.3%
Other24.1%
Paper11.9%
Thurston County Waste Composition Study 13 Characterization of Thurston County's Waste Stream

SUMMARY OF WASTE COMPOSITION RESULTS:
PAPER Percent TPY WOOD AND C&D Percent TPYNewspaper 0.1% 5 Wood 14.4% 490Cardboard 1.7% 60 Construction, Demolition 8.6% 300Other Recyclable Paper 4.5% 150 Wood, C&D Subtotal 23.0% 790Compostable Paper 1.3% 40Non-Recyclable Paper 2.4% 80 SPECIAL WASTESPaper Subtotal 10.0% 350 Animal Excrement 1.1% 40
Other Special Wastes 0.4% 10PLASTIC Special Waste Subtotal 1.5% 50Plastic Bottles 1.1% 40Film and Bags 3.0% 100 ORGANICSOther Plastic 6.0% 210 Food Waste 7.7% 260Plastic Subtotal 10.0% 340 Yard Debris 3.7% 130
Organics Subtotal 11.4% 390METALAluminum Cans 0.3% 10 OTHERTin Cans 0.5% 20 Disposable Diapers 2.1% 70Other Metals 11.4% 390 Textiles 3.9% 130Metal Subtotal 12.3% 420 Carpet and Padding 4.7% 160
Miscellaneous (1) 18.0% 620GLASS Other Subtotal 28.7% 990Glass Bottles 2.7% 90Other Glass 0.2% 10 TOTALS 100.0% 3,435Glass Subtotal 2.9% 100
Notes: Percentage figures are percent by weight. TPY = tons per year.1) "Miscellaneous" includes e-waste, other electronics, tires, other rubber products, cosmetics, pharmaceuticals, furniture, mattresses, ash, dust, miscellaneous organics, miscellaneous inorganics and residuals.
Figure 3RURAL DROPBOX WASTE
Plastic10.0%
Metal12.3%
Glass2.9%
Organics11.4%
Special Wastes1.5%
Wood and C&D23.0%
Other28.7%
Paper10.0%
Thurston County Waste Composition Study 14 Characterization of Thurston County's Waste Stream

SUMMARY OF WASTE COMPOSITION RESULTS:
PAPER Percent TPY WOOD AND C&D Percent TPYNewspaper 0.4% 200 Wood 2.5% 1,180Cardboard 1.5% 720 Construction, Demolition 1.3% 610Other Recyclable Paper 5.4% 2,520 Wood, C&D Subtotal 3.8% 1,800Compostable Paper 4.0% 1,860Non-Recyclable Paper 1.9% 900 SPECIAL WASTESPaper Subtotal 13.2% 6,190 Animal Excrement 7.0% 3,270
Other Special Wastes 0.7% 310PLASTIC Special Waste Subtotal 7.6% 3,580Plastic Bottles 1.4% 650Film and Bags 5.8% 2,740 ORGANICSOther Plastic 4.9% 2,300 Food Waste 22.9% 10,750Plastic Subtotal 12.1% 5,700 Yard Debris 7.3% 3,410
Organics Subtotal 30.2% 14,160METALAluminum Cans 0.3% 140 OTHERTin Cans 1.0% 470 Disposable Diapers 5.0% 2,330Other Metals 2.6% 1,200 Textiles 4.8% 2,230Metal Subtotal 3.9% 1,810 Carpet and Padding 0.4% 200
Miscellaneous (1) 15.3% 7,190GLASS Other Subtotal 25.5% 11,950Glass Bottles 3.4% 1,590Other Glass 0.3% 120 TOTALS 100.0% 46,888Glass Subtotal 3.6% 1,710
Notes: Percentage figures are percent by weight. TPY = tons per year.1) "Miscellaneous" includes e-waste, other electronics, tires, other rubber products, cosmetics, pharmaceuticals, furniture, mattresses, ash, dust, miscellaneous organics, miscellaneous inorganics and residuals.
Figure 4SINGLE - FAMILY WASTE
Plastic12.1%
Metal3.9%
Glass3.6%
Organics30.2%
Special Wastes7.6%
Wood and C&D3.8%
Other25.5%
Paper13.2%
Thurston County Waste Composition Study 15 Characterization of Thurston County's Waste Stream

SUMMARY OF WASTE COMPOSITION RESULTS:
PAPER Percent TPY WOOD AND C&D Percent TPYNewspaper 1.0% 100 Wood 3.2% 310Cardboard 2.7% 260 Construction, Demolition 0.9% 90Other Recyclable Paper 7.6% 740 Wood, C&D Subtotal 4.1% 400Compostable Paper 3.5% 340Non-Recyclable Paper 2.6% 250 SPECIAL WASTESPaper Subtotal 17.4% 1,680 Animal Excrement 4.8% 460
Other Special Wastes 0.5% 50PLASTIC Special Waste Subtotal 5.3% 510Plastic Bottles 3.0% 290Film and Bags 4.9% 480 ORGANICSOther Plastic 4.6% 440 Food Waste 22.4% 2,170Plastic Subtotal 12.5% 1,210 Yard Debris 2.2% 210
Organics Subtotal 24.6% 2,380METALAluminum Cans 1.1% 110 OTHERTin Cans 1.2% 120 Disposable Diapers 6.0% 590Other Metals 2.5% 240 Textiles 5.8% 560Metal Subtotal 4.8% 460 Carpet and Padding 1.7% 160
Miscellaneous (1) 12.1% 1,170GLASS Other Subtotal 25.6% 2,480Glass Bottles 5.5% 530Other Glass 0.3% 30 TOTALS 100.0% 9,686Glass Subtotal 5.8% 560
Notes: Percentage figures are percent by weight. TPY = tons per year.1) "Miscellaneous" includes e-waste, other electronics, tires, other rubber products, cosmetics, pharmaceuticals, furniture, mattresses, ash, dust, miscellaneous organics, miscellaneous inorganics and residuals.
Figure 5MULTI - FAMILY WASTE
Plastic12.5%
Metal4.8%
Glass5.8%
Organics24.6%
Special Wastes5.3%
Wood and C&D4.1%
Other25.6%
Paper17.4%
Thurston County Waste Composition Study 16 Characterization of Thurston County's Waste Stream

SUMMARY OF WASTE COMPOSITION RESULTS:
PAPER Percent TPY WOOD AND C&D Percent TPYNewspaper 0.03% 5 Wood 24.2% 4,470Cardboard 4.7% 870 Construction, Demolition 34.5% 6,370Other Recyclable Paper 0.9% 160 Wood, C&D Subtotal 58.7% 10,840Compostable Paper 0.5% 90Non-Recyclable Paper 1.4% 250 SPECIAL WASTESPaper Subtotal 7.5% 1,380 Animal Excrement 0.1% 10
Other Special Wastes 0.1% 20PLASTIC Special Waste Subtotal 0.2% 30Plastic Bottles 0.2% 40Film and Bags 1.2% 220 ORGANICSOther Plastic 4.5% 820 Food Waste 0.6% 110Plastic Subtotal 5.9% 1,080 Yard Debris 1.1% 200
Organics Subtotal 1.7% 310METALAluminum Cans 0.05% 10 OTHERTin Cans 0.05% 10 Disposable Diapers 0.1% 10Other Metals 2.7% 500 Textiles 0.8% 140Metal Subtotal 2.8% 520 Carpet and Padding 7.0% 1,290
Miscellaneous (1) 10.6% 1,970GLASS Other Subtotal 18.5% 3,410Glass Bottles 0.4% 70Other Glass 4.5% 840 TOTALS 100.0% 18,479Glass Subtotal 4.9% 910
Notes: Percentage figures are percent by weight. TPY = tons per year.1) "Miscellaneous" includes e-waste, other electronics, tires, other rubber products, cosmetics, pharmaceuticals, furniture, mattresses, ash, dust, miscellaneous organics, miscellaneous inorganics and residuals.
Figure 6NON - RESIDENTIAL SELF - HAUL WASTE
Plastic5.9%
Metal2.8%
Glass4.9%
Organics1.7%
Special Wastes0.2%
Wood and C&D58.7%
Other18.5%
Paper7.5%
Thurston County Waste Composition Study 17 Characterization of Thurston County's Waste Stream
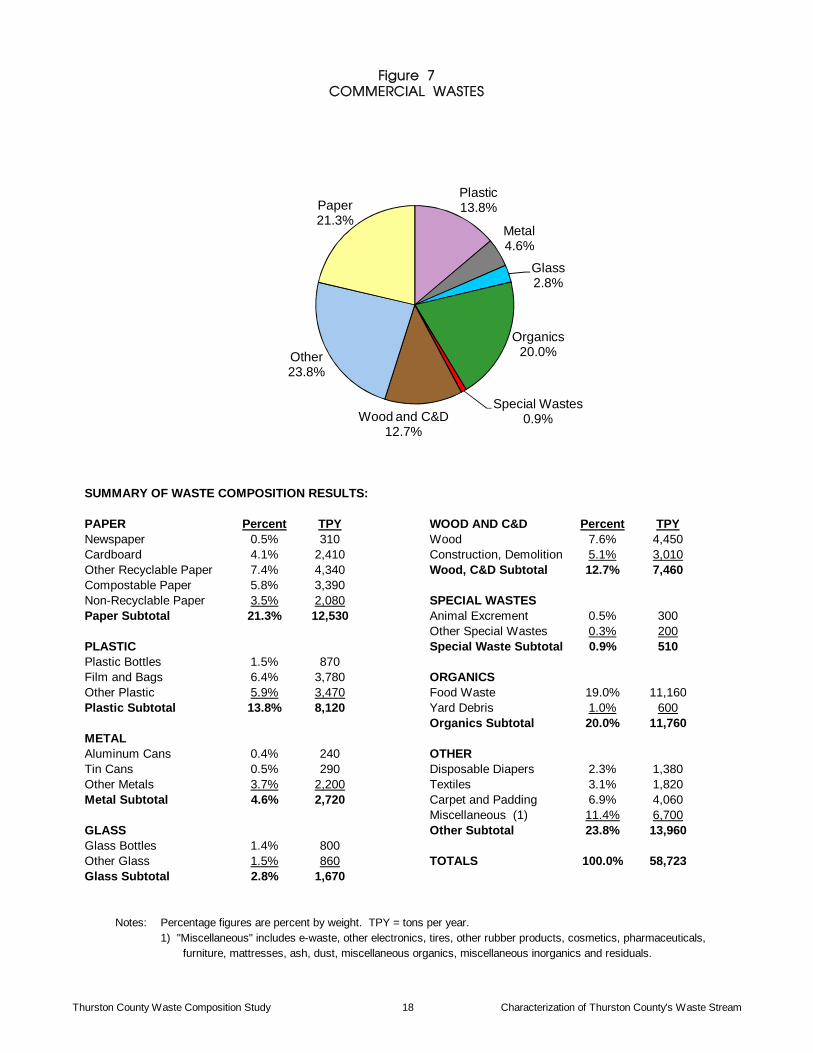
SUMMARY OF WASTE COMPOSITION RESULTS:
PAPER Percent TPY WOOD AND C&D Percent TPYNewspaper 0.5% 310 Wood 7.6% 4,450Cardboard 4.1% 2,410 Construction, Demolition 5.1% 3,010Other Recyclable Paper 7.4% 4,340 Wood, C&D Subtotal 12.7% 7,460Compostable Paper 5.8% 3,390Non-Recyclable Paper 3.5% 2,080 SPECIAL WASTESPaper Subtotal 21.3% 12,530 Animal Excrement 0.5% 300
Other Special Wastes 0.3% 200PLASTIC Special Waste Subtotal 0.9% 510Plastic Bottles 1.5% 870Film and Bags 6.4% 3,780 ORGANICSOther Plastic 5.9% 3,470 Food Waste 19.0% 11,160Plastic Subtotal 13.8% 8,120 Yard Debris 1.0% 600
Organics Subtotal 20.0% 11,760METALAluminum Cans 0.4% 240 OTHERTin Cans 0.5% 290 Disposable Diapers 2.3% 1,380Other Metals 3.7% 2,200 Textiles 3.1% 1,820Metal Subtotal 4.6% 2,720 Carpet and Padding 6.9% 4,060
Miscellaneous (1) 11.4% 6,700GLASS Other Subtotal 23.8% 13,960Glass Bottles 1.4% 800Other Glass 1.5% 860 TOTALS 100.0% 58,723Glass Subtotal 2.8% 1,670
Notes: Percentage figures are percent by weight. TPY = tons per year.1) "Miscellaneous" includes e-waste, other electronics, tires, other rubber products, cosmetics, pharmaceuticals, furniture, mattresses, ash, dust, miscellaneous organics, miscellaneous inorganics and residuals.
COMMERCIAL WASTESFigure 7
Plastic13.8%
Metal4.6%
Glass2.8%
Organics20.0%
Special Wastes0.9%Wood and C&D
12.7%
Other23.8%
Paper21.3%
Thurston County Waste Composition Study 18 Characterization of Thurston County's Waste Stream

Thurston County Waste Composition Study 19 Characterization of Thurston County’s Waste Stream
E . W E I G H T O F M A T E R I A L S D I S P O S E D The waste quantity and composition results can be combined to show the total weight of disposed materials. Table 5 provides this information for the six waste generators and for the County’s entire waste stream. F . W O O D , C & D A N D S P E C I A L W A S T E S Additional data on the breakdown of wood, construction/demolition, and special wastes is shown in Table 6. Most of this data does not have the same level of statistical certainty as the primary categories of materials due to the lower quantities and greater variability of these materials in the waste stream, but this data may still be useful for future planning activities focused on these types of wastes. Included in the breakdown for special wastes is an assessment of the amount that met the criteria for hazardous waste. More details about these wastes are shown in Table 7. Table 7 shows only those materials that were actually classified as hazardous waste (in other words, for several categories there were also non-hazardous items found and these are not included in the figures). The figures shown in Table 7 are the number of times that each item was found, except for medical waste where the total number of syringes found is also shown. It should be noted that these numbers correspond to a variable amount of waste sorted for each generator, so comparing the figures between different types of generators may be misleading. For instance, fewer samples and hence less garbage was sorted for the Rural Dropboxes waste stream, so the lower number of items found in that category are largely the result of that difference. As shown in Table 7, banned electronic wastes (“e-wastes”) were found two times over the course of the fieldwork. Items found included a laptop and desktop unit. The count for these items is shown in Table 7 but the weight of these items (and the fluorescent bulbs and CFLs) is not included in the weight for “actual hazardous wastes.” G . A D D I T I O N A L D A T A A N D O B S E R V A T I O N S Types of Light Bulbs Found The types of light bulbs found were noted during the fieldwork for this study. For all of the samples taken together, 75.6% by weight of the light bulbs found were incandescent bulbs (including a few halogen bulbs), 16.8% were compact fluorescent bulbs (CFLs), and 7.6% were fluorescent bulbs. Compared to the previous study, these figures reflect a decrease in incandescent bulbs (78.2% were found in the 2009 study) and fluorescent bulbs (10.1% previously), and an increase in CFL bulbs (from 11.8% previously). The number of times that CFLs and fluorescent tubes were found is shown in Table 7.

Newspaper 120 5 200 100 5 310 730Cardboard 940 60 720 260 870 2,410 5,260Mixed Waste Paper 920 150 2,320 690 160 4,080 8,320Phone Books 10 0 40 20 0 20 100Milk Cartons, Other 20 4 160 30 2 240 460Compostable 320 40 1,860 340 90 3,390 6,040Non-Recyclable Paper 220 80 900 250 250 2,080 3,780Paper Subtotal 2,550 350 6,190 1,680 1,380 12,530 24,690PET Bottles 180 20 410 190 30 500 1,330HDPE Bottles 60 10 220 90 10 330 720Bottles 3-7 20 1 30 10 2 30 100Tubs 40 10 200 30 10 150 450Carryout Bags 70 10 350 90 10 200 720Bags and Film 480 90 2,390 390 210 3,590 7,150Plastic Packaging 270 40 780 170 50 1,270 2,580Other Plastic Products 710 150 1,040 170 350 1,840 4,260Expanded Polystyrene 80 10 270 70 420 210 1,060Plastic Subtotal 1,910 340 5,700 1,210 1,080 8,120 18,360Aluminum Cans 80 10 140 110 10 240 580Aluminum Foil 30 10 110 30 10 70 250Tin Cans 140 20 470 120 10 290 1,040Mixed Metals 1,050 260 630 160 130 1,200 3,440Ferrous Metals 400 90 280 20 200 600 1,600White Goods 0 20 0 0 120 0 140Non-Ferrous Metals 70 2 80 5 30 230 410Aerosol Cans 40 10 100 20 10 100 280Metal Subtotal 1,800 420 1,810 460 520 2,720 7,740Food Waste 2,380 260 10,750 2,170 110 11,160 26,830Yard Debris 450 130 3,410 210 200 600 5,000Organics Subtotal 2,830 390 14,160 2,380 310 11,760 31,830Clear Bottles 510 40 770 300 50 440 2,100Brown Bottles 740 50 580 150 10 270 1,790Green Bottles 70 10 250 80 10 90 510Light Bulbs 30 1 20 2 3 20 80Non-Recyclable Glass 330 10 100 30 840 850 2,140Glass Subtotal 1,670 100 1,710 560 910 1,670 6,610E-Waste 0 0 0 6 0 10 10Other Electronics 50 10 40 10 0 80 190Tires 20 170 10 30 0 0 230Rubber 80 100 280 10 100 340 910Cosmetics 70 4 160 40 2 60 330Pharmaceuticals 20 0 50 6 0 10 90Diapers 120 70 2,330 590 10 1,380 4,510Textiles 940 130 2,230 560 140 1,820 5,830Carpet 820 160 190 50 1,160 3,190 5,580Carpet Padding 440 1 10 110 130 870 1,560Furniture 1,300 10 260 50 1,540 420 3,590Mattresses 360 100 0 50 60 0 570Ash, Dust 250 60 90 20 0 240 670Miscellaneous Organics 10 4 20 1 0 30 70Miscellaneous Inorganics 50 10 130 40 10 280 510Residuals 650 170 6,140 910 250 5,220 13,330Other Wastes Subtotal 5,180 990 11,950 2,480 3,410 13,960 37,970Wood 3,890 490 1,180 310 4,470 4,450 14,800Construction, Demolition 1,130 300 610 90 6,370 3,010 11,500Wood, C&D Subtotal 5,020 790 1,800 400 10,840 7,460 26,300Paints and Solvents 190 3 10 10 3 50 260Automotive 10 10 10 0 0 80 110Home and Garden 1 0 50 0 0 0 50Other Special Wastes 320 40 3,510 500 30 380 4,790Actual Hazardous Wastes 40 10 20 1 3 90 160Special Waste Subtotal 520 50 3,580 510 30 510 5,200
TOTALS 21,490 3,440 46,890 9,690 18,480 58,720 158,700
Notes: All figures are tons per year.
PAPER
PLASTIC
METAL
ORGANICS
GLASS
OTHER WASTES
WOOD and C&D
SPECIAL WASTES
Table 5
RuralEntire County
Non-Res.Single-
WEIGHT OF DISPOSED MATERIALS
Residential Totals forMulti-Family Self-Haul CommercialDropboxesSelf-Haul Family
Thurston County Waste Composition Study 20 Characterization of Thurston County's Waste Stream

Dimension Lumber 10.2% 9.4% 0.4% 0.8% 9.1% 0.8% 3.1%Pallets, Crates 0.1% 0% 0% 0% 2.6% 0.3% 0.4%Treated Wood 1.1% 0.6% 0.1% 0.02% 0.3% 0% 0.2%Roofing 0% 0% 0% 0% 0% 0% 0%Contaminated 0.9% 1.0% 0.003% 0.06% 0.6% 2.7% 1.2%Stumps, Other Bulky Wood 0.1% 0% 0% 0% 0.1% 0.1% 0.04%Plywood 2.0% 0.8% 0.5% 0.4% 2.8% 0.4% 0.9%Particleboard, Fiberboard 3.4% 2.2% 1.4% 1.8% 8.6% 3.0% 3.2%Wood Products 0.2% 0.2% 0.1% 0.2% 0.1% 0.3% 0.2%Other Wood 0.04% 0.17% 0% 0% 0% 0.01% 0.01%Total Wood Waste 18.1% 14.4% 2.5% 3.2% 24.2% 7.6% 9.3%Ceramics, Porc., China 1.5% 0.1% 0.02% 0% 3.4% 0.7% 0.9%Rocks, Bricks 0.02% 0% 0.03% 0.003% 0.4% 0% 0.1%Concrete 0% 0.7% 0.2% 0.2% 1.6% 0.1% 0.3%Soil, Dirt, Fines 0.4% 0.9% 0.7% 0.4% 0.8% 0.1% 0.4%Gypsum Board 0.1% 2.3% 0.1% 0.2% 10.2% 2.6% 2.2%Fiberglass Insulation 0.1% 0.1% 0.01% 0.001% 3.3% 0.6% 0.6%Other Fiberglass 0% 0.6% 0% 0% 1.2% 0.02% 0.2%Roofing 1.0% 2.8% 0.04% 0.1% 12.0% 0.4% 1.8%Asphalt 0% 0% 0% 0% 0% 0.1% 0.03%Other C&D 2.1% 1.0% 0.2% 0.1% 1.6% 0.6% 0.8%Total C&D Waste 5.2% 8.6% 1.3% 0.9% 34.5% 5.1% 7.2%Paints and Solvents;Latex Paint 0.8% 0.1% 0.01% 0.1% 0% 0.1% 0.15%Oil-Based Paint 0.04% 0% 0% 0% 0% 0% 0.01%Solvents 0.01% 0% 0.01% 0.003% 0.02% 0% 0.004%Automotive Wastes;Motor Oil, Other Oils 0% 0% 0.01% 0% 0% 0.03% 0.01%Oil Filters 0% 0.2% 0% 0% 0% 0.1% 0.05%Gasoline, Fuel Oil 0% 0% 0% 0% 0% 0% 0%Antifreeze 0% 0% 0% 0% 0% 0% 0%Other Auto Maintenance 0% 0% 0% 0% 0% 0% 0%Batteries, Car 0.04% 0% 0.01% 0.002% 0% 0% 0.01%Home and Garden;Pesticides, Herbicides 0.004% 0% 0.01% 0% 0% 0% 0.002%Fertilizer w/Pest. and Herb. 0% 0% 0% 0% 0% 0% 0%Fertilizer w/o Pest., Herb. 0% 0% 0.1% 0.001% 0% 0% 0.03%Other;Adhesives, Glues 0.2% 0.05% 0.08% 0% 0.09% 0.02% 0.07%Cleaners, Corrosives 0.1% 0.01% 0.02% 0.1% 0% 0.01% 0.03%Medical Wastes 0.01% 0.02% 0.02% 0.03% 0% 0.1% 0.04%Household Batteries 0.1% 0.1% 0.2% 0.2% 0.01% 0.04% 0.10%Animal Excrement 1.0% 1.1% 7.0% 4.8% 0.05% 0.5% 2.69%Animal Carcasses 0.05% 0% 0.2% 0% 0% 0% 0.06%Gas Cylinders 0% 0% 0% 0% 0% 0% 0%Other Special Wastes 0.02% 0% 0.02% 0% 0% 0.01% 0.01%Actual Hazardous Waste 0.19% 0.16% 0.04% 0.01% 0.02% 0.16% 0.10%Total Special Waste 2.4% 1.5% 7.6% 5.3% 0.2% 0.9% 3.3%
Notes: All figures are percentages by weight.
DropboxesSelf-Haul
WO
OD
WA
STE
CO
NST
RU
CTI
ON
AN
D
DEM
OLI
TIO
N (
C&
D)
WA
STE
SPEC
IAL
WA
STES
FamilyNon-Res.Single-Rural
Entire CountyCommercialFamily Self-HaulMulti-
Table 6BREAKDOWN OF WOOD, C&D AND SPECIAL WASTES
Average forResidential
Thurston County Waste Composition Study 21 Characterization of Thurston County's Waste Stream

Thurston County Waste Composition Study 22 Characterization of Thurston County’s Waste Stream
Table 7 NUMBER OF TIMES HAZARDOUS WASTES WERE FOUND
Type of Hazardous Waste Res. Self-
Haul
Rural Drop-boxes
Single-Family
Multi-Family
Non-Res. Self-Haul
Com- mercial Totals
Oil Paint 2 2
Solvents 2 1 1 1 5
Motor Oil 1 1 2
Oil Filters 2 3 5
Car Batteries 1* 1* 2
Pesticides and Herbicides 2 2 4
Fertilizers w/o Pesticides 1 1 2
Adhesives and Glues 3 1 1 5
Cleaners 1 1 1 2 5
Medical Waste (and Number of Syringes)
4 (7) 2 (47) 17 (169) 9 (36) 12 (27) 44 (286)
Rechargeable Batteries 1 3 4
Other 2 (live ammo)
2
Total Number of Times that Wastes were Found
18 4 28 12 1 19 82
Total Amount of Hazardous Waste, % by Weight
0.19% 0.16% 0.04% 0.01% 0.02% 0.15% 0.10%
Additional Materials of Concern:
Compact Fluorescents 3 1 8 1 1 4 18
Fluorescent Tubes 1 2 1 4
E-Wastes 1 1 2
Subtotal, Additional Materials of Concern
4 1 8 4 1 6 24
* Items shown as “car batteries” were actually smaller batteries of similar use and construction. Latex paint is not shown above because it is not classified as hazardous. Other types of special wastes not shown above were not found.

Thurston County Waste Composition Study 23 Characterization of Thurston County’s Waste Stream
Carryout Bags As of July 1, 2014, many types of plastic bags were banned from use at retail stores in most of Thurston County (Lacey, Olympia, Tumwater and unincorporated Thurston County). In anticipation of this ban, a category for “carryout bags” was added to the list of materials measured by this study. As can be seen in Table 8, the results for this category show a decrease in the amount of carryout bags for all generator types.
Table 8 AMOUNT OF CARRYOUT BAGS
Type of Waste Generator Average of
Three Quarters August, 2014 Percent Reduction
Residential Self-Haul 0.36% 0.26% 28%
Rural Dropboxes 0.45% 0.15% 67%
Single-Family 0.86% 0.40% 53%
Multi-Family 1.09% 0.44% 60%
Non-Residential Self-Haul 0.04% 0.01% 80%
Commercial 0.38% 0.17% 55%
Countywide Average 0.53% 0.25% 53%
Note: Figures shown in the first two columns of data are percent by weight of the entire waste
stream. The first three quarters of fieldwork conducted for this study (October, 2013, and January and May, 2014) were prior to the effective date of the bag ban, and only one quarter of fieldwork (August 2014) was conducted after the ban took effect. Since the fieldwork that was conducted in mid-August was actually testing garbage that had been generated over an indefinite time period prior to mid-August, it was likely that plastic bags distributed prior to July 1 were still “working their way through the system.” In addition, stores were allowed to use up existing supplies of plastic bags, so plastic bags continued to be distributed for an unknown period after July 1. Hence, the results for August are likely not measuring the full impact of the bag ban. As shown in Table 8, there was an overall decrease of 53% in the amount of carryout bags in Thurston County’s waste stream. This amount represents a decrease of 382 tons of plastic bags on an annual basis.

Thurston County Waste Composition Study 24 Characterization of Thurston County’s Waste Stream
Edible Food Mixed organics collected in Thurston County are brought to WARC for transfer to one of several processing facilities. Sampling and analysis of these mixed organics was conducted as part of the waste sorting study, and this part of the project is described in greater detail in the next section of this report and in Appendix C. To supplement the data being collected on mixed organics, the category ”edible food” was added for the waste samples. In other words, the original category of “food waste” was divided into “edible food” (meaning food that had been edible when it was disposed or at some point prior to that) and “inedible food” (scraps resulting from food preparation and other types of food that were never intended for human consumption). These sorting categories were added partway through the waste sorting project, and so this data is available for only two of the four quarters of fieldwork. The results for these categories are shown in Table 9.
Table 9 AMOUNT OF EDIBLE FOOD DISPOSED IN THURSTON COUNTY
Type of Waste Generator
Percent of Food that was Edible
Total Percent
Food
Annual Tons of All
Wastes
Tons of Edible Food
Disposed
Residential Self-Haul 53.7% 11.1% 21,490 1,277
Rural Dropboxes 44.3% 7.7% 3,435 117
Single-Family, County 48.7% 22.5% 40,783 4,462
Single-Family, City 50.6% 25.8% 6,105 798
Multi-Family, County 46.7% 23.8% 5,362 597
Multi-Family, City 47.2% 20.7% 4,324 422
Non-Residential Self-Haul 7.0% 0.60% 18,479 8
Commercial, County 35.8% 19.6% 43,157 3,033
Commercial, City 66.1% 17.2% 15,566 1,774
Averages/Totals 42.8% 16.9% 158,701 12,488

Thurston County Waste Composition Study 25 Mixed Organics Results
S E C T I O N I I I M I X E D O R G A N I C S R E S U L T S
A . I N T R O D U C T I O N This section provides the results for the composition tests of the mixed organics that are collected in Thurston County by the City of Olympia and Waste Connections. This section also discusses the total amount of edible food that is disposed and composted. B . O V E R V I E W O F P R O C E D U R E S Sampling and sorting procedures for the mixed organics were conducted in a similar fashion to the procedures used for waste samples. Incoming vehicles carrying mixed organics were randomly selected, except in the case of the commercial organics. In the case of commercial organics, there were only one or two trucks per day carrying this type of waste and so those trucks were targeted for sampling by necessity. Sampling locations within the load were randomly chosen, and the samples were taken after the load was dropped off in the normal receiving area. Samples of mixed organics were sorted into a different list of categories than the list of categories used for waste samples (see Section C of the Glossary). The categories for the mixed organics were designed so that these could be compared to the results from sorting samples of waste while still providing more detail on a few of the categories (such as a more detailed breakdown for compostable paper and plastic bags). The types of waste generators used for the mixed organics were also different, although this was primarily because some of the types of waste generators were not relevant to the mixed organics tests. Self-haul customers, for instance, are only supposed to bring in clean yard debris (without food scraps or compostable paper), and so Residential Self-Haul and Non-Residential Self-Haul were not included in the mixed organics tests. At the time of this study, only minor amounts of mixed organics were being collected from Multi-Family buildings and so this source also did not warrant separate testing. This left four sources of mixed organics to be tested:
City Residential: organics collected by the City of Olympia from single-family homes in Olympia,
County Residential: organics collected by Waste Connections from single-family homes in the rest of Thurston County,
City Commercial: commercial organics collected by the City of Olympia, and
County Commercial: commercial organics collected by Waste Connections.

Thurston County Waste Composition Study 26 Mixed Organics Results
The target number of samples for the mixed organics was 24 samples each for the residential and commercial sources. This number of samples (24) was chosen based on experience from other studies that has shown that 20 to 30 samples are necessary to characterize a specific source with an acceptable degree of accuracy. The 24 samples were allocated to city and county sources based on the estimated amount of each (about one-third from the City of Olympia and two-thirds from the rest of Thurston County). Samples of the mixed organics were taken over three quarters: January, May and August, 2013. More details about the mixed organics test procedures and results can be found in Appendix C. C . Q U A N T I T Y R E S U L T S F O R M I X E D O R G A N I C S An important step for characterizing the mixed organics stream was to determine the amounts of mixed organics generated by the four sources. This data allows the annual averages for each source to be determined with the use of a weighted average that takes into account seasonal variations in quantity and composition. The quantity figures also allow a weighted average to be determined for the entire stream, by taking into account the relative quantities from each source. Quantities delivered by the City of Olympia (for City Residential and City Commercial) were determined using scalehouse transaction records. This approach did not work as well for deliveries by Waste Connection (for County Residential and County Commercial) and so instead reports from Waste Connections were used for these sources. The results are shown in Table 10.
Table 10 QUARTERLY AND ANNUAL AMOUNTS OF MIXED ORGANICS
Source October,
2013 February,
2014 May, 2014
August, 2014
Annual Totals
City Residential 303.1 111.7 292.3 144.9 5,279
County Residential 513.3 160.5 732.1 583.3 12,853
City Commercial 22.2 16.7 23.0 18.3 563
County Commercial 36.1 21.7 24.5 25.0 694
Totals 874.8 310.7 1,072.0 771.5 19,388
Note: Figures shown for each quarter are for a two-week period. Annual totals are for the
period September 1, 2013 through August 31, 2014.

Thurston County Waste Composition Study 27 Mixed Organics Results
D . C O M P O S I T I O N R E S U L T S F O R M I X E D O R G A N I C S Table 11 shows the results of the tests conducted on the mixed organics. The results shown are the weighted averages for each source and for the annual amount. As can be seen from the results, most of the material from residential sources is yard debris, with only relatively small amounts of food scraps, compostable paper and wood. Both of the commercial sources have much higher amounts of food scraps and compostable paper. E . T O T A L A M O U N T O F E D I B L E F O O D D I S C A R D E D The issue of edible food being discarded rather than being consumed has gained national and international attention in recent years. A considerable amount of food becomes spoiled or otherwise wasted in the process of being harvested, processed and distributed, but a significant amount also goes uneaten locally in households and restaurants. As shown in Table 9, there is an estimated 12,488 tons of edible food that is disposed annually in Thurston County’s waste stream. There is another 351 tons of edible food that was found in the mixed organics stream. This includes food that had either been edible when it was discarded or at some point prior to that, but does not include scraps resulting from food preparation and other pieces of food that were never intended for human consumption (such as bones and fruit rinds). For the 113,283 households in Thurston County (from OFM, for April 2012), the total amount of wasted food (the 12,839 tons of edible food discarded) is the equivalent of 227 pounds per household per year, or 4.4 pounds per household per week.
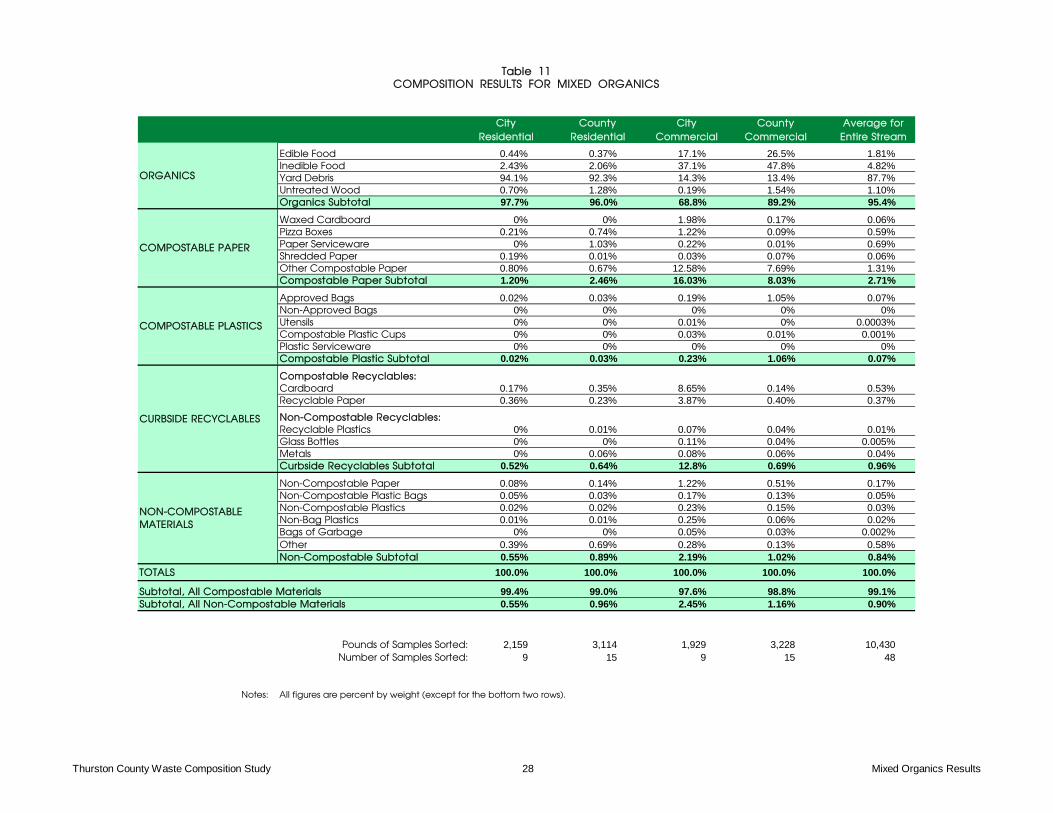
Edible Food 0.44% 0.37% 17.1% 26.5% 1.81%Inedible Food 2.43% 2.06% 37.1% 47.8% 4.82%Yard Debris 94.1% 92.3% 14.3% 13.4% 87.7%Untreated Wood 0.70% 1.28% 0.19% 1.54% 1.10%Organics Subtotal 97.7% 96.0% 68.8% 89.2% 95.4%
Waxed Cardboard 0% 0% 1.98% 0.17% 0.06%Pizza Boxes 0.21% 0.74% 1.22% 0.09% 0.59%Paper Serviceware 0% 1.03% 0.22% 0.01% 0.69%Shredded Paper 0.19% 0.01% 0.03% 0.07% 0.06%Other Compostable Paper 0.80% 0.67% 12.58% 7.69% 1.31%Compostable Paper Subtotal 1.20% 2.46% 16.03% 8.03% 2.71%
Approved Bags 0.02% 0.03% 0.19% 1.05% 0.07%Non-Approved Bags 0% 0% 0% 0% 0%Utensils 0% 0% 0.01% 0% 0.0003%Compostable Plastic Cups 0% 0% 0.03% 0.01% 0.001%Plastic Serviceware 0% 0% 0% 0% 0%Compostable Plastic Subtotal 0.02% 0.03% 0.23% 1.06% 0.07%
Compostable Recyclables:Cardboard 0.17% 0.35% 8.65% 0.14% 0.53%Recyclable Paper 0.36% 0.23% 3.87% 0.40% 0.37%
Non-Compostable Recyclables:Recyclable Plastics 0% 0.01% 0.07% 0.04% 0.01%Glass Bottles 0% 0% 0.11% 0.04% 0.005%Metals 0% 0.06% 0.08% 0.06% 0.04%Curbside Recyclables Subtotal 0.52% 0.64% 12.8% 0.69% 0.96%
Non-Compostable Paper 0.08% 0.14% 1.22% 0.51% 0.17%Non-Compostable Plastic Bags 0.05% 0.03% 0.17% 0.13% 0.05%Non-Compostable Plastics 0.02% 0.02% 0.23% 0.15% 0.03%Non-Bag Plastics 0.01% 0.01% 0.25% 0.06% 0.02%Bags of Garbage 0% 0% 0.05% 0.03% 0.002%Other 0.39% 0.69% 0.28% 0.13% 0.58%Non-Compostable Subtotal 0.55% 0.89% 2.19% 1.02% 0.84%
TOTALS 100.0% 100.0% 100.0% 100.0% 100.0%
Subtotal, All Compostable Materials 99.4% 99.0% 97.6% 98.8% 99.1%Subtotal, All Non-Compostable Materials 0.55% 0.96% 2.45% 1.16% 0.90%
Pounds of Samples Sorted: 2,159 3,114 1,929 3,228 10,430Number of Samples Sorted: 9 15 9 15 48
Notes: All figures are percent by weight (except for the bottom two rows).
CommercialCounty
Entire StreamResidential Residential CommercialCity Average forCountyCity
Table 11COMPOSITION RESULTS FOR MIXED ORGANICS
ORGANICS
COMPOSTABLE PAPER
COMPOSTABLE PLASTICS
NON-COMPOSTABLE MATERIALS
CURBSIDE RECYCLABLES
Thurston County Waste Composition Study 28 Mixed Organics Results

Thurston County Waste Composition Study 29 Conclusions and Recommendations
S E C T I O N I V C O N C L U S I O N S A N D R E C O M M E N D A T I O N S
A . C O N C L U S I O N S Analysis of Waste Composition Trends Table 12 shows the current results for the entire waste stream compared to the results from the three previous studies conducted for Thurston County. Figure 8 provides a graphic illustration of how some types of materials have grown while others have decreased. Figure 9 shows this information by year, while Figure 10 shows this on a per capita basis. A few adjustments had to be made in the data to provide results that could be directly compared:
phone books were added to mixed paper for the 2009 and 2014 studies. office paper and magazines were added to mixed paper for the 1999 and 2004
studies. compostable paper was added to non-recyclable paper for the 2009 and 2014
studies. tubs and plastic film were added to plastic packaging for the 2009 and 2014
studies. carryout bags were combined with other bags and film for the 2014 data. auto parts were combined with mixed metals for the 2009 data. e-waste was added to mixed metals for the 2009 and 2014 studies. light bulbs were added to non-recyclable glass for the 2009 and 2014 studies. pharmaceuticals were added to cosmetics for the 2009 and 2014 studies. carpet padding was added to carpeting for the 2009 and 2014 studies. mattresses were added to furniture for the current study. miscellaneous organics were added to residuals for the 2009 and 2014 studies. residuals and fines for the previous two studies were combined.
When examining this data, it is important to bear in mind that:
The amount of waste disposed in the past year is substantially lower than the 2004 and 2009 levels, despite increases in population in the past five years. This is probably due to a combination of the current economy, which may still be recovering from the recession, and new diversion programs, which have led to increases in the amounts of materials recycled and composted.

Newspaper 1.82% 1.36% 0.89% 0.46% 2,630 2,430 1,570 730 Cardboard 3.68% 3.43% 3.85% 3.31% 5,320 6,130 6,800 5,260 Mixed Waste Paper 5.89% 5.70% 6.26% 5.30% 8,510 10,190 11,050 8,420 Milk Cartons, Other 0.30% 0.23% 0.32% 0.29% 430 400 560 460 Non-Recyclable Paper 8.74% 7.12% 6.80% 6.19% 12,630 12,730 12,010 9,820 Paper Subtotal 20.43% 17.83% 18.11% 15.56% 29,530 31,890 31,980 24,690 PET Bottles 0.52% 0.81% 0.92% 0.84% 760 1,440 1,630 1,330 HDPE Bottles 0.68% 0.55% 0.65% 0.45% 980 990 1,150 720 Bottles 3-7 0.05% 0.08% 0.07% 0.06% 68 140 120 100 Plastic Packaging 7.24% 6.00% 6.97% 6.87% 10,460 10,720 12,310 10,910 Other Plastic Products 3.74% 6.67% 5.36% 2.68% 5,410 11,940 9,470 4,260 Expanded Polystyrene 0.46% 0.47% 0.83% 0.67% 660 850 1,460 1,060 Plastic Subtotal 12.69% 14.58% 14.80% 11.57% 18,340 26,080 26,140 18,360 Aluminum Cans 0.42% 0.39% 0.50% 0.37% 600 690 890 580 Aluminum Foil 0.13% 0.14% 0.18% 0.16% 180 240 310 250 Tin Cans 1.00% 0.67% 0.75% 0.66% 1,450 1,200 1,320 1,040 Mixed Metals 2.58% 2.50% 3.23% 2.29% 3,730 4,470 5,700 3,640 Ferrous Metals 2.69% 2.74% 1.75% 1.01% 3,890 4,890 3,090 1,600 White Goods 0.71% 0.28% 0.07% 0.09% 1,030 500 130 140 Non-Ferrous Metals 0.18% 0.32% 0.19% 0.26% 270 570 340 410 Aerosol Cans 0.20% 0.15% 0.17% 0.18% 290 270 300 280 Metal Subtotal 7.91% 7.18% 6.84% 5.00% 11,430 12,860 12,080 7,930 Food Waste 15.46% 13.63% 16.73% 16.91% 22,330 24,370 29,550 26,830 Yard Debris 3.04% 4.38% 2.38% 3.15% 4,400 7,830 4,210 5,000 Organics Subtotal 18.50% 18.00% 19.12% 20.06% 26,730 32,190 33,750 31,830 Clear Bottles 1.74% 1.28% 1.25% 1.32% 2,510 2,300 2,220 2,100 Brown Bottles 0.73% 0.58% 0.58% 1.13% 1,050 1,040 1,020 1,790 Green Bottles 0.45% 0.27% 0.31% 0.32% 650 490 540 510 Non-Recyclable Glass 1.03% 0.52% 0.87% 1.40% 1,490 930 1,540 2,220 Glass Subtotal 3.94% 2.66% 3.02% 4.17% 5,700 4,750 5,330 6,610 Tires 0.16% 0.04% 0.08% 0.15% 230 70 140 230 Rubber Products 0.35% 0.29% 0.39% 0.57% 500 520 690 910 Cosmetics 0.14% 0.36% 0.27% 0.26% 200 640 470 420 Disposable Diapers 2.11% 1.55% 2.34% 2.84% 3,050 2,780 4,130 4,510 Textiles 2.60% 2.50% 3.60% 3.67% 3,760 4,470 6,360 5,830 Carpeting 2.51% 1.33% 2.97% 4.49% 3,630 2,370 5,240 7,130 Furniture and Mattresses 1.02% 1.43% 3.13% 2.62% 1,470 2,550 5,520 4,160 Ash, Dust 0.26% 0.28% 0.36% 0.42% 370 510 640 670 Miscellaneous Inorganics 0.59% 0.13% 0.83% 0.32% 860 240 1,470 510 Residuals 6.63% 7.03% 6.63% 8.44% 9,580 12,560 11,710 13,400 Other Subtotal 16.36% 14.95% 20.60% 23.80% 23,640 27,640 36,380 37,770 Wood 10.86% 14.15% 9.71% 9.32% 15,690 25,310 17,140 14,800 Construction, Demolition 6.88% 8.88% 5.29% 7.25% 9,940 15,880 9,340 11,500 Wood, C&D Subtotal 17.73% 23.03% 15.00% 16.57% 25,620 41,190 26,480 26,300
SPECIAL WASTES 2.43% 1.77% 2.52% 3.28% 3,510 3,160 4,450 5,200 TOTAL WASTE STREAM 100.0% 100.0% 100.00% 100.00% 144,500 178,820 176,580 158,703
PAPER
PLASTIC
METAL
ORGANICS
GLASS
WOOD and C&D
OTHER WASTES
COMPARISON OF RESULTS TO PREVIOUS STUDIESTable 12
Results as a Percent by Weight2014 2014
Results in Tons per Year2009200419992004 20091999
Thurston County Waste Composition Study 30 Conclusions and Recommendations

Thurston County Waste Composition Study 31 Conclusions and Recommendations
Figure 8 DISPOSAL TRENDS, ANNUAL TONS BY MATERIAL
0
5,000
10,000
15,000
20,000
25,000
30,000
35,000
40,000
To
ns
per
Yea
r
1999
2004
2009
2014

Thurston County Waste Composition Study 32 Conclusions and Recommendations
Figure 9 DISPOSAL TRENDS, ANNUAL TONS DISPOSED
0
20000
40000
60000
80000
100000
120000
140000
160000
180000
200000
1999 2004 2009 2014
To
ns
per
Yea
r
Special
Wood, C&D
Other
Organics
Glass
Metal
Plastic
Paper
Figure 10 DISPOSAL TRENDS, PER CAPITA AMOUNTS
0
200
400
600
800
1000
1200
1400
1600
1800
1999 2004 2009 2014
Po
un
ds
per
Per
son
per
Yea
r
Special
Wood, C&D
Other
Organics
Glass
Metal
Plastic
Paper

Thurston County Waste Composition Study 33 Conclusions and Recommendations
The figures in the first set of columns in Table 12 are percentages, and these figures could change due solely to changes in other materials. For example, the annual tonnage of a material such as clear glass bottles could remain at about the same amount, but the percentage of this material would change due to changes in the total waste stream or due to large increases or decreases in other materials.
The types of materials and definitions are not identical from study to study,
which could mask differences in the data from different studies.
Bearing in mind the difficulty of drawing firm conclusions from this data, some interesting trends can still be observed for each of the major categories:
Paper: the amount of newspaper in Thurston County’s waste stream has shown a steady decline over the years, as can be expected from increased participation in recycling programs and lower subscription rates, but other paper grades first dropped, then increased and then dropped again, both in terms of percentages and total tonnages. The decrease found in the current study appears to be tied to an overall decrease in Thurston County’s waste stream.
Plastic: the overall amount of plastic and most of the plastic categories were
displaying steady increases for the previous ten years but have dropped significantly in the current study. The decrease found in the current study again appears to be tied to an overall decrease in Thurston County’s waste stream, although increased recycling rates for the plastic bottles could also be a contributing factor.
Metal: the amount of metal in the waste stream has generally been in decline
over the past three studies (on a percentage basis), but most of the metal categories show sharp declines in both percentages and tonnages for the current study. The tonnage of ferrous metals in particular has dropped in the current study. This appears to be primarily the result of decreases in ferrous metals for the Non-Residential Self-Haul, Commercial and Rural Dropbox sources, but the other types of waste generators also show decreases in this material.
Food Waste: the amount of food waste in the County’s waste stream has varied
somewhat on a percentage basis over the four studies, but the current tonnage show a decrease compared to the 2009 study. This decrease in tonnage reverses the trend that had been occurring for steadily-increasing tonnages of food waste.
Yard Debris: the percentages and tonnages of yard debris in the County’s waste
stream have been relatively steady over the years, although there was a spike in tonnages that occurred in the 2004 study. About two-thirds (64.8%) of the current tonnage of yard waste (5,000 tons per year) is being disposed by Single-Family generators from outside of Olympia.

Thurston County Waste Composition Study 34 Conclusions and Recommendations
Glass: the amount of glass bottles in the waste stream has varied over the years but has generally declined, probably due to changes in consumer packaging and increased recycling levels. The exception to this observation is brown bottles, which increased significantly in the current study. This increase is due to increases that occurred for all of the residential categories (Residential Self-Haul, Rural Dropbox, Single-Family and Multi-Family), while Commercial tonnages for brown bottles dropped.
Wood and Construction/Demolition (C&D) Wastes: the percentage and
tonnages of wood and C&D wastes in the County’s waste stream showed a sharp decrease in the previous study, and the combined total amount of wood and C&D wastes is still at that lower level despite an increase in construction activities in the past year. The amount of wood waste has dropped even farther since 2009, indicating that a portion of the wood waste is possibly being diverted to other facilities for recycling.
Other Wastes and Special Wastes: these categories include a variety of different
materials, and it’s difficult to draw any conclusions from the historical trends seen for these.
Recycling Potential Assessment One of the key reasons for conducting a study such as this is to determine how much recyclable material remains in the waste stream. In addition to examining “typical” recyclable materials (those materials that are typically collected through residential curbside and commercial recycling programs), other materials can also be examined, such as organics and other materials that can be recycled through special programs. This data provides important information for planning new or expanded recycling and composting programs. Table 13 and Figure 11 show the amounts of recyclable materials remaining in each waste stream. Materials have been grouped into three categories for this analysis:
Typical Recyclables: these are the materials typically collected through curbside and commercial programs. The list of materials for this group is based on Olympia’s curbside program, and it should be kept in mind that the exact mix of materials collected varies from area to area and also varies depending on the type of generator (commercial programs often differ from residential).
Organics: these are the materials typically collected through “expanded
organics” collection programs. Although other materials (such as animal excrement and other types of wood) could potentially be considered “organic”

% TPY % TPY % TPY % TPY % TPY % TPY % TPYTypical Recyclables
Newspaper 0.55% 120 0.13% 5 0.42% 200 1.03% 100 0.03% 5 0.53% 310 0.46% 730Cardboard 4.38% 940 1.74% 60 1.54% 720 2.65% 260 4.73% 870 4.10% 2,410 3.31% 5,260Mixed Waste Paper 4.30% 920 4.35% 150 4.95% 2,320 7.09% 690 0.86% 160 6.94% 4,080 5.24% 8,320Phone Books 0.06% 10 0% 0 0.09% 40 0.17% 20 0% 0 0.04% 20 0.06% 100Milk Cartons, Other 0.10% 20 0.13% 4 0.33% 160 0.35% 30 0.01% 2 0.40% 240 0.29% 460PET Bottles 0.83% 180 0.61% 20 0.87% 410 1.93% 190 0.17% 30 0.86% 500 0.84% 1,330HDPE Bottles 0.28% 60 0.40% 10 0.47% 220 0.91% 90 0.03% 10 0.56% 330 0.45% 720Bottles 3-7 0.10% 20 0.04% 1 0.06% 30 0.11% 10 0.01% 2 0.05% 30 0.06% 100Tubs 0.17% 40 0.16% 10 0.44% 200 0.36% 30 0.07% 10 0.26% 150 0.28% 450Aluminum Cans 0.37% 80 0.35% 10 0.29% 140 1.11% 110 0.05% 10 0.41% 240 0.37% 580Tin Cans 0.64% 140 0.55% 20 1.00% 470 1.20% 120 0.05% 10 0.49% 290 0.66% 1,040Aerosol Cans 0.21% 40 0.21% 10 0.22% 100 0.24% 20 0.05% 10 0.16% 100 0.18% 280Glass Bottles 6.11% 1,320 2.74% 100 3.39% 1,600 5.47% 530 0.36% 70 1.37% 800 2.77% 4,400Subtotal 18.1% 3,890 11.4% 400 14.1% 6,610 22.6% 2,200 6.4% 1,189 16.2% 9,500 15.0% 23,770
OrganicsCompostable Paper 1.47% 320 1.30% 40 3.96% 1,860 3.53% 340 0.49% 90 5.77% 3,390 3.81% 6,040Food Waste 11 1% 2 380 7 71% 260 22 9% 10 750 22 4% 2 170 0 60% 110 19 0% 11 160 16 9% 26 830
Table 13RECYCLING POTENTIAL ASSESSMENT
Non-Res.Self-Haul Commercial Entire CountyDropboxes
Totals forMulti-Self-Haul Family Family
Residential Rural Single-
Thurston County Waste Composition Study 35 Conclusions and Recommendations
Food Waste 11.1% 2,380 7.71% 260 22.9% 10,750 22.4% 2,170 0.60% 110 19.0% 11,160 16.9% 26,830Yard Debris 2.08% 450 3.71% 130 7.27% 3,410 2.17% 210 1.06% 200 1.03% 600 3.15% 5,000Dimension Lumber 10.2% 2,180 9.36% 320 0.44% 210 0.76% 70 9.06% 1,670 0.81% 480 3.11% 4,940Pallets, Crates 0.12% 30 0% 0 0% 0 0% 0 2.60% 480 0.28% 164 0.42% 669Subtotal 24.9% 5,360 22.1% 750 34.6% 16,230 28.9% 2,790 13.8% 2,550 26.9% 15,794 27.4% 43,479
Other RecyclablesPlastic Bags and Film 2.59% 550 2.99% 100 5.84% 2,740 4.95% 480 1.18% 220 6.45% 3,790 4.96% 7,870Plastic Packaging 1.24% 270 1.25% 40 1.67% 780 1.71% 170 0.27% 50 2.17% 1,270 1.63% 2,580Expanded Polystyrene 0.36% 80 0.19% 10 0.58% 270 0.76% 70 2.25% 420 0.36% 210 0.67% 1,060Mixed Metals 4.87% 1,050 7.53% 260 1.35% 630 1.67% 160 0.72% 130 2.05% 1,200 2.17% 3,440Ferrous Metals 1.86% 400 2.62% 90 0.60% 280 0.22% 20 1.11% 200 1.03% 600 1.01% 1,600White Goods 0% 0 0.65% 20 0% 0 0% 0 0.63% 120 0% 0 0.09% 140Non-Ferrous Metals 0.31% 70 0.07% 2 0.16% 80 0.06% 5 0.15% 30 0.39% 230 0.26% 410Light Bulbs 0.16% 30 0.02% 1 0.05% 20 0.02% 2 0.02% 3 0.03% 20 0.05% 80E-Waste 0% 0 0% 0 0% 0 0.07% 6 0% 0 0.01% 10 0.01% 10Other Electronics 0.23% 50 0.21% 10 0.09% 40 0.09% 10 0% 0 0.13% 80 0.12% 190
Thurston County Waste Composition Study 35 Conclusions and Recommendations

Table 13, Recycling Potential Assessment, continued
% TPY % TPY % TPY % TPY % TPY % TPY % TPYOther Recyclables, continued
Tires 0.11% 20 4.88% 170 0.03% 10 0.32% 30 0.00% 0 0.00% 0 0.15% 230Textiles 4.39% 940 3.87% 130 4.76% 2,230 5.79% 560 0.76% 140 3.10% 1,820 3.67% 5,830Carpet 3.82% 820 4.65% 160 0.41% 190 0.53% 50 6.27% 1,160 5.44% 3,190 3.51% 5,580Carpet Padding 2.05% 440 0.03% 1 0.01% 10 1.17% 110 0.69% 130 1.47% 870 0.98% 1,560Stumps, Bulky Wood 0.08% 17 0% 0 0% 0 0% 0 0.07% 13 0.06% 33 0.04% 63Plywood 2.03% 440 0.76% 26 0.45% 212 0.37% 36 2.78% 513 0.35% 207 0.90% 1,432Particleboard 3.43% 740 2.25% 77 1.41% 662 1.81% 176 8.63% 1,595 3.02% 1,773 3.16% 5,019Ceramics, Porcelain 1.54% 330 0.07% 2 0.02% 7 0% 0 3.44% 635 0.69% 402 0.87% 1,379Rocks, Bricks 0.02% 5 0% 0 0.03% 13 0% 0 0.37% 69 0% 0 0.05% 87Concrete 0% 0 0.70% 24 0.18% 84 0.19% 18 1.65% 305 0.06% 37 0.29% 468Soil, Dirt, Fines 0.44% 95 0.94% 32 0.68% 320 0.41% 40 0.76% 140 0.09% 51 0.43% 679Gypsum Board 0.05% 10 2.33% 80 0.15% 69 0.15% 15 10.2% 1,877 2.57% 1,506 2.24% 3,559Roofing (Asphalt) 1.02% 220 2.85% 98 0.04% 18 0.06% 6 12.0% 2,221 0.40% 233 1.76% 2,795Motor Oil, Other Oils 0% 0 0% 0 0.01% 5 0% 0 0% 0 0.03% 16 0.01% 21Oil Filters 0% 0 0.18% 6 0% 0 0% 0 0% 0 0.11% 67 0.05% 73Batteries, Car 0.04% 9 0% 0 0.01% 3 0% 0 0% 0 0% 0 0.01% 12Household Batteries 0.14% 30 0.08% 3 0.17% 81 0.22% 22 0.01% 1 0.04% 25 0.10% 161Subtotal 30.8% 6,616 39.1% 1,344 18.7% 8,754 20.6% 1,988 53.9% 9,973 30.0% 17,640 29.2% 46,327
Non-Res. Totals forSelf-Haul Commercial Entire CountySelf-Haul Dropboxes Family Family
Multi-Residential Rural Single-
Thurston County Waste Composition Study 36 Conclusions and Recommendations
26.2% 5,624 27.4% 946 32.6% 15,296 27.9% 2,712 25.9% 4,769 26.9% 15,786 28.5% 45,124
Total Waste Stream 21,490 3,440 46,890 9,690 18,480 58,720 158,700
Other Materials (Wastes)
Thurston County Waste Composition Study 36 Conclusions and Recommendations
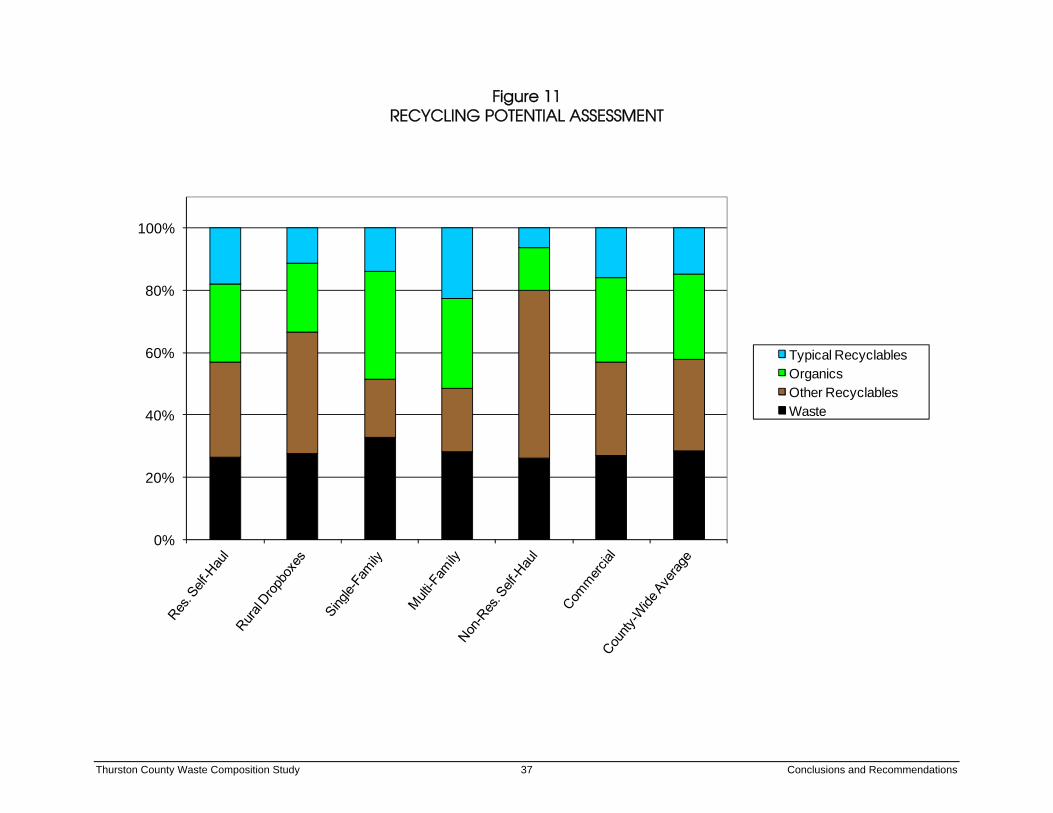
Thurston County Waste Composition Study 37 Conclusions and Recommendations
Figure 11 RECYCLING POTENTIAL ASSESSMENT
0%
20%
40%
60%
80%
100%
Typical RecyclablesOrganicsOther RecyclablesWaste

Thurston County Waste Composition Study 38 Conclusions and Recommendations
(in the sense that these materials could potentially be broken down through composting), these are not included here because current composting systems are generally not equipped to handle these materials.
Other Recyclables: the third group consists of materials that could potentially
be recycled through existing or new recycling programs, including materials that:
- are recycled currently through programs that are conducted separately from municipal and hauler-based programs (such as textiles and plastic bags);
- are being recycled to a limited extent currently through a few specialized programs (such as carpet); and
- are being diverted to applications that do not meet the definition of recycling (such as wood converted to hog fuel).
The data shown in Table 13 does not take into account the marketability of the materials once the materials have been mixed with wastes, although that is not a factor here since this assessment assumes that the additional materials would be primarily diverted through source-separation programs and not through a mixed waste processing system. It should be noted, however, that there is no approach that can recover 100% of a recyclable material (although a combination of mandatory requirements together with financial incentives, such as is used for car batteries, can come close). Waste Composition Conclusions There are distinct differences in the waste streams of the different types of waste generators. For each of the generators, a few noteworthy conclusions can be drawn:
Residential Self-Haul: self-haul loads from residential sources have more wood and construction debris but less food waste than other residential sources, reflecting activities such as remodeling and the other special projects that are often the source of self-haul waste. The largest categories of materials in this waste stream are:
- wood is the material present in the largest quantity, at 18.1%, - followed by food waste, 11.1%, - furniture, 6.0%, - construction/demolition wastes, 5.2%, and - mixed metals, 4.9%. Residential Self-Haul customers deliver only 13.5% of the total waste stream, but because of their small loads this type of customer represents more than half of the transactions at WARC. Residential Self-Haul customers make up 68% of the cash customers (by weight), and cash customers represent 82% of all inbound

Thurston County Waste Composition Study 39 Conclusions and Recommendations
waste transactions, so Residential Self-Haul customers are estimated to bring in about 55% of all waste loads (not including yard waste and other materials), or about 90,660 loads per year of waste. Residential Self-Haul waste contains 18.1% of materials that could be recycled through a typical curbside recycling program (more than Single-Family but less than Multi-Family generators), and another 24.9% consists of organic materials that could be composted. Other types of potentially-recyclable materials contribute 30.8%, leaving only 26.2% of this waste stream that actually needs to be treated as waste.
Rural Dropboxes: the wastes brought to the two rural stations are similar to
Residential Self-Haul wastes (in other words, consisting of a blend of household garbage and waste from special projects). The waste stream for this generator includes the following materials:
- wood is the material present in the largest quantity, at 14.4%, - followed by construction and demolition wastes, 8.6%, - food, 7.7%, - mixed metals, 7.5%, -tires, 4.9%, and - carpet, 4.6%. The waste from the Rural Dropboxes contains only 11.4% of the typical recyclable materials, but another 22.1% is organic materials that could be composted and an additional 39.1% consists of other materials that could potentially be recycled through a variety of different programs. As with Residential Self-Haul waste, only about one-quarter of this waste stream (27.4%) actually needs to be treated as waste.
Single-Family: the largest categories of materials in this waste stream are:
- food waste, 22.9%, - yard debris, 7.3%, - animal excrement, 7.0%, - plastic bags and film, 5.8%, - disposable diapers, 5.0%, - mixed waste paper, 5.0%, and - textiles, 4.8%.
Significant quantities of recyclable materials remain in this waste stream despite the widespread availability of recycling and organics collection programs for single-family homes. If residents recycled all of the materials currently accepted through existing recycling and organics collection programs, an additional 48.7%

Thurston County Waste Composition Study 40 Conclusions and Recommendations
of the Single-Family waste stream could be recycled. This is the equivalent of 22,840 tons per year of additional recyclable and compostable materials. If residents also diverted other potentially-recyclable materials (besides those collected through municipal and hauler-based programs), then less than one-third (32.6%) of the current amount of waste would actually need to be disposed.
Multi-Family (apartments): the largest categories of materials in this waste
stream are:
- food waste, 22.4%, - mixed waste paper, 7.1%, - disposable diapers, 6.0%, - textiles, 5.8%, - plastic bags and film, 5.0%, and - animal excrement, 4.8%. The percentage of recyclable materials in apartment wastes is higher than for single-family homes, although the tonnage of recyclable materials disposed is lower due to the lower total amount of waste from apartments. The Multi-Family waste stream contains 22.6% of the typical curbside recyclables, 28.9% organics, and 20.6% other potentially-recyclable materials, leaving only 27.9% of the current waste that actually needs to be disposed.
Non-Residential Self-Haul: like self-haul waste from residential sources, Non-
Residential Self-Haul loads are often the result of construction activities or other special projects. The primary materials in this waste stream include:
- construction and demolition waste, 34.5%, - wood, 24.2%, - furniture, 8.3%, - carpeting, 6.3%, - cardboard, 4.7%, and - non-recyclable glass, 4.5%. The Non-Residential Self-Haul waste stream only contains 20.2% of the typical recyclable and compostable materials, or about 3,740 tons per year. The wood, construction materials and other potentially-recyclable materials in this waste stream, however, add up to 53.9% or 9,970 tons per year. Diverting all of the recyclable and compostable materials would only leave one-quarter (25.9%) of this waste stream remaining.
Commercial: the differences in the waste streams of the two types of non-
residential customers (Non-Residential Self-Haul and Commercial) highlight the

Thurston County Waste Composition Study 41 Conclusions and Recommendations
different services needed for these business types. The largest categories of materials in the Commercial waste stream are:
- food waste, 19.0%, - wood waste, 7.6%, - mixed waste paper, 6.9%, - plastic bags and film, 6.5%, - compostable paper, 5.8%, and - carpet, 5.4%. The Commercial waste stream contains 16.2% recyclable materials, or about 9,500 tons per year, and even more organics that could be composted, at 26.9% or 15,790 tons per year. Other materials that could potentially be recycled amount to 30.0% or 17,640 tons per year, again leaving only about one-quarter (26.9%) of this waste stream that actually needs to be disposed as waste.
Total Waste Stream: overall, the County’s waste stream contains significant
amounts of:
- food waste, 16.9%, - wood waste, 9.3%, - construction and demolition waste, 7.2%, - mixed waste paper, 5.2%, and - plastic bags and film, 5.0%. The County’s waste stream contains 15.0% or 23,720 tons per year of material that could be handled through typical recycling programs, plus an additional 27.4% or 43,480 tons per year of organic materials that could be diverted to composting programs. Other types of recycling programs could potentially handle another 29.2%, or 46,330 tons per year, leaving only 28.5% of the waste from Thurston County that actually needs to be handled as a waste.
B . R E C O M M E N D A T I O N S The following recommendations are based on the results of this study: There continues to be a significant amount of recyclable materials disposed in
Thurston County’s waste stream, and a few of the materials (brown glass bottles and non-ferrous metals) have actually increased in tonnages since the previous study. Increased education and other steps could help increase the recycling rate for these materials, although these increases would be incremental. If Thurston County desires to increase the recycling rate substantially over current levels, a different approach may be needed. Alternative approaches could include mandatory recycling, increasing the tipping fee at WARC (which provides an incentive to

Thurston County Waste Composition Study 42 Conclusions and Recommendations
recycle), disposal bans, and an increased focus on new materials (carpet, textiles, construction and demolition wastes, etc.).
The County should continue to explore options to divert other recoverable products
from the waste stream such as carpet, carpet padding, mattresses and textiles. Single-family customers in Thurston County are disposing of significant amounts of
yard debris, despite the options for handling this material on-site and the availability of collection programs for it. Additional education and other steps should be considered to encourage the diversion of this material.
There continues to be a significant amount of wood and C&D in the waste stream.
The County should continue to explore options to expand waste reduction options for these materials and to promote the availability of recycling services in the region.
Recent steps have been taken in Thurston County to increase food waste diversion,
but for now large amounts of this material remain in the waste stream. More publicity about the programs for food waste should be considered.
The ban on plastic bags appears to have had a significant impact on the number of
plastic bags disposed. Additional steps should be taken to monitor the impact of the bag ban, including monitoring the number of littered bags and the amount found in recyclables.

Thurston County Waste Composition Study G-1 Glossary
G L O S S A R Y I N T R O D U C T I O N This glossary includes three sets of definitions: a) Definitions for waste generator types, and b) Definitions for waste sorting categories, which are shown below in the same order as they
appear on the waste sorting form. c) Definitions specific to the mixed organics tests. A . W A S T E G E N E R A T O R S For the purposes of this study, all waste disposed in Thurston County was categorized into one of six sources, including four types of residential waste generators (single-family, multi-family, self-haul and satellite stations) and two types of non-residential (self-haul and commercial). In addition, samples were taken from four county buildings and this data was kept separate from the other results. Residential Self-Haul: residential waste delivered to WARC by a homeowner, renter or landlord, typically using cars, vans, jeeps, pick-up trucks, rented trucks and trailers. Non-Residential Self-Haul: non-residential waste delivered to WARC by the same company that created the waste, including construction and demolition waste brought in by contractors. Rural Dropboxes: wastes collected at the Rainier and Rochester satellite facilities. Single-Family Homes: waste originating from single-family homes and mobile home parks. To be counted in this category, the waste must have been delivered to WARC by a municipal collection crew, private garbage hauler, or manager/owner of a mobile home park. Multi-Family: wastes collected from apartment buildings. To be counted in this category, the waste must have been delivered by a municipal collection crew or private garbage hauler (Waste Connections). Commercial: waste from businesses, industries and institutions, delivered by a municipal collection crew or private garbage hauler. Olympia Single-Family, Multi-Family and Commercial: additional samples of waste (in addition to samples randomly chosen as part of the base project) taken from single-family homes, multi-family apartments, and from businesses, industries and institutions. County Offices: additional samples of waste taken from one of three Thurston County facilities: the County Courthouse, the Public Health office and the Family Justice Center.

Thurston County Waste Composition Study G-2 Glossary
B . W A S T E S O R T I N G C A T E G O R I E S Paper
Newspaper: printed groundwood newsprint, including glossy ads and Sunday edition magazines that are delivered with the newspaper (unless these are found separately during sorting).
Cardboard: unwaxed kraft paper corrugated containers and boxes, unless poly- or foil-laminated. Note that this category did not include brown kraft paper bags.
Mixed Waste Paper: high- and low-grade potentially recyclable papers, including colored papers, office paper, notebook or other lined paper, envelopes with plastic windows, non-corrugated paperboard, frozen food packaging, carbonless copy paper, egg cartons, magazines, and junk mail.
Phone Books: printed and bound phone books made primarily of groundwood paper.
Milk Cartons and Other Aseptic Containers: milk cartons and similar gable-top containers (such as orange juice cartons), and juice drink boxes.
Compostable Paper: non-recyclable papers that could be composted, such as towels, plates, cups, pizza boxes, waxed paper, and waxed cardboard. This category included paper that was contaminated or soiled with food or liquid in its normal use.
Non-Recyclable Paper: contaminated papers and non-recyclable types of papers such as carbon paper, tissues, laminated paper, paper packaging with metal or plastic parts, and hardcover books. Plastic
PET Bottles: polyethylene terephthalate (PET) bottles, including soda, oil, liquor and other types of bottles. No attempt was made to remove base cups, caps, or wrappers. The SPI code for PET is 1.
HDPE Bottles: high density polyethylene (HDPE) milk, juice, detergent, and other bottles. This category did not include motor oil bottles. The SPI code for HDPE is 2.
Bottles Types 3 - 7: all other bottles that were not PET or HDPE, where the neck of the container is narrower than the body. Included SPI codes 3 - 7.
Tubs: plastic containers of all resin types that were as wide or wider at the top than at the bottom.
Carryout Bags: thin plastic bags provided by retail establishments at the point of sale or departure. Did not include newspaper bags, dry cleaning bags, bags used by customers for bulk foods, bags used for prescription drugs or deli carryout, or film used to wrap meats and other damp products.
Other Film and Bags: all other plastic packaging films and bags. To be counted in this category, the material must have been flexible (i.e., can be bent without making a noise).
Plastic Packaging: all other plastic packaging (besides tubs, bottles, film and bags), and shipping materials and other plastic items which were not themselves finished consumer products, including thermoplastics and thermosetting plastics used for packaging. Also included HDPE motor oil bottles.

Thurston County Waste Composition Study G-3 Glossary
Plastic Products: finished plastic products such as toys, toothbrushes, vinyl hose and shower curtains, including non-C&D fiberglass resin products and materials (see “fiberglass insulation” and “other fiberglass” under C&D Wastes, below).
Expanded Polystyrene: packaging and finished products made of expanded polystyrene. The SPI code for polystyrene (PS) is 6. Metal
Aluminum Cans: aluminum beverage cans.
Aluminum Foil: aluminum foil and food trays.
Tin Cans: tin-coated steel food containers. This category included bi-metal beverage cans, but not paint cans or other types of cans.
Mixed Metals: small appliances, motors, insulated wire and finished products containing a mixture of metals and/or other materials, but which were greater than 50% metal.
Ferrous Metals: products and pieces made from metal to which a magnet adhered (but including stainless steel), and which were not significantly contaminated with other metals or materials (in the latter case, the item was instead included under “mixed metals/materials”). This category included paint cans and other non-food cans.
White Goods: large household appliances or parts thereof. Special note was taken if any of these were found still containing refrigerant.
Non-Ferrous Metals: metallic products and pieces not derived from iron (i.e., to which a magnet did not adhere) and which were not significantly contaminated with other metals or materials (in the last case, the item was instead included under “mixed metals/materials”).
Aerosol Cans: metal cans used for containing and applying products under pressure. If the can was full or partially full, with the contents making up more than 25% of the total weight, it was included under the category appropriate for the contents. Special Wastes
Latex Paint: water-based paints.
Oil-Based Paint: solvent-based paints.
Solvents: included chlorinated or flammable solvents, paint strippers, solvents contaminated with other products such as paints, degreasers, other cleaners if the primary ingredient was a solvent, and alcohols such as methanol and isopropanol. Alcoholic beverages intended for human consumption were included in food waste or categorized based on the type of container if empty.
Adhesives and Glues: glues and adhesives of various sorts, including rubber cement, wood putty, glazing and spackling compounds, caulking compounds, grout, and joint fillers.
Cleaners and Corrosives: included various acids and bases whose primary purpose is to clean surfaces, unclog drains, and perform other functions.
Medical Waste: wastes related to medical activities, including syringes, tubing, bandages, medicine, and other wastes, and not restricted to just those wastes regulated as pathogenic or infectious.

Thurston County Waste Composition Study G-4 Glossary
Motor Oil, Other: used or new lubricating oils, primarily those used in cars but possibly also including other materials with similar characteristics.
Oil Filters: used filters such as those used in cars but including similar filters from other applications.
Gasoline and Fuel Oil: gasoline, diesel fuel and light fuel oils, such as those used for home heating.
Antifreeze: automobile and other antifreeze mixtures based on ethylene or propylene glycol, also brake and other fluids if glycol-based.
Other Automotive Maintenance: other products used for automobile maintenance, generally of a non-hazardous nature, such as car wax, polishes, autobody fillers, etc.
Car Batteries: car, motorcycle, and other lead-acid batteries used for motorized vehicles.
Household Batteries: batteries of various sizes and types, as commonly used in households.
Animal Excrement: feces and associated wastes from animals, such as bags of used kitty litter.
Animal Carcasses: carcasses of small animals and pieces of larger animals unless the item is the result of food preparation.
Gas Cylinders: pressurized gas cylinders with the contents making up more than 25% of the total weight (if less than 25% or empty, the gas cylinders were counted as metal).
Pesticides and Herbicides: included poisons whose purpose is to discourage or kill pests, weeds or microorganisms. Fungicides and wood preservatives, such as pentachlorophenol, were also included in this category.
Fertilizers with Pesticides/Herbicides: fertilizers that contain weed killer or other ingredients designed to eliminate weeds and/or pests.
Fertilizers without Pesticides/Herbicides: fertilizers without herbicide or pesticide additives.
Other Hazardous and Special Waste: problem wastes that did not fall into one of the above categories, such as asbestos-containing wastes (if this was the primary hazard associated with the waste), gunpowder, other unspent ammunition, and radioactive materials. Organics
Edible Food: All food, such as vegetables, fruits, breads, meats, pastas, that appeared to be edible or that appeared to have been edible when discarded. For this category, foods with small blemishes were still considered as edible, but scraps of food already removed from the edible portion (such as apple peels and the ends of romaine lettuce) were not be counted here. A reasonable attempt was made to separate the food from any packaging, but if that was not possible then the item was placed in whichever category appeared to represent greater than 50% of the weight.
Inedible Food: All other food not included in the previous category, including coffee filters and tea bags. A reasonable attempt was made to separate the food from any packaging, but if that was not possible then the item was placed in whichever category appeared to represent greater than 50% of the weight.
Yard and Garden: grass clippings, leaves and weeds, and prunings four inches or less in diameter.
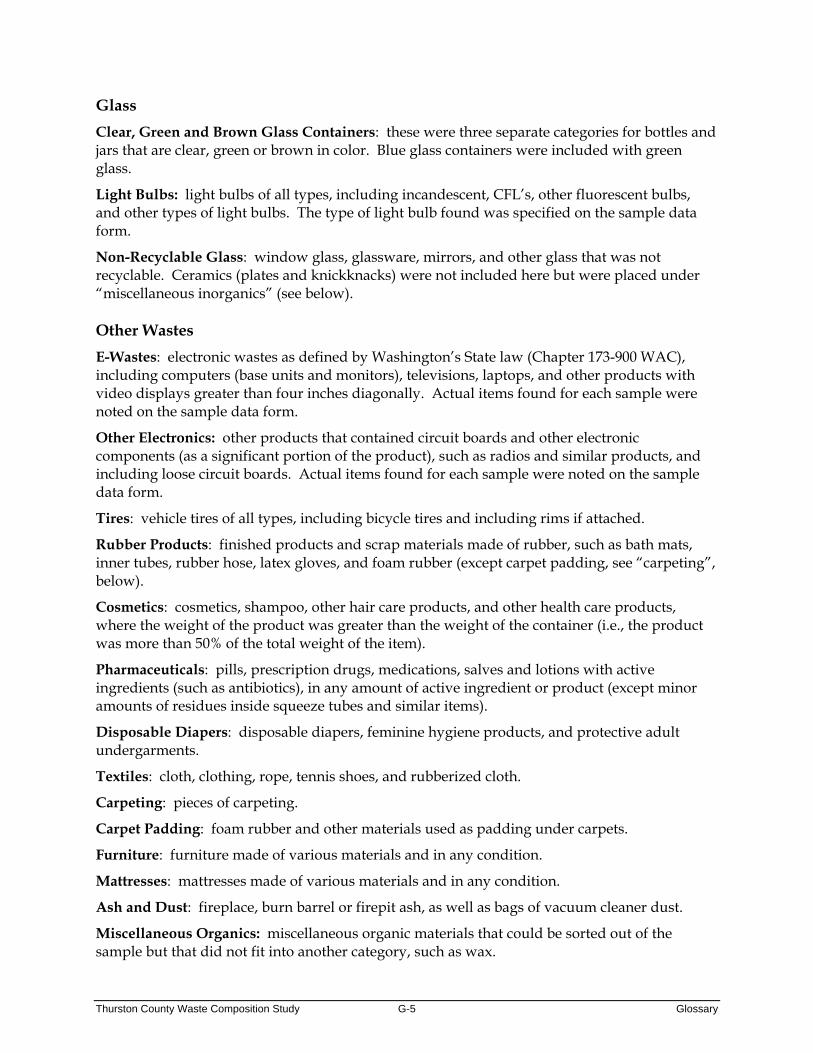
Thurston County Waste Composition Study G-5 Glossary
Glass
Clear, Green and Brown Glass Containers: these were three separate categories for bottles and jars that are clear, green or brown in color. Blue glass containers were included with green glass.
Light Bulbs: light bulbs of all types, including incandescent, CFL’s, other fluorescent bulbs, and other types of light bulbs. The type of light bulb found was specified on the sample data form.
Non-Recyclable Glass: window glass, glassware, mirrors, and other glass that was not recyclable. Ceramics (plates and knickknacks) were not included here but were placed under “miscellaneous inorganics” (see below). Other Wastes
E-Wastes: electronic wastes as defined by Washington’s State law (Chapter 173-900 WAC), including computers (base units and monitors), televisions, laptops, and other products with video displays greater than four inches diagonally. Actual items found for each sample were noted on the sample data form.
Other Electronics: other products that contained circuit boards and other electronic components (as a significant portion of the product), such as radios and similar products, and including loose circuit boards. Actual items found for each sample were noted on the sample data form.
Tires: vehicle tires of all types, including bicycle tires and including rims if attached.
Rubber Products: finished products and scrap materials made of rubber, such as bath mats, inner tubes, rubber hose, latex gloves, and foam rubber (except carpet padding, see “carpeting”, below).
Cosmetics: cosmetics, shampoo, other hair care products, and other health care products, where the weight of the product was greater than the weight of the container (i.e., the product was more than 50% of the total weight of the item).
Pharmaceuticals: pills, prescription drugs, medications, salves and lotions with active ingredients (such as antibiotics), in any amount of active ingredient or product (except minor amounts of residues inside squeeze tubes and similar items).
Disposable Diapers: disposable diapers, feminine hygiene products, and protective adult undergarments.
Textiles: cloth, clothing, rope, tennis shoes, and rubberized cloth.
Carpeting: pieces of carpeting.
Carpet Padding: foam rubber and other materials used as padding under carpets.
Furniture: furniture made of various materials and in any condition.
Mattresses: mattresses made of various materials and in any condition.
Ash and Dust: fireplace, burn barrel or firepit ash, as well as bags of vacuum cleaner dust.
Miscellaneous Organics: miscellaneous organic materials that could be sorted out of the sample but that did not fit into another category, such as wax.

Thurston County Waste Composition Study G-6 Glossary
Miscellaneous Inorganics: miscellaneous inorganic materials that could be sorted out of the sample but that did not fit into another category, such as ceramic products.
Residuals: mixed waste that remained on the sorting table after all the materials that could practicably be removed had been sorted out. This material consisted primarily of small pieces of various types of paper and plastic, but also contained small pieces of broken glass and other materials. Wood Wastes
Dimension Lumber: wood commonly used in construction for framing, such as 2x4's and 2x6's.
Pallets: partial or whole pallets and similar shipping containers.
Treated Wood: wood treated with preservatives such as creosote, including dimension lumber if treated, but not including painted or varnished wood. This category also included some plywood (especially “marine plywood”), and other treated wood.
Roofing: wood that is commonly used for roofing of buildings, such as cedar shingles or shakes. Roofing made from non-wood materials was classified under other categories (see “roofing wastes” under C&D, below).
Contaminated Wood: wood that was contaminated with other wastes in such a way that it could not easily be separated, but consisting primarily (over 50%) of wood.
Stumps and Other Bulky Wood: stumps of trees and shrubs, with the adhering soil (if any), and other natural woods in excess of four inches in diameter (such as logs and branches).
Plywood: a wood product built up of two or more veneer sheets glued or cemented together under pressure.
Particle Board / Fiberboard: building material made up of fibers of various substances (but typically made from wood chips) pressed together to form large sheets or boards.
Wood Products: goods and products fabricated primarily (over 50% by weight) from wood, including toys, household items, and similar goods. Did not include building materials or furniture.
Other Wood Waste: other types of wood that did not fit into the above categories. Construction and Demolition (C&D) Wastes
Ceramics, Porcelain, and China: used toilets and sinks. Non-C&D ceramics, such as plates and other dishes, were included under “miscellaneous inorganics.”
Rocks and Brick: rock, gravel, and bricks of various types and sizes.
Concrete: cement (mixed or unmixed), concrete blocks, and similar wastes.
Soil, Dirt, and Non-Distinct Fines: soil, sand, dirt and similar materials, where these could be recovered separately from the residuals measured as part of the normal sorting procedure.
Gypsum Board: used or new gypsum wallboard, sheetrock or drywall present in recoverable amounts or pieces (generally any piece larger than two inches square was recovered from the sample).
Fiberglass Insulation: did not include other types of insulation or other fiberglass products.

Thurston County Waste Composition Study G-7 Glossary
Other Fiberglass: durable, large products such as shower stalls and bathtubs. Small, non-C&D objects were categorized with “other plastic products”.
Roofing Waste: asphalt and fiberglass shingles, tar paper, and similar wastes from demolition or installation of roofs. Did not include cedar shingle or shakes (see wood subcategory, “roofing wood”).
Asphalt: restricted to asphalt paving material.
Other C&D: C&D materials that were not included in the above categories. C . M I X E D O R G A N I C S D E F I N I T I O N S Organics samples were sorted into the categories defined below. If there was any doubt about the identity of an item, plastic and paper materials were placed into the corresponding non-compostable category. To the extent possible, Cedar Grove guidelines were used for the compostable paper and plastic categories. Organics
Edible food: All food (such as vegetables, fruits, breads, meats, and pastas), that was edible or that appeared to have been edible when discarded. Foods with small blemishes were still considered edible, but scraps of food already removed from the edible portion (such as apple peels and the ends of romaine lettuce) were not counted here. A reasonable attempt was made to separate the food from any packaging, but if that was not possible then the item was placed in whichever category appeared to represent greater than 50% of the weight.
Inedible food: All other food scraps not included in the previous category, and including coffee filters and tea bags.
Yard debris: Leaves, grass clippings, sod, garden debris, brush, prunings, branches and logs less than 8” in diameter, soil, and small stones. Homegrown fruit along with the leaves and prunings from fruit trees were included in this category, as well as bouquets and houseplants.
Untreated wood: Dimensional lumber, pallets, crates, and natural wood over 8” in diameter. Compostable Paper
Waxed OCC: Waxed corrugated cardboard boxes.
Pizza boxes: Cardboard boxes without a plastic or foil liner that were used for delivering pizza. This included similar packaging for other products (such as breadsticks and chicken wings) from pizza shops.
Paper, wood, or fiber-based serviceware items: Bowls, plates, serving boats, wood corks and wooden utensils including chop sticks, coffee stirrers, and toothpicks that were either clearly labeled “compostable” or unlabeled but without a plastic lining or coating. Paper cups that were clearly labeled as compostable and waxed food serviceware items like parchment paper were included here.
Shredded paper: Bags of shredded paper, and loose amounts of shredded paper if recoverable.
Other compostable paper: Paper packaging and products not included above, and that did not contain a plastic coating. Examples included paper towels and napkins. Also included soiled

Thurston County Waste Composition Study G-8 Glossary
newspapers and kraft bags that had been used to hold food scraps. Compostable Plastics
Compostable plastic bags, approved: Plastic bags that were made of materials such as corn starch or soy and that were designed to compostable at commercial composting facilities. Approved bags were BPI-labeled and were typically semi-translucent.
Compostable plastic bags, non-approved: Brown or green, compostable-looking bags. May have been unmarked or labeled “degradable.” These bags did not have the BPI label.
Compostable plastic utensils: Plastic utensils clearly labeled “compostable.”
Compostable plastic beverage cups: Plastic cups designed to be used for beverages or food and clearly labeled “compostable.”
Other compostable plastic food serviceware: Clamshells, meat trays, and salad trays clearly labeled “compostable.” Curbside Recyclables
Uncoated OCC: Corrugated cardboard boxes without a wax coating.
Recyclable paper: Other types of recyclable paper, including clean newspaper, mixed waste paper, office paper, magazines, catalogs, phone books, glossy junk mail, polycoated cartons (e.g., milk, juice), boxboard (e.g., cereal boxes), egg cartons, and aseptic containers.
Recyclable plastic: Plastic bottles, tubs, and buckets (5 gallons or smaller).
Recyclable glass: Glass bottles and jars.
Recyclable metal: Aluminum cans and foil, tin and steel food cans, empty dry metal paint cans and empty aerosol cans, and scrap metal. Non-Compostable Materials
Non-compostable paper: Non-recyclable, non-compostable paper, including papers coated with plastic. Examples include some types of fast food wrapping, foil-lined paper products, plastic-coated take-out containers, and plastic-coated plates and bowls. Most paper cups, plates and serving “boats” went in this category, unless marked as compostable or clearly not coated.
Non-compostable plastic bags: Plastic bags not made of materials that would compost or biodegrade, including trash bags, produce bags, and shopping bags.
Non-compostable plastic packaging and products: Plastic packaging and products that were not labeled as “compostable,” including utensils, clamshells, straws, salad trays, corks, food service items made of Styrofoam, cup lids and other plastic containers and products that did not fit into the recyclable plastic definition and were not clearly labeled “compostable.”
Non-bag plastic film: Plastic sheeting, food handling gloves, and other non-bag plastic film.
Bags of Garbage: Intact bags of garbage. Contents were confirmed as garbage, but not sorted.
Other materials: Any material that did not fit into the above categories, including textiles, grease, non-food service Styrofoam, pet waste (including kitty litter and animal bedding), stumps, large rocks, concrete, demolition debris, hazardous wastes (e.g., fluorescent light bulbs, paint, motor oil), and non-recyclable materials.
A P P E N D I X A WASTE COMPOSIT ION DATA FOR THE CITY OF OLYMPIA


CITY OF OLYMPIA WASTE COMPOSITION STUDY
DECEMBER 2014
GREEN SOLUTIONS


CITY OF OLYMPIA WASTE COMPOSIT ION STUDY
2013 - 2014
prepared for
Public Works Waste ReSources Olympia, Washington
prepared by
Green Solutions, LLC South Prairie, Washington 98385
360-897-9533 [email protected]
D e c e m b e r 2 0 1 4

City of Olympia Waste Composition Study ii Table of Contents
T A B L E O F C O N T E N T S I. Introduction A. Scope and Objectives ........................................................... 1 B. Background ............................................................................. 1
II. Characterization of Olympia’s Waste Stream A. Introduction ............................................................................. 3 B. Overview of Procedures ........................................................ 3 C. Results, Waste Quantities ....................................................... 4 D. Results, Waste Composition ................................................... 5 E. Wood, C&D and Special Wastes .......................................... 6
III. Conclusions and Recommendations A. Conclusions ............................................................................ 13 B. Recommendations ............................................................... 23
Glossary LIST OF TABLES: 1. Annual Quantities of Disposed Wastes by Type of Generator ........................................................................ 5 2. Allocation of Samples by Type of Generator ..................... 5 3. Waste Composition Results for the City of Olympia’s Waste Collection System ................................................... 7 4. Breakdown of Wood, C&D and Special Wastes .............. 12 5. Weight of Disposed Materials ............................................. 14 6. Disposal Rates per Capita and per Employee ................. 15 7. Comparison of Results to Previous Study ........................... 16 8. Recycling Potential Assessment ......................................... 19 LIST OF FIGURES: 1. City-Wide Results for Olympia .................................................. 8 2. Olympia Single-Family Waste ................................................... 9 3. Olympia Multi-Family Waste ................................................... 10 4. Olympia Commercial Waste ................................................. 11 5. Recycling Potential Assessment ............................................. 20

City of Olympia Waste Composition Study 1 Introduction
S E C T I O N I I N T R O D U C T I O N
A . S C O P E A N D O B J E C T I V E S This report provides the results of a study of the quantity and composition of solid waste (garbage) disposed by the City of Olympia, Washington during 2013 - 2014. The primary objectives of this study were to provide:
Data specific to the City of Olympia.
Accurate data on the composition and quantity of disposed materials for evaluating current waste diversion programs.
Data that can be used for planning future programs.
This waste composition study was conducted by the environmental consulting firm of Green Solutions, with assistance from Environmental Practices and DGB Consulting. Additional assistance was provided by Waste Connections, Thurston County, and the City of Olympia. This study was conducted as part of a larger study conducted for Thurston County. The main study was primarily organized by Thurston County, but the City of Olympia provided funds for additional data collection to allow better data to be gathered about the City’s residential and commercial waste streams. B . B A C K G R O U N D City of Olympia employees and trucks collect garbage, recyclables and organics from residential and commercial waste generators in the city. There are three basic types of waste generators collected by the City: single-family, multi-family and commercial. Residential and commercial waste generators may also “self-haul” their wastes and recyclables to various facilities. For garbage, the primary facility used by self-haulers from Olympia is the Thurston County Waste and Recovery Center (WARC) in Lacey, Washington. Self-hauled wastes are not addressed in this report, but are included in the report prepared for Thurston County. Information on the composition and quantities of the mixed organics (food scraps and yard debris) collected by the City is also provided in a separate report. The wastes generated by commercial establishments and multi-family buildings are collected either in dumpsters and carts (which are emptied by City crews once per week or more often if necessary) or in roll-offs and compactors (which may be emptied less than weekly, depending on the size of the container and the amount of waste).

City of Olympia Waste Composition Study 2 Introduction
Single-family homes in Olympia are served by a variety of waste and recycling collection programs. There are about 13,600 residential garbage customers in Olympia. The garbage from these residential customers is collected Tuesday through Friday of one week, and recyclables are collected Tuesday through Friday of alternating weeks. Organics are collected on alternating Mondays (half of the city is collected on one Monday, and the other half on the next Monday). The monthly fee paid by single-family customers is based on the size of the garbage container they choose, and four sizes are offered (20, 35, 65 and 95-gallon carts). This volume-based approach, coupled with the alternating weekly schedule, helps to encourage participation in waste reduction and recycling programs. For the curbside recycling program, Olympia offers three sizes of recycling carts for single-family residential customers. The three sizes of carts are 35-, 65- and 95-gallon. The recycling program uses a single-stream approach (all recyclables can be placed in one cart, including glass and cardboard). The organics collection program is voluntary, with the choice of either a 35-gallon or 95-gallon green cart (at the same cost for either size, currently at $8.18 per month per cart) for the organics collection program. Currently, about 56% of the residential garbage customers have signed up for the organics collection program.
City of Olympia Waste Composition Study 3 Characterization of Olympia’s Waste Stream
S E C T I O N I I C H A R A C T E R I Z A T I O N O F O L Y M P I A ’ S W A S T E S T R E A M
A . I N T R O D U C T I O N This section provides waste quantity and composition results for the three types of waste generators served by the City of Olympia’s collection system. B . O V E R V I E W O F P R O C E D U R E S This study examined the solid waste brought for disposal to the Thurston County Waste and Recovery Center (WARC). This report addresses only the solid wastes brought to WARC by the City of Olympia, and does not include the waste brought there by self-haul customers from the City or the mixed organics brought there by City crews. Types of Waste Generators The intent of this study was to provide data for the waste collected by the City of Olympia’s system, both in aggregate and for specific sources. The three sources, or waste generators, from Olympia include:
Single-Family: waste that is collected from single-family homes. This waste is typically bagged before collection and consists of many different types of materials. This waste is collected Tuesday through Friday on alternating weeks.
Multi-Family: waste that is collected from apartment buildings. This waste
consists of small pieces of many different types of materials, plus some bulky items, and is collected Monday through Friday. Multi-Family waste is collected using dumpsters as well as roll-offs and compactors, and is mixed with Commercial waste when collected by the trucks that empty dumpsters.
Commercial: waste that is collected from businesses (commercial and industrial)
and institutions (schools, hospitals, government offices, etc.). These wastes are collected Monday through Friday using front- and rear-loading garbage trucks (for emptying dumpsters and carts) and by trucks carrying roll-off containers and compactors.
For this study, construction and demolition (C&D) wastes and other special wastes were included in the above categories based on the source and delivery method. C&D

City of Olympia Waste Composition Study 4 Characterization of Olympia’s Waste Stream
wastes may have been collected using roll-off containers from construction sites (which was defined as Commercial waste), or smaller amounts of C&D wastes may have been in the waste from any one of the three types of waste generators. Waste Quantity Procedures The quantity (tonnage) of solid waste disposed by each type of generator was determined by applying the results of a survey of incoming trucks to transaction data from scalehouse records. The survey data was used to allocate the collection tonnages from the City into the three categories of waste generators: Single-Family, Multi-Family and Commercial wastes. Collection tonnages for each type of generator for a two-week period each season were determined in this way (a two-week period was necessary due to the alternating collection schedule for the Single-Family waste). These figures were used to calculate weighted averages for the annual composition figures for each type of waste generator, so that seasonal fluctuations in waste quantities are taken into account when calculating the annual composition of each generator’s waste stream. The annual tonnages for the three types of waste generators were determined by analyzing a year’s worth of transaction data from the scalehouse records, and applying the survey results to that data. The results of this analysis were adjusted based on data from City staff on the amount of Multi-Family waste. The resulting figures were used to combine the composition data from each of the three types of generators to determine the annual average for the City’s entire waste stream. Waste Composition Procedures The composition of the City's solid waste stream was determined by randomly selecting and sorting samples of waste at WARC. Sampling was conducted for six days each quarter. Each sample was sorted into 88 categories of materials. The Glossary provides additional detail on the definitions used for the categories of materials. C . R E S U L T S , W A S T E Q U A N T I T I E S Total Waste Quantities Table 1 shows the results of the waste quantity analysis. As can be seen in Table 1, the annual amounts of both residential streams together amount to 40% of the City-collected wastes, and Commercial waste contributes the remaining 60%.

City of Olympia Waste Composition Study 5 Characterization of Olympia’s Waste Stream
Table 1 ANNUAL QUANTITIES OF DISPOSED WASTES BY TYPE OF GENERATOR
Type of Generator Annual Amount, Tons
Percentage of Total
Single-Family 6,105 23.5% Multi-Family 4,324 16.6% Residential Subtotal 10,429 40.1%
Commercial 15,566 59.9%
Totals 25,996 100.0%
Note: The annual amounts correspond to a period from September 1, 2013 through
August 31, 2014, as this period most closely corresponds to the timing of the study.
D . R E S U L T S , W A S T E C O M P O S I T I O N Number of Samples The composition of the City’s waste stream was determined by randomly selecting and sorting a total of 75 samples of waste. The number of samples taken each season is shown in Table 2.
Table 2 ALLOCATION OF SAMPLES BY TYPE OF GENERATOR
Type of Generator October
2014 January
2014 May 2014
August 2014
Total Samples
Number Percent
Single-Family 6 6 6 6 24 32% Multi-Family 6 6 6 6 24 32% Residential Subtotal 12 12 12 12 48 64%
Commercial 7 7 7 6 27 36%
Totals 19 19 19 18 75 100%

City of Olympia Waste Composition Study 6 Characterization of Olympia’s Waste Stream
Waste Composition Results Table 3 shows the composition data (annual averages) for each generator and for the City’s collection system altogether. The results for the entire City collection system are also illustrated in Figure 1. The figures shown in Table 3 have a specific degree of error associated with them. As with all sampling and survey procedures, a certain degree of error is unavoidable but quantifiable (see Appendix D of the Thurston County report for more details on the statistical certainty of the results). As can be seen in Table 3, there are substantial differences in the composition of wastes from the different sources. These differences can be explained by the different activities that created the wastes. Waste from Single-Family Homes is influenced by the activities associated with owning and maintaining a home. The waste from apartments (Multi-Family) reflects a more mobile lifestyle and lower recycling participation (as indicated by the larger amounts of recyclable paper, plastic bottles, aluminum and tin cans, and glass bottles). Commercial waste is closely related to the type of business activities that produced the wastes. The results for each generator are illustrated in Figures 2 through 4. E . W O O D , C & D A N D S P E C I A L W A S T E S Additional data on the breakdown of wood, construction and demolition (C&D) wastes, and special wastes is shown in Table 4. Most of this data does not have the same level of statistical certainty as the primary categories due to the lower quantities and greater variability of these materials in the waste stream, but may still be useful for future planning activities focused on these types of wastes. Included in the breakdown for special wastes is an assessment of the amount of materials that could be classified as hazardous waste. These materials are shown as a separate figure near the bottom of both Tables 3 and 4 (see “Actual Hazardous Wastes”). The materials included in this figure are also included in other special waste categories (such as motor oil or oil paint). In other words, the figure for “Actual Hazardous Wastes” is a separate subtotal that only includes the items in the other categories that met the criteria for hazardous wastes.

PAPER Newspaper 0.58% 0.72% 0.92% 0.81%Cardboard 0.99% 2.99% 4.73% 3.56%Mixed Waste Paper 4.25% 7.33% 6.16% 5.91%Phone Books 0.10% 0.03% 0% 0.03%Milk Cartons, Other 0.33% 0.27% 0.22% 0.25%Compostable 4.36% 3.29% 6.45% 5.43%Non-Recyclable Paper 2.20% 1.88% 3.05% 2.66%Paper Subtotal 12.81% 16.51% 21.53% 18.65%
PLASTIC PET Bottles 0.72% 1.79% 0.76% 0.92%HDPE Bottles 0.36% 0.89% 0.71% 0.65%Bottles 3-7 0.06% 0.10% 0.04% 0.05%
Tubs 0.57% 0.37% 0.25% 0.34%Carryout Bags 0.86% 0.94% 0.30% 0.54%Bags and Film 6.11% 3.93% 6.33% 5.88%Plastic Packaging 2.00% 1.65% 2.66% 2.34%Other Plastic Products 2.49% 2.44% 4.20% 3.51%Expanded Polystyrene 0.47% 0.48% 0.48% 0.48%Plastic Subtotal 13.63% 12.58% 15.74% 14.72%
METAL Aluminum Cans 0.26% 0.98% 0.42% 0.48%Aluminum Foil 0.28% 0.19% 0.12% 0.17%Tin Cans 0.86% 1.17% 0.43% 0.65%
Mixed Metals 2.26% 2.33% 3.59% 3.07%Ferrous Metals 0.81% 0.30% 0.80% 0.72%White Goods 0% 0% 0% 0%Non-Ferrous Metals 0.10% 0.03% 0.26% 0.18%Aerosol Cans 0.24% 0.24% 0.16% 0.19%Metal Subtotal 4.81% 5.23% 5.79% 5.47%
ORGANICS Food Waste 25.83% 20.70% 17.23% 19.83%Yard Debris 2.86% 1.04% 1.89% 1.98%Organics Subtotal 28.70% 21.74% 19.12% 21.80%
GLASS Clear Bottles 1.15% 2.06% 0.79% 1.09%Brown Bottles 1.05% 0.98% 0.52% 0.72%Green Bottles 0.37% 0.53% 0.25% 0.33%
Light Bulbs 0.06% 0.03% 0.02% 0.03%Non-Recyclable Glass 0.30% 0.50% 2.32% 1.54%Gl S bt t l 2 94% 4 10% 3 91% 3 71%
Table 3WASTE COMPOSITION RESULTS FOR THE
CITY OF OLYMPIA'S WASTE COLLECTION SYSTEM
Average forSingle-Family Multi-FamilyHomes Residential Commercial City Collections
Glass Subtotal 2.94% 4.10% 3.91% 3.71%
OTHER E-Waste 0% 0.15% 0.04% 0.05%WASTES Other Electronics 0.10% 0.09% 0.35% 0.25%
Tires 0% 0.71% 0% 0.12%
Rubber 0.35% 0.14% 0.92% 0.66%Cosmetics 0.30% 0.54% 0.18% 0.26%Pharmaceuticals 0.07% 0.11% 0.02% 0.04%Diapers 5.92% 6.01% 1.07% 3.03%Textiles 5.31% 7.55% 2.16% 3.79%Carpet 0.29% 0.43% 0.64% 0.52%Carpet Padding 0.11% 0.31% 0% 0.08%Furniture 0% 0% 2.61% 1.56%Mattresses 0% 1.16% 0.00% 0.19%Ash, Dust 0.16% 0.12% 0.74% 0.50%Miscellaneous Organics 0.15% 0.02% 0.04% 0.06%Miscellaneous Inorganics 0.43% 0.61% 1.05% 0.83%Residuals 12.99% 9.01% 9.57% 10.28%Other Waste Subtotal 26.17% 26.95% 19.37% 22.23%
WOOD Wood 2.18% 5.36% 8.51% 6.50%
and C&D Construction and Demolition 1.04% 1.70% 4.61% 3.28%Wood, C&D Subtotal 3.22% 7.06% 13.12% 9.79%
SPECIAL Paints and Solvents 0.06% 0.25% 0.25% 0.21%WASTES Automotive 0.04% 0.00% 0.11% 0.08%
Home and Garden 0.01% 0.003% 0% 0.003%
Other 7.60% 5.57% 1.06% 3.35%Actual Hazardous Wastes 0.05% 0.02% 0.12% 0.09%Special Waste Subtotal 7.72% 5.83% 1.42% 3.63%
TOTALS 100.0% 100.0% 100.0% 100.0%
Tons Collected per Year: 6,105 4,324 15,566 25,995
Pounds of Samples Sorted: 5,206 5,168 5,546 15,919
Number of Samples Sorted: 24 24 27 75
Notes: All figures are percent by weight (except for the bottom three rows).
City of Olympia Waste Composition Study 7 Characterization of Olympia's Waste Stream

SUMMARY OF RESULTS:
PAPER Percent TPY WOOD AND C&D Percent TPYNewspaper 0 8% 210 Wood 6 5% 1 690
Figure 1CITY-WIDE RESULTS FOR OLYMPIA
Plastic14.7%
Metal5.5%
Glass3.7%
Organics21.8%
Special Wastes3.6%
Wood and C&D9.8%
Other22.2%
Paper18.6%
Newspaper 0.8% 210 Wood 6.5% 1,690Cardboard 3.6% 930 Construction, Demolition 3.3% 850Other Recyclable Paper 6.2% 1,610 Wood, C&D Subtotal 9.8% 2,540Compostable Paper 5.4% 1,410Non-Recyclable Paper 2.7% 690 SPECIAL WASTESPaper Subtotal 18.6% 4,850 Animal Excrement 2.9% 760
Other Special Wastes 0.7% 190PLASTIC Special Waste Subtotal 3.6% 940Plastic Bottles 1.6% 420Film and Bags 6.4% 1,670 ORGANICSOther Plastic 6.7% 1,730 Food Waste 19.8% 5,150Plastic Subtotal 14.7% 3,830 Yard Debris 2.0% 510
Organics Subtotal 21.8% 5,670METALAluminum Cans 0.5% 120 OTHERTin Cans 0.7% 170 Disposable Diapers 3.0% 790Other Metals 4.3% 1,130 Textiles 3.8% 990Metal Subtotal 5.5% 1,420 Carpet and Padding 0.6% 160
Miscellaneous (1) 14.8% 3,850GLASS Other Subtotal 22.2% 5,780Glass Bottles 2.1% 550Other Glass 1.6% 410 TOTALS 100.0% 25,995Glass Subtotal 3.7% 970
Notes: Percentage figures are percent by weight. TPY = tons per year.1) "Miscellaneous" includes e-waste, other electronics, tires, other rubber products, cosmetics, pharmaceuticals, furniture, mattresses, ash, dust, miscellaneous organics, miscellaneous inorganics and residuals.
City of Olympia Waste Composition Study 8 Characterization of Olympia's Waste Stream

SUMMARY OF RESULTS:
PAPER Percent TPY WOOD AND C&D Percent TPYNewspaper 0.6% 40 Wood 2.2% 130
Figure 2OLYMPIA SINGLE-FAMILY WASTE
Plastic13.6%
Metal4.8%
Glass2.9%
Organics28.7%
Special Wastes7.7%
Wood and C&D3.2%
Other26.2%
Paper12.8%
Cardboard 1.0% 60 Construction, Demolition 1.0% 60
Other Recyclable Paper 4.7% 290 Wood, C&D Subtotal 3.2% 200Compostable Paper 4.4% 270Non-Recyclable Paper 2.2% 130 SPECIAL WASTES
Paper Subtotal 12.8% 780 Animal Excrement 7.2% 440Other Special Wastes 0.5% 30
PLASTIC Special Waste Subtotal 7.7% 470
Plastic Bottles 1.1% 70Film and Bags 7.0% 430 ORGANICSOther Plastic 5.5% 340 Food Waste 25.8% 1,580
Plastic Subtotal 13.6% 830 Yard Debris 2.9% 170Organics Subtotal 28.7% 1,750
METALAluminum Cans 0.3% 20 OTHERTin Cans 0.9% 50 Disposable Diapers 5.9% 360Other Metals 3.7% 230 Textiles 5.3% 320Metal Subtotal 4.8% 290 Carpet and Padding 0.4% 20
Miscellaneous (1) 14.5% 890GLASS Other Subtotal 26.2% 1,600Glass Bottles 2.6% 160Other Glass 0.4% 20 TOTALS 100.0% 6,105Glass Subtotal 2.9% 180
Notes: Percentage figures are percent by weight. TPY = tons per year.
1) "Miscellaneous" includes e-waste, other electronics, tires, other rubber products, cosmetics, pharmaceuticals, furniture, mattresses, ash, dust, miscellaneous organics, miscellaneous inorganics and residuals.
City of Olympia Waste Composition Study 9 Characterization of Olympia's Waste Stream

SUMMARY OF RESULTS:
PAPER Percent TPY WOOD AND C&D Percent TPYNewspaper 0.7% 30 Wood 5.4% 230
Figure 3OLYMPIA MULTI-FAMILY WASTE
Plastic12.6%
Metal5.2%
Glass4.1%
Organics21.7%
Special Wastes5.8%
Wood and C&D7.1%
Other27.0%
Paper16.5%
p pCardboard 3.0% 130 Construction, Demolition 1.7% 70Other Recyclable Paper 7.6% 330 Wood, C&D Subtotal 7.1% 310Compostable Paper 3.3% 140Non-Recyclable Paper 1.9% 80 SPECIAL WASTESPaper Subtotal 16.5% 710 Animal Excrement 5.2% 220
Other Special Wastes 0.6% 30PLASTIC Special Waste Subtotal 5.8% 250Plastic Bottles 2.8% 120Film and Bags 4.9% 210 ORGANICSOther Plastic 4.9% 210 Food Waste 20.7% 900Plastic Subtotal 12.6% 540 Yard Debris 1.0% 40
Organics Subtotal 21.7% 940METALAluminum Cans 1.0% 40 OTHERTin Cans 1.2% 50 Disposable Diapers 6.0% 260Other Metals 3.1% 130 Textiles 7.6% 330Metal Subtotal 5.2% 230 Carpet and Padding 0.7% 30
Miscellaneous (1) 12.7% 550GLASS Other Subtotal 27.0% 1,170Glass Bottles 3.6% 150Other Glass 0.5% 20 TOTALS 100.0% 4,324Glass Subtotal 4.1% 180
Notes: Percentage figures are percent by weight. TPY = tons per year.1) "Miscellaneous" includes e-waste, other electronics, tires, other rubber products, cosmetics, pharmaceuticals, furniture, mattresses, ash, dust, miscellaneous organics, miscellaneous inorganics and residuals.
City of Olympia Waste Composition Study 10 Characterization of Olympia's Waste Stream

SUMMARY OF RESULTS:
PAPER Percent TPY WOOD AND C&D Percent TPYNewspaper 0.9% 140 Wood 8.5% 1,330
OLYMPIA COMMERCIAL WASTEFigure 4
Plastic15.7%
Metal5.8%
Glass3.9%
Organics19.1%
Special Wastes1.4%
Wood and C&D
13.1%
Other19.4%
Paper21.5%
p p ,Cardboard 4.7% 740 Construction, Demolition 4.6% 720Other Recyclable Paper 6.4% 990 Wood, C&D Subtotal 13.1% 2,040Compostable Paper 6.4% 1,000Non-Recyclable Paper 3.0% 470 SPECIAL WASTESPaper Subtotal 21.5% 3,350 Animal Excrement 0.6% 90
Other Special Wastes 0.8% 130PLASTIC Special Waste Subtotal 1.4% 220Plastic Bottles 1.5% 230Film and Bags 6.6% 1,030 ORGANICSOther Plastic 7.6% 1,180 Food Waste 17.2% 2,680Plastic Subtotal 15.7% 2,450 Yard Debris 1.9% 290
Organics Subtotal 19.1% 2,980METALAluminum Cans 0.4% 70 OTHERTin Cans 0.4% 70 Disposable Diapers 1.1% 170Other Metals 4.9% 770 Textiles 2.2% 340Metal Subtotal 5.8% 900 Carpet and Padding 0.6% 100
Miscellaneous (1) 15.5% 2,410GLASS Other Subtotal 19.4% 3,020Glass Bottles 1.6% 240Other Glass 2.3% 360 TOTALS 100.0% 5,546Glass Subtotal 3.9% 610
Notes: Percentage figures are percent by weight. TPY = tons per year.1) "Miscellaneous" includes e-waste, other electronics, tires, other rubber products, cosmetics, pharmaceuticals, furniture, mattresses, ash, dust, miscellaneous organics, miscellaneous inorganics and residuals.
City of Olympia Waste Composition Study 11 Characterization of Olympia's Waste Stream

WOOD WASTEDimension Lumber 0.92% 1.70% 0.62% 0.87%Pallets, Crates 0% 0% 0.23% 0.14%Treated Wood 0.31% 0.04% 0% 0.08%Roofing 0% 0% 0% 0%
Contaminated 0.02% 0.13% 1.10% 0.69%Stumps, Other Bulky Wood 0% 0% 0% 0%Plywood 0.28% 0.80% 0.65% 0.59%
Particleboard, Fiberboard 0.50% 2.33% 5.80% 3.98%Wood Products 0.17% 0.36% 0.09% 0.15%Other Wood 0% 0% 0.02% 0.01%Total Wood Waste 2.18% 5.36% 8.51% 6.50%
CONSTRUCTION AND DEMOLITION (C&D) WASTECeramics, Porcelain, China 0.12% 0% 0.70% 0.446%
Rocks, Bricks 0.05% 0% 0% 0.01%Concrete 0.09% 0.43% 0.21% 0%Soil, Dirt, Fines 0.45% 0.92% 0.03% 0.28%
Gypsum Board 0.21% 0.07% 0.54% 0.39%Fiberglass Insulation 0% 0.002% 0% 0.0004%Other Fiberglass 0% 0% 0.07% 0.043%Roofing 0.08% 0.08% 1.50% 0.93%Asphalt 0% 0% 0.34% 0.20%Other C&D 0.05% 0.20% 1.22% 0.77%
Total C&D Waste 1.04% 1.70% 4.61% 3.3%
SPECIAL WASTES
Table 4BREAKDOWN OF WOOD, C&D AND SPECIAL WASTES
FOR CITY OF OLYMPIA WASTE STREAMS
HomesSingle-Family Multi-Family Average for
Residential Commercial City Collections
Paints and Solvents; Latex Paint 0.06% 0.25% 0.25% 0.20% Oil-Based Paint 0% 0% 0% 0%
Solvents 0% 0.01% 0% 0.001%Automotive Wastes; Motor Oil, Other Oils 0% 0% 0% 0%
Oil Filters 0% 0% 0.11% 0.07% Gasoline, Fuel Oil 0% 0% 0% 0% Antifreeze 0% 0% 0% 0%
Other Auto Maintenance 0% 0% 0% 0% Batteries, Car 0.04% 0.005% 0% 0.01%Home and Garden; Pesticides, Herbicides 0.01% 0% 0% 0.002% Fertilizer w/Pest. and Herb. 0% 0% 0% 0% Fertilizer w/o Pest., Herb. 0% 0.003% 0% 0.0005%Other; Adhesives, Glues 0.10% 0% 0.02% 0.04% Cleaners, Corrosives 0% 0.04% 0.01% 0.01% Medical Wastes 0.04% 0.01% 0.30% 0.19% Household Batteries 0.19% 0.34% 0.08% 0.15% Animal Excrement 7.19% 5.18% 0.60% 2.91% Animal Carcasses 0.08% 0% 0% 0.02% Gas Cylinders 0% 0% 0% 0% Other Special Wastes 0.004% 0% 0.04% 0.03%
Actual Hazardous Waste 0.05% 0.02% 0.12% 0.09%Total Special Waste 7.72% 5.83% 1.42% 3.63%
Notes: All figures are percent by weight.
City of Olympia Waste Composition Study 12 Characterization of Olympia's Waste Stream

City of Olympia Waste Composition Study 13 Conclusions and Recommendations
S E C T I O N I I I C O N C L U S I O N S A N D R E C O M M E N D A T I O N S
A . C O N C L U S I O N S Weight of Materials Disposed The waste quantity and composition results can be combined to show the total weight of disposed materials. Table 5 provides this information for the three waste generators and for the City’s entire collection system. The data shown in Table 5 can be useful for planning recovery programs for specific materials by more clearly indicating where specific materials are being generated. For example, the composition results for Multi-Family wastes show a higher percentage of mixed waste paper (7.33%) than in the Commercial waste stream (6.16%), but because there is significantly more Commercial waste (15,566 tons per year versus 4,324 tons per year for Multi-Family), there are more tons of mixed waste paper being disposed by Commercial generators than Multi-Family generators (960 versus 317 tons per year). Amount of Waste per Capita and per Employee Another way to examine the amounts of materials disposed is to express the results based on the number of residents or employees that disposed the waste. Table 6 provides this information for the City’s waste streams. The data shown in Table 6 is based on information from the City of Olympia for the number of residents in single-family homes (37,330 residents) and multi-family units (11,150 residents). The number of employees (51,345) is a 2010 estimate from the Thurston Regional Planning Council. Analysis of Waste Composition Trends Table 7 shows the current results for the entire waste stream compared to the results from the previous study that was completed in 2009. A few adjustments had to be made in the data to provide results that could be directly compared:
carryout bags, which were treated as a separate category in the current study, were combined with other bags and film for the 2014 data.
auto parts, which were treated as a separate category in 2009 but not in the current study, were combined with mixed metals for the 2009 data.
mattresses were added to furniture for the current study.

PAPER Newspaper 36 31 143 210Cardboard 60 129 736 925Mixed Waste Paper 259 317 960 1,536Phone Books 6 1 0 7Milk Cartons, Other 20 11 34 65
Compostable 266 142 1,004 1,412Non-Recyclable Paper 134 81 475 690Paper Subtotal 782 714 3,351 4,847
PLASTIC PET Bottles 44 77 118 239HDPE Bottles 22 38 110 170Bottles 3-7 4 4 6 14Tubs 35 16 39 90Carryout Bags 53 41 47 141Bags and Film 373 170 986 1,529Plastic Packaging 122 72 414 608
Other Plastic Products 152 106 654 912Expanded Polystyrene 28 21 75 124Plastic Subtotal 832 544 2,451 3,827
METAL Aluminum Cans 16 42 66 124Aluminum Foil 17 8 19 44Tin Cans 53 51 67 171Mixed Metals 138 101 559 798Ferrous Metals 49 13 124 186White Goods 0 0 0 0
Non-Ferrous Metals 6 1 40 47Aerosol Cans 15 10 25 50Metal Subtotal 294 226 901 1,421
ORGANICS Food Waste 1,577 895 2,682 5,154Yard Debris 175 45 294 514Organics Subtotal 1,752 940 2,976 5,668
GLASS Clear Bottles 70 89 123 282Brown Bottles 64 42 81 187
Single-Family Multi-Family Totals for
Table 5WEIGHT OF DISPOSED MATERIALS
FOR CITY OF OLYMPIA WASTE STREAMS
City CollectionsHomes Residential Commercial
Green Bottles 22 23 39 84
Light Bulbs 4 1 3 8Non-Recyclable Glass 19 21 361 401Glass Subtotal 180 177 608 965
OTHER E-Waste 0 6 5 11WASTES Other Electronics 6 4 55 65
Tires 0 31 0 31Rubber 21 6 143 170Cosmetics 18 23 27 68Pharmaceuticals 4 5 2 11Diapers 362 260 167 789Textiles 324 327 336 987Carpet 18 18 100 136Carpet Padding 7 13 0 20Furniture 0 0 407 407Mattresses 0 50 0 50Ash, Dust 10 5 115 130Miscellaneous Organics 9 1 6 16Miscellaneous Inorganics 26 27 163 216
Residuals 793 389 1,489 2,671Other Waste Subtotal 1,598 1,165 3,016 5,779
WOOD Wood 133 232 1,325 1,690 and C&D Construction and Demolition 63 73 717 853
Wood, C&D Subtotal 197 305 2,042 2,544
SPECIAL Paints and Solvents 4 11 39 54WASTES Automotive 3 0 18 21
Home and Garden 1 0 0 1
Other 464 241 165 870Actual Hazardous Wastes 3 1 19 23Special Waste Subtotal 471 252 222 945
TOTALS 6,105 4,324 15,566 25,995
Notes: All figures are tons per year.
City of Olympia Waste Composition Study 14 Conclusions and Recommendations

PAPER Newspaper 1.9 5.6 5.6Cardboard 3.2 23.1 28.7Mixed Waste Paper 13.9 56.9 37.4Phone Books 0.3 0.2 0.0Milk Cartons, Other 1.1 2.0 1.3
Compostable 14.3 25.5 39.1Non-Recyclable Paper 7.2 14.5 18.5Paper Subtotal 41.9 128.1 130.5
PLASTIC PET Bottles 2.4 13.8 4.6HDPE Bottles 1.2 6.8 4.3Bottles 3-7 0.2 0.7 0.2Tubs 1.9 2.9 1.5Carryout Bags 2.8 7.4 1.8Bags and Film 20.0 30.5 38.4Plastic Packaging 6.5 12.9 16.1
Other Plastic Products 8.1 19.0 25.5Expanded Polystyrene 1.5 3.8 2.9Plastic Subtotal 44.6 97.6 95.5
METAL Aluminum Cans 0.9 7.5 2.6Aluminum Foil 0.9 1.4 0.7Tin Cans 2.8 9.1 2.6Mixed Metals 7.4 18.1 21.8Ferrous Metals 2.6 2.3 4.8White Goods 0.0 0.0 0.0
Non-Ferrous Metals 0.3 0.2 1.6Aerosol Cans 0.8 1.8 1.0Metal Subtotal 15.8 40.5 35.1
ORGANICS Food Waste 84.5 160.5 104.5Yard Debris 9.4 8.1 11.5Organics Subtotal 93.9 168.6 115.9
GLASS Clear Bottles 3.8 16.0 4.8Brown Bottles 3.4 7.5 3.2Green Bottles 1 2 4 1 1 5
DISPOSAL RATES PER CAPITA AND PER EMPLOYEEFOR CITY OF OLYMPIA WASTE STREAMS
Table 6
Single-Family Multi-FamilyResidents Residents Employees
Green Bottles 1.2 4.1 1.5
Light Bulbs 0.2 0.2 0.1Non-Recyclable Glass 1.0 3.8 14.1Glass Subtotal 9.6 31.7 23.7
OTHER E-Waste 0.0 1.1 0.2WASTES Other Electronics 0.3 0.7 2.1
Tires 0.0 5.6 0.0Rubber 1.1 1.1 5.6Cosmetics 1.0 4.1 1.1Pharmaceuticals 0.2 0.9 0.1Diapers 19.4 46.6 6.5Textiles 17.4 58.7 13.1Carpet 1.0 3.2 3.9Carpet Padding 0.4 2.3 0.0Furniture 0.0 0.0 15.9Mattresses 0.0 9.0 0.0Ash, Dust 0.5 0.9 4.5Miscellaneous Organics 0.5 0.2 0.2Miscellaneous Inorganics 1.4 4.8 6.3
Residuals 42.5 69.8 58.0Other Waste Subtotal 85.6 209.0 117.5
WOOD Wood 7.1 41.6 51.6 and C&D Construction and Demolition 3.4 13.1 27.9
Wood, C&D Subtotal 10.6 54.7 79.5
SPECIAL Paints and Solvents 0.2 2.0 1.5WASTES Automotive 0.2 0.0 0.7
Home and Garden 0.1 0.0 0.0
Other 24.9 43.2 6.4Actual Hazardous Wastes 0.2 0.2 0.7Special Waste Subtotal 25.2 45.2 8.6
TOTALS 327.1 775.6 606.3TOTAL RESIDENTS OR EMPLOYEES 37,330 11,150 51,345
Notes: All figures (except for the bottom row) are pounds per year per resident or employee.
City of Olympia Waste Composition Study 15 Conclusions and Recommendations

PAPER Newspaper 1.23% 0.81% 350 210 Cardboard 3.77% 3.56% 1,080 930 Mixed Waste Paper 8.12% 5.91% 2,320 1,540 Phone Books 0.14% 0.03% 40 10 Milk Cartons, Other 0.39% 0.25% 110 70
Compostable 7.95% 5.43% 2,270 1,410 Non-Recyclable Paper 1.50% 2.66% 430 690 Paper Subtotal 23.10% 18.65% 6,610 4,850
PLASTIC PET Bottles 0.96% 0.92% 280 240 HDPE Bottles 0.85% 0.65% 240 170 Bottles 3-7 0.04% 0.05% 10 10 Tubs 0.28% 0.34% 80 90 Bags and Film 6.66% 6.42% 1,900 1,670 Plastic Packaging 1.90% 2.34% 540 610 Other Plastic Products 2.51% 3.51% 720 910
Expanded Polystyrene 0.61% 0.48% 170 120 Plastic Subtotal 13.82% 14.72% 3,950 3,830
METAL Aluminum Cans 0.53% 0.48% 150 120
Aluminum Foil 0.17% 0.17% 50 40 Tin Cans 0.84% 0.65% 240 170 Mixed Metals 3.30% 3.07% 940 800 Ferrous Metals 1.41% 0.72% 400 190 White Goods 0.23% 0.00% 70 0Non-Ferrous Metals 0.08% 0.18% 20 50
Aerosol Cans 0.19% 0.19% 50 50 Metal Subtotal 6.76% 5.47% 1,930 1,420
ORGANICS Food Waste 22.17% 19.83% 6,340 5,160
FOR CITY OF OLYMPIA WASTE STREAMS
Table 7COMPARISON OF RESULTS TO PREVIOUS STUDY
Percent by Weight Tons per Year2009 2014 2009 2014
Yard Debris 3.36% 1.98% 960 510 Organics Subtotal 25.54% 21.80% 7,300 5,670
GLASS Clear Bottles 1.50% 1.09% 430 280
Brown Bottles 0.57% 0.72% 160 190 Green Bottles 0.37% 0.33% 110 80 Light Bulbs 0.03% 0.03% 10 10
Non-Recyclable Glass 0.47% 1.54% 130 400 Glass Subtotal 2.94% 3.71% 840 970
OTHER E-Waste 0.37% 0.05% 110 10
WASTES Other Electronics 0.38% 0.25% 110 60 Tires 0.02% 0.12% 10 30 Rubber Products 0.80% 0.66% 230 170 Cosmetics 0.16% 0.26% 50 70 Pharmaceuticals 0.04% 0.04% 10 10 Disposable Diapers 3.02% 3.03% 860 790 Textiles 2.86% 3.79% 820 990 Carpeting 0.78% 0.52% 220 140 Carpet Padding 0.50% 0.08% 140 20 Furniture and Mattresses 1.41% 1.76% 400 460 Ash, Dust 0.20% 0.50% 60 130 Miscellaneous Organics 0.10% 0.06% 30 20 Miscellaneous Inorganics 0.60% 0.83% 170 220 Residuals 7.65% 10.28% 2,190 2,670 Other Subtotal 18.90% 22.23% 5,410 5,780
WOOD Wood 4.72% 6.50% 1,350 1,690 and C&D Construction, Demolition 1.56% 3.28% 450 850
Wood, C&D Subtotal 6.28% 9.79% 1,800 2,540 SPECIAL WASTES 2.65% 3.63% 760 940 TOTAL WASTE STREAM 100.0% 100.0% 28,600 26,000
City of Olympia Waste Composition Study 16 Conclusions and Recommendations

City of Olympia Waste Composition Study 17 Conclusions and Recommendations
When examining the data in Table 7, it is important to bear in mind that:
The amount of waste disposed in the past year is lower than the 2009 amount, despite a slight increase in population in the past five years. This is probably due to a combination of the current economy, which may still be recovering from the recession, and new diversion programs, which have led to increases in the amounts of materials recycled and composted. A lower overall amount of waste could cause lower results for individual materials.
The figures in the first set of columns in Table 7 are percentages, and these
figures could change due solely to changes in other materials. For example, the annual tonnage of a material such as brown glass bottles could remain at about the same amount, but the percentage of this material would change due to a large increase or decrease in another materials.
Bearing in mind the difficulty of drawing firm conclusions from this data, some interesting trends can still be observed for each of the major categories:
Paper: the amounts for all of the recyclable and compostable grades of paper have decreased since the previous study, while the amount of non-recyclable paper has increased. Looking back on the results for individual generators in the previous study, the decrease in recyclable and compostable grades of paper appears to have occurred for all three generators and for every type of material. While the decrease in newspaper might be the result of decreasing subscriptions, the decrease in other materials could be result of increased recycling levels.
Plastic: the amounts of plastic bottles have also decreased since the last study,
again possibly due to increased recycling. In comparing the current results for individual generators to the previous study, however, it appears that the amount of plastic PET bottles in the Multi-Family waste stream has increased and the total amount of plastics has also increased.
Metal: the amount of metal in Thurston County’s waste stream has generally
been in decline over the past 15 years, presumably due to a combination of factors such as increased recycling and lower consumption of this material for packaging and other applications, and the City’s results appear to reflect the same pattern here.
Organics: the amount of food waste and yard debris in the City’s waste stream
has decreased significantly compared to the previous study, presumably the result of diverting food waste through the mixed organics program and an increased subscription rate for the organics collection service.

City of Olympia Waste Composition Study 18 Conclusions and Recommendations
Glass: the amount of clear glass bottles has decreased while brown glass has increased and green glass has decreased slightly but stayed almost the same. Looking back at the results of the previous study, it appears that both of the residential generators (Single-Family and Multi-Family) are disposing of greater amounts of all colors of glass bottles while Commercial generators are disposing of less.
Wood and Construction/Demolition (C&D) Wastes: the percentage and
tonnages of wood and C&D wastes in the City’s waste stream show an increase in the current study compared to the previous study. This increase appears to be true for all generators but not for all materials. The cause for this is uncertain, but a likely explanation could be increased construction and remodeling activities.
Other Wastes and Special Wastes: these categories include a variety of different
materials and it’s difficult to draw firm conclusions from the results for many of these. Some notable differences appear to exist, however, including a decrease in e-waste from 0.37% in 2009 to 0.05% in 2014. It’s also interesting to note that textiles have increased from 2.86% in 2009 to 3.79% in 2014. For special wastes, another significant change appears to have occurred for animal excrement (“kitty litter” and other pet wastes), which increased from 2.21% in 2009 to 2.91% in 2014.
Recycling Potential Assessment One of the key reasons for conducting a study such as this is to determine how much recyclable materials remain in the waste stream (see Table 8 and Figure 5). In addition to examining “typical” recyclable materials (those materials that are collected through the curbside and commercial recycling programs), other potentially-recyclable materials can also be examined. This data provides important information for planning new or expanded recycling and composting programs. Materials have been broadly grouped into three categories for this analysis:
Typical Recyclables: these are the materials that are typically collected through curbside and commercial programs. The list of materials for this group is based on Olympia’s curbside recycling program.
Organics: these are the materials that are collected through the “expanded
organics” collection program used in Olympia. Although other materials could potentially be considered compostable (such as other types of wood), these are not included here because current composting systems are not equipped to handle those materials.

% TPY % TPY % TPY % TPYTypical Recyclables:
Newspaper 0.58% 36 0.72% 31 0.92% 143 0.81% 210Cardboard 0.99% 60 2.99% 129 4.73% 736 3.56% 925Mixed Waste Paper 4.25% 259 7.33% 317 6.16% 960 5.91% 1,536
Phone Books 0.10% 6 0.03% 1 0.00% 0 0.03% 7Milk Cartons, Other 0.33% 20 0.27% 11 0.22% 34 0.25% 65PET Bottles 0.72% 44 1.79% 77 0.76% 118 0.92% 239
HDPE Bottles 0.36% 22 0.89% 38 0.71% 110 0.65% 170Bottles 3-7 0.06% 4 0.10% 4 0.04% 6 0.05% 14Tubs 0.57% 35 0.37% 16 0.25% 39 0.34% 90Aluminum Cans 0.26% 16 0.98% 42 0.42% 66 0.48% 124Tin Cans 0.86% 53 1.17% 51 0.43% 67 0.65% 171Aerosol Cans 0.24% 15 0.24% 10 0.16% 25 0.19% 50Glass Bottles 2.57% 156 3.58% 154 1.56% 243 2.13% 553
Subtotal 11.9% 726 20.4% 881 16.4% 2,547 16.0% 4,154
Organics
Compostable Paper 4.36% 266 3.29% 142 6.45% 1,004 5.43% 1,412Food Waste 25.83% 1,577 20.70% 895 17.23% 2,682 19.83% 5,154Yard Debris 2.86% 175 1.04% 45 1.89% 294 1.98% 514Dimension Lumber 0.92% 56 1.70% 74 0.62% 96 0.87% 226Pallets, Crates 0% 0 0% 0 0.23% 36 0.14% 36Subtotal 34.0% 2,074 26.7% 1,156 26.4% 4,112 28.2% 7,342
Other RecyclablesPlastic Bags and Film 6.98% 426 4.86% 211 6.64% 1,033 6.42% 1,670
Plastic Packaging 2.00% 122 1.65% 72 2.66% 414 2.34% 608
Single-Family
Table 8RECYCLING POTENTIAL ASSESSMENT
FOR CITY OF OLYMPIA WASTE STREAMS
City CollectionsCommercialMulti-FamilyResidential
Totals forHomes
ast c ac ag g 00% 65% 66% 3 % 608Expanded Polystyrene 0.47% 28 0.48% 21 0.48% 75 0.48% 124Mixed Metals 2.26% 138 2.33% 101 3.59% 559 3.07% 798
Ferrous Metals 0.81% 49 0.30% 13 0.80% 124 0.72% 186Non-Ferrous Metals 0.10% 6 0.03% 1 0.26% 40 0.18% 47Light Bulbs 0.06% 4 0.03% 1 0.02% 3 0.03% 8
E-Waste 0% 0 0.15% 6 0.04% 5 0.05% 11Other Electronics 0.10% 6 0.09% 4 0.35% 55 0.25% 65Tires 0% 0 0.71% 31 0% 0 0.12% 31
Textiles 5.31% 324 7.55% 327 2.16% 336 3.79% 987Carpet 0.29% 18 0.43% 18 0.64% 100 0.52% 136Carpet Padding 0.11% 7 0.31% 13 0% 0 0.08% 20Plywood 0.28% 17 0.80% 34 0.65% 101 0.59% 153Particleboard, Fiberboard 0.50% 30 2.33% 101 5.80% 903 3.98% 1,034Ceramics, Porcelain, China 0.12% 7 0% 0 0.70% 109 0.45% 116Rocks, Bricks 0.05% 3 0% 0 0.0% 0 0.01% 3Concrete 0.09% 5 0.43% 18 0.21% 33 0.22% 57Soil, Dirt, Fines 0.45% 27 0.92% 40 0.03% 5 0.28% 72Gypsum Board 0.21% 13 0.07% 3 0.54% 84 0.39% 100Roofing (Asphalt) 0.08% 5 0.08% 3 1.50% 233 0.93% 241Oil Filters 0% 0 0% 0 0.11% 18 0.07% 18Household Batteries 0.19% 11 0.34% 15 0.08% 13 0.15% 39Subtotal 20.4% 1,247 23.9% 1,034 27.3% 4,242 25.1% 6,523
Other Materials (Wastes) 33.7% 2,058 28.9% 1,254 30.0% 4,664 30.7% 7,976
Total Annual Amount Disposed 6,105 4,324 15,566 25,995
Notes: TPY = tons per year. Percentage figures are percentage by weight.
City of Olympia Waste Composition Study 19 Conclusions and Recommendations

City of Olympia Waste Composition Study 20 Conclusions and Recommendations
Figure 5 RECYCLING POTENTIAL ASSESSMENT
FOR CITY OF OLYMPIA WASTE STREAMS
0%
10%
20%
30%
40%
50%
60%
70%
80%
90%
100%
Single-Family Homes
Multi-Family Commercial City-Wide Average
Typical Recyclables
Organics
Other Recyclables
Waste

City of Olympia Waste Composition Study 21 Conclusions and Recommendations
Other Recyclables: the third group includes materials that could potentially be recycled through existing or new recycling programs. This group includes materials that:
- are recycled currently through programs that are conducted separately from the City’s programs (such as textiles, plastic bags, wood and carpeting).
- are being diverted to applications that do not strictly meet the definition of recycling (such as wood converted to hog fuel).
Materials not included in one of the three categories above combined as “other materials” (or waste). As can be seen in Table 8 and Figure 5, a significant amount of recyclable and compostable materials remain in the City’s waste streams. If all of the recyclable, compostable and potentially-recyclable materials could be diverted from disposal, only 30.7% of the City’s current waste would remain. It should be noted that there is no approach that can recover 100% of a recyclable material (although a combination of mandatory requirements together with financial incentives, such as is used for car batteries, can come close). Waste Composition Conclusions There are distinct differences in the wastes from different types of waste generators (see Tables 3, 4 and 5). A few noteworthy conclusions can be drawn for each generator:
Single-Family: the largest categories of materials present in this waste stream are:
- food waste, 25.8%, - animal excrement, 7.2%, - plastic bags and film, 7.0%, - disposable diapers, 5.9%, - compostable paper, 4.4%, - mixed waste paper, 4.2%, - textiles, 5.3%, and - yard debris, 2.9%. Significant quantities of recyclable and compostable materials remain in this waste stream despite the widespread availability of recycling and organics collection programs for single-family homes. If residents recycled all of the materials currently accepted through the existing recycling and organics collection programs, an additional 45.9% of the Single-Family waste stream could be diverted from disposal. This is the equivalent of 2,800 tons per year of additional recyclable and compostable materials.

City of Olympia Waste Composition Study 22 Conclusions and Recommendations
Multi-Family (apartments): the largest categories of materials present in the waste stream for this generator are:
- food waste, 20.7%, - textiles, 7.6%, - mixed waste paper, 7.3%, - disposable diapers, 6.0%, - animal excrement, 5.2%, - plastic bags and film, 4.9%, and - compostable paper, 3.3%. The percentage of recyclable materials in apartment wastes is higher than for Single-Family wastes, although the tonnage figure for recyclable materials is lower due to the smaller waste quantities disposed by Multi-Family generators. The amount of compostable organics is also lower than Single-Family waste, on both a percentage and tonnage basis. The Multi-Family waste stream contains 47.1% or 2,037 tons per year of recyclable and compostable materials.
Commercial: the largest categories of materials present in the waste from this
source are:
- food waste, 17.2%, - plastic bags and film, 6.6%, - compostable paper, 6.4%, - mixed waste paper, 6.2%, - particle board, 5.8%, and - cardboard, 4.7%. The Commercial waste stream contains 42.8% recyclable and compostable materials, or about 6,659 tons per year. This is an improvement compared to the previous waste composition study, which showed this waste stream to contain 56.6% recyclable and compostable materials, or 10,544 tons per year. It appears that the greatest reductions have occurred in mixed waste paper, glass bottles, compostable paper, food waste and yard debris.
Total Waste Stream: overall, the City’s waste stream contains significant
amounts of:
- food waste, 19.8%, - plastic bags and film, 6.4%, - mixed waste paper, 5.9%, - compostable paper, 5.4%, - particle board, 4.0%, - textiles, 3.8%, and - cardboard, 3.6%.

City of Olympia Waste Composition Study 23 Conclusions and Recommendations
The overall amount of recyclable and compostable materials that could be handled through existing programs and facilities is 44.2% or 11,496 tons per year. This is an improvement compared to the previous waste composition study, which showed this waste stream to contain 53.5% recyclable and compostable materials, or 15,287 tons per year. It appears that the greatest reductions have occurred in the recyclable grades of paper, HDPE bottles, tin cans, glass bottles, and all of the organics.
B . R E C O M M E N D A T I O N S The following recommendations are based on the results of this study: There continues to be a significant amount of recyclable materials disposed in the
City of Olympia’s waste streams. The City could increase waste diversion without creating new infrastructure or programs since a significant portion of the disposed waste stream consists of standard recyclable materials. If the City of Olympia desires to increase the recycling rate substantially over current levels, however, a different approach may be needed. Alternative approaches could include mandatory recycling or targeted programs such as disposal bans for specific materials.
Recent steps have been taken to increase food waste diversion, but for now large
amounts of this material remain in the waste stream. More publicity and/or diversion programs for food waste should be considered.

City of Olympia Waste Composition Study 24 Conclusions and Recommendations

City of Olympia Waste Composition Study G-1 Glossary
G L O S S A R Y I N T R O D U C T I O N This glossary provides the definitions used for waste sorting categories. W A S T E S O R T I N G C A T E G O R I E S Paper
Newspaper: printed groundwood newsprint, including glossy ads and Sunday edition magazines that are delivered with the newspaper (unless these are found separately during sorting).
Cardboard: unwaxed kraft paper corrugated containers and boxes, unless poly- or foil-laminated. Note that this category did not include brown kraft paper bags.
Mixed Waste Paper: high- and low-grade potentially recyclable papers, including colored papers, office paper, notebook or other lined paper, envelopes with plastic windows, non-corrugated paperboard, frozen food packaging, carbonless copy paper, egg cartons, magazines, and junk mail.
Phone Books: printed and bound phone books made primarily of groundwood paper.
Milk Cartons and Other Aseptic Containers: milk cartons and similar gable-top containers (such as orange juice cartons), and juice drink boxes.
Compostable Paper: non-recyclable papers that could be composted, such as towels, plates, cups, pizza boxes, waxed paper, and waxed cardboard. This category included paper that was contaminated or soiled with food or liquid in its normal use.
Non-Recyclable Paper: contaminated papers and non-recyclable types of papers such as carbon paper, tissues, laminated paper, paper packaging with metal or plastic parts, and hardcover books. Plastic
PET Bottles: polyethylene terephthalate (PET) bottles, including soda, oil, liquor and other types of bottles. No attempt was made to remove base cups, caps, or wrappers. The SPI code for PET is 1.
HDPE Bottles: high density polyethylene (HDPE) milk, juice, detergent, and other bottles. This category did not include motor oil bottles. The SPI code for HDPE is 2.
Bottles Types 3 - 7: all other bottles that were not PET or HDPE, where the neck of the container is narrower than the body. Included SPI codes 3 - 7.
Tubs: plastic containers of all resin types that were as wide or wider at the top than at the bottom.
Carryout Bags: thin plastic bags provided by retail establishments at the point of sale or departure. Did not include newspaper bags, dry cleaning bags, bags used by customers for

City of Olympia Waste Composition Study G-2 Glossary
bulk foods, bags used for prescription drugs or deli carryout, or film used to wrap meats and other damp products.
Other Film and Bags: all other plastic packaging films and bags. To be counted in this category, the material must have been flexible (i.e., can be bent without making a noise).
Plastic Packaging: all other plastic packaging (besides tubs, bottles, film and bags), and shipping materials and other plastic items which were not themselves finished consumer products, including thermoplastics and thermosetting plastics used for packaging. Also included HDPE motor oil bottles.
Plastic Products: finished plastic products such as toys, toothbrushes, vinyl hose and shower curtains, including non-C&D fiberglass resin products and materials (see “fiberglass insulation” and “other fiberglass” under C&D Wastes, below).
Expanded Polystyrene: packaging and finished products made of expanded polystyrene. The SPI code for polystyrene (PS) is 6. Metal
Aluminum Cans: aluminum beverage cans.
Aluminum Foil: aluminum foil and food trays.
Tin Cans: tin-coated steel food containers. This category included bi-metal beverage cans, but not paint cans or other types of cans.
Mixed Metals/Materials: small appliances, motors, insulated wire and finished products containing a mixture of metals and/or other materials, but which were greater than 50% metal.
Ferrous Metals: products and pieces made from metal to which a magnet adhered (but including stainless steel), and which were not significantly contaminated with other metals or materials (in the latter case, the item was instead included under “mixed metals/materials”). This category included paint cans and other non-food cans.
White Goods: large household appliances or parts thereof. Special note was taken if any of these were found still containing refrigerant.
Non-Ferrous Metals: metallic products and pieces not derived from iron (i.e., to which a magnet did not adhere) and which were not significantly contaminated with other metals or materials (in the last case, the item was instead included under “mixed metals/materials”).
Aerosol Cans: metal cans used for containing and applying products under pressure. If the can was full or partially full, with the contents making up more than 25% of the total weight, it was included under the category appropriate for the contents. Special Wastes
Latex Paint: water-based paints.
Oil-Based Paint: solvent-based paints.
Solvents: included chlorinated or flammable solvents, paint strippers, solvents contaminated with other products such as paints, degreasers, other cleaners if the primary ingredient was a solvent, and alcohols such as methanol and isopropanol. Alcoholic beverages intended for

City of Olympia Waste Composition Study G-3 Glossary
human consumption were included in food waste or categorized based on the container if empty.
Adhesives and Glues: glues and adhesives of various sorts, including rubber cement, wood putty, glazing and spackling compounds, caulking compounds, grout, and joint fillers.
Cleaners and Corrosives: included various acids and bases whose primary purpose is to clean surfaces, unclog drains, and perform other functions.
Medical Waste: wastes related to medical activities, including syringes, tubing, bandages, medicine, and other wastes, and not restricted to just those wastes regulated as pathogenic or infectious.
Motor Oil, Other: used or new lubricating oils, primarily those used in cars but possibly also including other materials with similar characteristics.
Oil Filters: used filters such as those used in cars but including similar filters from other applications.
Gasoline and Fuel Oil: gasoline, diesel fuel and light fuel oils, such as those used for home heating.
Antifreeze: automobile and other antifreeze mixtures based on ethylene or propylene glycol, also brake and other fluids if glycol-based.
Other Automotive Maintenance: other products used for automobile maintenance, generally of a non-hazardous nature, such as car wax, polishes, autobody fillers, etc.
Car Batteries: car, motorcycle, and other lead-acid batteries used for motorized vehicles.
Household Batteries: batteries of various sizes and types, as commonly used in households.
Animal Excrement: feces and associated wastes from animals, such as bags of used kitty litter.
Animal Carcasses: carcasses of small animals and pieces of larger animals unless the item is the result of food preparation.
Gas Cylinders: pressurized gas cylinders with the contents making up more than 25% of the total weight (if less than 25% or empty, the gas cylinders were counted as metal).
Pesticides and Herbicides: included poisons whose purpose is to discourage or kill pests, weeds or microorganisms. Fungicides and wood preservatives, such as pentachlorophenol, were also included in this category.
Fertilizers with Pesticides/Herbicides: fertilizers that contain weed killer or other ingredients designed to eliminate weeds and/or pests.
Fertilizers without Pesticides/Herbicides: fertilizers without herbicide or pesticide additives.
Other Hazardous and Special Waste: problem wastes that did not fall into one of the above categories, such as asbestos-containing wastes (if this was the primary hazard associated with the waste), gunpowder, other unspent ammunition, and radioactive materials. Organics
Edible Food: All food, such as vegetables, fruits, breads, meats, pastas, that appeared to be edible or that appeared to have been edible when discarded. For this category, foods with small blemishes were still considered as edible, but scraps of food already removed from the edible
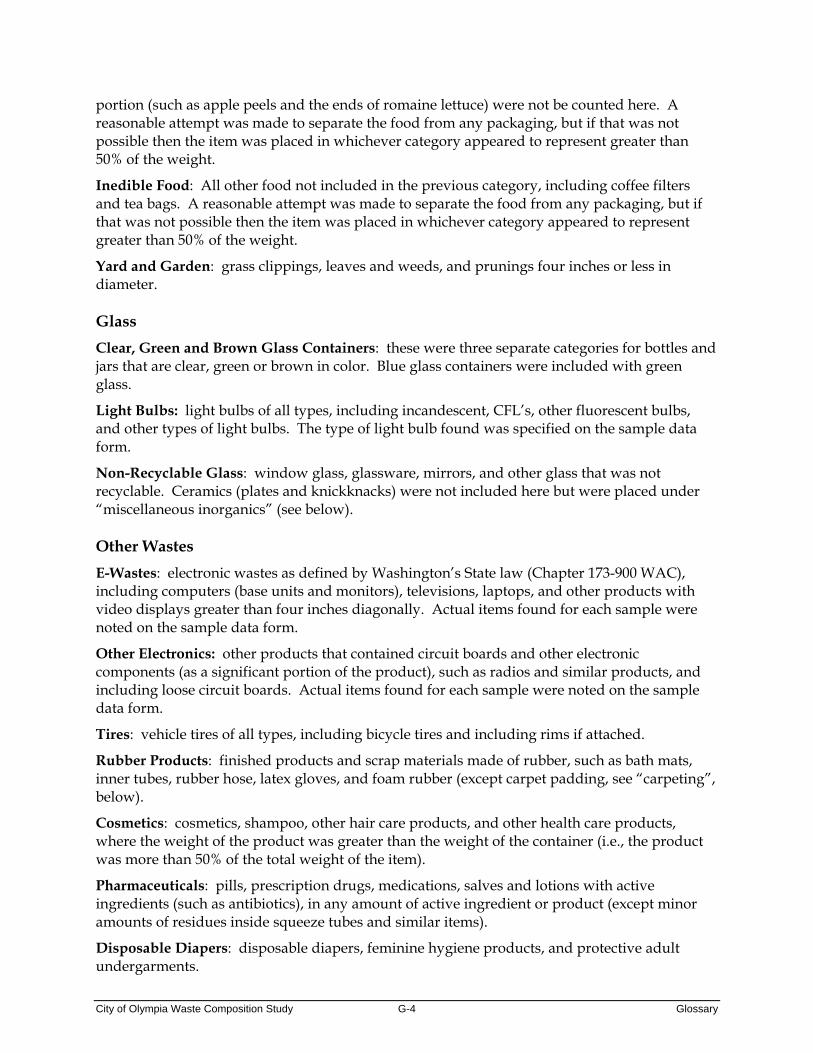
City of Olympia Waste Composition Study G-4 Glossary
portion (such as apple peels and the ends of romaine lettuce) were not be counted here. A reasonable attempt was made to separate the food from any packaging, but if that was not possible then the item was placed in whichever category appeared to represent greater than 50% of the weight.
Inedible Food: All other food not included in the previous category, including coffee filters and tea bags. A reasonable attempt was made to separate the food from any packaging, but if that was not possible then the item was placed in whichever category appeared to represent greater than 50% of the weight.
Yard and Garden: grass clippings, leaves and weeds, and prunings four inches or less in diameter. Glass
Clear, Green and Brown Glass Containers: these were three separate categories for bottles and jars that are clear, green or brown in color. Blue glass containers were included with green glass.
Light Bulbs: light bulbs of all types, including incandescent, CFL’s, other fluorescent bulbs, and other types of light bulbs. The type of light bulb found was specified on the sample data form.
Non-Recyclable Glass: window glass, glassware, mirrors, and other glass that was not recyclable. Ceramics (plates and knickknacks) were not included here but were placed under “miscellaneous inorganics” (see below). Other Wastes
E-Wastes: electronic wastes as defined by Washington’s State law (Chapter 173-900 WAC), including computers (base units and monitors), televisions, laptops, and other products with video displays greater than four inches diagonally. Actual items found for each sample were noted on the sample data form.
Other Electronics: other products that contained circuit boards and other electronic components (as a significant portion of the product), such as radios and similar products, and including loose circuit boards. Actual items found for each sample were noted on the sample data form.
Tires: vehicle tires of all types, including bicycle tires and including rims if attached.
Rubber Products: finished products and scrap materials made of rubber, such as bath mats, inner tubes, rubber hose, latex gloves, and foam rubber (except carpet padding, see “carpeting”, below).
Cosmetics: cosmetics, shampoo, other hair care products, and other health care products, where the weight of the product was greater than the weight of the container (i.e., the product was more than 50% of the total weight of the item).
Pharmaceuticals: pills, prescription drugs, medications, salves and lotions with active ingredients (such as antibiotics), in any amount of active ingredient or product (except minor amounts of residues inside squeeze tubes and similar items).
Disposable Diapers: disposable diapers, feminine hygiene products, and protective adult undergarments.

City of Olympia Waste Composition Study G-5 Glossary
Textiles: cloth, clothing, rope, tennis shoes, and rubberized cloth.
Carpeting: pieces of carpeting.
Carpet Padding: foam rubber and other materials used as padding under carpets.
Furniture: furniture made of various materials and in any condition.
Mattresses: mattresses made of various materials and in any condition.
Ash and Dust: fireplace, burn barrel or firepit ash, as well as bags of vacuum cleaner dust.
Miscellaneous Organics: miscellaneous organic materials that could be sorted out of the sample but that did not fit into another category, such as wax.
Miscellaneous Inorganics: miscellaneous inorganic materials that could be sorted out of the sample but that did not fit into another category, such as ceramic products.
Residuals: mixed waste that remained on the sorting table after all the materials that could practicably be removed had been sorted out. This material consisted primarily of small pieces of various types of paper and plastic, but also contained small pieces of broken glass and other materials. Wood Wastes
Dimension Lumber: wood commonly used in construction for framing, such as 2x4's and 2x6's.
Pallets: partial or whole pallets and similar shipping containers.
Treated Wood: wood treated with preservatives such as creosote, including dimension lumber if treated. Did not include painted or varnished wood. This category also included some plywood (especially “marine plywood”), and other wood.
Roofing: wood that is commonly used for roofing of buildings, such as cedar shingles or shakes. Roofing made from non-wood materials was classified under other categories (see “roofing wastes” under C&D, below).
Contaminated Wood: wood that was contaminated with other wastes in such a way that it could not easily be separated, but consisting primarily (over 50%) of wood.
Stumps and Other Bulky Wood: stumps of trees and shrubs, with the adhering soil (if any), and other natural woods in excess of four inches in diameter (such as logs and branches).
Plywood: a wood product built up of two or more veneer sheets glued or cemented together under pressure.
Particle Board / Fiberboard: building material made up of fibers of various substances (but typically made from wood chips) pressed together to form large sheets or boards.
Wood Products: goods and products fabricated primarily (over 50% by weight) from wood, including toys, household items, and similar goods. Did not include building materials or furniture.
Other Wood Waste: other types of wood that did not fit into the above categories. Construction and Demolition (C&D) Wastes
Ceramics, Porcelain, and China: used toilets and sinks. Non-C&D ceramics, such as plates and other dishes, were included under “miscellaneous inorganics.”

City of Olympia Waste Composition Study G-6 Glossary
Rocks and Brick: rock, gravel, and bricks of various types and sizes.
Concrete: cement (mixed or unmixed), concrete blocks, and similar wastes.
Soil, Dirt, and Non-Distinct Fines: soil, sand, dirt and similar materials, where these could be recovered separately from the residuals measured as part of the normal sorting procedure.
Gypsum Board: used or new gypsum wallboard, sheetrock or drywall present in recoverable amounts or pieces (generally any piece larger than two inches square was recovered from the sample).
Fiberglass Insulation: did not include other types of insulation or other fiberglass products.
Other Fiberglass: durable, large products such as shower stalls and bathtubs. Small, non-C&D objects were categorized with “other plastic products”.
Roofing Waste: asphalt and fiberglass shingles, tar paper, and similar wastes from demolition or installation of roofs. Did not include cedar shingle or shakes (see wood subcategory, “roofing wood”).
Asphalt: restricted to asphalt paving material.
Other C&D: C&D materials that were not included in the above categories.

A P P E N D I X B COMPOSIT ION DATA FOR THURSTON COUNTY BU ILD INGS


Thurston County Waste Composition Study B-1 Appendix B: Composition Data for County Buildings
APPENDIX B C O M P O S I T I O N D A T A F O R T H U R S T O N C O U N T Y B U I L D I N G S
A . I N T R O D U C T I O N This appendix shows the composition data from samples that were taken each quarter from three Thurston County buildings. B . M E T H O D O L O G Y In order to determine the composition of wastes from County offices, Thurston County staff assisted with the arrangements necessary to sample three county facilities each quarter. The three facilities were: Family Justice center, Public Health offices, and County Courthouse. One sample was taken each quarter from each of these buildings, except in October when a sample from the Family Justice Center was not available and a sample from Building E of the County’s offices was tested instead. In most cases, the entire contents of the dumpsters for these facilities was brought separately to WARC and sorted there. The waste container for the County Courthouse was a roll-off container, however, so that container was dumped at WARC per normal procedures and a 200-pound sample taken from it. The results of these samples are shown in Table B-1.

October January May August Average October January May August AverageNewspaper NA 0.07% 0.60% 0.80% 0.49% 0% 0% 0.42% 0.25% 0.17%Cardboard NA 0.42% 2.11% 1.42% 1.31% 0.31% 0.84% 1.01% 0.71% 0.72%Mixed Waste Paper NA 2.26% 3.74% 10.56% 5.52% 2.34% 4.66% 4.72% 7.48% 4.80%Phone Books NA 0% 0% 0% 0% 0% 0% 0% 0% 0%Milk Cartons, Other NA 1.36% 2.20% 2.22% 1.93% 0.46% 0.70% 0% 1.01% 0.54%Compostable NA 6.71% 12.74% 14.17% 11.21% 15.06% 24.31% 16.34% 26.80% 20.63%Non-Recyclable Paper NA 1.03% 4.31% 3.47% 2.94% 18.99% 2.79% 6.45% 3.54% 7.94%Paper Subtotal NA 11.84% 25.70% 32.64% 23.40% 37.16% 33.30% 28.94% 39.80% 34.80%PET Bottles NA 0.56% 2.30% 1.84% 1.57% 1.08% 1.21% 1.94% 1.21% 1.36%HDPE Bottles NA 0.04% 0.84% 0.64% 0.51% 0.98% 1.21% 0.84% 0.51% 0.89%Bottles 3-7 NA 0.14% 0.12% 0% 0.09% 0% 1.63% 0% 0.05% 0.42%Tubs NA 0.45% 3.72% 0.62% 1.60% 0.39% 1.68% 1.26% 0.76% 1.02%Carryout Bags NA 0.19% 0.67% 0.43% 0.43% 0.49% 0.65% 0.51% 0.30% 0.49%Bags and Film NA 5.35% 3.54% 5.81% 4.90% 6.58% 7.64% 8.25% 10.21% 8.17%Plastic Packaging NA 0.92% 4.53% 1.70% 2.38% 2.64% 4.75% 1.52% 4.45% 3.34%Other Plastic Products NA 0.14% 1.08% 2.13% 1.12% 2.69% 3.40% 5.64% 0.76% 3.12%Expanded Polystyrene NA 0.14% 0.19% 0.09% 0.14% 0.77% 0.35% 0.84% 2.93% 1.22%Plastic Subtotal NA 7.93% 17.00% 13.26% 12.73% 15.62% 22.52% 20.81% 21.19% 20.03%Aluminum Cans NA 0.18% 0.00% 0.53% 0.24% 0.31% 0.35% 2.70% 0.38% 0.94%Aluminum Foil NA 0.07% 0.12% 0.35% 0.18% 0.31% 0.35% 0.42% 0.64% 0.43%Tin Cans NA 0.14% 0.48% 0.18% 0.27% 0.31% 0.47% 0.64% 0.38% 0.45%Mixed Metals NA 8.49% 0% 0.09% 2.86% 0% 0.59% 0% 0.64% 0.31%Ferrous Metals NA 0% 0.12% 0.00% 0.04% 0.31% 0% 0% 0.38% 0.17%White Goods NA 0% 0% 0% 0% 0% 0% 0% 0% 0%Non-Ferrous Metals NA 0.0% 0.0% 0.0% 0.0% 0% 0% 0% 0% 0%Aerosol Cans NA 0.14% 0.36% 0.00% 0.17% 0.37% 0.59% 0.42% 0% 0.34%Metal Subtotal NA 9.02% 1.09% 1.16% 3.76% 1.60% 2.35% 4.18% 2.43% 2.64%Latex Paint NA 0% 0% 0% 0% 0% 0% 0% 0% 0%Oil-Based Paint NA 0% 0% 0% 0% 0% 0% 0% 0% 0%Solvents NA 0% 0% 0% 0% 0% 0% 0% 0% 0%Adhesives, Glues NA 0% 0% 0% 0% 0% 0% 0% 0% 0%Cleaners, Corrosives NA 0% 0.48% 0% 0.16% 0% 2.33% 0% 0% 0.58%Medical Wastes NA 0% 0% 0% 0% 0% 0% 0% 0% 0%Motor Oil, Other NA 0% 0% 0% 0% 0% 0.12% 0% 0% 0.03%Oil Filters NA 0% 0% 0% 0% 0% 0% 0% 0% 0%Gasoline, Fuel Oi NA 0% 0% 0% 0% 0% 0% 0% 0% 0%Antifreeze NA 0% 0% 0% 0% 0% 0% 0% 0% 0%Other Auto Maintenance NA 0% 0% 0% 0% 0% 0% 0% 0% 0%Batteries, Car NA 0% 0% 0% 0% 0% 0% 0% 0% 0%Household Batteries NA 0.04% 0% 0.09% 0.04% 0% 0% 1.68% 0.13% 0.45%Animal Excrement NA 0% 0% 0.07% 0.02% 0% 0% 0% 0% 0%Animal Carcasses NA 0% 0% 0% 0% 0% 0% 0% 0% 0%Gas Cylinders NA 0% 0% 0% 0% 0% 0% 0% 0% 0%Pesticides, Herbicides NA 0% 0% 0% 0% 0% 0% 0% 0% 0%Fertilizer with Pesticides NA 0% 0% 0% 0% 0% 0% 0% 0% 0%Fertilizer w/o Pesticides NA 0% 0% 0% 0% 0% 0% 0% 0% 0%Other Hazardous Wsates NA 0% 0% 0% 0% 0% 0% 0% 0% 0%Actual Hazardous Wastes NA 0% 0% 0% 0% 0% 0.12% 1.68% 0% 0.45%Special Waste Subtotal NA 0.04% 0.48% 0.16% 0.23% 0% 2.45% 1.68% 0.13% 1.07%Food Waste NA 16.38% 30.65% 38.82% 28.62% 27.57% 25.89% 28.86% 27.05% 27.34%Yard Debris NA 0% 0% 0.78% 0.26% 0.08% 0.00% 4.72% 0.25% 1.26%Organics Subtotal NA 16.38% 30.65% 39.60% 28.88% 27.65% 25.89% 33.57% 27.31% 28.61%Clear Bottles NA 0.31% 0.36% 1.24% 0.64% 0.92% 1.52% 1.90% 2.02% 1.59%Brown Bottles NA 0.25% 0% 0% 0.08% 0% 0% 0% 0% 0%Green Bottles NA 0% 0% 0% 0% 0.46% 0% 0% 0% 0.12%Light Bulbs NA 0% 0% 0% 0% 0% 0% 0% 0% 0%Non-Recyclable Glass NA 0.35% 0% 0% 0.12% 0% 0% 0% 0% 0%Glass Subtotal NA 0.91% 0.36% 1.24% 0.84% 1.38% 1.52% 1.90% 2.02% 1.71%E-Waste NA 0% 0% 0% 0% 0% 0% 0% 0% 0%Other Electronics NA 0% 0% 0% 0% 0% 0% 0% 0% 0%Tires NA 0% 0% 0% 0% 0% 0% 0% 0% 0%Rubber NA 0.84% 4.20% 1.06% 2.03% 0.31% 1.52% 1.06% 0.25% 0.78%Cosmetics NA 0% 0.12% 0.45% 0.19% 0% 0.05% 0% 0% 0.01%Pharmaceuticals NA 0% 0% 0.09% 0.03% 0% 0.12% 0% 0.05% 0.04%Diapers NA 0% 0.72% 1.56% 0.76% 0% 0.23% 0.22% 0% 0.11%Textiles NA 46.82% 6.13% 0.92% 17.96% 0% 0.28% 1.68% 1.11% 0.77%Carpet NA 0% 0% 0% 0% 0% 0% 0% 0% 0%Carpet Padding NA 0% 0% 0% 0% 0% 0% 0% 0% 0%Furniture NA 0% 0% 0% 0% 0% 0% 0% 0% 0%Mattresses NA 0% 0% 0% 0% 0% 0% 0% 0% 0%Ash, Dust NA 0% 1.56% 0% 0.52% 0% 0.37% 0% 0% 0.09%Miscellaneous Organics NA 0% 0% 0% 0% 0% 0% 0% 0% 0%Miscellaneous Inorganics NA 0% 0% 0% 0% 0.61% 0% 0% 3.29% 0.98%Residuals NA 6.24% 11.59% 7.87% 8.57% 11.25% 9.41% 5.73% 2.33% 7.18%Other Waste Subtotal NA 53.89% 24.32% 11.95% 30.05% 12.17% 11.98% 8.69% 7.03% 9.97%Dimension Lumber NA 0% 0.38% 0% 0.13% 0% 0% 0% 0% 0%Pallets/Crates NA 0% 0% 0% 0% 0% 0% 0% 0% 0%Treated Wood NA 0% 0% 0% 0% 0% 0% 0% 0% 0%Roofing NA 0% 0% 0% 0% 0% 0% 0% 0% 0%Contaminated NA 0% 0% 0% 0% 0% 0% 0% 0% 0%Stumps/Other Bulky Wood NA 0% 0% 0% 0% 0% 0% 0% 0% 0%Plywood NA 0% 0% 0% 0% 4.43% 0% 0% 0% 1.11%Particleboard/Fiberboard NA 0% 0% 0% 0% 0% 0% 0% 0% 0%Wood Products NA 0% 0% 0% 0% 0% 0% 0.22% 0.10% 0.08%Other Wood NA 0% 0% 0% 0% 0% 0% 0% 0% 0%Wood Subtotal NA 0.00% 0.38% 0.00% 0.13% 4.43% 0.00% 0.22% 0.10% 1.19%Ceramics, Porcelain, China NA 0% 0% 0% 0% 0% 0% 0% 0% 0%Rocks, Bricks NA 0% 0% 0% 0% 0% 0% 0% 0% 0%Concrete NA 0% 0% 0% 0% 0% 0% 0% 0% 0%Soil, Dirt, Fines NA 0% 0% 0% 0% 0% 0% 0% 0% 0%Gypsum Board NA 0% 0% 0% 0% 0% 0% 0% 0% 0%Fiberglass Insulation NA 0% 0% 0% 0% 0% 0% 0% 0% 0%Other Fiberglass NA 0% 0% 0% 0% 0% 0% 0% 0% 0%Roofing NA 0% 0% 0% 0% 0% 0% 0% 0% 0%Asphalt NA 0% 0% 0% 0% 0% 0% 0% 0% 0%Other C&D NA 0% 0% 0% 0% 0% 0% 0% 0% 0%C&D Subtotal NA 0.00% 0.00% 0.00% 0.00% 0% 0% 0% 0% 0%TOTAL NA 100.0% 100.0% 100.0% 100.0% 100.0% 100.0% 100.0% 100.0% 100.0%
GLASS
OTHER WASTES
WOOD
C&D
PAPER
PLASTIC
METAL
HHW and SPECIAL
ORGANICS
Table B - 1QUARTERLY DATA AND ANNUAL AVERAGES FOR COUNTY BUILDINGS
Family Justice Center Public Health
Thurston County Waste Composition Study B-2 Appendix B: Composition Data for County Buildings

Table B - 1QUARTERLY DATA AND ANNUAL AVERAGES FOR COUNTY BUILDINGS, PAGE TWO
Bldg. E,October January May August Average October
Newspaper 2.21% 0.18% 1.27% 1.27% 1.23% 0%Cardboard 0.40% 3.33% 1.88% 6.13% 2.93% 0%Mixed Waste Paper 11.27% 5.04% 2.96% 6.99% 6.57% 15.28%Phone Books 0% 0% 0% 0% 0% 0%Milk Cartons, Other 0.25% 1.24% 2.36% 0.48% 1.08% 0%Compostable 16.06% 7.79% 15.82% 14.32% 13.50% 23.25%Non-Recyclable Paper 3.67% 1.43% 1.82% 5.26% 3.04% 11.29%Paper Subtotal 33.87% 19.00% 26.11% 34.45% 28.36% 49.82%PET Bottles 2.67% 0.67% 2.22% 1.40% 1.74% 0.33%HDPE Bottles 0.70% 0.88% 0.67% 1.03% 0.82% 0%Bottles 3-7 0% 0% 0% 0.12% 0.03% 0.17%Tubs 0.38% 0.48% 0.34% 0.48% 0.42% 0%Carryout Bags 0.15% 0% 0.13% 0.10% 0.10% 0.17%Bags and Film 8.30% 8.32% 4.78% 8.10% 7.38% 9.96%Plastic Packaging 0.96% 0.19% 0.20% 1.88% 0.81% 1.00%Other Plastic Products 2.52% 4.30% 1.10% 3.04% 2.74% 1.16%Expanded Polystyrene 0.25% 1.95% 1.08% 1.35% 1.16% 0.43%Plastic Subtotal 15.93% 16.78% 10.52% 17.50% 15.18% 13.22%Aluminum Cans 0.19% 0.06% 0.34% 0.42% 0.25% 0.43%Aluminum Foil 0.07% 0.48% 0.09% 0.24% 0.22% 0.43%Tin Cans 0.25% 0.54% 0.42% 0.12% 0.33% 0%Mixed Metals 0.50% 0% 0% 0.24% 0.19% 0%Ferrous Metals 0% 0% 0% 0.24% 0.06% 0.43%White Goods 0% 0% 0% 0% 0% 0%Non-Ferrous Metals 0.07% 0% 0% 0% 0.02% 0.43%Aerosol Cans 0.07% 0.18% 0% 0.12% 0.09% 0%Metal Subtotal 1.14% 1.25% 0.85% 1.39% 1.16% 1.73%Latex Paint 0% 0% 0% 0% 0% 0%Oil-Based Paint 0% 0% 0% 0% 0% 0%Solvents 0% 0% 0% 0% 0% 0%Adhesives, Glues 0% 0% 0% 0% 0% 0%Cleaners, Corrosives 0% 0% 0% 0% 0% 0%Medical Wastes 0% 0% 0% 0% 0% 0%Motor Oil, Other 0% 0% 0% 0% 0% 0%Oil Filters 0% 0% 0% 0% 0% 0%Gasoline, Fuel Oi 0% 0% 0% 0% 0% 0%Antifreeze 0% 0% 0% 0% 0% 0%Other Auto Maintenance 0% 0% 0% 0% 0% 0%Batteries, Car 0% 0% 0% 0% 0% 0%Household Batteries 0.03% 0% 0.03% 0% 0.01% 0%Animal Excrement 0% 0% 0% 3.52% 0.88% 0%Animal Carcasses 0% 0% 0% 0% 0% 0%Gas Cylinders 0% 0% 0% 0% 0% 0%Pesticides, Herbicides 0% 0% 0% 0% 0% 0%Fertilizer with Pesticides 0% 0% 0% 0% 0% 0%Fertilizer w/o Pesticides 0% 0% 0% 0% 0% 0%Other Hazardous Wsates 0% 0% 0% 1.45% 0.36% 0%Actual Hazardous Wastes 0% 0% 0% 1.45% 0.36% 0%Special Waste Subtotal 0.03% 0% 0.03% 4.97% 1.26% 0%Food Waste 16.37% 53.51% 31.86% 21.44% 30.80% 25.91%Yard Debris 0.07% 0% 14.68% 0.06% 3.70% 0.43%Organics Subtotal 16.44% 53.51% 46.54% 21.50% 34.50% 26.34%Clear Bottles 0% 0.48% 0.67% 0.48% 0.41% 0%Brown Bottles 0% 0% 0% 0% 0% 0%Green Bottles 0% 0% 0% 0% 0% 0%Light Bulbs 0% 0% 0% 0.06% 0.02% 0%Non-Recyclable Glass 0% 0% 0% 0% 0% 0%Glass Subtotal 0% 0.48% 0.67% 0.55% 0.42% 0%E-Waste 0% 0% 0% 0% 0% 0%Other Electronics 0.50% 0% 0% 0% 0.13% 0%Tires 0% 0% 0% 0% 0% 0%Rubber 1.45% 1.25% 3.87% 0.42% 1.75% 1.26%Cosmetics 1.83% 0.48% 3.03% 0.12% 1.36% 0%Pharmaceuticals 0.07% 0% 0% 0.96% 0.26% 0%Diapers 0.05% 0.18% 0.17% 0.39% 0.20% 0.66%Textiles 17.20% 1.14% 2.02% 1.64% 5.50% 0.33%Carpet 0% 0% 0% 0% 0% 0%Carpet Padding 0% 0% 0% 0% 0% 0%Furniture 0% 0% 0% 0% 0% 0%Mattresses 0% 0% 0% 0% 0% 0%Ash, Dust 0% 0% 0% 0% 0% 0%Miscellaneous Organics 0% 0% 0% 0% 0% 0%Miscellaneous Inorganics 0% 0% 0% 0% 0% 0%Residuals 11.43% 5.94% 6.19% 15.58% 9.78% 6.64%Other Waste Subtotal 32.52% 8.99% 15.28% 19.11% 18.98% 8.90%Dimension Lumber 0% 0% 0% 0.53% 0.13% 0%Pallets/Crates 0% 0% 0% 0% 0% 0%Treated Wood 0% 0% 0% 0% 0% 0%Roofing 0% 0% 0% 0% 0% 0%Contaminated 0% 0% 0% 0% 0% 0%Stumps/Other Bulky 0% 0% 0% 0% 0% 0%Plywood 0% 0% 0% 0% 0% 0%Particleboard/Fiberboard 0% 0% 0% 0% 0% 0%Wood Products 0.07% 0% 0% 0% 0.02% 0%Other Wood 0% 0% 0% 0% 0% 0%Wood Subtotal 0.07% 0% 0% 0.53% 0.15% 0%Ceramics, Porcelain, China 0% 0% 0% 0% 0% 0%Rocks, Bricks 0% 0% 0% 0% 0% 0%Concrete 0% 0% 0% 0% 0% 0%Soil, Dirt, Fines 0% 0% 0% 0% 0% 0%Gypsum Board 0% 0% 0% 0% 0% 0%Fiberglass Insulation 0% 0% 0% 0% 0% 0%Other Fiberglass 0% 0% 0% 0% 0% 0%Roofing 0% 0% 0% 0% 0% 0%Asphalt 0% 0% 0% 0% 0% 0%Other C&D 0% 0% 0% 0% 0% 0%C&D Subtotal 0% 0% 0% 0% 0% 0%TOTAL 100.0% 100.0% 100.0% 100.0% 100.0% 100.0%
PAPER
PLASTIC
METAL
HHW and SPECIAL
ORGANICS
GLASS
OTHER WASTES
WOOD
C&D
County Courthouse
Thurston County Waste Composition Study B-3 Appendix B: Composition Data for County Buildings

Thurston County Waste Composition Study B-4 Appendix B: Composition Data for County Buildings

A P P E N D I X C MIXED ORGANICS RESULTS


COMPOSIT ION OF THE MIXED ORGANICS IN THURSTON COUNTY DECEMBER 2014
GREEN SOLUTIONS


COMPOSIT ION of the
MIXED ORGANICS in Thurston County
prepared for
Thurston County Solid Waste Olympia, Washington
360-867-2491 www.ThurstonSolidWaste.org
prepared by
Green Solutions, LLC South Prairie, Washington 98385
360-897-9533 [email protected]
D e c e m b e r 2 0 1 4

Composition of the Mixed Organics In Thurston County ii Table of Contents
T A B L E O F C O N T E N T S I. Introduction A. Scope and Objectives ........................................................... 1 B. Background ............................................................................. 1
II. Characterization Results for the Mixed Organics A. Introduction ............................................................................. 3 B. Overview of Procedures ........................................................ 3 C. Results, Waste Quantities ....................................................... 6 D. Results, Waste Composition ................................................... 8 E. Results, Weight of Materials Disposed .................................. 8
III. Conclusions and Recommendations A. Conclusions ............................................................................ 13 B. Recommendations ............................................................... 16
Glossary Appendices A. Statistical Certainty of Results LIST OF TABLES: 1. Allocation of Samples by Type of Source ........................... 6 2. Quarterly and Annual Quantities of Mixed Organics by Source ........................................................................... 7 3. Composition Results for Mixed Organics ............................. 9 4. Weight of Diverted Materials .............................................. 12 5. Diversion Rates for Organics ............................................... 13 LIST OF FIGURES: 1. Mixed Organics Composition Results .................................... 10 2. Composition Results for Mixed Organics .............................. 11 3. Diversion Rates for Organics .................................................. 14

Composition of the Mixed Organics In Thurston County 1 Introduction
S E C T I O N I I N T R O D U C T I O N
A . S C O P E A N D O B J E C T I V E S This report provides the results of a characterization study conducted on the mixed organics (food scraps and yard debris) collected in Thurston County in 2014. The primary objectives of this study were to provide:
Data on the composition of the residential and commercial mixed organics collected by the City of Olympia and Waste Connections.
Data on the amount of contamination present in the mixed organics streams.
Improved data on the quantities of the mixed organics streams.
This study was conducted by the environmental consulting firm of Green Solutions, with assistance from Waste Connections, Thurston County, and the City of Olympia. B . B A C K G R O U N D The solid waste collection and transfer system for Thurston County consists of one large transfer station, the Thurston County Waste and Recovery Center (WARC), and two satellite stations (or rural dropboxes). The two rural dropboxes are the Rainier Dropbox and Rochester Dropbox. WARC is owned by Thurston County and operated by Waste Connections. This facility includes:
A waste transfer operation, where waste is compacted into transfer trailers and exported out of the county to the Allied Waste landfill in Klickitat County, Washington.
A yard debris and mixed organics collection and transfer operation.
An extensive recycling drop-off center.
A moderate risk waste collection facility (the “HazoHouse”).
Special collection programs for electronic wastes, appliances and other materials. The waste collection system in Thurston County is operated by one municipal collector (the City of Olympia) and one private collection company (Waste Connections). The City of Olympia provides garbage collection, curbside recycling and mixed organics collection services to the homes and businesses within city limits, and Waste Connections provides the same services to the rest of Thurston County.

Composition of the Mixed Organics In Thurston County 2 Introduction
Most Thurston County residents and businesses have had access to mixed organics collection since 2008, and had yard waste collection service before that. Subscription to residential curbside and commercial mixed organics collection service is voluntary and is provided at an additional cost over other waste collection services. The list of acceptable materials for the mixed organics collection program in Thurston County includes:
yard debris, including leaves, grass clippings, and branches and logs up to 8” in diameter,
food scraps, all types, including meat and dairy products, compostable paper, including paper towels and napkins, paper plates, pizza
boxes, paper cups, waxed cups and waxed cardboard, shredded paper, clean lumber, including pallets and wooden boxes, and compostable plastic bags and some types of compostable plastic serviceware.
The mixed organics collected by the City of Olympia and Waste Connections are brought to a special area of WARC that is not open to the public. The mixed organics are dropped off at a location where berms of shredded materials have been placed to prevent any liquids from escaping. The mixed organics are generally covered shortly after being dropped off and are also processed soon thereafter so as to prevent birds and animals from having access to the materials. Processing typically consists of grinding and mixing with other woody or organic materials. Depending on the nature of the material, after processing it may be shipped to Silver Springs in Yelm, Royal Organics in eastern Washington, Lenz Enterprises in Stanwood, or shipped out as mulch or hog fuel. Self-haul customers at WARC are not allowed to drop off mixed organics, although the list of acceptable materials for the public yard waste drop-off area does include untreated lumber, plywood and particleboard.

Composition of the Mixed Organics In Thurston County 3 Characterization Results for the Mixed Organics
S E C T I O N I I C H A R A C T E R I Z A T I O N R E S U L T S F O R T H E M I X E D O R G A N I C S
A . I N T R O D U C T I O N This section provides waste quantity and composition results for the four sources of mixed organics collected in Thurston County. B . O V E R V I E W O F P R O C E D U R E S The analysis of mixed organics was added to an ongoing waste composition study for Thurston County. The waste composition study was being conducted on a quarterly basis to encompass seasonal variations in the waste stream, and one of the quarters had already been completed (in October 2013) when the mixed organics tests began. Hence, the mixed organics tests were conducted for the remaining three quarters (February, May and August, 2014). The waste composition study was conducted for six days each quarter (Monday through Saturday), and the mixed organics tests were conducted in the following week to take advantage of the existing setup, crew experience and other cost-effective measures. At the end of the waste sorting activities on each Saturday, the sorting crew simply moved the tent and other equipment to the mixed organics area (see Photo 1) and resumed work the following Monday. An important aspect of this approach is that a few samples of the mixed organics could be taken the week before the actual testing of this material began, which helped spread out the sampling effort and also helped to capture additional sources and types of loads. The sampling and other fieldwork for the mixed organics had to take into account the collection schedule for this material. At the time of this study, the City of Olympia only collected residential and commercial organics on Mondays. The other collector, Waste Connections, collected mixed organics from residential sources Monday through Friday and from commercial sources Monday through Thursday. The sampling and sorting procedures for the mixed organics were performed in a similar fashion to the procedures used for waste samples. Incoming vehicles carrying mixed organics were randomly selected, except in the case of the commercial organics. In the case of commercial organics, there were only one or two trucks per day carrying this type of waste and so those trucks were specifically targeted for sampling. In some cases, two samples were taken from these trucks, in order to have enough samples for this source. Sampling locations within the load were randomly chosen, and the samples were taken after the load was dropped off in the normal receiving area (see Photo 2). Each sample was sorted into 25 categories of materials. The Glossary provides additional detail on the definitions used for the sorting categories.

Composition of the Mixed Organics In Thurston County 4 Characterization Results for the Mixed Organics
Photo 1. Sorting setup for the mixed organics. Yard debris from the public drop-off area is shown in the background, and the mixed organics receiving area is to the right (not shown in the picture). Photo taken May 27, 2014.
Photo 2. Load of residential organics from northeastern Thurston County shown in foreground, with a commercial load behind it. Photo taken May 26, 2014.

Composition of the Mixed Organics In Thurston County 5 Characterization Results for the Mixed Organics
Sources of Mixed Organics The mixed organics collected in Thurston County are easily divided into four sources:
City Residential: organics collected by the City of Olympia from single-family homes in Olympia.
County Residential: organics collected by Waste Connections from single-family homes in the rest of Thurston County.
City Commercial: commercial organics collected by the City of Olympia.
County Commercial: commercial organics collected by Waste Connections.
These four sources are collected separately from each other due to the different service areas and routes used to collect from each. Residential mixed organics are typically collected from 35- to 95-gallons carts using side-loading or rear-loading garbage trucks. Commercial organics are collected using similar equipment (or rarely, using stationary compactors and roll-off trucks). Waste Quantity Procedures An important step for characterizing the mixed organics stream was to determine the amounts of mixed organics generated by the four sources. This data allows the annual averages for each source to be determined with the use of a weighted average that takes into account seasonal variations in quantity and composition. The quantity figures also allow a weighted average to be determined for the entire stream, by taking into account the relative quantities from each of the four sources. The quantities delivered by the City of Olympia (for the City Residential and City Commercial sources) were determined using scalehouse transaction records. This approach did not work as well for the quantities delivered by Waste Connections (for the County Residential and County Commercial sources) and so instead reports from Waste Connections were used for those sources. For the City of Olympia loads, a survey of incoming trucks helped to confirm that the transaction data from scalehouse records were correctly reporting the type of material (mixed organics versus other materials) and source (residential or commercial). The transaction data identified loads of mixed organics with the use of a code for “material type” that distinguished these loads from loads of other yard debris and waste materials. The appropriate code for the material type for each load was entered by the driver of the truck when arriving at the scalehouse at WARC. The survey data, along with truck numbers and the account names for Olympia (Olympia uses separate accounts for commercial, dropbox and residential trucks), was used to allocate the collection tonnages to residential and commercial sources for each quarter and annually. The quarterly figures were used to

Composition of the Mixed Organics In Thurston County 6 Characterization Results for the Mixed Organics
calculate weighted averages for each individual source, so that seasonal fluctuations in waste quantities could be taken into account when calculating the average composition for each source. The annual tonnages for all four sources were used to combine the composition data from each source to determine an annual weighted average for the County’s entire mixed organics stream. Number of Samples The composition of the mixed organics was determined by randomly selecting and sorting a total of 48 samples of waste. The target number of samples for the mixed organics was 24 samples each for the residential and commercial sources. This number of samples (24) was chosen based on experience from other studies that has shown that 20 to 30 samples are necessary to characterize a specific source with an acceptable degree of accuracy. The 24 samples were allocated to city and county sources based on the estimated amount of each (about one-third from the City of Olympia and two-thirds from the rest of Thurston County). The number of samples taken each season is shown in Table 1.
Table 1 ALLOCATION OF SAMPLES BY SOURCE
Source January 2014
May 2014
August 2014
Total Samples Number Percent
City Residential 3 3 3 9 19%
County Residential 5 5 5 15 31% Residential Subtotal 8 8 8 24 50%
City Commercial 3 3 3 9 19%
County Commercial 5 4 6 15 31% Commercial Subtotal 8 7 9 24 50%
Totals 16 15 17 48 100%
C . R E S U L T S , W A S T E Q U A N T I T I E S Total Waste Quantities Table 2 shows the results of the waste quantity analysis. As can be seen in Table 2, there are significant seasonal variations in the amount of residential organics, whereas the commercial organics are relatively stable.

Composition of the Mixed Organics In Thurston County 7 Characterization Results for the Mixed Organics
Table 2 QUARTERLY AND ANNUAL QUANTITIES OF MIXED ORGANICS BY SOURCE
Quarterly Amounts Annual
Amounts, Tons Percentage of Annual Total Source
October, 2013
February, 2014
May, 2014
August, 2014
City Residential 303.1 111.7 292.3 144.9 5,279 27.2% County Residential 513.3 160.5 732.1 583.3 12,853 66.3%
Residential Subtotal 816.4 272.2 1,024.4 728.2 18,132 93.5%
City Commercial 22.2 16.7 23.0 18.3 563 2.9% County Commercial 36.1 21.7 24.5 25.0 694 3.6%
Commercial Subtotal 58.3 38.4 47.5 43.3 1,257 6.5%
TOTALS 874.8 310.7 1,072.0 771.5 19,389 100.0%
Subtotal for Olympia 325.4 128.5 315.4 163.2 5,842 30.1%
Subtotal for Waste Connections 549.4 182.2 756.6 608.3 13,547 69.9%
Notes: The figures shown for the quarterly amounts are for a two-week period each quarter. The annual amounts are for the period from September 1, 2013 through August 31, 2014, as this period corresponds to the timing of the waste composition study.

Composition of the Mixed Organics In Thurston County 8 Characterization Results for the Mixed Organics
D . R E S U L T S , W A S T E C O M P O S I T I O N Table 3 shows the composition data for each source and for the mixed organics stream overall. The results shown are the weighted averages for each source and for the annual amount. As can be seen from the results, most of the material from residential sources is yard debris, with only relatively small amounts of food scraps, compostable paper and wood. Both of the commercial sources have much higher amounts of food scraps and compostable paper. The results are also illustrated in Figures 1 and 2. The results shown in Table 3 for the curbside recyclables category have been divided into compostable and non-compostable materials. This has been done to highlight the materials that would actually be a problem for the composting process. Although it would be better to recycle the cardboard and other types of recyclable paper where possible, these materials can also be composted without a problem (although a small amount of milk cartons and aseptic cartons may be included in the recyclable paper category and these would be a problem for the composting process). The recyclable plastics, glass and metals would be a problem for the composting process and should be considered a contaminant (along with the materials in the “non-compostable materials” category). The figures shown in Table 3 have a specific degree of error associated with them. As with all sampling and survey procedures, a certain degree of error is unavoidable but quantifiable (see Appendix A for more details on the statistical certainty of the results). E . R E S U L T S , W E I G H T O F M A T E R I A L S D I S P O S E D The quantity and composition results can be combined to show the total weight of the materials in the mixed organics. Table 4 provides this information for the four sources, for the residential and commercial subtotals, and for the overall mixed organics stream.

Edible Food 0.44% 0.37% 0.39% 17.1% 26.5% 22.3% 1.81%Inedible Food 2.43% 2.06% 2.17% 37.1% 47.8% 43.0% 4.82%Yard Debris 94.1% 92.3% 92.8% 14.3% 13.4% 13.8% 87.7%Untreated Wood 0.70% 1.28% 1.11% 0.19% 1.54% 0.93% 1.10%Organics Subtotal 97.7% 96.0% 96.5% 68.8% 89.2% 80.0% 95.4%
Waxed Cardboard 0% 0% 0% 1.98% 0.17% 0.98% 0.06%Pizza Boxes 0.21% 0.74% 0.59% 1.22% 0.09% 0.60% 0.59%Paper Serviceware 0% 1.03% 0.73% 0.22% 0.01% 0.10% 0.69%Shredded Paper 0.19% 0.01% 0.06% 0.03% 0.07% 0.05% 0.06%Other Compostable Paper 0.80% 0.67% 0.71% 12.6% 7.69% 9.88% 1.31%Compostable Paper Subtotal 1.20% 2.46% 2.09% 16.0% 8.03% 11.6% 2.71%
Approved Bags 0.02% 0.03% 0.03% 0.19% 1.05% 0.66% 0.07%Non-Approved Bags 0% 0% 0% 0% 0% 0% 0%Utensils 0% 0% 0% 0.01% 0% 0.004% 0.0003%Compostable Plastic Cups 0% 0% 0% 0.03% 0.01% 0.02% 0.001%Compostable Plastic Serviceware 0% 0% 0% 0% 0% 0% 0%Compostable Plastics Subtotal 0.02% 0.03% 0.03% 0.23% 1.06% 0.69% 0.07%
Compostable Recyclables: Cardboard 0.17% 0.35% 0.30% 8.65% 0.14% 3.96% 0.53% Recyclable Paper 0.36% 0.23% 0.26% 3.87% 0.40% 1.96% 0.37%Non-Compostable Recyclables: Recyclable Plastics 0% 0.01% 0.004% 0.07% 0.04% 0.05% 0.01%
Glass Bottles 0% 0% 0% 0.11% 0.04% 0.07% 0.005% Metals 0% 0.06% 0.04% 0.08% 0.06% 0.07% 0.04%Curbside Recyclables Subtotal 0.52% 0.64% 0.61% 12.8% 0.69% 6.11% 0.96%
Non-Compostable Paper 0.08% 0.14% 0.12% 1.22% 0.51% 0.83% 0.17%Non-Compostable Plastic Bags 0.05% 0.03% 0.04% 0.17% 0.13% 0.15% 0.05%Non-Compostable Plastics 0.02% 0.02% 0.02% 0.23% 0.15% 0.19% 0.03%Non-Bag Plastic Film 0.01% 0.01% 0.01% 0.25% 0.06% 0.15% 0.02%
Bags of Garbage 0% 0% 0% 0.05% 0.03% 0.04% 0.002%
Other 0.39% 0.69% 0.60% 0.28% 0.13% 0.20% 0.58%Non-Compostable Subtotal 0.55% 0.89% 0.80% 2.19% 1.02% 1.55% 0.84%
TOTALS 100.0% 100.0% 100.0% 100.0% 100.0% 100.0% 100.0%Subtotal, All Compostable Materials 99.45% 99.04% 99.16% 97.55% 98.84% 98.26% 99.10%Subtotal, All Non-Compostable Materials 0.55% 0.96% 0.84% 2.45% 1.16% 1.74% 0.90%
Pounds of Samples Sorted: 2,159 3,114 5,273 1,929 3,228 5,156 10,430Number of Samples Sorted: 9 15 24 9 15 24 48
Note: All figures are percent by weight (except for the bottom two rows).
Commercial Entire StreamResidentialN
ON
-C
OM
PO
STA
BLE
MA
TER
IALS
CU
RBS
IDE
REC
YC
LABL
ES
Residential CommercialResidential
SubtotalCityCity County
CO
MP
OST
ABL
E P
LAST
ICS
OR
GA
NIC
S
CommercialSubtotal
Average forCounty
CO
MP
OST
ABL
E P
AP
ER
Table 3COMPOSITION RESULTS FOR MIXED ORGANICS
Composition of the Mixed Organics in Thurston County 9 Characterization Results for the Mixed Organics

Compostable Paper, 2.71%, 525 tons Other Compostable Paper, 1.31%, 253 tons Paper Serviceware, 0.69%, 134 tons Pizza Boxes, 0.59%, 114 tons Waxed Cardboard, 0.06%, 12 tons Shredded Paper, 0.06%, 11 tons
Compostable Plastics, 0.07%, 14 tons Approved Bags, 0.07%, 14 tons Compostable Cups, 0.001%, 0.3 tons Plastic Utensils, 0.0003%, 0.05 tons
Compostable Curbside Recyclables, 0.90%, 175 tons
Cardboard, 0.53%, 103 tons Recyclable Paper, 0.37%, 72 tons
Organics, 95.4%, 18,499 tons Yard Debris, 87.7%, 17,001 tons Inedible Food, 4.82%, 934 tons Edible Food, 1.81%, 351 tons Untreated Wood, 1.10%, 214 tons
Figure 1 MIXED ORGANICS COMPOSITION RESULTS, COUNTYWIDE AVERAGE
Note: Figures are percent by weight or tons per year.
Non-Compostable Materials, 0.84%, 164 tons Other Non-Compostables, 0.58%, 112 tons Non-Compostable Paper, 0.17%, 33 tons Non-Compostable Plastic Bags, 0.05%, 9 tons Non-Compostable Plastics, 0.03%, 6 tons Non-Bag Plastic Film, 0.02%, 4 tons Bags of Garbage, 0.002%, 0.5 tons
Non-Compostable Curbside Recyclables, 0.06%, 11 tons
Metals, 0.04%, 9 tons Recyclable Plastics, 0.01%, 1 ton Glass Bottles, 0.005%, 1 ton

Composition of the Mixed Organics In Thurston County 11 Characterization Results for the Mixed Organics
Figure 2 COMPOSITION RESULTS FOR MIXED ORGANICS
0%
10%
20%
30%
40%
50%
60%
70%
80%
90%
100%
City Residential County Residential City Commercial County Commercial Average, All Mixed Organics
Non-Compostable Materials
Non-Compostable Recyclables
Compostable Recyclables
Compostable Plastics
Compostable Paper
Organics

Edible Food 23 47 71 96 184 280 351Inedible Food 128 265 393 209 332 541 934Yard Debris 4,969 11,858 16,827 81 93 174 17,001Untreated Wood 37 165 202 1 11 12 214Organics Subtotal 5,157 12,335 17,493 387 619 1,006 18,499
Waxed Cardboard 0 0 0 11 1 12 12Pizza Boxes 11 96 107 7 1 7 114Paper Serviceware 0 133 133 1 0 1 134Shredded Paper 10 1 11 0 0 1 11Other Compostable Paper 42 87 129 71 53 124 253Compostable Paper Subtotal 63 316 379 90 56 146 525
Approved Bags 1 4 5 1 7 8 14Non-Approved Bags 0 0 0 0 0 0 0Utensils 0 0 0 0.05 0 0.05 0.05Compostable Plastic Cups 0 0 0 0.2 0.1 0.3 0.3Compostable Plastic Serviceware 0 0 0 0 0 0 0Compostable Plastics Subtotal 1 4 5 1 7 9 14
Compostable Recyclables: Cardboard 9 45 54 49 1 50 103 Recyclable Paper 19 29 48 22 3 25 72Non-Compostable Recyclables: Recyclable Plastics 0 1 1 0.4 0.3 1 1
Glass Bottles 0 0 0 1 0 1 1 Metals 0 8 8 0.4 0.4 1 9Curbside Recyclables Subtotal 28 82 110 72 5 77 187
Non-Compostable Paper 4 18 22 7 4 10 33Non-Compostable Plastic Bags 3 4 7 1 1 2 9Non-Compostable Plastics 1 2 3 1 1 2 6Non-Bag Plastic Film 1 2 2 1 0 2 4
Bags of Garbage 0 0 0 0.3 0.2 0.5 0.5
Other 21 88 109 2 1 2 112Non-Compostable Subtotal 29 115 144 12 7 19 164
TOTALS 5,279 12,853 18,132 563 694 1,257 19,388Subtotal, All Compostable Materials 5,250 12,729 17,979 549 685 1,235 19,214Subtotal, All Non-Compostable Materials 29 124 153 14 8 22 175
Note: All figures are tons per year.
County Commercial
Table 4WEIGHT OF DIVERTED MATERIALS
City County Residential City
NO
N-
CO
MP
OST
ABL
E M
ATE
RIA
LSSubtotal Entire Stream
OR
GA
NIC
SC
OM
PO
STA
BLE
PA
PER
CO
MP
OST
ABL
E P
LAST
ICS
Residential Residential Subtotal Commercial Commercial
CU
RBS
IDE
REC
YC
LABL
ESAverage for
Composition of the Mixed Organics in Thurston County 12 Characterization Results for the Mixed Organics

Composition of the Mixed Organics In Thurston County 13 Conclusions and Recommendations
S E C T I O N I I I C O N C L U S I O N S A N D R E C O M M E N D A T I O N S
A . C O N C L U S I O N S Diversion Rates The data shown in Table 4 can be compared to data from the waste composition study to determine the diversion rates for specific materials. Table 5 shows the results for the materials that can be evaluated for diversion rates, and these results are also illustrated in Figure 3. As can be seen in Table 5 and Figure 3, the diversion rate for yard debris is relatively high, at 82.3%, while the diversion rates for food waste and compostable paper are only 4.6% and 8.0%, respectively. For a variety of reasons, not all of the materials measured in the mixed organics samples can be evaluated in this manner. The waste composition study did not use a detailed breakdown for compostable paper, for instance, so these materials must be treated as an aggregate amount. The waste composition study also did not measure the compostable plastic materials, although it should be noted that little or none of these were observed in the garbage samples. The calculation of diversion rates does not work well for the curbside recyclables and non-compostable materials, since only nominal amounts of these were found in the mixed organics. For the curbside recyclables and non-compostable materials, the idea of a diversion rate is not applicable since these
Table 5 DIVERSION RATES FOR ORGANICS
Type of Material Amount Diverted, TPY
Amount Disposed, TPY
Percent Diversion
Food Scraps
Edible Food 351 12,488 2.7% Inedible Food 934 14,343 6.1% All Food Scraps 1,284 26,831 4.6%
Yard Debris
In Mixed Organics 17,001 Other Yard Debris 6,251 All Yard Debris 23,252 5,000 82.3%
Compostable Paper 525 6,040 8.0%
Totals 25,060 37,870 39.8%

Composition of the Mixed Organics In Thurston County 14 Conclusions and Recommendations
Figure 3 DIVERSION RATES FOR ORGANICS
26,830 tons95.4%
1,284 tons 4.6%
5,000 tons 17.7%
23,252 tons 82.3%
6,040 tons 92.0%
525 tons 8.0%
0
5,000
10,000
15,000
20,000
25,000
30,000
Food Scraps Disposed
Food Scraps Diverted
Yard Debris Disposed
Yard Debris Diverted
Compostable Paper Disposed
Compostable Paper Diverted
To
ns
per
Yea
r

Composition of the Mixed Organics In Thurston County 15 Conclusions and Recommendations
materials are not supposed to be in the mixed organics. Finally, the evaluation of a diversion rate for yard debris is complicated by the fact that a substantial amount of yard debris is brought to WARC by self-haulers, and also by Waste Connections and the City of Olympia separately from the mixed organics loads. This yard debris contains small amounts of wood and other materials, but the yard debris was not tested and so no data is available on the precise amounts of these other materials. Hence, for the purpose of this analysis it is assumed that the material dropped off at WARC as source-separated yard debris is 100% yard debris. Waste Composition Conclusions A number of observations and conclusions can be drawn from the composition data: Food Scraps Diversion: despite the fact that food scraps have been allowed as part
of the yard waste program for several years now in most of Thurston County, the recovery rate for food scraps is less than 5%. Only 1,284 tons of food scraps were found in the mixed organics while 26,830 tons of food scraps are being disposed each year in the solid waste.
Edible Food: a significant amount of the food scraps found in the mixed organics
was “edible food.” For the residential streams, the amount of edible food was 15% of the total amount of food scraps, for non-residential generators this was 34% and the overall average was 27%. Based on the results of the waste composition study, 43% of the food waste in Thurston County’s waste stream is (or was) edible food. Altogether, 12,840 tons of edible food are being discarded annually in the mixed organics or in the solid waste stream in Thurston County. This amounts to 4.4 pounds per household per week of wasted food.
Cardboard and Recyclable Paper in the Mixed Organics: A significant amount of
cardboard and other types of recyclable paper are being placed into the mixed organics stream by County Residential and City Commercial participants. This is not a significant problem for the composting process, since the cardboard and most types of recyclable papers will break down in the composting process, and is still a better option than landfilling this material. Where possible, however, recycling of the cardboard and other recyclable papers would be a better use of these materials.
In addition, the two streams with the higher amounts of curbside recyclables also have higher amounts of non-compostable contaminants, suggesting that there is a link between the two factors or at least a need for more education for these two types of participants.
Contamination Level: The results of the composition tests show that the amount of
contaminants contained in the mixed organics is reasonably low. The category for

Composition of the Mixed Organics In Thurston County 16 Conclusions and Recommendations
“non-compostable materials” was less than 1% (0.84%) for the average results. Part of this amount was non-compostable and non-recyclable grades of paper, which included the wrong types of paper cups and other types of coated papers that could not be composted. The bulk of this category was “other,” which included a variety of waste materials that were accidentally included in the mixed organics, such as crayons, rubber gloves, plastic objects (“non-compostable plastics”), and treated or painted wood. The majority of these materials (115 tons out of 164 per year, or 70%) came from the County Residential source.
The other major source of contamination was the materials measured as “curbside recyclables.” These materials were also less than 1% (0.96%), and the bulk of this amount was cardboard and other recyclable paper that would not actually be detrimental to the composting process. The materials that could be a problem for composting (recyclable plastics, glass and metals) only amounted to 0.06%. Hence, the total amount of non-compostable materials found in the mixed organics was only 0.9%.
B . R E C O M M E N D A T I O N S The following recommendations are based on the results of this study: Most of the food scraps generated in Olympia and Thurston County are being
disposed as garbage, not diverted to composting, and more publicity and other steps should be considered to encourage residents and businesses to divert this material. The other steps that could be taken include approaches such as steeper rate incentives, mandatory measures, more commercial waste audits, and even diversion to mixed waste processing systems for select types of businesses (in other words, collecting and composting all of the waste from businesses such as restaurants).
Both residential and commercial participants should be encouraged to recycle
cardboard and other recyclable paper rather than placing it in the mixed organics collection system.
Although the total amount of contamination in the mixed organics was only 0.9%
(including both the “non-compostable materials” category and the non-compostable materials from the “curbside recyclables” category), public education will be needed on an ongoing basis to keep these contaminants to a minimum.

Composition of the Mixed Organics In Thurston County G-1 Glossary
G L O S S A R Y I N T R O D U C T I O N This glossary provides the definitions used for the sorting categories for the mixed organics. If there was any doubt about the identity of an item, plastic and paper materials were sorted into the corresponding non-compostable category. To the extent possible, Cedar Grove guidelines were used for the compostable paper and plastic categories. S O R T I N G C A T E G O R I E S Organics
Edible food: All food (such as vegetables, fruits, breads, meats, and pastas), that was edible or that appeared to have been edible when discarded. Foods with small blemishes were still considered edible, but scraps of food already removed from the edible portion (such as apple peels and the ends of romaine lettuce) were not counted here. A reasonable attempt was made to separate the food from any packaging, but if that was not possible then the item was placed in whichever category appeared to represent greater than 50% of the weight.
Inedible food: All other food scraps not included in the previous category, and including coffee filters and tea bags.
Yard debris: Leaves, grass clippings, sod, garden debris, brush, prunings, branches and logs less than 8” in diameter, soil, and small stones. Homegrown fruit along with the leaves and prunings from fruit trees were included in this category, as well as bouquets and houseplants.
Untreated wood: Dimensional lumber, pallets, crates, and natural wood over 8” in diameter. Compostable Paper
Waxed OCC: Waxed corrugated cardboard boxes.
Pizza boxes: Cardboard boxes without a plastic or foil liner that were used for delivering pizza. This included similar packaging for other products (such as breadsticks and chicken wings) from pizza shops.
Paper, wood, or fiber-based serviceware items: Bowls, plates, serving boats, wood corks and wooden utensils including chop sticks, coffee stirrers, and toothpicks that were either clearly labeled “compostable” or unlabeled but without a plastic lining or coating. Paper cups that were clearly labeled as compostable and waxed food serviceware items like parchment paper were included here.
Shredded paper: Bags of shredded paper, and loose amounts of shredded paper if recoverable.
Other compostable paper: Paper packaging and products not included above, and that did not contain a plastic coating. Examples included paper towels and napkins. Also included soiled newspapers and kraft bags that had been used to hold food scraps.

Composition of the Mixed Organics In Thurston County G-2 Glossary
Compostable Plastics
Compostable plastic bags, approved: Plastic bags that were made of materials such as corn starch or soy and that were designed to compostable at commercial composting facilities. Approved bags were BPI-labeled and were typically semi-translucent.
Compostable plastic bags, non-approved: Brown or green, compostable-looking bags. May have been unmarked or labeled “degradable.” These bags did not have the BPI label.
Compostable plastic utensils: Plastic utensils clearly labeled “compostable.”
Compostable plastic beverage cups: Plastic cups designed to be used for beverages or food and clearly labeled “compostable.”
Other compostable plastic food serviceware: Clamshells, meat trays, and salad trays clearly labeled “compostable.” Compostable Curbside Recyclables
Uncoated OCC: Corrugated cardboard boxes without a wax coating.
Recyclable paper: Other types of recyclable paper, including clean newspaper, mixed waste paper, office paper, magazines, catalogs, phone books, glossy junk mail, polycoated cartons (e.g., milk, juice), boxboard (e.g., cereal boxes), egg cartons, and aseptic containers. Non-Compostable Curbside Recyclables
Recyclable plastic: Plastic bottles, tubs, and buckets (5 gallons or smaller).
Recyclable glass: Glass bottles and jars.
Recyclable metal: Aluminum cans and foil, tin and steel food cans, empty dry metal paint cans and empty aerosol cans, and scrap metal. Non-Compostable Materials
Non-compostable paper: Non-recyclable, non-compostable paper, including papers coated with plastic. Examples include some types of fast food wrapping, foil-lined paper products, plastic-coated take-out containers, and plastic-coated plates and bowls. Most paper cups, plates and serving “boats” went in this category, unless marked as compostable or clearly not coated.
Non-compostable plastic bags: Plastic bags not made of materials that would compost or biodegrade, including trash bags, produce bags, and shopping bags.
Non-compostable plastic packaging and products: Plastic packaging and products that were not labeled as “compostable,” including utensils, clamshells, straws, salad trays, corks, food service items made of Styrofoam, cup lids and other plastic containers and products that did not fit into the recyclable plastic definition and were not clearly labeled “compostable.”
Non-bag plastic film: Plastic sheeting, food handling gloves, and other non-bag plastic film.
Bags of Garbage: Intact bags of garbage. Contents were confirmed as garbage, but not sorted.
Other materials: Any material that did not fit into the above categories, including textiles, grease, non-food service Styrofoam, pet waste (including kitty litter and animal bedding), stumps, large rocks, concrete, demolition debris, hazardous wastes (e.g., fluorescent light bulbs, paint, motor oil), and non-recyclable materials.

Composition of the Mixed Organics In Thurston County A-1 Appendix A: Statistical Certainty of Results
APPENDIX A S T A T I S T I C A L C E R T A I N T Y O F R E S U L T S
A . I N T R O D U C T I O N This appendix shows the confidence intervals associated with mixed organics composition results. B . M E T H O D O L O G Y For this type of study, statistical certainty can be expressed using confidence intervals. Confidence intervals are the range of values for which one can be confident (to a given degree, such as 90% confident) that the true value falls within. The confidence limits are sometimes shown as a “+ or – value,” such as “5% inedible food +/- 1%.” For this study, a confidence interval of 90% was used, so that in this example one could be 90% confident that the true value for inedible food falls between 4% and 6%. The calculation of confidence intervals for this study is complicated slightly by the use of weighted averages. The calculation of confidence intervals for weighted averages begins with calculating standard deviations for each material for each generator and for each season. The standard deviation is then converted to the standard error of the mean (SEM) by dividing the standard deviation by the square root of the number of samples. Once the SEM has been determined for each material, each season and each waste generator, it can be manipulated in the same way as the composition figures by using weighted averages as appropriate for the data being combined. The SEM’s are multiplied by a factor of 1.64 and then added or subtracted from the average composition values to derive the upper and lower confidence limits, respectively. The factor of 1.64 is determined by the choice of a 90% confidence interval. C . R E S U L T S Table A-1 shows the confidence limits associated with the composition results for each source and for the entire mixed organics stream.

Average LCL UCL Average LCL UCL Average LCL UCLEdible Food 0.44% 0.13% 0.75% 0.37% 0.18% 0.56% 17.08% 4.47% 29.70%
ORGANICS Inedible Food 2.43% 1.71% 3.15% 2.06% 0.81% 3.31% 37.15% 18.30% 55.99%Yard Debris 94.13% 92.75% 95.51% 92.26% 88.42% 96.10% 14.33% 0.00% 30.36%Untreated Wood 0.70% 0.00% 1.40% 1.28% 0.12% 2.45% 0.19% 0.03% 0.36%Organics Subtotal 97.70% 97.06% 98.34% 95.97% 93.40% 98.55% 68.76% 55.74% 81.78%Waxed Cardboard 0.00% 0.00% 0.00% 0.00% 0.00% 0.00% 1.98% 0.51% 3.46%
COMPOSTABLE Pizza Boxes 0.21% 0.13% 0.29% 0.74% 0.00% 1.64% 1.22% 0.00% 2.50% PAPER Paper Serviceware 0.00% 0.00% 0.00% 1.03% 0.00% 2.53% 0.22% 0.00% 0.43%
Shredded Paper 0.19% 0.00% 0.40% 0.01% 0.00% 0.01% 0.03% 0.00% 0.07%Other Compostable Paper 0.80% 0.44% 1.17% 0.67% 0.37% 0.97% 12.58% 6.76% 18.40%Compostable Paper Subtotal 1.20% 0.62% 1.79% 2.46% 0.02% 4.89% 16.03% 9.17% 22.89%Approved Bags 0.02% 0.01% 0.03% 0.03% 0.01% 0.05% 0.19% 0.04% 0.34%
COMPOSTABLE Non-Approved Bags 0.00% 0.00% 0.00% 0.00% 0.00% 0.00% 0.00% 0.00% 0.00% PLASTICS Utensils 0.00% 0.00% 0.00% 0.00% 0.00% 0.00% 0.01% 0.00% 0.02%
Compostable Plastic Cups 0.00% 0.00% 0.00% 0.00% 0.00% 0.00% 0.03% 0.00% 0.08%Plastic Serviceware 0.00% 0.00% 0.00% 0.00% 0.00% 0.00% 0.00% 0.00% 0.00%Compostable Plastic Subtotal 0.02% 0.01% 0.03% 0.03% 0.01% 0.05% 0.23% 0.05% 0.41%Cardboard 0.00% 0.00% 0.18% 0.00% 0.00% 0.37% 8.65% 2.08% 15.23%
CURBSIDE Recyclable Paper 0.36% 0.12% 0.59% 0.23% 0.10% 0.35% 3.87% 2.07% 5.67% RECYCLABLES Recyclable Plastics 0.00% 0.00% 0.00% 0.01% 0.00% 0.01% 0.07% 0.00% 0.15%
Glass Bottles 0.00% 0.00% 0.00% 0.00% 0.00% 0.00% 0.11% 0.00% 0.23%Metals 0.00% 0.00% 0.00% 0.06% 0.00% 0.15% 0.08% 0.02% 0.14%Curbside Recyclables Subtotal 0.52% 0.23% 0.82% 0.64% 0.15% 1.13% 12.78% 6.27% 19.30%Non-Compostable Paper 0.08% 0.00% 0.15% 0.14% 0.09% 0.20% 1.22% 0.58% 1.86%
NON-COMPOSTABLE Non-Compostable Plastic Bags 0.05% 0.00% 0.10% 0.03% 0.00% 0.07% 0.17% 0.00% 0.36% MATERIALS Non-Compostable Plastics 0.02% 0.00% 0.05% 0.02% 0.00% 0.04% 0.23% 0.07% 0.39%
Non-Bag Plastics 0.01% 0.00% 0.03% 0.01% 0.00% 0.03% 0.25% 0.00% 0.54%Bags of Garbage 0.00% 0.00% 0.00% 0.00% 0.00% 0.00% 0.05% 0.00% 0.11%Other 0.39% 0.18% 0.61% 0.69% 0.14% 1.24% 0.28% 0.05% 0.50%Non-Compostable Subtotal 0.55% 0.24% 0.86% 0.89% 0.33% 1.46% 2.19% 1.54% 2.84%
ALL COMPOSTABLE MATERIALS 99.45% 99.14% 99.76% 99.04% 98.47% 99.60% 97.55% 96.76% 98.34%
ALL NON-COMPOSTABLE MATERIALS 0.55% 0.24% 0.86% 0.96% 0.40% 1.53% 2.45% 1.66% 3.24%
Notes: LCL = Lower Confidence Limit for 90% confidence interval. UCL = Upper Confidence Limit for 90% confidence interval. All figures are percentages by weight.
Table A-1CONFIDENCE LIMITS BY SOURCE
City CommercialCounty ResidentialCity Residential
Composition of the Mixed Organics in Thurston County A-2 Appendix A: Statistical Certainty of Results
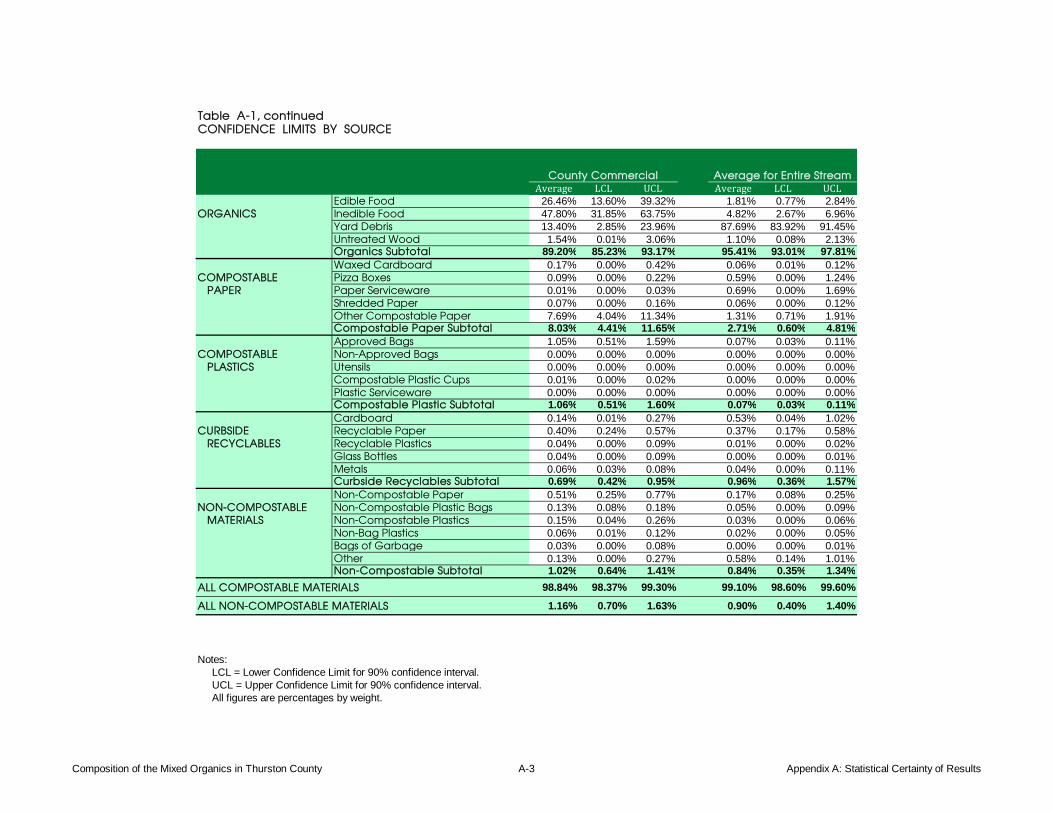
Table A-1, continuedCONFIDENCE LIMITS BY SOURCE
Average LCL UCL Average LCL UCLEdible Food 26.46% 13.60% 39.32% 1.81% 0.77% 2.84%
ORGANICS Inedible Food 47.80% 31.85% 63.75% 4.82% 2.67% 6.96%Yard Debris 13.40% 2.85% 23.96% 87.69% 83.92% 91.45%Untreated Wood 1.54% 0.01% 3.06% 1.10% 0.08% 2.13%Organics Subtotal 89.20% 85.23% 93.17% 95.41% 93.01% 97.81%Waxed Cardboard 0.17% 0.00% 0.42% 0.06% 0.01% 0.12%
COMPOSTABLE Pizza Boxes 0.09% 0.00% 0.22% 0.59% 0.00% 1.24% PAPER Paper Serviceware 0.01% 0.00% 0.03% 0.69% 0.00% 1.69%
Shredded Paper 0.07% 0.00% 0.16% 0.06% 0.00% 0.12%Other Compostable Paper 7.69% 4.04% 11.34% 1.31% 0.71% 1.91%Compostable Paper Subtotal 8.03% 4.41% 11.65% 2.71% 0.60% 4.81%Approved Bags 1.05% 0.51% 1.59% 0.07% 0.03% 0.11%
COMPOSTABLE Non-Approved Bags 0.00% 0.00% 0.00% 0.00% 0.00% 0.00% PLASTICS Utensils 0.00% 0.00% 0.00% 0.00% 0.00% 0.00%
Compostable Plastic Cups 0.01% 0.00% 0.02% 0.00% 0.00% 0.00%Plastic Serviceware 0.00% 0.00% 0.00% 0.00% 0.00% 0.00%Compostable Plastic Subtotal 1.06% 0.51% 1.60% 0.07% 0.03% 0.11%Cardboard 0.14% 0.01% 0.27% 0.53% 0.04% 1.02%
CURBSIDE Recyclable Paper 0.40% 0.24% 0.57% 0.37% 0.17% 0.58% RECYCLABLES Recyclable Plastics 0.04% 0.00% 0.09% 0.01% 0.00% 0.02%
Glass Bottles 0.04% 0.00% 0.09% 0.00% 0.00% 0.01%Metals 0.06% 0.03% 0.08% 0.04% 0.00% 0.11%Curbside Recyclables Subtotal 0.69% 0.42% 0.95% 0.96% 0.36% 1.57%Non-Compostable Paper 0.51% 0.25% 0.77% 0.17% 0.08% 0.25%
NON-COMPOSTABLE Non-Compostable Plastic Bags 0.13% 0.08% 0.18% 0.05% 0.00% 0.09% MATERIALS Non-Compostable Plastics 0.15% 0.04% 0.26% 0.03% 0.00% 0.06%
Non-Bag Plastics 0.06% 0.01% 0.12% 0.02% 0.00% 0.05%Bags of Garbage 0.03% 0.00% 0.08% 0.00% 0.00% 0.01%Other 0.13% 0.00% 0.27% 0.58% 0.14% 1.01%Non-Compostable Subtotal 1.02% 0.64% 1.41% 0.84% 0.35% 1.34%
ALL COMPOSTABLE MATERIALS 98.84% 98.37% 99.30% 99.10% 98.60% 99.60%
ALL NON-COMPOSTABLE MATERIALS 1.16% 0.70% 1.63% 0.90% 0.40% 1.40%
Notes: LCL = Lower Confidence Limit for 90% confidence interval. UCL = Upper Confidence Limit for 90% confidence interval. All figures are percentages by weight.
Average for Entire StreamCounty Commercial
Composition of the Mixed Organics in Thurston County A-3 Appendix A: Statistical Certainty of Results


A P P E N D I X D STAT IST ICAL CERTAINTY OF RESULTS


Thurston County Waste Composition Study D-1 Appendix D: Statistical Certainty of Results
APPENDIX D S T A T I S T I C A L C E R T A I N T Y O F R E S U L T S
A . I N T R O D U C T I O N This appendix shows the confidence intervals associated with the waste composition results. B . M E T H O D O L O G Y For this type of study, statistical certainty can be expressed using confidence intervals. Confidence intervals are the range of values for which one can be confident (to a given degree, such as 90% confident) that the true value falls within. The confidence limits are sometimes shown as a “+ or – value”, such as “5% newspaper +/- 1%.” For this study, a confidence interval of 90% was used, so that in this example one can be 90% confident that the true value for newspaper falls between 4% and 6%. The calculation of confidence intervals for this study is complicated slightly by the use of weighted averages. The calculation of confidence intervals for weighted averages begins with calculating standard deviations for each material for each generator and for each season. The standard deviation is then converted to the standard error of the mean (SEM) by dividing the standard deviation by the square root of the number of samples. Once the SEM has been determined for each material, each season and each waste generator, it can be manipulated in the same way as the composition figures by using weighted averages as appropriate for the data being combined. The final SEM’s are multiplied by a factor of 1.64 and then added or subtracted from the average composition values to derive the upper and lower confidence limits, respectively. The factor of 1.64 is determined by the choice of a 90% confidence interval. C . R E S U L T S Table D-1 shows the confidence limits associated with the composition results for each generator and for the entire County.

Average LCL UCL Average LCL UCL Average LCL UCLNewspaper 0.55% 0.00% 1.17% 0.03% 0.00% 0.06% 0.13% 0.04% 0.22%Cardboard 4.38% 0.85% 7.90% 4.73% 0.46% 9.00% 1.74% 0.81% 2.68%Mixed Waste Paper 4.30% 1.90% 6.71% 0.86% 0.11% 1.61% 4.35% 2.38% 6.32%Phone Books 0.06% 0.00% 0.14% 0.00% 0.00% 0.00% 0.00% 0.00% 0.00%Milk Cartons, Other 0.10% 0.01% 0.20% 0.01% 0.00% 0.02% 0.13% 0.02% 0.23%Compostable 1.47% 0.43% 2.51% 0.49% 0.00% 1.19% 1.30% 0.63% 1.97%Non-Recyclable Paper 1.02% 0.45% 1.59% 1.38% 0.00% 3.00% 2.40% 0.17% 4.63%Paper Subtotal 11.89% 6.02% 17.75% 7.49% 1.16% 13.81% 10.05% 5.22% 14.88%PET Bottles 0.83% 0.15% 1.51% 0.17% 0.03% 0.31% 0.61% 0.35% 0.87%HDPE Bottles 0.28% 0.10% 0.47% 0.03% 0.00% 0.06% 0.40% 0.18% 0.63%Bottles 3-7 0.10% 0.01% 0.20% 0.01% 0.00% 0.03% 0.04% 0.00% 0.10%Tubs 0.17% 0.04% 0.31% 0.07% 0.00% 0.16% 0.16% 0.08% 0.23%Carryout Bags 0.33% 0.09% 0.58% 0.04% 0.00% 0.08% 0.36% 0.16% 0.55%Bags and Film 2.25% 1.09% 3.41% 1.14% 0.40% 1.89% 2.63% 1.78% 3.48%Plastic Packaging 1.24% 0.61% 1.86% 0.27% 0.03% 0.51% 1.25% 0.59% 1.91%Other Plastic Products 3.33% 1.34% 5.31% 1.88% 0.00% 3.83% 4.39% 1.68% 7.10%Expanded Polystyrene 0.36% 0.06% 0.66% 2.25% 0.00% 5.53% 0.19% 0.07% 0.31%Plastic Subtotal 8.90% 5.33% 12.47% 5.85% 0.37% 11.33% 10.03% 6.36% 13.70%Aluminum Cans 0.37% 0.05% 0.69% 0.05% 0.00% 0.09% 0.35% 0.09% 0.61%Aluminum Foil 0.13% 0.02% 0.24% 0.04% 0.00% 0.09% 0.36% 0.00% 0.75%Tin Cans 0.64% 0.21% 1.08% 0.05% 0.00% 0.10% 0.55% 0.25% 0.84%Mixed Metals 4.87% 1.57% 8.17% 0.72% 0.05% 1.39% 7.53% 0.89% 14.16%Ferrous Metals 1.86% 0.00% 3.80% 1.11% 0.14% 2.08% 2.62% 0.22% 5.01%White Goods 0.00% 0.00% 0.00% 0.63% 0.00% 1.62% 0.65% 0.00% 1.58%Non-Ferrous Metals 0.31% 0.00% 0.64% 0.15% 0.00% 0.33% 0.07% 0.00% 0.16%Aerosol Cans 0.21% 0.07% 0.34% 0.05% 0.00% 0.12% 0.21% 0.02% 0.40%Metal Subtotal 8.39% 4.05% 12.74% 2.80% 0.43% 5.17% 12.34% 4.70% 19.97%Food Waste 11.07% 4.54% 17.60% 0.60% 0.00% 1.42% 7.71% 4.12% 11.30%Yard Debris 2.08% 0.00% 4.98% 1.06% 0.00% 2.36% 3.71% 0.00% 7.61%Organics Subtotal 13.15% 5.40% 20.90% 1.66% 0.00% 3.54% 11.43% 6.38% 16.47%Clear Bottles 2.37% 0.25% 4.48% 0.27% 0.00% 0.55% 1.02% 0.33% 1.72%Brown Bottles 3.44% 0.00% 7.65% 0.05% 0.00% 0.12% 1.37% 0.00% 3.03%Green Bottles 0.31% 0.00% 0.71% 0.05% 0.00% 0.11% 0.34% 0.01% 0.68%Light Bulbs 0.16% 0.00% 0.34% 0.02% 0.00% 0.04% 0.02% 0.00% 0.04%Non-Recyclable Glass 1.52% 0.00% 3.36% 4.53% 0.00% 9.57% 0.15% 0.02% 0.28%Glass Subtotal 7.79% 2.50% 13.08% 4.91% 0.00% 10.20% 2.91% 0.40% 5.42%E-Waste 0.00% 0.00% 0.00% 0.00% 0.00% 0.00% 0.00% 0.00% 0.00%Other Electronics 0.23% 0.00% 0.51% 0.00% 0.00% 0.00% 0.21% 0.00% 0.50%Tires 0.11% 0.00% 0.28% 0.00% 0.00% 0.00% 4.88% 0.00% 11.64%Rubber 0.36% 0.00% 0.75% 0.56% 0.00% 1.43% 2.80% 0.00% 6.65%Cosmetics 0.33% 0.02% 0.64% 0.01% 0.00% 0.03% 0.11% 0.00% 0.23%Pharmaceuticals 0.07% 0.00% 0.17% 0.00% 0.00% 0.00% 0.01% 0.00% 0.02%Diapers 0.58% 0.00% 1.20% 0.08% 0.00% 0.21% 2.12% 0.23% 4.01%Textiles 4.39% 1.39% 7.38% 0.76% 0.00% 1.73% 3.87% 1.08% 6.66%Carpet 3.82% 0.00% 8.69% 6.27% 0.00% 15.85% 4.65% 1.17% 8.12%Carpet Padding 2.05% 0.00% 5.25% 0.69% 0.00% 1.78% 0.03% 0.00% 0.07%Furniture 6.03% 0.00% 13.78% 8.31% 0.00% 19.05% 0.33% 0.00% 0.80%Mattresses 1.68% 0.00% 4.19% 0.35% 0.00% 0.89% 2.78% 0.00% 6.72%Ash, Dust 1.19% 0.00% 2.84% 0.00% 0.00% 0.00% 1.78% 0.30% 3.27%Miscellaneous Organics 0.03% 0.00% 0.07% 0.00% 0.00% 0.00% 0.13% 0.00% 0.26%Misc. Inorganics 0.21% 0.00% 0.42% 0.07% 0.00% 0.18% 0.18% 0.05% 0.32%Residuals 3.01% 1.37% 4.66% 1.33% 0.00% 2.67% 4.83% 3.06% 6.60%Other Wastes Subtotal 24.09% 9.79% 38.39% 18.45% 3.25% 33.65% 28.71% 16.73% 40.70%Wood 18.10% 5.92% 30.29% 24.19% 9.28% 39.09% 14.40% 2.02% 26.78%Construction, Demo. 5.24% 0.00% 10.86% 34.49% 15.49% 53.48% 8.61% 4.04% 13.17%
SPECIAL Special Waste 2.44% 0.00% 5.22% 0.16% 0.00% 0.41% 1.53% 0.00% 3.10%
Notes: LCL = Lower Confidence Limit for 90% confidence interval. UCL = Upper Confidence Limit for 90% confidence interval. All figures are percentages by weight.
METAL
ORGANICS
GLASS
OTHER WASTES
WOOD and C&D
Table D-1CONFIDENCE LIMITS BY TYPE OF GENERATOR
PAPER
PLASTIC
Residential Self-Haul Non-Residential Self-Haul Rural Dropboxes
Thurston County Waste Composition Study D-2 Appendix D: Statistical Certainty of Results

Average LCL UCL Average LCL UCL Average LCL UCLNewspaper 0.39% 0.25% 0.53% 0.58% 0.30% 0.86% 1.28% 0.82% 1.73%Cardboard 1.62% 0.56% 2.68% 0.99% 0.45% 1.52% 2.38% 0.99% 3.77%Mixed Waste Paper 5.06% 3.43% 6.69% 4.25% 3.35% 5.15% 6.90% 5.12% 8.68%Phone Books 0.09% 0.00% 0.20% 0.10% 0.00% 0.25% 0.28% 0.00% 0.66%Milk Cartons, Other 0.33% 0.20% 0.47% 0.33% 0.25% 0.41% 0.42% 0.22% 0.63%Compostable 3.90% 2.97% 4.83% 4.36% 3.44% 5.27% 3.71% 2.79% 4.64%Non-Recyclable Paper 1.87% 1.25% 2.48% 2.20% 1.75% 2.65% 3.11% 1.25% 4.97%Paper Subtotal 13.27% 10.51% 16.03% 12.81% 11.01% 14.61% 18.08% 16.41% 19.76%PET Bottles 0.90% 0.54% 1.25% 0.72% 0.58% 0.85% 2.04% 1.60% 2.48%HDPE Bottles 0.48% 0.26% 0.70% 0.36% 0.25% 0.46% 0.93% 0.55% 1.31%Bottles 3-7 0.06% 0.01% 0.10% 0.06% 0.01% 0.11% 0.13% 0.01% 0.24%Tubs 0.42% 0.35% 0.49% 0.57% 0.41% 0.73% 0.35% 0.20% 0.50%Carryout Bags 0.72% 0.54% 0.91% 0.86% 0.70% 1.02% 0.92% 0.64% 1.21%Bags and Film 4.94% 4.32% 5.56% 6.11% 5.52% 6.70% 4.09% 3.29% 4.90%Plastic Packaging 1.62% 1.27% 1.98% 2.00% 1.60% 2.40% 1.76% 1.44% 2.08%Other Plastic Products 2.18% 1.16% 3.20% 2.49% 1.30% 3.67% 1.22% 0.37% 2.06%Expanded Polystyrene 0.60% 0.39% 0.82% 0.47% 0.33% 0.60% 0.99% 0.41% 1.56%Plastic Subtotal 11.92% 10.10% 13.75% 13.63% 12.37% 14.89% 12.43% 10.35% 14.51%Aluminum Cans 0.30% 0.17% 0.42% 0.26% 0.16% 0.36% 1.21% 0.55% 1.86%Aluminum Foil 0.22% 0.12% 0.33% 0.28% 0.19% 0.37% 0.35% 0.18% 0.51%Tin Cans 1.02% 0.73% 1.32% 0.86% 0.58% 1.14% 1.23% 1.00% 1.46%Mixed Metals 1.21% 0.34% 2.08% 2.26% 0.55% 3.96% 1.14% 0.36% 1.92%Ferrous Metals 0.57% 0.00% 1.25% 0.81% 0.00% 1.74% 0.15% 0.02% 0.28%White Goods 0.00% 0.00% 0.00% 0.00% 0.00% 0.00% 0.00% 0.00% 0.00%Non-Ferrous Metals 0.17% 0.00% 0.40% 0.10% 0.00% 0.22% 0.08% 0.00% 0.19%Aerosol Cans 0.21% 0.07% 0.35% 0.24% 0.13% 0.35% 0.24% 0.11% 0.36%Metal Subtotal 3.71% 2.53% 4.89% 4.81% 3.23% 6.40% 4.40% 2.94% 5.86%Food Waste 22.49% 18.55% 26.42% 25.83% 22.23% 29.44% 23.81% 17.94% 29.69%Yard Debris 7.94% 2.52% 13.35% 2.86% 0.67% 5.06% 3.07% 0.00% 7.31%Organics Subtotal 30.42% 23.66% 37.19% 28.70% 24.19% 33.20% 26.89% 18.87% 34.91%Clear Bottles 1.71% 1.15% 2.26% 1.15% 0.71% 1.60% 3.90% 2.60% 5.20%Brown Bottles 1.25% 0.48% 2.03% 1.05% 0.51% 1.59% 1.98% 0.81% 3.16%Green Bottles 0.55% 0.09% 1.01% 0.37% 0.02% 0.72% 1.11% 0.28% 1.94%Light Bulbs 0.05% 0.03% 0.07% 0.06% 0.03% 0.10% 0.02% 0.00% 0.04%Non-Recyclable Glass 0.19% 0.04% 0.35% 0.30% 0.10% 0.50% 0.07% 0.00% 0.17%Glass Subtotal 3.75% 2.46% 5.03% 2.94% 1.99% 3.89% 7.08% 4.55% 9.61%E-Waste 0.00% 0.00% 0.00% 0.00% 0.00% 0.00% 0.00% 0.00% 0.00%Other Electronics 0.09% 0.00% 0.19% 0.10% 0.00% 0.23% 0.09% 0.01% 0.16%Tires 0.03% 0.00% 0.07% 0.00% 0.00% 0.00% 0.00% 0.00% 0.00%Rubber 0.64% 0.00% 1.42% 0.35% 0.02% 0.68% 0.14% 0.00% 0.27%Cosmetics 0.34% 0.07% 0.60% 0.30% 0.12% 0.47% 0.31% 0.08% 0.54%Pharmaceuticals 0.11% 0.00% 0.26% 0.07% 0.00% 0.14% 0.02% 0.02% 0.03%Diapers 4.83% 2.86% 6.81% 5.92% 2.50% 9.35% 6.07% 3.00% 9.14%Textiles 4.68% 2.85% 6.50% 5.31% 3.78% 6.83% 4.37% 2.00% 6.74%Carpet 0.43% 0.00% 1.05% 0.29% 0.00% 0.69% 0.61% 0.00% 1.59%Carpet Padding 0.00% 0.00% 0.00% 0.11% 0.00% 0.21% 1.86% 0.00% 5.23%Furniture 0.65% 0.00% 1.60% 0.00% 0.00% 0.00% 1.00% 0.00% 2.81%Mattresses 0.00% 0.00% 0.00% 0.00% 0.00% 0.00% 0.00% 0.00% 0.00%Ash, Dust 0.20% 0.02% 0.38% 0.16% 0.02% 0.31% 0.27% 0.03% 0.51%Miscellaneous Organics 0.03% 0.00% 0.06% 0.15% 0.00% 0.32% 0.00% 0.00% 0.00%Misc. Inorganics 0.25% 0.06% 0.43% 0.43% 0.12% 0.74% 0.17% 0.00% 0.36%Residuals 13.12% 10.40% 15.84% 12.99% 11.05% 14.92% 9.62% 7.20% 12.05%Other Wastes Subtotal 25.39% 21.77% 29.02% 26.17% 22.91% 29.43% 24.52% 18.67% 30.36%Wood 2.58% 0.16% 5.00% 2.18% 0.50% 3.86% 1.49% 0.75% 2.23%Construction, Demo. 1.34% 0.36% 2.33% 1.04% 0.09% 1.99% 0.28% 0.00% 0.71%
SPECIAL Special Waste 7.62% 3.20% 12.03% 7.72% 3.56% 11.87% 4.83% 1.05% 8.62%
Notes: LCL = Lower Confidence Limit for 90% confidence interval. UCL = Upper Confidence Limit for 90% confidence interval. All figures are percentages by weight.
METAL
ORGANICS
GLASS
OTHER WASTES
WOOD and C&D
PAPER
PLASTIC
Single-Family, Olympia Multi-Family, CountySingle-Family, County
Table D-1, continuedCONFIDENCE LIMITS BY TYPE OF GENERATOR
Thurston County Waste Composition Study D-3 Appendix D: Statistical Certainty of Results

Average LCL UCL Average LCL UCL Average LCL UCLNewspaper 0.72% 0.46% 0.98% 0.39% 0.10% 0.67% 0.92% 0.00% 1.90%Cardboard 2.99% 1.94% 4.04% 3.88% 1.94% 5.81% 4.73% 1.08% 8.37%Mixed Waste Paper 7.33% 6.00% 8.66% 7.22% 2.62% 11.83% 6.16% 3.82% 8.51%Phone Books 0.03% 0.00% 0.07% 0.05% 0.00% 0.12% 0.00% 0.00% 0.00%Milk Cartons, Other 0.27% 0.16% 0.37% 0.47% 0.09% 0.86% 0.22% 0.11% 0.33%Compostable 3.29% 2.35% 4.23% 5.53% 2.71% 8.35% 6.45% 3.45% 9.44%Non-Recyclable Paper 1.88% 1.27% 2.49% 3.72% 1.93% 5.51% 3.05% 1.51% 4.59%Paper Subtotal 16.51% 13.91% 19.11% 21.27% 13.83% 28.71% 21.53% 14.99% 28.06%PET Bottles 1.79% 1.36% 2.21% 0.90% 0.46% 1.33% 0.76% 0.48% 1.04%HDPE Bottles 0.89% 0.63% 1.14% 0.51% 0.25% 0.76% 0.71% 0.41% 1.01%Bottles 3-7 0.10% 0.06% 0.15% 0.06% 0.00% 0.11% 0.04% 0.00% 0.08%Tubs 0.37% 0.26% 0.47% 0.26% 0.10% 0.42% 0.25% 0.12% 0.38%Carryout Bags 0.94% 0.70% 1.18% 0.34% 0.15% 0.54% 0.30% 0.14% 0.47%Bags and Film 3.93% 3.23% 4.62% 6.03% 3.67% 8.39% 6.33% 4.28% 8.39%Plastic Packaging 1.65% 1.30% 2.01% 1.99% 1.06% 2.93% 2.66% 0.97% 4.35%Other Plastic Products 2.44% 1.20% 3.68% 2.74% 0.00% 5.56% 4.20% 1.99% 6.42%Expanded Polystyrene 0.48% 0.31% 0.64% 0.31% 0.10% 0.52% 0.48% 0.14% 0.83%Plastic Subtotal 12.58% 10.70% 14.46% 13.14% 8.94% 17.34% 15.74% 12.68% 18.80%Aluminum Cans 0.98% 0.56% 1.40% 0.40% 0.21% 0.60% 0.42% 0.21% 0.63%Aluminum Foil 0.19% 0.13% 0.26% 0.11% 0.04% 0.17% 0.12% 0.05% 0.20%Tin Cans 1.17% 0.82% 1.52% 0.51% 0.11% 0.91% 0.43% 0.12% 0.74%Mixed Metals 2.33% 1.07% 3.58% 1.50% 0.00% 3.00% 3.59% 0.00% 7.21%Ferrous Metals 0.30% 0.00% 0.61% 1.11% 0.04% 2.19% 0.80% 0.00% 1.77%White Goods 0.00% 0.00% 0.00% 0.00% 0.00% 0.00% 0.00% 0.00% 0.00%Non-Ferrous Metals 0.03% 0.00% 0.05% 0.43% 0.00% 1.06% 0.26% 0.00% 0.61%Aerosol Cans 0.24% 0.10% 0.38% 0.16% 0.01% 0.31% 0.16% 0.05% 0.28%Metal Subtotal 5.23% 3.85% 6.62% 4.22% 1.28% 7.17% 5.79% 2.05% 9.52%Food Waste 20.70% 16.75% 24.65% 19.64% 11.25% 28.02% 17.23% 9.80% 24.66%Yard Debris 1.04% 0.00% 2.17% 0.72% 0.00% 1.61% 1.89% 0.00% 4.06%Organics Subtotal 21.74% 17.43% 26.04% 20.36% 12.19% 28.52% 19.12% 11.64% 26.60%Clear Bottles 2.06% 1.26% 2.87% 0.74% 0.21% 1.26% 0.79% 0.15% 1.42%Brown Bottles 0.98% 0.40% 1.57% 0.44% 0.06% 0.82% 0.52% 0.00% 1.08%Green Bottles 0.53% 0.09% 0.97% 0.12% 0.00% 0.24% 0.25% 0.00% 0.55%Light Bulbs 0.03% 0.01% 0.05% 0.03% 0.00% 0.08% 0.02% 0.00% 0.04%Non-Recyclable Glass 0.50% 0.19% 0.80% 1.12% 0.00% 2.72% 2.32% 0.00% 5.59%Glass Subtotal 4.10% 2.60% 5.60% 2.45% 0.46% 4.45% 3.91% 0.07% 7.74%E-Waste 0.15% 0.00% 0.36% 0.00% 0.00% 0.00% 0.04% 0.00% 0.09%Other Electronics 0.09% 0.00% 0.19% 0.05% 0.00% 0.12% 0.35% 0.00% 0.83%Tires 0.71% 0.00% 1.71% 0.00% 0.00% 0.00% 0.00% 0.00% 0.00%Rubber 0.14% 0.06% 0.21% 0.45% 0.11% 0.79% 0.92% 0.20% 1.64%Cosmetics 0.54% 0.24% 0.83% 0.07% 0.00% 0.15% 0.18% 0.00% 0.39%Pharmaceuticals 0.11% 0.00% 0.23% 0.03% 0.00% 0.07% 0.02% 0.00% 0.03%Diapers 6.01% 3.89% 8.12% 2.81% 0.33% 5.28% 1.07% 0.00% 2.25%Textiles 7.55% 3.98% 11.12% 3.44% 0.15% 6.72% 2.16% 0.47% 3.85%Carpet 0.43% 0.00% 0.99% 7.17% 0.00% 15.97% 0.64% 0.00% 1.60%Carpet Padding 0.31% 0.00% 1.00% 2.01% 0.00% 4.83% 0.00% 0.00% 0.00%Furniture 0.00% 0.00% 0.00% 0.04% 0.00% 0.11% 2.61% 0.00% 6.36%Mattresses 1.16% 0.00% 2.80% 0.00% 0.00% 0.00% 0.00% 0.00% 0.00%Ash, Dust 0.12% 0.03% 0.22% 0.30% 0.00% 0.64% 0.74% 0.00% 1.69%Miscellaneous Organics 0.02% 0.00% 0.06% 0.06% 0.00% 0.15% 0.04% 0.00% 0.08%Misc. Inorganics 0.61% 0.09% 1.14% 0.28% 0.00% 0.60% 1.05% 0.00% 2.47%Residuals 9.01% 7.04% 10.98% 8.65% 5.59% 11.71% 9.57% 7.03% 12.11%Other Wastes Subtotal 26.95% 22.23% 31.67% 25.36% 14.89% 35.83% 19.37% 13.66% 25.09%Wood 5.36% 0.99% 9.73% 7.23% 0.16% 14.31% 8.51% 1.15% 15.88%Construction, Demo. 1.70% 0.61% 2.79% 5.31% 0.00% 11.64% 4.61% 0.48% 8.73%
SPECIAL Special Waste 5.83% 3.36% 8.30% 0.66% 0.00% 1.34% 1.42% 0.16% 2.69%
Notes: LCL = Lower Confidence Limit for 90% confidence interval. UCL = Upper Confidence Limit for 90% confidence interval. All figures are percentages by weight.
METAL
ORGANICS
GLASS
OTHER WASTES
WOOD and C&D
PAPER
PLASTIC
Multi-Family, Olympia Commercial, County Commercial, Olympia
Table D-1, continuedCONFIDENCE LIMITS BY TYPE OF GENERATOR
Thurston County Waste Composition Study D-4 Appendix D: Statistical Certainty of Results

Average LCL UCLNewspaper 0.46% 0.13% 0.80%Cardboard 3.31% 1.07% 5.56%Mixed Waste Paper 5.24% 2.76% 7.73%Phone Books 0.06% 0.00% 0.14%Milk Cartons, Other 0.29% 0.11% 0.47%Compostable 3.81% 2.18% 5.43%Non-Recyclable Paper 2.38% 1.18% 3.59%Paper Subtotal 15.56% 10.35% 20.76%PET Bottles 0.84% 0.46% 1.22%HDPE Bottles 0.45% 0.24% 0.66%Bottles 3-7 0.06% 0.01% 0.11%Tubs 0.28% 0.16% 0.40%Carryout Bags 0.46% 0.27% 0.64%Bags and Film 4.51% 3.17% 5.84%Plastic Packaging 1.63% 0.95% 2.30%Other Plastic Products 2.68% 0.77% 4.59%Expanded Polystyrene 0.67% 0.06% 1.27%Plastic Subtotal 11.57% 8.29% 14.85%Aluminum Cans 0.37% 0.17% 0.56%Aluminum Foil 0.16% 0.07% 0.25%Tin Cans 0.66% 0.34% 0.97%Mixed Metals 2.17% 0.38% 3.95%Ferrous Metals 1.01% 0.00% 2.05%White Goods 0.09% 0.00% 0.22%Non-Ferrous Metals 0.26% 0.00% 0.59%Aerosol Cans 0.18% 0.05% 0.31%Metal Subtotal 4.87% 2.23% 7.52%Food Waste 16.91% 11.38% 22.43%Yard Debris 3.15% 0.42% 5.88%Organics Subtotal 20.06% 13.42% 26.69%Clear Bottles 1.32% 0.56% 2.09%Brown Bottles 1.13% 0.08% 2.18%Green Bottles 0.32% 0.02% 0.62%Light Bulbs 0.05% 0.00% 0.10%Non-Recyclable Glass 1.35% 0.00% 3.00%Glass Subtotal 4.17% 1.37% 6.97%E-Waste 0.01% 0.00% 0.02%Other Electronics 0.12% 0.00% 0.26%Tires 0.15% 0.00% 0.35%Rubber 0.57% 0.00% 1.19%Cosmetics 0.21% 0.03% 0.39%Pharmaceuticals 0.05% 0.00% 0.12%Diapers 2.84% 1.11% 4.57%Textiles 3.67% 1.33% 6.01%Carpet 3.51% 0.00% 8.08%Carpet Padding 0.98% 0.00% 2.45%Furniture 2.26% 0.00% 5.26%Mattresses 0.36% 0.00% 0.89%Ash, Dust 0.42% 0.00% 0.93%Miscellaneous Organics 0.04% 0.00% 0.09%Misc. Inorganics 0.32% 0.00% 0.67%Residuals 8.40% 5.99% 10.81%Other Wastes Subtotal 23.92% 15.17% 32.68%Wood 9.32% 2.19% 16.45%Construction, Demo. 7.25% 1.72% 12.78%
SPECIAL Special Waste 3.28% 1.04% 5.52%
Notes: LCL = Lower Confidence Limit for 90% confidence interval. UCL = Upper Confidence Limit for 90% confidence interval. All figures are percentages by weight.
METAL
ORGANICS
GLASS
OTHER WASTES
WOOD and C&D
Average for Entire County
PAPER
PLASTIC
Table D-1, continuedCONFIDENCE LIMITS BY TYPE OF GENERATOR
Thurston County Waste Composition Study D-5 Appendix D: Statistical Certainty of Results