thursday 19 may 2016 – morning - physics & maths...
TRANSCRIPT

Thursday 19 May 2016 – MorningGCSE TWENTY FIRST CENTURY SCIENCECHEMISTRY A/SCIENCE A
A171/02 Modules C1 C2 C3 (Higher Tier)
H
INSTRUCTIONS TO CANDIDATES
• Write your name, centre number and candidate number in the boxes above. Please write clearly and in capital letters.
• Use black ink. HB pencil may be used for graphs and diagrams only.• Answer all the questions.• Read each question carefully. Make sure you know what you have to do before starting
your answer.• Write your answer to each question in the space provided. Additional paper may be
used if necessary but you must clearly show your candidate number, centre number and question number(s).
• Do not write in the bar codes.
INFORMATION FOR CANDIDATES
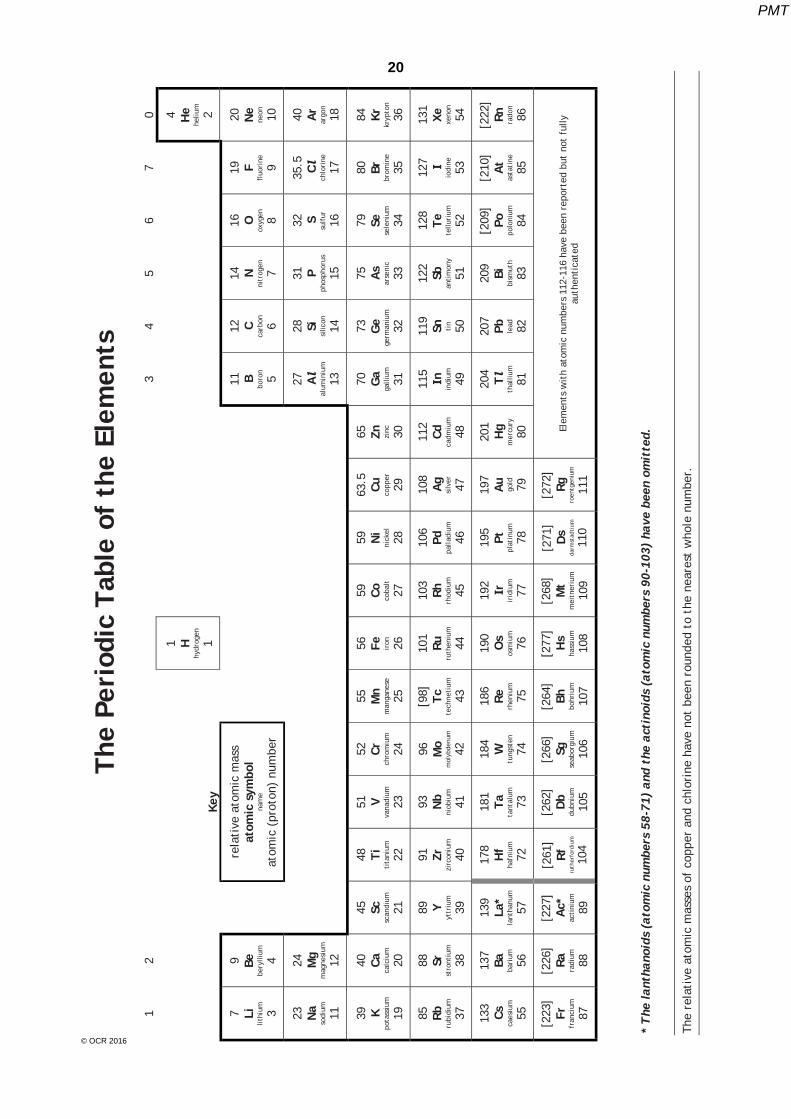
• The quality of written communication is assessed in questions marked with a pencil ().• The Periodic Table is printed on the back page.• The number of marks is given in brackets [ ] at the end of each question or part
question.• The total number of marks for this paper is 60.• This document consists of 20 pages. Any blank pages are indicated.
* A 1 7 1 0 2 *
OCR is an exempt CharityTurn over
© OCR 2016 [K/601/7548]DC (LK/CGW) 123204/4
Candidates answer on the Question Paper.A calculator may be used for this paper.
OCR supplied materials:None
Other materials required:• Pencil• Ruler (cm/mm)
Duration: 1 hour
*5
95
68
14
42
8*
Oxford Cambridge and RSA
PMT

2
© OCR 2016
Answer all the questions.
1 (a) Welding joins metals by heating them to high temperatures so that they melt.
Ethyne is a gas used in welding. It is burned in oxygen.
Suggest why ethyne is burned in oxygen rather than air.
.............................................................................................................................................. [1]
(b) This is a diagram of ethyne.
is a carbon atom
is a hydrogen atom
What type of compound is ethyne?
……………………………………. [1]
(c) Ethyne reacts with oxygen to make carbon dioxide and water. The boxes show the four types of molecule in this reaction.
2 molecules of ethyne react with 5 molecules of oxygen.
Complete the diagram to show the number of molecules of carbon dioxide and water made in this reaction.
moleculesof ethyne
moleculesof oxygen
molecules ofcarbon dioxide
moleculesof water++
[2]
[Total: 4]
PMT
3
Turn over© OCR 2016
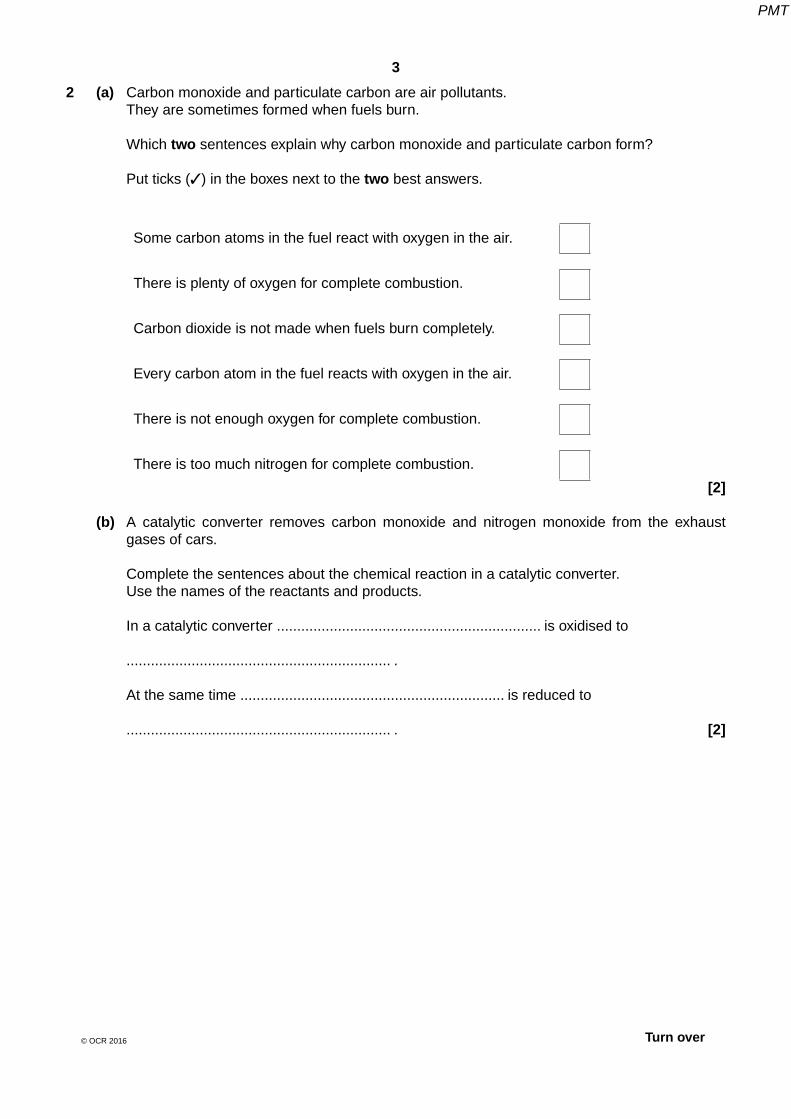
2 (a) Carbon monoxide and particulate carbon are air pollutants. They are sometimes formed when fuels burn.
Which two sentences explain why carbon monoxide and particulate carbon form?
Put ticks (✓) in the boxes next to the two best answers.
Some carbon atoms in the fuel react with oxygen in the air.
There is plenty of oxygen for complete combustion.
Carbon dioxide is not made when fuels burn completely.
Every carbon atom in the fuel reacts with oxygen in the air.
There is not enough oxygen for complete combustion.
There is too much nitrogen for complete combustion.
[2]
(b) A catalytic converter removes carbon monoxide and nitrogen monoxide from the exhaust gases of cars.
Complete the sentences about the chemical reaction in a catalytic converter. Use the names of the reactants and products.
In a catalytic converter ................................................................. is oxidised to
................................................................. .
At the same time ................................................................. is reduced to
................................................................. . [2]
PMT

4
© OCR 2016
(c) Diesel cars may be banned in some large cities. Here is some data on the exhaust gases of petrol and diesel cars. The cars are the same except for the fuel they use.
Pollutant (grams per km travelled) Fuel used (litres per 100 km)Carbon
monoxideCarbon
particulatesNitrogen
monoxide
Petrol car 12.0 none 6.0 5.5
Diesel car 0.5 0.5 9.0 4.5
Use your knowledge of these pollutants to discuss the advantages and disadvantages of diesel cars over petrol cars. Suggest reasons why diesel cars may be banned from large cities.
The quality of written communication will be assessed in your answer.
...................................................................................................................................................
...................................................................................................................................................
...................................................................................................................................................
...................................................................................................................................................
...................................................................................................................................................
...................................................................................................................................................
...................................................................................................................................................
...................................................................................................................................................
...................................................................................................................................................
.............................................................................................................................................. [6]
[Total: 10]
PMT

5
Turn over© OCR 2016
BLANK PAGE
PLEASE DO NOT WRITE ON THIS PAGE
Turn over for the next question
PMT

6
© OCR 2016
3 John looks at a graph that shows the amount of fossil fuels burned in the world from 1960 to 2010.
1960
12 000
11 000
10 000
9000
8000
×
×
×
××
×
7000
6000Fuel burned(millions of
tonnes) 5000
4000
3000
2000
1000
01970 1980 1990
Year
2000 2010 2020
(a) (i) Estimate the amount of fossil fuels that will be burned in 2020.
...................................... millions of tonnes [1]
(ii) John says that it is very difficult to estimate the amount of fossil fuel we will use in 100 years’ time.
Suggest reasons John could give to justify this statement.
...........................................................................................................................................
...........................................................................................................................................
...........................................................................................................................................
...........................................................................................................................................
...................................................................................................................................... [2]
PMT
7
Turn over© OCR 2016
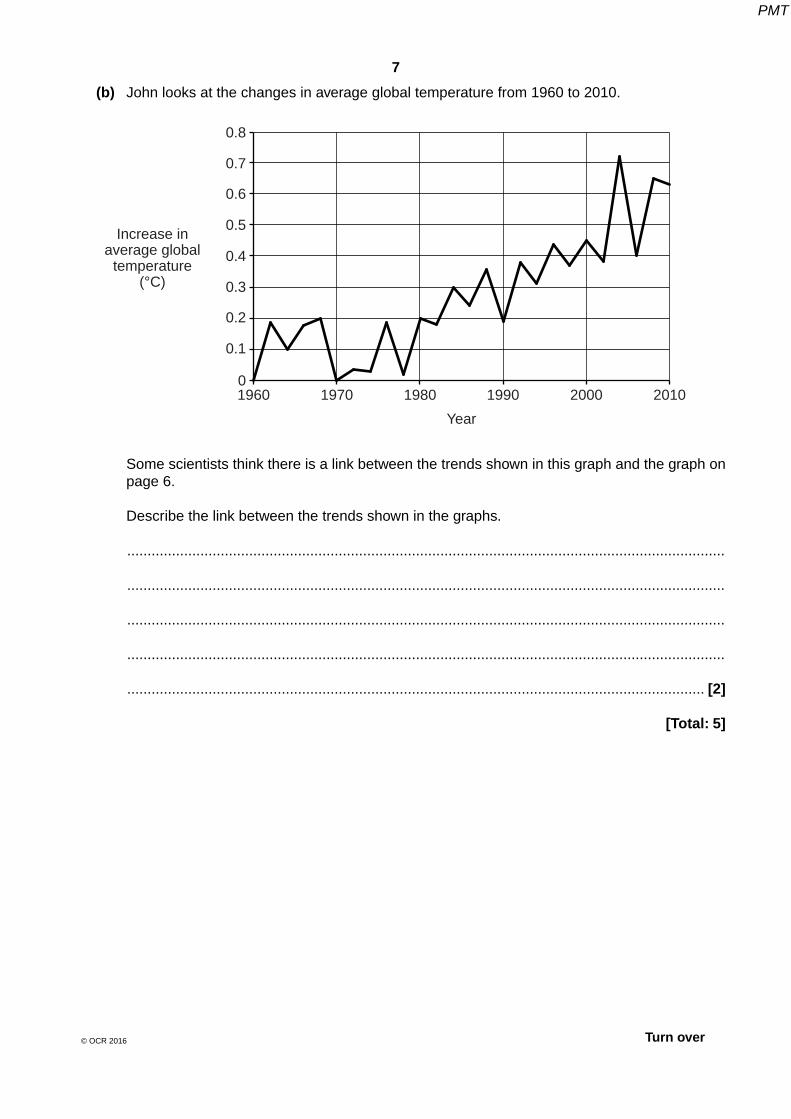
(b) John looks at the changes in average global temperature from 1960 to 2010.
0.8
0.7
0.6
0.5
0.4
Increase inaverage global
temperature(°C) 0.3
1960 1970 1980 1990
Year
2000 2010
0.2
0.1
0
Some scientists think there is a link between the trends shown in this graph and the graph on page 6.
Describe the link between the trends shown in the graphs.
...................................................................................................................................................
...................................................................................................................................................
...................................................................................................................................................
...................................................................................................................................................
.............................................................................................................................................. [2]
[Total: 5]
PMT

8
© OCR 2016
4 Some students investigate the stiffness of plastic rulers.
This is how three students plan their investigation.
ruler
mass
ruler
mass
I will hold the ruler at oneend and put a mass on theother end. I will measure howmuch it bends and get myfriend to repeat the test.
I will use rulers that are the samelength. I will hang the same mass tothe end of each ruler and measurethe distance it bends. I will do eachtest four times and work out themean.
I will measure how far I canbend the ruler before itbreaks. I will bend and breakthe rulers myself so that thetest is fair.
PMT

9
Turn over© OCR 2016
(a) Which plan is best? Explain why this plan is better than the other two plans.
The quality of written communication will be assessed in your answer.
...................................................................................................................................................
...................................................................................................................................................
...................................................................................................................................................
...................................................................................................................................................
...................................................................................................................................................
...................................................................................................................................................
...................................................................................................................................................
...................................................................................................................................................
...................................................................................................................................................
.............................................................................................................................................. [6]
PMT

10
© OCR 2016
(b) Some students investigate the stiffness of ruler A. Here are their measurements.
Test number 1 2 3 4 5
Bend (mm) 23 26 13 19 24
(i) These measurements include an outlier.
Which measurement is the outlier?
........................................................ [1]
(ii) What could the students do to decide whether or not to include the outlier when calculating the best estimate of the true value from their measurements?
...........................................................................................................................................
...........................................................................................................................................
...................................................................................................................................... [1]
(iii) Include the outlier and work out the best estimate of the true value of their measurements.
Show your working.
[2]
PMT

11
Turn over© OCR 2016
(iv) The students think a second ruler, B, is made from a different plastic. The students repeat the investigation with ruler B.
They write down the range and the best estimate of these measurements.
Range (mm) Best estimate (mm)
5 – 10 8
Do these results support the idea that ruler A and ruler B are made from different plastics?
Use the data to explain your answer.
...........................................................................................................................................
...........................................................................................................................................
...........................................................................................................................................
...........................................................................................................................................
...................................................................................................................................... [2]
[Total: 12]
PMT

12
© OCR 2016
5 Crude oil is separated into different fractions. Petrol and fuel oil are fractions from crude oil.
Here are the boiling ranges of these fractions.
Fraction Boiling range (°C)
Petrol 30 – 80
Fuel oil 300 – 340
How do the sizes of molecules in petrol and fuel oil differ? Explain why the boiling range for petrol is different from the boiling range of fuel oil.
..........................................................................................................................................................
..........................................................................................................................................................
..........................................................................................................................................................
..........................................................................................................................................................
..........................................................................................................................................................
..........................................................................................................................................................
..........................................................................................................................................................
..................................................................................................................................................... [4]
[Total: 4]
PMT

13
Turn over© OCR 2016
6 (a) The diagram shows part of a molecule of PVC.
(i) Name the missing element.
is a carbon atom
is a hydrogen atom
is a ................................... atom. [1] (ii) Seven monomer molecules have been joined together in this diagram.
Draw a diagram to show one monomer of PVC.
[1]
(b) (i) Plasticizers are small molecules. They are added to PVC to make it more flexible.
Explain how adding plasticizers makes PVC more flexible.
...........................................................................................................................................
...........................................................................................................................................
...........................................................................................................................................
...........................................................................................................................................
...........................................................................................................................................
...................................................................................................................................... [3]
PMT

14
© OCR 2016
(ii) In some parts of the world there is a ban on the use of plasticized PVC to wrap food.
Explain why some scientists think that plasticized PVC is not safe when it is in contact with food.
...........................................................................................................................................
...........................................................................................................................................
...........................................................................................................................................
...........................................................................................................................................
...................................................................................................................................... [2]
[Total: 7]
PMT
15
Turn over© OCR 2016
BLANK PAGE
PLEASE DO NOT WRITE ON THIS PAGE
Turn over for the next question
PMT

16
© OCR 2016
7 A company makes a standard trainer using plastics made from crude oil.
They make a new eco trainer from plant fibres and recycled car tyres.
soleeco trainer made from recycled car tyres
standard trainer made from plastic
upper and laceseco trainer made from plant fibres
standard trainer made from plastic
They expect a Life Cycle Assessment (LCA) to show that the eco trainers do less harm to the environment thanstandard trainers.
Here is data on the LCA of each trainer.
Eco trainers Standard trainers
Energy (MJ)
Greenhouse gases made
(kg CO2)
Energy (MJ)
Greenhouse gases made
(kg CO2)
Making materials for the trainers 1.6 0.1 6.0 4.2
Making the trainers from the materials 1.4 1.0 4.2 3.7
Disposing of the trainers 0.8 0.6 0.8 0.6
PMT

17
Turn over© OCR 2016
Suggest reasons why the company expected the LCA would show eco trainers do less harm to the environment than standard trainers. Does the data show the company was right? What additional information is needed to complete the LCA?
The quality of written communication will be assessed in your answer.
..........................................................................................................................................................
..........................................................................................................................................................
..........................................................................................................................................................
..........................................................................................................................................................
..........................................................................................................................................................
..........................................................................................................................................................
..........................................................................................................................................................
..........................................................................................................................................................
..........................................................................................................................................................
..................................................................................................................................................... [6]
[Total: 6]
PMT

18
© OCR 2016
8 (a) Salt is found underneath the ground in some parts of the UK. It can be mined using solution mining.
Here are some statements about solution mining of salt.
Not all of the statements are correct, and they are in the wrong order.
A Water dissolves the salt.
B Water is pumped into the ground.
C Water is evaporated from the solution.
D Salt crystals are made.
E Water dissolves salt and clay.
F The solution is distilled.
G Pressure pushes the solution up to ground level.
(i) Choose the correct steps and then fill in the boxes to show the correct order for solution mining of salt.
One has been done for you.
D
[3]
(ii) Salt is added to food to improve the taste and for one other reason. What is that other reason?
...................................................................................................................................... [1]
PMT

19
© OCR 2016
Oxford Cambridge and RSA
Copyright Information
OCR is committed to seeking permission to reproduce all third-party content that it uses in its assessment materials. OCR has attempted to identify and contact all copyright holders whose work is used in this paper. To avoid the issue of disclosure of answer-related information to candidates, all copyright acknowledgements are reproduced in the OCR Copyright Acknowledgements Booklet. This is produced for each series of examinations and is freely available to download from our public website (www.ocr.org.uk) after the live examination series.
If OCR has unwittingly failed to correctly acknowledge or clear any third-party content in this assessment material, OCR will be happy to correct its mistake at the earliest possible opportunity.
For queries or further information please contact the Copyright Team, First Floor, 9 Hills Road, Cambridge CB2 1GE.
OCR is part of the Cambridge Assessment Group; Cambridge Assessment is the brand name of University of Cambridge Local Examinations Syndicate (UCLES), which is itself a department of the University of Cambridge.
(b) (i) The electrolysis of brine makes chlorine and two other products.
Name the two other products.
1 ....................................................................
2 .................................................................... [2]
Methods for the production of chlorine by electrolysis of brine have changed over the past 50 years.
Look at this data about the production of chlorine during this time.
1965 1990 2015Chlorine made in the UK(tonnes / year) 0.25 × 10⁶ 0.75 × 10⁶
……………..Electricity used to make 1 tonne chlorine (MJ) 12 400
……………..9000
Total electricity used for electrolysis of brine (MJ) 3100 × 106 7500 × 106 14 400 × 106
Toxic liquids and solidsproduced small amounts trace none
(ii) Complete the table. [2]
(iii) Use the data in the table to discuss how the production of chlorine has changed over the past 50 years.
..........................................................................................................................................
..........................................................................................................................................
..........................................................................................................................................
..........................................................................................................................................
..........................................................................................................................................
..........................................................................................................................................
...................................................................................................................................... [4]
[Total: 12]
END OF QUESTION PAPER
PMT
20
© OCR 2016
The
Peri
odic
Tab
le o
f th
e El
emen
ts
* T
he la
ntha
noid
s (a
tom
ic n
umbe
rs 5
8-71
) an
d th
e ac
tino
ids
(ato
mic
num
bers
90-
103)
hav
e be
en o
mit
ted.
The
rela
tive
ato
mic
mas
ses
of c
oppe
r an
d ch
lori
ne h
ave
not
been
rou
nded
to
the
near
est
who
le n
umbe
r.
12
34
56
70
Key
1 Hhy
drog
en
1
4 He
heliu
m
2
7 Lilit
hium 3
9 Bebe
rylli
um
4
rela
tive
ato
mic
mas
sat
omic
sym
bol
nam
e
atom
ic (
prot
on)
num
ber
11 Bbo
ron
5
12 Cca
rbon 6
14 Nni
trog
en
7
16 Oox
ygen 8
19 Ffl
uori
ne
9
20 Ne
neon 10
23 Na
sodi
um
11
24 Mg
mag
nesi
um
12
27 Al
alum
iniu
m
13
28 Sisi
licon
14
31 Pph
osph
orus
15
32 Ssu
lfur
16
35.5 Cl
chlo
rine
17
40 Ar
argo
n
18
39 Kpo
tass
ium
19
40 Caca
lciu
m
20
45 Scsc
andi
um
21
48 Titi
tani
um
22
51 Vva
nadi
um
23
52 Crch
rom
ium
24
55 Mn
man
gane
se
25
56 Fe iron 26
59 Co coba
lt
27
59 Ni
nick
el
28
63.5
Cu copp
er
29
65 Zn zinc 30
70 Ga
galli
um
31
73 Ge
germ
aniu
m
32
75 As
arse
nic
33
79 Sese
leni
um
34
80 Brbr
omin
e
35
84 Krkr
ypto
n
36
85 Rbru
bidi
um
37
88 Srst
ront
ium
38
89 Yyt
triu
m
39
91 Zrzi
rcon
ium
40
93 Nb
niob
ium
41
96 Mo
mol
ybde
num
42
[98] Tc
tech
neti
um
43
101
Ruru
then
ium
44
103
Rhrh
odiu
m
45
106
Pdpa
lladi
um
46
108
Ag
silv
er
47
112
Cdca
dmiu
m
48
115In
indi
um
49
119
Sn tin 50
122
Sban
tim
ony
51
128
Tete
lluri
um
52
127 I
iodi
ne
53
131
Xe xeno
n
54
133
Csca
esiu
m
55
137
Baba
rium
56
139
La*
lant
hanu
m
57
178
Hf
hafn
ium
72
181
Tata
ntal
um
73
184
Wtu
ngst
en
74
186
Rerh
eniu
m
75
190
Os
osm
ium
76
192Ir
irid
ium
77
195
Ptpl
atin
um
78
197
Au
gold 79
201
Hg
mer
cury
80
204
Tlth
alliu
m
81
207
Pb lead 82
209
Bibi
smut
h
83
[209
]Po
polo
nium
84
[210
]A
tas
tati
ne
85
[222
]Rn rado
n
86
[223
]Fr
fran
cium
87
[226
]Ra
radi
um
88
[227
]A
c*ac
tini
um
89
[261
]Rf
ruth
erfo
rdiu
m
104
[262
]D
bdu
bniu
m
105
[266
]Sg
seab
orgi
um
106
[264
]Bh
bohr
ium
107
[277
]H
sha
ssiu
m
108
[268
]M
tm
eitn
eriu
m
109
[271
]D
sda
rmst
adti
um
110
[272
]Rg
roen
tgen
ium
111
Elem
ents
wit
h at
omic
num
bers
112
-116
hav
e be
en r
epor
ted
but
not
fully
auth
enti
cate
d
PMT