thursday, 14 january 2021 headlines
TRANSCRIPT
HEADLINES: 9,194 flights on 13 January - Traffic at 36% of 2019 7-day rolling average at -61.4% of 2019 Decrease in almost all States: -1,699 flights (-16%) compared to 2 weeks ago (30 Dec) Most aircraft operators decreased their capacity, notably Low Cost Carriers All top airports showed a decreased in traffic
Traffic Situation & Airlines Recovery Over the first 13 days of January, traffic is ‐61% compared to the same period in 2019, close to the scenario
published by EUROCONTROL in September 2020. However, it is expected to decrease due to the renewed lockdown across many European countries.
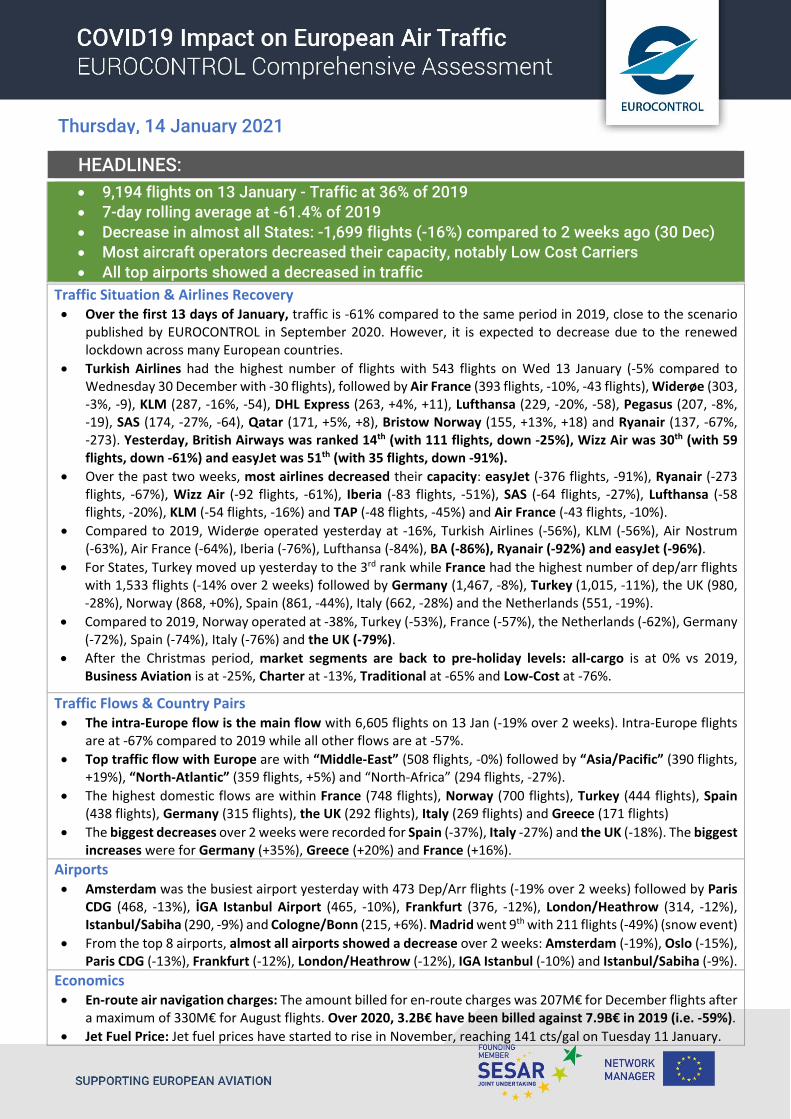
Turkish Airlines had the highest number of flights with 543 flights on Wed 13 January (‐5% compared to Wednesday 30 December with ‐30 flights), followed by Air France (393 flights, ‐10%, ‐43 flights), Widerøe (303, ‐3%, ‐9), KLM (287, ‐16%, ‐54), DHL Express (263, +4%, +11), Lufthansa (229, ‐20%, ‐58), Pegasus (207, ‐8%, ‐19), SAS (174, ‐27%, ‐64), Qatar (171, +5%, +8), Bristow Norway (155, +13%, +18) and Ryanair (137, ‐67%, ‐273). Yesterday, British Airways was ranked 14th (with 111 flights, down ‐25%), Wizz Air was 30th (with 59 flights, down ‐61%) and easyJet was 51th (with 35 flights, down ‐91%).
Over the past two weeks, most airlines decreased their capacity: easyJet (‐376 flights, ‐91%), Ryanair (‐273 flights, ‐67%), Wizz Air (‐92 flights, ‐61%), Iberia (‐83 flights, ‐51%), SAS (‐64 flights, ‐27%), Lufthansa (‐58 flights, ‐20%), KLM (‐54 flights, ‐16%) and TAP (‐48 flights, ‐45%) and Air France (‐43 flights, ‐10%).
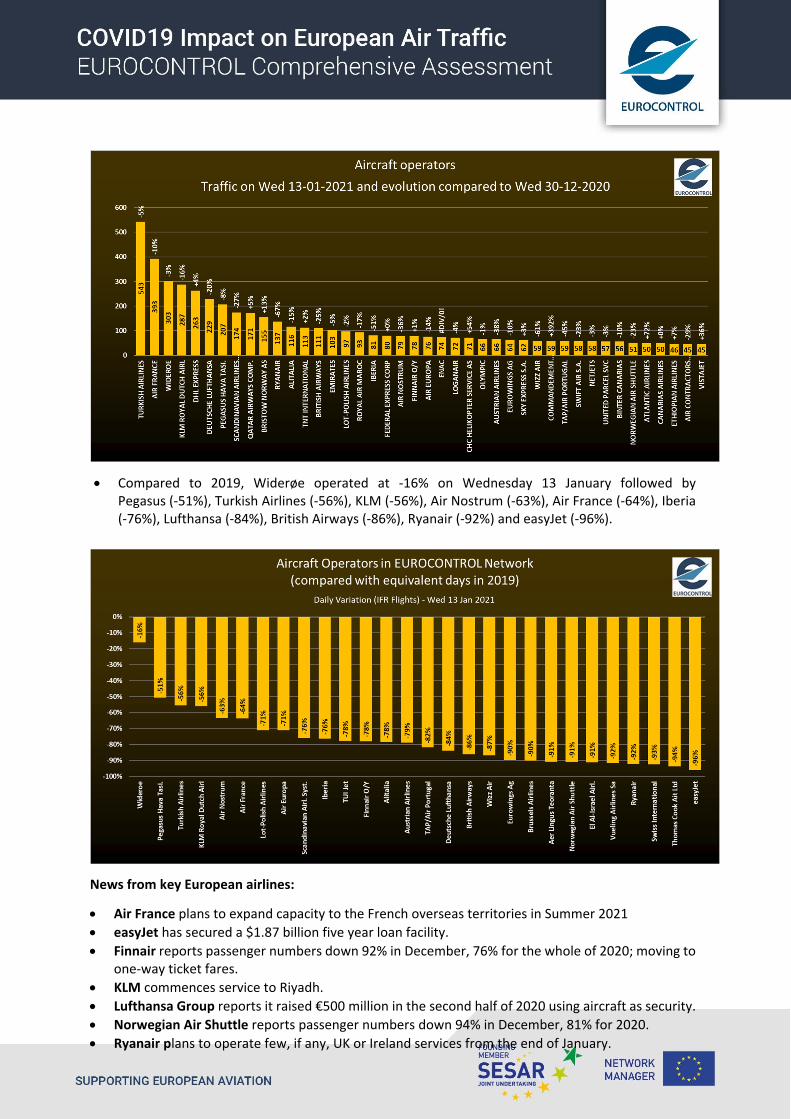
Compared to 2019, Widerøe operated yesterday at ‐16%, Turkish Airlines (‐56%), KLM (‐56%), Air Nostrum (‐63%), Air France (‐64%), Iberia (‐76%), Lufthansa (‐84%), BA (‐86%), Ryanair (‐92%) and easyJet (‐96%).
For States, Turkey moved up yesterday to the 3rd rank while France had the highest number of dep/arr flights with 1,533 flights (‐14% over 2 weeks) followed by Germany (1,467, ‐8%), Turkey (1,015, ‐11%), the UK (980, ‐28%), Norway (868, +0%), Spain (861, ‐44%), Italy (662, ‐28%) and the Netherlands (551, ‐19%).
Compared to 2019, Norway operated at ‐38%, Turkey (‐53%), France (‐57%), the Netherlands (‐62%), Germany (‐72%), Spain (‐74%), Italy (‐76%) and the UK (‐79%).
After the Christmas period, market segments are back to pre‐holiday levels: all‐cargo is at 0% vs 2019, Business Aviation is at ‐25%, Charter at ‐13%, Traditional at ‐65% and Low‐Cost at ‐76%.
Traffic Flows & Country Pairs The intra‐Europe flow is the main flow with 6,605 flights on 13 Jan (‐19% over 2 weeks). Intra‐Europe flights
are at ‐67% compared to 2019 while all other flows are at ‐57%.
Top traffic flow with Europe are with “Middle‐East” (508 flights, ‐0%) followed by “Asia/Pacific” (390 flights, +19%), “North‐Atlantic” (359 flights, +5%) and “North‐Africa” (294 flights, ‐27%).
The highest domestic flows are within France (748 flights), Norway (700 flights), Turkey (444 flights), Spain (438 flights), Germany (315 flights), the UK (292 flights), Italy (269 flights) and Greece (171 flights)
The biggest decreases over 2 weeks were recorded for Spain (‐37%), Italy ‐27%) and the UK (‐18%). The biggest increases were for Germany (+35%), Greece (+20%) and France (+16%).
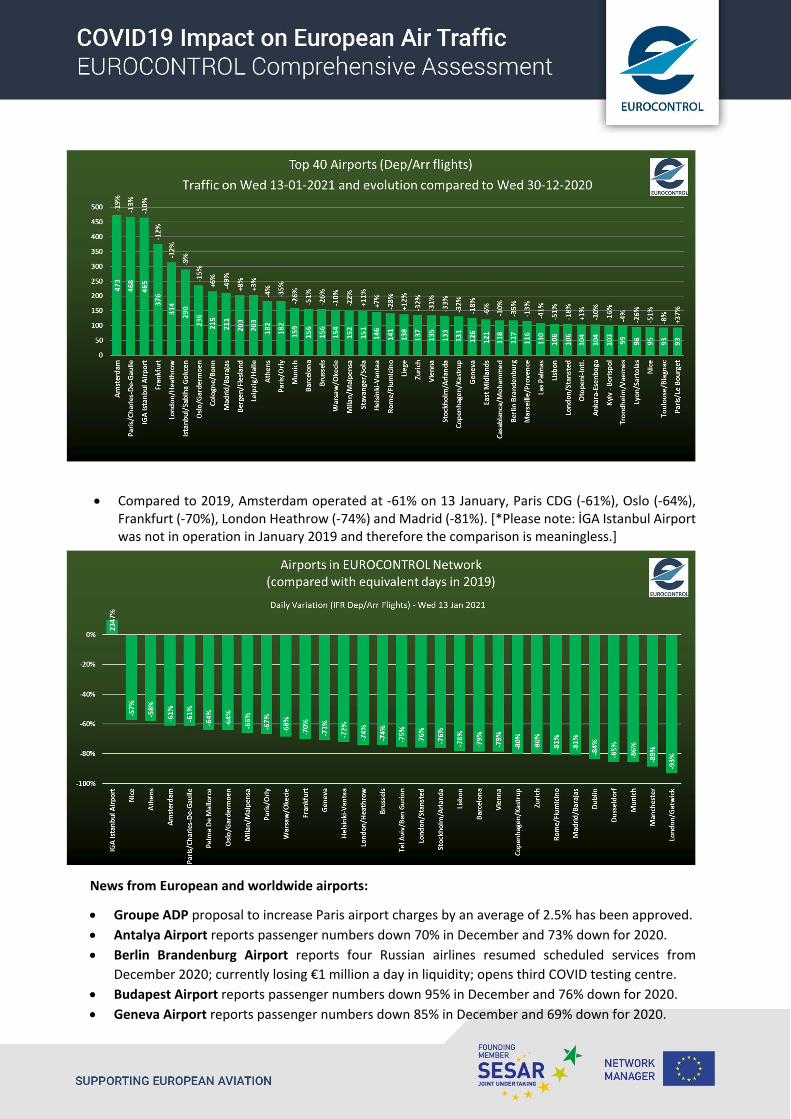
Airports Amsterdam was the busiest airport yesterday with 473 Dep/Arr flights (‐19% over 2 weeks) followed by Paris
CDG (468, ‐13%), İGA Istanbul Airport (465, ‐10%), Frankfurt (376, ‐12%), London/Heathrow (314, ‐12%), Istanbul/Sabiha (290, ‐9%) and Cologne/Bonn (215, +6%). Madrid went 9th with 211 flights (‐49%) (snow event)
From the top 8 airports, almost all airports showed a decrease over 2 weeks: Amsterdam (‐19%), Oslo (‐15%), Paris CDG (‐13%), Frankfurt (‐12%), London/Heathrow (‐12%), IGA Istanbul (‐10%) and Istanbul/Sabiha (‐9%).
Economics En‐route air navigation charges: The amount billed for en‐route charges was 207M€ for December flights after
a maximum of 330M€ for August flights. Over 2020, 3.2B€ have been billed against 7.9B€ in 2019 (i.e. ‐59%).
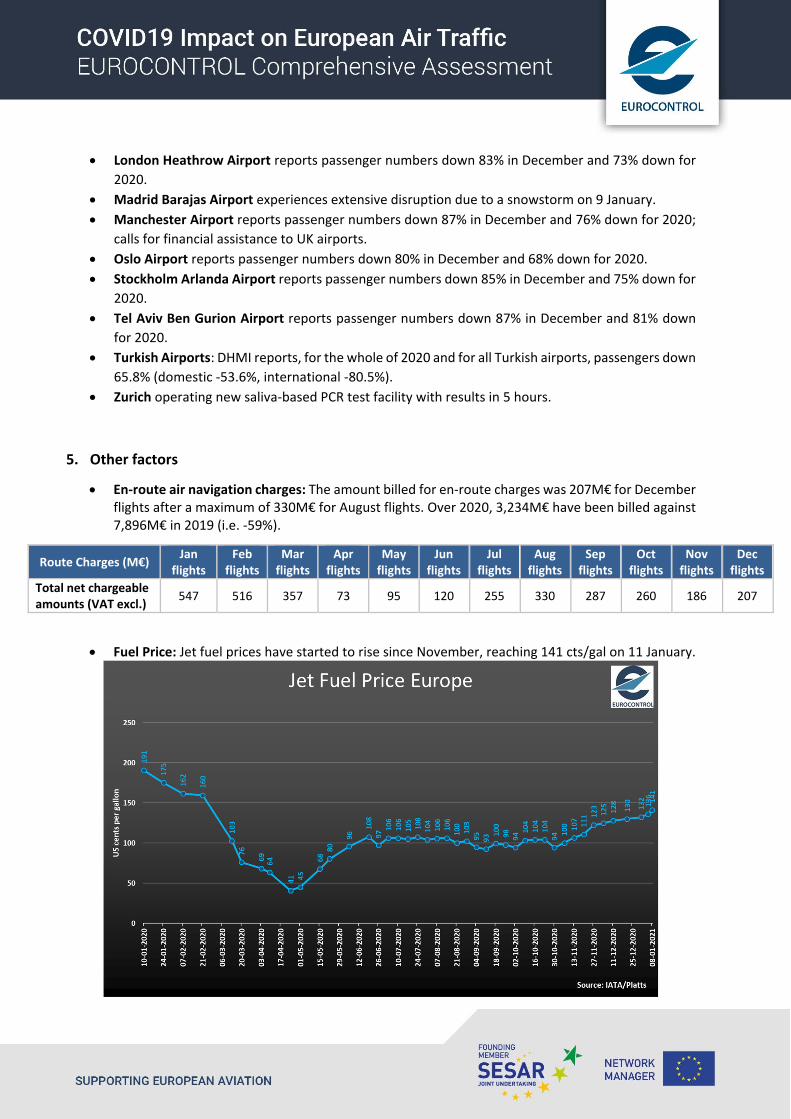
Jet Fuel Price: Jet fuel prices have started to rise in November, reaching 141 cts/gal on Tuesday 11 January.
Thursday, 14 January 2021

1. Traffic Situation and Airlines Recovery
The network recorded 9,194 flights on Wednesday 13 January (‐16% with ‐1,699 flights compared to Wednesday 30 December). This is 35.6% of 2019 traffic levels. Based on a 7‐day moving average, the decrease is ‐61.4% compared to 2019 and is back to the November figures after the end‐of‐the‐year‐related variations.

Overall situation against EUROCONTROL traffic scenarios:
The first 13 days of January flights averaged ‐61% compared to same period in 2019, close to the scenario published by EUROCONTROL in September 2020. However, it is expected to decrease due to the renewed lockdown across many European countries.
European Airlines:
Overall a generalised decrease in capacity for most airlines compared to Wednesday 30 December 2020.
Turkish Airlines was the airline with the highest number of flights with 543 flights on Wednesday 13 January slightly decreasing by ‐5% compared to Wednesday 30 December (‐30 flights), followed by Air France (393 flights, ‐10%, ‐43 flights), Widerøe (303 flights, ‐3%, ‐9 flights), KLM (287 flights, ‐16%, ‐54 flights), DHL Express (263 flights, +4%, +11 flights), Lufthansa (229 flights, ‐20%, ‐58 flights), Pegasus (207 flights, ‐8%, ‐19 flight), SAS (174 flights, ‐27%, ‐64 flights), Qatar (171 flights, +5%, +8 flights), Bristow Norway (155 flights, +13%, +18 flights) and Ryanair (137 flights, ‐67%, ‐273 flights). Yesterday, British Airways was ranked 14th (with 111 flights, down ‐25%), Wizz Air was 30th (with 59 flights, down ‐61%) and easyJet was 51th (with 35 flights, down ‐91%).
Compared to two weeks ago, most airlines decreased their capacity, for example easyJet (‐376 flights, ‐91%), Ryanair (‐273 flights, ‐67%), Wizz Air (‐92 flights, ‐61%), Iberia (‐83 flights, ‐51%), SAS (‐64 flights, ‐27%), Lufthansa (‐58 flights, ‐20%), KLM (‐54 flights, ‐16%) and TAP (‐48 flights, ‐45%), Air Nostrum (‐44 flights, ‐36%) and Air France (‐43 flights, ‐10%).
Compared to 2019, Widerøe operated at ‐16% on Wednesday 13 January followed by Pegasus (‐51%), Turkish Airlines (‐56%), KLM (‐56%), Air Nostrum (‐63%), Air France (‐64%), Iberia (‐76%), Lufthansa (‐84%), British Airways (‐86%), Ryanair (‐92%) and easyJet (‐96%).
News from key European airlines:
Air France plans to expand capacity to the French overseas territories in Summer 2021
easyJet has secured a $1.87 billion five year loan facility.
Finnair reports passenger numbers down 92% in December, 76% for the whole of 2020; moving to one‐way ticket fares.
KLM commences service to Riyadh.
Lufthansa Group reports it raised €500 million in the second half of 2020 using aircraft as security.
Norwegian Air Shuttle reports passenger numbers down 94% in December, 81% for 2020.
Ryanair plans to operate few, if any, UK or Ireland services from the end of January.

TAP Air Portugal reported to require €2 billion loan by 2024, in addition to €1.2 billion already received from the government.
States
The top 8 busiest states1 remained broadly stable with Turkey taking the 3rd rank. France was the State with the highest number of dep/arr flights with 1,533 flights on Wednesday 6 January (‐14% over 2 weeks) followed by Germany (1,467, ‐8%), Turkey (1,015, ‐11%), the UK (980, ‐28%), Norway (868, +0%), Spain (861, ‐44%), Italy (662, ‐28%) and the Netherlands (551, ‐19%).
Compared to 2019, Departure/Arrival traffic on Wednesday 13 January for these top 8 States was: Norway (‐38%), Turkey (‐53%), France (‐57%), the Netherlands (‐62%), Germany (‐72%), Spain (‐74%), Italy (‐76%) and the UK (‐79%).
1 excluding overflights.

News from States and manufacturers:
Norway proposes an increase in carbon tax from €56.90 per tonne to €192.87 by 2030.
UK introduces mandatory testing for inbound travel to England.
Airbus reports 566 deliveries for 2020, 34% fewer than in 2019 and 268 net aircraft orders
Boeing reports 157 deliveries for 2020, 59% fewer than in 2019 and 184 gross aircraft orders. Net
orders were negative due to contractual changes (cancellations or conversions).
Market Segments:
As expected, all segments posted growth increases over Christmas2: demand increased with the end‐of‐the‐year holiday period: o All‐cargo recorded significant growth increases as consumers massively moved to e‐
commerce (lockdown means less physical shopping too). Early days of 2021 show all‐cargo traffic levels stable on 2019.
o Business Aviation, recorded a surge during holiday period too, with strong demand from customers to leisure destinations (although ski resorts were not all opened). Early days of 2021 show traffic level back to pre‐holiday rates, ie ‐25% (vs 2019).
o Charter followed the same path as Business and is now back at ‐13% too. o Traditional and Low‐Cost, while accounting the majority of flights (respectively 49% and 26%
of all flights), were helped by the increase in demand at the end of the year too but are still lagging behind in growth terms. Recent days showed they are down to ‐65% and ‐76% respectively (vs 2019).
2 All segments show an artificial blip on 23 Dec 2020 as comparable day was Christmas day in 2019.

2. Traffic Flows & Country Pairs
The main traffic flow is the intra‐Europe flow with 6,605 flights on Wednesday 13 January, which is decreasing (‐19%) over 2 weeks.
The top traffic flows with Europe were with “Middle‐East” (508 flights, ‐0%) followed by “Asia/Pacific” (390 flights, +19%), “North‐Atlantic” (359 flights, +5%), “North‐Africa” (294 flights, ‐27%) and “Other Europe” (256 flights, ‐26%).
Intra‐Europe flights are at ‐67% compared to 2019 while intercontinental flows are at ‐57%.
Domestic flows are the most active flows (i.e. 9 of the top 10 flows are domestic). The highest
domestic flows are within France (748 flights), Norway (700 flights), Turkey (444 flights), Spain (438 flights), Germany (315 flights), the UK (292 flights), Italy (269 flights), Greece (171 flights) and Sweden (118 flights). The biggest decreases over 2 weeks were recorded for Spain (‐37%), Italy ‐27%) and the UK (‐18%). The biggest increases were for Germany (+35%), Greece (+20%) and France (+16%).
REGION 30‐12‐2020 13‐01‐2021 % vs. 2019
Intra‐Europe 8 128 6 605 ‐19% ‐67%
Europe<‐>Asia/Pacific 329 390 +19% ‐47%
Europe<‐>Mid‐Atlantic 115 96 ‐17% ‐46%
Europe<‐>Middle‐East 510 508 ‐0% ‐59%
Europe<‐>North Atlantic 341 359 +5% ‐57%
Europe<‐>North‐Africa 403 294 ‐27% ‐61%
Europe<‐>Other Europe 344 256 ‐26% ‐65%
Europe<‐>South‐Atlantic 57 63 +11% ‐66%
Europe<‐>Southern Africa 177 165 ‐7% ‐51%
Non Intra‐Europe 2 276 2 131 ‐6% ‐57%

The busiest non domestic flows were France‐Germany (99 flights, ‐1%), Germany‐UK (77 flights, ‐8%), Germany‐Italy (76 flights, ‐7%) and UK‐US (75 flights, +12%).
Compared to 2019, the largest domestic flows on Wednesday 13 January were at ‐38% for France, ‐20% for Norway, ‐52% for Turkey, ‐60% for Spain, ‐72% for Germany, ‐70% for the UK, ‐63% for Italy and ‐29% for Greece.
3. Situation outside Europe
United‐States (A4A members): o US domestic flights recorded a rebound in growth for Christmas holiday period, comparable
to the Thanksgiving growth blip. US domestic traffic is now down to ‐42% (vs 2019) on 12 January 2021. Latin America (‐30%) and Mexican (>0%) are the most popular gateways from/to US: they increase faster than the other flows (holiday destinations and visiting friends and relatives).

o On 12 Jan, U.S. airlines passenger volumes were 58% below 2019 levels with Domestic down 58% and International down 63%.
o The domestic U.S. Load Factor averaged 55% in most recent week, versus 78% a year earlier.
China: o Chinese domestic flights show decreasing trend 9,799 flights (‐4% compared to 1 Jan 2019)
owing to rise in Covid‐19 cases and tighter government controls (lockdown). International flights have been stable too since March although slightly decreasing with 1,275 flights (‐65% compared to 1 Jan 2019). The same is true for overflights with 473 flights (‐67% compared to 1 Jan 2019).

Middle East:
o Intra‐Middle‐East traffic has been increasing slowly reaching 1,589 flights on 11 January (‐45% compared to Feb 2019). International traffic is at 1,340 flights (‐60% compared to Feb 2019). Overflights are recording 370 flights (‐43% compared to Feb 2019).
News for worldwide airlines and local authorities:
DHL Express has already operated more than 50 flights with vaccine shipments to European locations.
JAL domestic suspensions planned to be at 44% for the second half of January, the same level as ANA.
Singapore Airlines Group reports passenger numbers down 97.6% in December.
WestJet reducing capacity by a third, standing down 1,000 staff and reducing domestic weekly departures by 160.
China (CAAC) extends its suspension of air services from/to the UK (from 11 Jan onwards).
New York governor requests that Homeland Security require a negative test for arriving
passengers.
4. Airport Information
Amsterdam was the busiest airport with 473 Dep/Arr flights on 13 January (‐19% over 2 weeks) followed by Paris CDG (468, ‐13%), İGA Istanbul Airport (465, ‐10%), Frankfurt (376, ‐12%), London/Heathrow (314, ‐12%), Istanbul/Sabiha (290, ‐9%) and Cologne/Bonn (215, +6%). Madrid went 9th because of the snow event with 211 flights (‐49%).
From the top 8 airports, almost all airports showed a decrease over 2 weeks: Amsterdam (‐19%), Oslo (‐15%), Paris CDG (‐13%), Frankfurt (‐12%), London/Heathrow (‐12%), IGA Istanbul (‐10%) and Istanbul/Sabiha (‐9%). Only Cologne/Bonn (+6%) reported an increase.
Compared to 2019, Amsterdam operated at ‐61% on 13 January, Paris CDG (‐61%), Oslo (‐64%), Frankfurt (‐70%), London Heathrow (‐74%) and Madrid (‐81%). [*Please note: İGA Istanbul Airport was not in operation in January 2019 and therefore the comparison is meaningless.]
News from European and worldwide airports:
Groupe ADP proposal to increase Paris airport charges by an average of 2.5% has been approved.
Antalya Airport reports passenger numbers down 70% in December and 73% down for 2020.
Berlin Brandenburg Airport reports four Russian airlines resumed scheduled services from
December 2020; currently losing €1 million a day in liquidity; opens third COVID testing centre.
Budapest Airport reports passenger numbers down 95% in December and 76% down for 2020.
Geneva Airport reports passenger numbers down 85% in December and 69% down for 2020.
London Heathrow Airport reports passenger numbers down 83% in December and 73% down for
2020.
Madrid Barajas Airport experiences extensive disruption due to a snowstorm on 9 January.
Manchester Airport reports passenger numbers down 87% in December and 76% down for 2020;
calls for financial assistance to UK airports.
Oslo Airport reports passenger numbers down 80% in December and 68% down for 2020.
Stockholm Arlanda Airport reports passenger numbers down 85% in December and 75% down for
2020.
Tel Aviv Ben Gurion Airport reports passenger numbers down 87% in December and 81% down
for 2020.
Turkish Airports: DHMI reports, for the whole of 2020 and for all Turkish airports, passengers down
65.8% (domestic ‐53.6%, international ‐80.5%).
Zurich operating new saliva‐based PCR test facility with results in 5 hours.
5. Other factors
En‐route air navigation charges: The amount billed for en‐route charges was 207M€ for December flights after a maximum of 330M€ for August flights. Over 2020, 3,234M€ have been billed against 7,896M€ in 2019 (i.e. ‐59%).
Route Charges (M€) Jan
flights Feb
flights Mar flights
Apr flights
May flights
Jun flights
Jul flights
Aug flights
Sep flights
Oct flights
Nov flights
Dec flights
Total net chargeable amounts (VAT excl.)
547 516 357 73 95 120 255 330 287 260 186 207
Fuel Price: Jet fuel prices have started to rise since November, reaching 141 cts/gal on 11 January.

To further assist you in your analysis, EUROCONTROL provides the following additional information on a
daily basis (daily updates at approximately 7:00 CET for the first item and 12:00 CET for the second) and
every Friday for the last item:
1. EUROCONTROL Daily Traffic Variation dashboard: www.eurocontrol.int/Economics/DailyTrafficVariation (or via the COVID‐19 button on the top of our homepage www.eurocontrol.int)
This dashboard provides traffic for Day+1 for all European States; for the largest airports; for each Area Control Centre (ACC); and for the largest airline operators.
2. COVID Related‐NOTAMS with Network Impact (i.e. summary of airspace restrictions): https://www.public.nm.eurocontrol.int/PUBPORTAL/gateway/spec/index.html
The Network Operations Portal (NOP) under “Latest News” is updated daily with a summary table of the most significant COVID‐19 NOTAMs applicable at 12.00 UTC.
3. NOP Recovery Plan: https://www.public.nm.eurocontrol.int/PUBPORTAL/gateway/spec/index.html
This report, updated every Friday, is a special version of the Network operation Plan supporting aviation response to the COVID‐19 Crisis. It is developed in cooperation with the operational stakeholders ensuring a rolling outlook.