through 2015 - statens pensjonskasse · in 2015 real estate investments and capital investments ....
TRANSCRIPT

2015A N N U A L R E P O R T

THE PENSION SCHEME FOR THE PHARMACY SECTOR / ANNUAL REPORT 2015
CONTENTS
03 04 06 07 08 11 12 14
15 16 18 21 26 37 38 43
STRENGTHENED THROUGH 2015
ABOUT THE PENSION SCHEME
THE PHARMACY INDUSTRY IN NORWAY – AN HISTORICAL FLASHBACK
THE PENSION SCHEME FOR THE PHARMACY SECTOR – THEN AND NOW
THIS IS WHAT THE PENSION SCHEME OFFERS
THE PENSION SYSTEM
THE PENSION REFORM – WORK CONTINUES
FRAMEWORK IN RAPID DEVELOPMENT
PENSION LIABILITIES
INVESTMENT MANAGEMENT
REPORT OF THE BOARD OF DIRECTORS
ANNUAL FINANCIAL STATEMENTS
NOTES TO THE ANNUAL FIANCIAL STATEMENTS
AUDITOR’S REPORT
STATISTICS
GLOSSARY
Index page
Previous page
Next page
N AV I G AT I O N

3THE PENSION SCHEME FOR THE PHARMACY SECTOR / ANNUAL REPORT 2015
STRENGTHENED THROUGH 2015
The financial situation for the Pension Scheme for the Pharmacy Sector has strengthened throughout the year, but low interest rates are a challenge for the pension scheme – and for the industry in general.
The Pension Scheme for the Pharmacy Sector has expe-rienced several years with a challenging capital situation. Norwegian interest rates have remained low following the financial crisis of 2008. Yields on risk-free investments in the financial markets have been low. Together with several years of high salary growth in Norway compared with other countries, this has led to pension liabilities growing significantly faster than the pension funds.
Measures in the form of a premium increase as well as a modest adjustment of pensions have previously been implemented in order to strengthen the capital situation in the pension scheme. These actions to improve the equity situation made it possible for the Board to adopt an investment strategy with a moderate risk level in the investment portfolio, in order to increase return expectations.
In 2015 real estate investments and capital investments made a solid contribution to total returns, while shares and hedge funds made a moderate contribution. The result was a 2.4 per cent return on investment manage-ment.
Premiums remained unchanged during 2015 while pension benefits were adjusted on the basis of a wage inflation factor of 1.92 per cent. At the same time the pension scheme was able to enter 2016 with an improved equity situation for the scheme. Funds under manage-ment increased by NOK 498 million during 2015.
Major changes in the pensions marketIn 2011 we received new rules for the National Insurance retirement pension. Yet the fundamental debate about the public service pension has just begun. In December 2015 the Ministry of Labour and Social Affairs presented the report “New pension schemes in the public sector”. The report outlines a number of principles that will be open to negotiation and debate in coming years. You can read more about this on page 12.
Pension funds and life insurance companies are subject to both national laws and EU regulations. These are in rapid development. Uncertainty regarding future capital requirements for providers of occupational pension products in Norway has been significant in recent years. The Financial Supervisory Authority of Norway recently announced that Norwegian pension funds may be subject to significantly stricter capital requirements in just a few years. You can read more about this on page 14.
Increased pension liabilitiesIncreasing life expectancies and salary levels result in increased pension liabilities, both for the Pension Scheme for the Pharmacy Sector and other pension providers. In recent years, the scheme’s liabilities have also been increasing due to a higher incidence of, and more
expensive, disability cases. New regulations for disability pension came into effect on 01.01.2015. According to the new rules the disability pension will be a direct supple-ment to the disability pension or work clarification benefit from National Insurance (NAV); on a so-called net basis. The disability pension shall thus no longer be coordinated with National Insurance benefit The new disability pension reduced disability provisions for the scheme from 2015.
Future expectationsIncreased salary levels and increased life expectancy, together with very low interest rates, create challenges. Satisfactory returns can only be achieved by taking risks. An investment strategy that maintains a well-diversified portfolio with a risk level that is fit for the scheme will be important in 2016 and beyond. As well as increased pension liabilities, the introduction of new solvency capital requirements may create challenges for the pension scheme’s capital situation in the future.

4
The Pension Scheme for the Pharmacy Sector manages the pension entitlements of employees in pharmacies in Norway.
The Pension Scheme for the Pharmacy Sector was established in 1953 and is a statutory collective pension scheme.
This means that dispensing pharmacists and permanent employees in pharmacies are both entitled to and obliged to become members of the pension scheme.
Up until 31.03.2016, one had to work at least 15 hours per week to be eligible for the pension scheme (pharmacy technicians had to work at least 13.5 hours per week). The Norwegian Parliament has decided to reduce the minimum membership requirement, and the change entered into force on 01.04.2016. As a result, pharmacy employees will become members of the pension scheme as of this date if they have a 20 percent or higher position.
In addition to the employees at 834 pharmacies the scheme has members from other businesses which are closely associated with the pharmacy sector and who have applied for membership.
AdministrationThe Act on the Pension Scheme for the Pharmacy Sector stipulates that the scheme shall be managed by the Norwegian Public Service Pension Fund in accordance with regulations issued by the Ministry of Labour and Social Affairs. The Board of Directors of the Pension
ABOUT THE PENSION SCHEME
Scheme for the Pharmacy Sector is the scheme’s decision-making body. The Board is headed by the CEO of the Norwegian Public Service Pension Fund and has four additional members, each with a personal deputy.
The Board is appointed by the Ministry of Labour and Social Affairs with a four-year mandate following nomina-tions from the employers’ associations and the employee unions. Two of the nominated members shall represent employers, while pharmacists and technical staff are each represented by one Board member.
Board of Directors 2015• Finn Melbø (chairman), CEO of the Norwegian Public
Service Pension Fund• Stein Gjerding, Chief Economist in Spekter• Ann Torunn Tallaksen, Chief negotiator, Virke• Renate Messel Hegre, Negotiator, Parat/Norwegian
Association of Pharmacy Technicians• Greta Torbergsen, Secretary General of the Norwegian
Association of Pharmacists
THE PENSION SCHEME FOR THE PHARMACY SECTOR / ANNUAL REPORT 2015
Key figures 20152015 2014 2013
Customers and membersPharmacies in the pension scheme Number 834 800 768 Members Number 19 711 18 789 18 133 Actively-employed members* Number 7 585 7 422 7 274 Pensioners* Number 4 951 4 600 4 295 Persons with entitlements from previous positions** Number 7 175 6 767 6 564
Occupational pensionsAccrued pension entitlements Thousand NOK 6 644 006 6 478 203 5 947 896 Pension premium Thousand NOK 639 870 593 186 570 010 Pensions paid Thousand NOK 279 046 264 356 244 425
Investment managementFunds in the Pharmacy scheme Million NOK 7 796 7 292 6 550Annual return Per cent 2.4 6.6 7.6
* The number stated is the number of policies. A member can have more than one policy. For example, a member who receives a partial disability pension from the pension scheme and works partly in an active position will have two policies which correspond to the two positions respectively.
** Members who no longer work in an organisation linked to the Pension Scheme for the Pharmacy Sector, but who have pension entitlements with us (also called deferred pensions).

5THE PENSION SCHEME FOR THE PHARMACY SECTOR / ANNUAL REPORT 2015
Actively-employed members
Apotek 1 – 2 643Boots – 1 219Independent pharmacies – 772Hospital pharmacies – 1 068Vitus – 1 883
Pension
AFP (current AFP) – 127 161Retirement pension – 5 303 878Children's pensions – 12 399Spouse pensions – 385 640Disability pension – 814 927
-10
-5
0
5
10
15
2015201420132012201120102009200820072006
Per cent
Investment management
The Pension Scheme for the Pharmacy Sector comprises retirement pensions, contractual pensions (AFP), disability pensions and dependents’ pensions.
Accrued pension entitlements
The figure shows active members by employers.
Number of actively-employed members 31.12.2015
The funds of the Pension Scheme for the Pharmacy Sector are invested in short-term and long-term bonds, Norwegian shares, real estate, foreign equity funds, hedge funds and loans to members.
Annual return POA
Accrued pension entitlements (in thousand NOK)AFP (current AFP) 127 161 Retirement pension 5 303 878 Children's pensions 12 399 Spouse pensions 385 640 Disability pension 814 927 Total 6 644 006
Accrued pension entitlements in the scheme increased by NOK 166 million from 2014 to 2015. Retirement pensions comprise 80 per cent of the total accrued entitlements of NOK 6,644 million.
Read more about pension liabilities on page 14
Active members by pharmacy retailer and in total for the independent pharmacies
Aktive Apotek 1 Boots VitusHospital
pharmacies
Inde-pendent
pharma ciesWomen 2 391 1 092 1 677 950 610 Men 252 127 206 118 162 Total 2643 1219 1883 1068 772
The table shows active members employment by pharmacy retailer, and in total for the independent pharmacies, specified by gender.
More statistics: see page 38–43
Investment management delivered a value- adjusted return of 2.4 per cent in 2015. The average return for the 10-year period has been 4.8 per cent.
Read more on page 16

THE PENSION SCHEME FOR THE PHARMACY SECTOR / ANNUAL REPORT 20156
The pharmacy sector in Norway has historically been characterized by strong government involvement in order to ensure the population safe access to medicines of good quality.Ever since the first pharmacy was established in Norway, the right to operate pharmacies relied on licensing and were subject to legislation. The pharmacy sector has long been seen as an extension of the health services, and not a regular shop among shops. Strict professional requirements ensures pharmacies as specialist retailers and shall contribute to the correct use of medicines in the population. Medicine sales, concession ownership and operation as well as expertise and practice in pharmacy was, and is, regulated by law (Law on pharmacy).
THE PHARMACY INDUSTRY IN NORWAY – A HISTORICAL FLASHBACK
Legal amendment and freer establishment Previously, all pharmacies, except public hospital pharmacies, were privately owned by pharmacists. Higher pharmaceutical education was required in order to own and operate a pharmacy. The Ministry of Social Affairs decided whether a pharmacy should be established or closed down, and where it should be situated. A pharmacy was established when it was required or desirable in terms of the public interest.
The new pharmacy act of 2001 allowed freer establish-ment and ownership. The aim was partly to improve accessibility (related to both location and opening hours), as well as to increase competition. This resulted in the establishment of more pharmacies. Today, the industry is characterized by three internationally-owned chains that constitute approximately 75 percent of the market, while independent pharmacies and hospital pharmacies represent approximately 25 percent of the market.
THE PENSION SCHEME FOR THE PHARMACY SECTOR / ANNUAL REPORT 20157
Just as the establishment and operation of pharmacies in Norway are regulated by law, the pension scheme is also established by law.
Pension schemes for some groups in Norway were introduced as early as the late 1800s. As early as 1877 pharmacists were obliged to ensure that their widows would receive a pension. This stipulation was included in the act concerning the operation of pharmacies.
The pharmacy industry was thus a front runner in this regard. Efforts to establish a general pension scheme for pharmacists began in the 1920s. In the 1930s pharmacy employees also brought up their pension interests for discussion. The Ministry of Social Affairs believed it would be in the public interest that age limits be set for pharmacists, but that it would not be prudent to impose a specific retirement age for pharmacists and staff unless they were guaranteed pension rights.
The development of the welfare state took off in Norway after World War II. Welfare policy was characterized by the idea that everyone is entitled to a minimum standard, regardless of economic status. Arrangements should include all and not be means-tested. A number of laws on pension schemes for certain professional groups were also established, including nurses, fishermen, forestry workers – and pharmacists.
THE PENSION SCHEME FOR THE PHARMACY SECTOR – THEN AND NOW
The Act on the Pension Scheme for the Pharmacy Sector was adopted in 1953. The Act applies to all pharmacists and permanent employees, and continues to apply.
The Pension Scheme for the Pharmacy Sector todayThe Act on the Pension Scheme for the Pharmacy Sector is closely related to the public service pension, and all pharmacists and permanent employees are entitled and obliged to be members. Members have a defined benefit pension scheme like other public pension plans. The retirement pension is coordinated with the National Insurance Scheme (gross pension), and employers and members pay a percentage of pensionable income (salary) in premiums.
Under the Act on the Pension Scheme for the Pharmacy Sector, it is stipulated that the scheme should be adminis-tered by the The Norwegian Public Service Pension Fund. Administrative instructions issued by the Ministry of Labour and Social Affairs stipulate how the pension scheme should be managed, including the duties of the Board of Directors, general requirements for asset management and frameworks for investment. According to management instructions, as far as possible the Pension Scheme for the Pharmacy Sector shall follow the regulations in the same way as other Norwegian pension funds.

THE PENSION SCHEME FOR THE PHARMACY SECTOR / ANNUAL REPORT 20158
THE VALUE OF THE MEMBERSHIP:
THIS IS WHAT THE PENSION SCHEME OFFERS
A good pension scheme is about more than just a retirement pension. Membership of the Pension Scheme for the Pharmacy Sector also includes a contractual pension (AFP), disability pension and dependents’ pension. Members can also apply for housing loans.
Retirement pensionA retirement pension from the Pension Scheme for Phar-macy Sector is in addition to a retirement pension from the National Insurance Scheme and is a life-long payment. Most members can draw on their retirement pension when they reach the age of 67. The pension scheme’s upper age limit for retirement is 70. The size of the pension depends on the contribution base, qualifying period and percent-age of employment. The contribution base is generally equivalent to the employee’s regular salary at the time he or she retires, subject to a limit of 10G (G = the Norwe-gian National Insurance Scheme’s basic amount). 1 G was NOK 90 068 as at 01.05.2015. The qualifying period is the length of time the employee has been a member of the pension scheme. The full qualifying period is 30 years.
The pension scheme may be compared to a public defined benefits plan and operates on a so-called gross guaran-tee. This means that the pension benefits will normally
amount to at least 66 per cent of the contribution base provided the member has completed a full qualifying period. However for part-time employees, or those with a shorter qualifying period than 30 years, the pension bene-fits will be reduced correspondingly. Retirement pensions are adjusted for age from 67 years – i.e. pension payments are related to life expectancy.
The age adjustment means that the pension can be less than 66 per cent of final salary, even with full accrual.
Those who were born in 1958 or earlier receive an individual guarantee which ensures that they will receive 66 per cent of the contribution base after the completed qualifying period when they reach 67 years of age.
Contractual pensionOn reaching the age of 62, members of the pension scheme may be entitled to retire on a contractual pension (called AFP). Members who are not employees, e.g. phar-macists who own their own pharmacies, are not entitled to a contractual pension. When a member is between 62 and 65 years of age Norwegian Labour and Welfare Service (NAV) manages the scheme and the pension is calculated according to National Insurance rules. As a rule, the amount of the pension from 62 years of age will be equivalent to the retirement pension without age adjustment the member would have received from the National Insurance Scheme if he or she had continued to work until reaching 67 years of age, plus an AFP supple-ment of NOK 1,700 per month.
From age 65 the level of pension benefits is calculated either according to National Insurance Scheme rules or according to the method used by the Pension Scheme for the Pharmacy Sector for calculating retirement pensions. The Pension Scheme for the Pharmacy Sector compares these two calculations and pays the highest benefit. When the member reaches 67 years of age the contractual pension is changed to a retirement pension.
Contractual pension from the pension scheme cannot be combined with drawing a retirement pension from the National Insurance Scheme.
Disability pensionA disability pension can be paid to members who be- come unable to work due to illness or injury, and as a result have to reduce their working hours or leave their job. Pension benefits may be paid on a temporary or permanent basis and may be paid in respect of all or elements of the position of employment.
New rules for the disability pension from the National Insurance Scheme came into effect from January 2015. The change in the disability pension law for the public sector came about as a result of the changes in the National Insurance Scheme and the new rules for taxation of disability pensioners.
With new rules, the disability pension from the public sector occupational pension scheme is a direct supple-ment to the disability pension or work clarification benefit

THE PENSION SCHEME FOR THE PHARMACY SECTOR / ANNUAL REPORT 20159
from the National Insurance Scheme; on a so-called net basis. The disability pension from the Pension Scheme for the Pharmacy Sector is thus no longer coordinated with National Insurance benefits.
The disability pension is taxed as salary, and the disability pension will change to a retirement pension with effect from retirement age; 67 years old at the latest.
The proportion of the disability pension is determined by earning capacity. The degree of disability is determined by comparing earning capacity before disability with earning capacity after disability. The minimum degree of disability is 20 per cent.
If the degree of disability pension is 50 per cent or more from the Pension Scheme for the Pharmacy Sector, it is a requirement that the person in question also applies for work clarification benefit (AAP) or disability pension from the National Insurance Scheme.
If you have a reduced earning capacity, but not to the extent that you receive work clarification benefit or disa-bility pension from NAV, your pension will be the total of:• 25 per cent of the National Insurance Scheme base
amount (G)• 69 per cent of your pension basis up to 10 G
Disability pension when you receive work clarification benefit or disability pension from NAV:
If you have lost your earning capacity completely your full pension will be the total of:• 25 per cent of the National Insurance Scheme base
amount (G)• 3 per cent of your pension basis up to 6 G• 69 per cent of your pension basis between 6 and 10 G
For disability pensions, credit is given for the pension entitlement the member could have accrued if he or she had remained in the qualifying position until retirement. Disability pensions are calcu- lated on the basis of the percentage of employment at the time of disability. Disability pensions are not adjusted for age.
Dependents’ pensionsIf a member dies, his or her dependents may be entitled to a dependents’ pension. The pension shall cover some of the loss of in come suffered by the family. There are two types of dependents’ pension: spouse pension and children’s pension.
With effect from 2001 new rules were introduced for calculating dependents’ pensions. The new rules provided for dependents’ pensions to be paid on a net basis instead of a gross basis
Under the new rules dependents’ pensions are calcu-lated as a fixed percentage of the deceased member’s contribution base. Dependents’ pensions shall be neither means-tested nor coordinated with the National Insur-ance Scheme.
The new rules for net pension benefits do not, however,
apply to everyone. Accordingly we will continue to have transitional arrangements in place for a considerable period. These will mean that the old rules, or payment of benefits on a gross basis, will continue to be applied in many cases.
When you leave your job: Deferred pensionMembers who leave a qualifying position without retiring are entitled to a future pension from the pension scheme. This is called a deferred pension. Deferred pension ben-efits are paid when the member reaches the qualifying position’s retirement age or upon receipt of a retirement or disability pension from the National Insurance Scheme. A deferred pension cannot be paid until the member reaches the age of 67. To be entitled to a deferred pension the total qualifying period must be at least three years.
Pension transfer agreementA transfer agreement is an agreement between the majority of public sector pension schemes in Norway. The agreement means that if you have previously accrued pension entitlements in another pen- sion scheme, the accrued entitlement is transferred to the scheme that you belong to on retirement. Pension calculation will be made according to the rules of the final scheme.
From 01.02.2003 the pension transfer agreement ceased to apply in respect of new members of the Pension Scheme for the Pharmacy Sector and members who had left the scheme before that date with a qualifying period shorter than six months. Those who became a member before this date are included in the pension transfer agreement. For those who became a member after

THE PENSION SCHEME FOR THE PHARMACY SECTOR / ANNUAL REPORT 201510
01.02.2003, entitlements earned in the different schemes will be determined in each individual scheme. In other words, the entitlements will not be transferred to the scheme applicable on retirement.
Co-ordination with the National Insurance SchemeIn order to receive a pension from the Pension Scheme for the Pharmacy Sector, it is a condition that the member draws the benefits he or she is entitled to from the National Insurance Scheme. All types of pensions, with the exception of spouse pensions regulated by the net rules, are coordinated with benefits from other public sector pension and social security schemes, primarily the National Insurance Scheme. Changes in rates of National Insurance are therefore very important for determining the level of deductions.
Pension adjustmentsIf the pension scheme’s finances allow, pensions from the Pension Scheme for the Pharmacy Sector can be adjusted in line with decisions by the Board of Directors. The Board considers adjusting the pensions based on the annual change in the National Insurance base factor (G).
It is pensions before coordination with other benefits which are adjusted following a decision by the Board. The coordination deduction is adjusted according to the same rates as for the National Insurance Scheme.
In 2015 the Board of Director’s decided to adjust pensions based on an increase of 1.92 per cent in the National
Inscurance base factor. The pension scheme follows the same principles as public service pensions, where a fixed factor of 0.75 per cent is deducted from retirement pen-sions and contractual pensions (AFP), and spouse pension from age 67. This resulted in a minimum increase of the total pension of 1.16 per cent.
The housing loan schemeMembers of the Pension Scheme for the Pharmacy Sector are eligible to benefit from our housing loan scheme. The maximum loan is currently NOK 1,200,000.
All loans must be secured by a mortgage or similar arrangement. Loans may be granted for home purchases or home improvements/extensions as well as for refinancing an existing mortgage.
As at 31.12.2015 the interest rate for housing loans was 2,7 per cent. The interest rate was reduced to 2.5 per cent from 01.03.2016.
Read more about the pension scheme: www.spk.no/apotek
Pension glossary: see page 43

THE PENSION SCHEME FOR THE PHARMACY SECTOR / ANNUAL REPORT 201511
The Norwegian pension system is divided into three parts. It consists of the National Insurance Scheme, var-ious Occupational Pension Schemes and different forms of savings spe-cifically made for retirement.
THE PENSION SYSTEM
Private pension schemesIf you want to increase your pension you can enter into voluntary savings or pension agree-ments. For example you can save in a unit trust scheme or enter into an individual pension agreement with a bank or insurance company.
Occupational pensionsIn 2006 the Mandatory Occupational Pension (OTP) was introduced in Norway. An occupational pension is accrued while you are in employment and is a supple-ment to the old-age pension from the National Insurance scheme. Differentia-tion is made between private and Public sector occupational pensions.
Public sector employers offer a defined benefit pension scheme, while pri-vate companies have been able to choose between either a defined ben-efit or a defined contribution pension plan until 2014. With effect from 2014 a new occupational pension product has also been introduced for the private sector which is a type of defined contribution pension.
Insurance companies are the main actors in the private sector market, with DNB Liv and Storebrand as the two largest. The two largest suppliers of occupational pensions in the public sector are the Norwegian Public Service Pension Fund (SPK) and Kommunal Landspensjonskasse (KLP).
National InsuranceThe National Insurance Scheme is a mandatory insur-ance and pension scheme for all persons resident in Norway. The scheme is managed by the Norwegian Labour and Welfare Service (NAV) and is financed on an ongoing basis by grants from the Norwegian Exchequer. National Insurance was introduced in Norway in 1967.
Private pension
schemes
Occupational pensions public sector/private
National Insurance

THE PENSION SCHEME FOR THE PHARMACY SECTOR / ANNUAL REPORT 201512
THE PENSION REFORM – WORK CONTINUES
In 2011 we received new rules for the National Insurance retirement pension. Yet the fundamental debate about the public service pension has just begun. The starting point for the work is the report “New pension schemes in the public sector” drawn up by a working group appointed by the Ministry of Labour and Social Affairs.
At the time of writing there are many questions that are yet to be answered. But the working group behind the report that was presented in December 2015 have identified a number of principles. One of these is that the coordination between occupational pensions and the National Insurance Scheme shall cease.
Today the retirement pension from the public sector occu-pational pension schemes are based on final salary and subject to coordination. This means that the occupational pension is seen in connection with the retirement pension from the National Insurance Scheme, and the combined payment from these two schemes should correspond to a certain percentage of final salary. If coordination lapses, this means that the National Insurance Scheme and public sector occupational pensions will be calculated inde-pendently – as is the case in the private sector.
An occupational pension is deferred salaryThe National Insurance Scheme is a basic protection that applies to all inhabitants. An occupational pension is an additional benefit that we accrue through our employ-ment. It is fundamentally correct that these additional benefits appear in the form of a pension when we go finish our working life. It is also fundamentally correct – and in keeping with the spirit of the pension reform – that whoever chooses to remain longer in work, increases their annual pension and that this can compensate for the effect of age adjustment.
But if the coordination between the National Insurance Scheme and the public sector occupational pensions continues, the occupational pension will constitute an increasingly smaller proportion of the overall benefit. Many employees who choose to remain in work after the age of 67 will experience that the occupational pension they have earned through a long working life, will be minimal. This is related to several factors which will be discussed in depth before the regulations for the new public sector occupational pension are determined. The main problem is that the National Insurance Scheme and the current public sector occupational scheme has two different accrual models. We also see that age adjust-ment is of great importance.
Age adjustment has a greater impact on younger workersGrowth in life expectancy and an aging population have put pressure on pension schemes in many parts of the
world. In Norway, we therefore introduced age adjust-ment as an important part of the pension reform in 2011. The adjustment entails that your accrued pension will be divided between the number of years your generation is expected to live. So while life expectancy increases, everyone of a particular generation must work longer than people born in the previous generation in order to get the same pension.
Age adjustment was introduced in both the private and public sector, but the ability to compensate for age adjustment is different. Public sector employees must work longer than employees in the private sector to com-pensate for the impact of this reform. And the rewards of working after age 67 are minimal for those with a full qualifying period in the occupational pension scheme.
The report which the Ministry of Labour and Social Affairs presented contains many options, and the choices made now will be of critical importance both in socio-economic terms and for the future of all workers born after 1953. What is quite clear, regardless of which options are chosen, is that
a) everyone covered by the New public sector occupa-tional pension must work longer to achieve the same pension as the generations not covered by age adjust-ment (born in 1943 or earlier)
b) there there will be many transitional arrangements

THE PENSION SCHEME FOR THE PHARMACY SECTOR / ANNUAL REPORT 201513
Plan for new public sector occupational pension is discussed between the employee associations and the workers organisations. The issue was not resolved during the pay settlements in 2016. The timeschedule above is therefore just a sketch and can be changed.
OCCU
PATI
ONAL
PEN
SION
NATI
ONAL
INSU
RANC
E
2015
2017New rules in public sector occupational pension will probably be
adopted
20211954-generation are 67 years old and can take out
retirement pension with a number
of new coordina-tion rules
20251965-generation are
62 years old andcan take out �exible age in occupational
pension (de�ned contribution
supplement scheme) with life-long AFP
20161954-generation is
62 years old and can take out �exible age National Insurance
with 10% as per new rules
2015Discussion with the parties and preparation of
proposed solution
20251962-generation is
62 years old can take out �exible
age National Insurance with
100% as per new rules
2016 2017 2018 2019 2020 2021 2022 2023 2024 2025
2018–2019Likely entry into forceof new accrual rules
Possible plan for new public sector occupational pension
Possible plan for new public sector occupational pension

THE PENSION SCHEME FOR THE PHARMACY SECTOR / ANNUAL REPORT 201514
EVALUATION OF FUTURE PROSPECTS:
FRAMEWORK IN RAPID DEVELOPMENTPension funds and life insurance com-panies are subject to both national laws and EU regulations. These frameworks, as well as capital adequacy require-ments, are in rapid development. Management of the Pension Scheme for the Pharmacy Sector is carried out in accordance with the the Act on the Pension Scheme for the Pharmacy Sector with related administrative regulations. The regulations were deter-mined in 2011, and stipulate that as far as possible the man-agement of the Pension Scheme for the Pharmacy Sector shall follow the same rules as equivalent pension schemes.
New Financial Undertakings ActWith effect from 01.01.2016 the new Act on Financial Undertakings and Financial Groups (the Financial Under-takings Act ) came into force. This act replaces many of the rules that previously existed in the Insurance Act. Formerly pension funds and life insurance companies in Norway were subject to almost the same regulation in areas such as statutory capital requirements and invest-ment limits.
The Norwegian rules for insurance and pension enter-prises are bound by EU regulation. The financial institu-tions act thus incorporates the new Solvency II rules for insurance companies. Risk-based capital requirements for insurance companies are being introduced, while the detailed investment restrictions that were previously stip-ulated in asset management regulations, as well as capital adequacy rules 1), cease to apply.
EU legislation on pension funds Pension funds are not subject to the Solvency II regula-tions, but have a separate set of rules (IORP) 2). The EU put forward a new draft Directive (IORP II) in 2014, with antic-ipated entry into force at the end of 2016. The draft intro-duce stricter requirements for the pension funds in areas such as governance and risk evaluation, while allowing for the loosening of detailed regulation regarding investment activities. The current EU regulations contain no specific capital requirements for pension funds beyond those found in the Solvency I rules, but allows member states to choose to impose stricter capital requirements.
The Financial Supervisory Authority of Norway’s proposed capital requirementsIn Norway the FSA has previously required pension funds to prepare stress tests based on a Solvency II method-ology. The stress tests do not lead into binding capital requirements for the funds, but are used by FSA as a supervisory tool.
In a letter dated 01.27.2016 the FSA proposes to the Ministry of Finance that Norwegian pension funds should be subject to the Solvency-based capital requirements in the future on an equal footing with insurance companies. The main reason for the proposal is to avoid distortion of competition between companies engaged in similar activ-ities, and that it will probably take time for the new capital requirements for pension funds under IORP to come into place. The Ministry of Finance has asked the FSA to prepare a consultation draft of the proposed change by the end of June 2016. The proposal is expected to be implemented in 2018 at the earliest. The Pension Scheme for the Pharmacy
Sector is not obligated to report to the Financial Super-visory Authority of Norway, but calculates and reports on quarterly stress tests to the Board of Directors based on the same methods as stipulated by the Financial Supervisory Authority of Norway.
At the same time EIOPA (The European Insurance and Occupational Pensions Authority) has indicated that it does not expect Solvency II¬based binding capital requirements for European pension funds in the near future. However, in a statement from April 2016 the EIOPA proposes an arrangement quite similar to current Norwegian practice, where pension funds will be required to present their balance sheet on the basis of market assessments as well as to prepare Solvency II-based stress tests. These tests shall not form the basis for binding capital requirements, but will be used as a supervisory tool – and the funds will be obliged to publish the result of the tests.
The Pension Scheme for the Pharmacy Sector: Comprehensive risk considerationBack in 2009 the Pension Scheme for the Pharmacy Sector adopted an investment strategy based on an overall risk consideration for the scheme, where the risk level is set based on financial goals for the scheme as a whole. Moreover, for several years the Pension Scheme for the Pharmacy Sector has been emphasizing that asset management should be undertaken in a professional manner, and that as far as possible governance systems should follow regulatory requirements. The pension scheme is therefore well equipped to meet future regulatory requirements for the industry.
1) The capital adequacy rules prescribed minimum capital requirements based on the composition of the investments.2) IORP stands for Institutions for Occupational Retirement Provision.
THE PENSION SCHEME FOR THE PHARMACY SECTOR / ANNUAL REPORT 201515
The actuarial provisions in the Pension Scheme for the Pharmacy Sector increased by NOK 166 million in 2015. As at 31.12.2015 the pension liabilities were estimated to be NOK 6,644 million.
The actuarial calculations of the pension liabilities are based on the assumption that the Pension Scheme for the Pharmacy Sector will continue to operate as long as liabilities towards its members exist as at 31.12.2015.
The year’s underwriting result is calculated to be NOK 575 million before allocations to the securities adjust-ment reserve and other specified allocations. This results in overfunding as at 31.12.2015 of NOK 1,294 million or 20 per cent of the total premium reserve. We therefore see, as in 2013 and 2014, that the effect of increased premium income and good returns resulted in a good financial position for the pension fund. The overfunding represents the scheme’s equity, and means that the pension fund is better equipped to meet challenges con-nected with increasing reserves and buffer capital related to capital adequacy requirements (Solvency II) and the new mortality tariff (K2013).
Insurance resultThe insurance result is positive and can be split into three different results: interest result, risk result and other result.
Interest result – NOK 3 millionThe investment result was fairly positive, which means that actual returns were higher than the basis interest rate of 3 per cent. Actual returns for 2015 were under 3 per cent. The reason that the interest rate result was fairly positive even though returns were somewhat less than basis interest rate, is due to the fact that the pension funds are higher than the premium reserve.
Risk result – NOK 49 millionThe risk result was positive. A major contributory reason for this was the new rules for disability pensions. The risk result is expected to fluctuate somewhat from year to year, but after the strengthening of the mortality tariff, the disability tariff and changes to the disability product, the risk result is expected to be positive in coming years.
Other result – NOK 522 millionThe difference between the premium invoiced to the pension scheme and the system-calculated premium necessary with regard to the events which have occurred in 2015 appears as a separate result in the insurance statement.. For 2015 this item is strongly influenced by the changed disability product, low salary and pension regulation as well as an improvement in the premium reserve calculation for members with several policies. None of these non-recurring effects were considered in the premium rate.
Assessment of the current financial situationThe financial situation for the pension fund is now satisfactory as a result of the improved buffer capital in 2013, 2014 and 2015. In addition the tariffs have been
strengthened during these years. The strengthening of the mortality tariff K2005, with a security margin of 15 per cent was the final stage in the strengthening of tariffs carried out in recent years.
The mortality tariff must be strengthened further in coming years, as a result of the decision by the Financial Supervisory Authority of Norway to introduce K2013 for collective pension insurance in life insurance companies and pension funds with effect from 01.01.2014. The financial services industry has been given up to 7 years to increase provisions, starting in 2014. It has been decided that the Pension Scheme for the Pharmacy Sector shall also make provisions for K2013, even though the pension fund is not directly subject to the requirements of the Financial Supervisory Authority of Norway. The first stage in building up to K2013 is the strengthened K2005 with a 15 per cent safety margin, which was completed in 2014. However it is not appropriate to implement K2013 before the ratios for younger groups are available. But approxi-mate provisions will be made until implementation.
The finalized rules for the new disability pension for public sector pension schemes was adopted by the Norwegian Parliament with effect from 01.01.2015. This has reduced the disability provisions for the scheme for 2015. As rec-ommended by the actuary the reduction was transferred to buffer capital to meet the requirements of Solvency II and K2013.
PENSION LIABILITIES

THE PENSION SCHEME FOR THE PHARMACY SECTOR / ANNUAL REPORT 201516
INVESTMENT MANAGEMENT
Investment management delivered a value-adjusted return of 2.4 per cent in 2015. Funds under management increased by more than NOK 500 mil-lion during the year, and totaled NOK 7.79 billion at the end of December.
The investment management activities of the Pension Scheme for the Pharmacy Sector are intended to help the scheme meet its long-term commitments without incurring too great fluctuations in the premium. The aim is to seek to achieve the highest possible return within the scheme’s available risk capacity. Available risk capacity is determined on the basis of the probability to be able to maintain continued ordinary operations.
The Pension Scheme for the Pharmacy Sector’s invest-ment strategy has been adopted by the Board of Directors of the scheme. This strategy stipulates that the chosen investment portfolio must have a risk profile that means that the probability of meeting the legally-required equity requirement is at least 99 per cent. The spread of the pension scheme’s investments currently reflects the goal of achieving a satisfactory long-term return on capital in combination with a high level of diversification – in other words, spreading risk by investing in a range of different assets.
ResultsLast year was a relatively challenging year in the financial market. Risk-free interest rates were low and the stock markets were volatile, particularly in the last half of the
year. The overall return on the pension scheme’s funds for 2015 was 2.37 per cent (value-adjusted). The time-weighted return for the whole portfolio was 2.39 per cent. Real estate investments and investments in hold-to- maturity bonds made a strong contribution to overall returns. Shares and hedge funds made a moderate con-tribution measured in local currency. A large proportion of share and hedge fund investments are nominated in USD. While part of this exposure is hedged against currency fluctuations, the strengthening of the dollar throughout the year has resulted in an unrealized foreign currency gain when converting to NOK. This made a positive contri-bution to the Pension Scheme for the Pharmacy Sector’s result for 2015. In previous years, credit exposure in the available-for-sale portfolio has made a good contribution to returns, but in 2015 this had a negative effect on the portfolio. Returns on interest-bearing investments in the available-for-sale bond portfolio are therefore slightly negative for the year as a whole.
Asset class:Weight
31.12.2015Rate of return
Interest-bearing investments (available-for-sale)
52.6% -0.6%
Interest-bearing investments (hold-to-maturity)
10.3% 6.0%
Shares 15.9% 1.5%Real estate 12.0% 7.9%Hedge funds/Special funds 7.0% 1.9%Loans to members 1.8% 2.5%Bank deposits, derivatives 0.4%
-10
-5
0
5
10
15
2015201420132012201120102009200820072006
Per cent
Annual return POA

THE PENSION SCHEME FOR THE PHARMACY SECTOR / ANNUAL REPORT 201517
Fluctuations in returns are entirely normal and to be expected for an investment portfolio with a moderate level of risk, such as that of the Pension Scheme for the Pharmacy Sector. The figure on the previous page shows the annual time-weighted return for the pension scheme’s funds for the last 10 years. As shown in the figure, the Pension Scheme for the Pharmacy Sector has only experienced one single year with a negative return during this period, at the start of the financial crisis in 2008. The average return for the 10 year period is 4,8 per cent.
Challenges facing the pension fundsRecent years have been challenging for providers of defined benefit pension schemes. Norwegian interest rates have remained low following the financial crisis of 2008. For many years, Norwegian wage inflation has been high compared with other countries. This situation has led to pension liabilities growing much faster than pension funds in recent years.
In the last year the calculated Norwegian interest rate curve for the 16-17 year perspective was well under 3 per cent, which is the basis interest rate many pen-sion schemes – including the Pension Scheme for the Pharmacy Sector, use. This has a significant effect on the assessment of the market value of insurance liabilities and results in the calculated capital adequacy require-ment of the Solvency II¬based stress tests increasing.
Asset allocation and outlook for 2016At the end of 2015, the pension scheme managed funds totaling NOK 7,796 million. This is an increase of NOK 498 million throughout the year. Assets under management are still expected to grow throughout 2016 as a result of excess liquidity in the scheme.
The asset allocation strategy for 2016 has been set to maintain an overall medium risk profile for the pension scheme through a portfolio based on diversification over multiple asset classes with different risk levels and
expected returns. A very low interest rate means that expectations are of moderate rates of return in the future. Persistent low interest rates will make it increasingly challenging to find asset classes that give good returns without the risk being too high.
Investment management has a continuous focus on identifying the investment opportunities that offer the best utilization of the risk capacity of the Pension Scheme for the Pharmacy Sector. In recent years it has been necessary to take a different direction to find assets that give good returns for taking moderate risk. Throughout 2015 the strategy for hold-to-maturity investments has been revised, and allocation to this asset class has thus been increasing markedly throughout 2015 and into 2016. The equity management strategy has also been altered somewhat at the start of 2016 to further reduce the con-centration risk related to individual Norwegian companies and sectors. Infrastructure appears to be a very attractive asset class for pension schemes, and in 2015 manage-ment worked to ensure that the Pension Scheme for the Pharmacy Sector has access to this class in the same way as other market operators. In 2016 management will continue to work on including infrastructure in the Pension Scheme for the Pharmacy Sector’s investment universe.
The figure on the right shows strategic allocations in the various asset classes at the beginning of 2016.
Cash 1.5%Hedge funds/special funds 6% Loans 1.5%Bonds (hold-to-maturity) 12.0% Bonds (available-for-sale) 52.0% Real estate 12.0% Shares 15.0%
5',(%"6#&-'#('78'+",*%&-'#('.%'*,9'9,--#"'1$2"%+%&*:,&'$"#';<=>'?#"'%&'1$2"%0"#.'+4'@88'+",*%&-A'B1&'C'+",*%&-'#('1$2"%3%*-#&.%&'?#"'1$2"%0"#.'9%//,9'78'D'EE'+",*%&-A'F%&*'GHI'#('1$2"%+%&*:,&)*-%&%'?#"'%&'1$2"%0"#.'+4'9)&."%'%&&'78'+",*%&-''5'9,-*%-&)&0'-)/'$,/6%-"J0.%&'6#&';%&*:,&*,".&)&0%&'$,"'#+,-%6()"6*,9?%-')&&()/0%'/#(%"%'1$2"%0"#.'%&&'78'IA'
Strategic allocations in the various asset classes

ANNUAL REPORT

THE PENSION SCHEME FOR THE PHARMACY SECTOR / ANNUAL REPORT 201519
ANNUAL REPORT 2015 FOR
THE PENSION SCHEME FOR THE PHARMACY SECTORIn 2015 the Pension Scheme for the Pharmacy Sector achieved a result of NOK 262 million. The time-weighted return for the whole portfolio was 2.4 per cent. The solidity of the Pension Scheme for the Pharmacy Sector strengthened during 2015.
The pension scheme is managed by the Norwegian Public Service Pension Fund (SPK) in Oslo. At the end of 2015 the pension scheme had three male employees. All the employees are investment managers. The continuous fol-low-up of the employees is carried out by the Norwegian Public Service Pension Fund.
No discrimination shall occur on the grounds of gender, race, age or ethnic background in the Pension Scheme for Pharmacy Sector.
The pension scheme has guidelines for ethically responsible investments. These guidelines are based on the guidelines for the Folketrygdfondet (Government Pension Fund-do-mestic). In addition the pension scheme has resolved to use KLP’s list of excluded companies as the basis for determin-ing companies in which the pension scheme shall not invest.
As at 31.12.2015 the board of directors had five members. The Board of Directors is led by the CEO of the Norwegian Public Service Pension Fund. The other board members rep-resent the Hovedorganisasjonen Virke, the Spekter Employ-ers’ Association, the Norwegian Association of Pharmacists and the Norwegian Association of Pharmacy Technicians. During the year the board of the pension scheme held six board meetings and dealt with 51 items of business.
The pension scheme’s operations do not affect the exter-nal environment.
Members, contributions and benefit paymentsAt the 2015 year-end employees at 834 pharmacies were members of the pension scheme. This is an increase of 34 pharmacies from 2014. The pension scheme also includes members who are not pharmacy employees but who work in other positions associated with the pharmacy sector. The fund had a total of 7,585 actively contributing mem-bers, as well as 4,951 current pensioners. In 2015, NOK 643 million was paid in premium, compared to NOK 588 million in 2014. In addition, NOK 279 million was paid in pensions, compared to NOK 264 million in 2014. Invoiced but not paid premiums constituted a total of NOK 149 million at the turn of the year.
The premium rate was 18.1 per cent in 2015. The premium is divided between employees and employers. Employees paid a premium of 3.4 per cent of the contribution base, while employers paid a premium of 14.7per cent .
In 2015 the pensions were adjusted based on a factor of 1.92 per cent. In the same way as for National Insur-ance a fixed factor of 0.75 per cent is deducted from the adjustment of the majority of pensions. This resulted in a minimum increase of the total pension of 1.16 per cent.
Financial riskThe board has adopted an investment strategy that clearly delineates which risks may be taken and which investments may be made. The strategy outlines that
capital should be invested with a long-term perspective and with a moderate level of risk. As at 31.12.2015 the proportion of shares, equity funds, hedge funds and special-funds was 22 per cent of the total assets. In the opinion of the board, the scheme’s investment strategy and authorization structure provide a good level of control over the management of the scheme’s assets.
Some bonds classified as hold-to-maturity matured in 2015. At year-end the portfolio of long-term bonds represents 10 per cent of total assets. This proportion has doubled compared with the previous year. Current returns from this portfolio are around 4.7 per cent.
Insurance riskRisk management on the investment side and risk man-agement in relation to the actuarial provisions reserves are viewed together. The actuarial provisions are commit-ments with a long time frame. Generally speaking, capital should therefore be invested with a long-term perspective.
The technical settlement for 2015 is based on the K2005 life expectancy tariff with a basic interest rate of 3 per cent. A 15 per cent safety margin supplement for mortality related to the K2005 tariff is included. The assumption for rates of disability was based on K1963, boosted by a factor of 2.5.
Result The result for the year shows a profit of NOK 262 million. Net profits related to financial assets stood at NOK 176 million. This includes changes in unrealized gains and losses. All asset classes, apart from interest-bear-

THE PENSION SCHEME FOR THE PHARMACY SECTOR / ANNUAL REPORT 201520
ing securities in the available-for-sale portfolio, have contributed positively to the return for 2015 as a whole.
Provisions have been made for unrealized price gains of NOK 69 million to the securities adjustment reserve in 2015. This has reduced the profit for 2015 accordingly.
In 2015 a total increase in pension liabilities (the premium reserve) was recorded of NOK 166 million. Growth in the number of active members, pensioners and members with deferred rights, as well as salary increases and the regulation of current pensions all contribute to the rise in liabilities.
This year’s profit of NOK 262 million will be allocated to other retained earnings.
Financial positionAs at 31.12.2015 the Pension Scheme for Pharmacy Sec-tor had total capital of NOK 8,013 million. Approximately 61 per cent of total capital was placed in bonds and bond funds, 22 per cent in shares, equity funds, hedge funds and special funds, 12 per cent in property and real estate, 2 per cent in loans and 1 per cent in bank deposits, while other items account for 2 per cent of the total.
As at 31.12.2015 other retained earnings totaled NOK 801 million. This is an increase of NOK 262 million from 2014. The pension scheme calculates capital requirements based on the rules that apply to private pension funds. As at 31.12.2015 the calculated capital adequacy requirement totaled NOK 426 million. The capital adequacy require-ment must be covered by other retained earnings.
The scheme’s free equity consists of other retained earn-ings in excess of the capital adequacy requirement. Free equity totaled NOK 375 million at the end of the year. This is buffer capital necessary to cover random risks that are not covered by the premium. The buffer capital is equiva-lent to 4.7 per cent of total equity.
As at 31.12.2015, NOK 494 million in net unrealized price gains was allocated to the securities adjustment reserve. The securities adjustment reserve operates as a buffer against possible future falls in market prices.
The pension scheme calculates capital requirements based on the Financial Supervisory Authority of Norway’s stress tests on assets in accordance with similar rules which apply to private pension funds. The stress tests demonstrate the scheme’s ability to bear losses without this threatening the ordinary operations of the scheme.
The technical reserves have risen strongly in recent years and show continued growth in 2015. The new mortality tariff (K2013) resulting from the increase in life expectancy will further increase the provisions required. New regulations for disability pension were introduced on 01.01.2015. In this connection premium reserve was released and used for provisions for increased longevity and expected increased capital requirements as a result of the new capital require-ments for pension funds.
Buffer capital was strengthened during 2015. Moderate growth in technical reserves and measures previously decided by the Board related to premium payments con-tributed to this together with the return on the securities portfolio. The (time-weighted) return of 2.4 per cent in 2015 was lower than that which was used in calculations at the beginning of the year, but somewhat better than the comparable reference index.
The growth in technical reserves together with low interest levels makes ensuring satisfactory buffer capital within the scheme a challenging task. However, the measures previously implemented by the board of direc-tors contribute to ensuring the continued improvement of the capital situation for the scheme in the future.
SummaryThe annual financial statements have been prepared under the going-concern assumption. As at 31.12.2015 the pension scheme had set aside technical reserves in accord-ance with the provisions of Act no. 11 of 26 June 1953 concerning the pension scheme for the pharmacy sector.
In the opinion of the board, the annual financial state-ments for the Pension Scheme for the Pharmacy Sector provide a satisfactory basis for assessing the results of the pension scheme’s operations during 2015 and the scheme’s financial position at year-end.
The buffer capital was strengthened during the year and as at 31.12.2015 meets capital requirements based on the Financial Supervisory Authority of Norway’s stress tests with moderate stress factors. Low interest rates, together with the growth in pension liabilities create a challenge for the Pension Scheme for the Pharmacy Sector and for the industry in general. This means that it will be chal-lenging to secure a satisfactory financial position for the pension scheme in the future.
The board of directors is of the opinion that the financial position at the end of the year is satisfactory. Together with the adopted investment strategy the board of directors is of the opinion that this provides a satisfactory basis for meeting the challenges facing the industry. The requirements for the going-concern assumption are accordingly satisfied.
Oslo, 21 April 2016
Finn Melbø (chairman)
Stein Gjerding Greta Torbergsen
Ann Torunn Tallaksen Renate Messel Hegre

THE PENSION SCHEME FOR THE PHARMACY SECTOR / ANNUAL REPORT 201521
ANNUAL FINANCIAL STATEMENTS

22
Note 2015 2014TECHNICAL ACCOUNTPremium incomePremium income 15 639 869 838 593 186 172
Net income from investments in the collective portfolioInterest income and dividends, etc. on financial assets 164 052 489 168 131 729Net operating income from real estate fund 48 446 124 36 684 069Value adjustments on investments 69 795 523 135 616 669Realized gains and losses on investments -112 230 003 84 012 956Total net income from investments in the collective portfolio 19 170 064 133 424 445 424
Insurance benefitsPensions paid 16 279 046 259 264 356 483
Recognized changes in insurance liabilitiesChange in premium reserve 11 165 822 000 530 320 000Change in exceptional liabilities 0 0Change in securities adjustment reserve 68 852 273 133 483 744Total recognized changes in insurance liabilities 20 234 674 273 663 803 744
Insurance-related operating costsAdministrative costs 17 25 160 937 20 749 621Insurance-related administrative costs 18 15 262 395 14 790 355Total insurance-related operating costs 40 423 332 35 539 976
Technical result 255 790 107 53 931 393
Note 2015 2014NON-TECHNICAL ACCOUNTNet income from investments in company portfolioInterest income and dividends, etc. on financial assets 5 948 100 9 142 594Net operating income from real estate fund 1 756 525 1 994 790Value adjustments on investments 2 530 597 7 374 504Realized gains and losses on investments -4 069 156 4 568 420Total net income from investments in the company portfolio 19 6 166 066 23 080 308
Other incomeInterest income on bank deposits, operations 754 966 174 243
Administrative costs and other costs linked to the company portfolioAdministrative costs 17 867 891 1 194 881
Non-technical result 6 053 141 22 059 670
Total result 261 843 248 75 991 063
Transfers and allocationsAllocated to/transferred from(-) other retained earnings 12, 13, 20 261 843 248 75 991 063
Total allocations 261 843 248 75 991 063
Financial statements 2015
THE PENSION SCHEME FOR THE PHARMACY SECTOR / ANNUAL REPORT 2015

23
Note 31.12.2015 31.12.2014ASSETS IN COMPANY PORTFOLIOINVESTMENTSFinancial assets valued at mortised costBonds classified as hold-to-maturity 2 28 303 765 14 560 143Housing and business loans 3 4 751 222 6 835 831Total financial assets valued at mortised cost 33 054 988 21 395 974
Financial assets at fair valueShares and mutual funds 4, 7 95 421 722 91 935 545Bonds 5, 7 143 736 817 163 599 348Financial derivatives 6, 7 0 335 222Bank deposits 1 559 960 1 308 442Total financial assets at fair value 240 718 499 257 178 557
Total investments in company portfolio 273 773 486 278 574 531
ReceivablesAccounts receivables 9 149 291 979 152 021 474Receivables from brokers 0 30 775 059Total receivables 149 291 979 182 796 532
Other assetsBank deposits, operations 8 39 645 723 6 656 873
Prepaid expenses and accrued incomeAccrued non-invoiced premiums 9 054 430 9 550 000Accrued dividends 5 956 609 4 974 657Prepaid expenses 48 760 51 675Total prepaid expenses and accrued income not received 15 059 799 14 576 332
Total assets in company portfolio 477 770 988 482 604 269
Note 31.12.2015 31.12.2014ASSETS IN CLIENT PORTFOLIOSINVESTMENTS IN COLLECTIVE PORTFOLIOFinancial assets valued at mortised costBonds classified as hold-to-maturity 2 779 046 119 370 746 558Housing and business loans 3 130 774 872 174 061 529Total financial assets valued at mortised cost 909 820 991 544 808 088
Financial assets at fair valueShares and mutual funds 4, 7 2 626 432 253 2 340 965 060Bonds 5, 7 3 956 279 595 4 165 748 498Financial derivatives 6, 7 0 8 535 802Bank deposits 42 937 061 33 316 998Total financial assets at fair value 6 625 648 908 6 548 566 358
Total investments in collective portfolio 7 535 469 900 7 093 374 446
Total assets in client portfolios 7 535 469 900 7 093 374 446
Total assets 8 013 240 887 7 575 978 715
Balance sheet / Assets
THE PENSION SCHEME FOR THE PHARMACY SECTOR / ANNUAL REPORT 2015

24
Note 31.12.2015 31.12.2014Retained earningsOther retained earnings 10, 12 800 643 742 538 800 494Total retained earnings 10, 13, 14 800 643 742 538 800 494
Insurance liabilitiesPremium reserve 11 6 644 038 000 6 478 216 000Securities adjustment reserve 493 645 873 424 793 600Total insurance liabilities 7 137 683 873 6 903 009 600
LIABILITIES IN COMPANY PORTFOLIOFinancial liabilities measured at fair valueFinancial derivatives 6 2 171 539 4 615 860
Accrued expenses and prepaid incomeAccrued expenses 3 576 488 12 018 589
LIABILITIES IN CLIENT PORTFOLIOSFinancial liabilities measured at fair valueFinancial derivatives 6 59 770 462 117 534 170
Accrued expenses and prepaid incomeAccrued expenses 9 394 782 0
Total equity and liabilities 8 013 240 887 7 575 978 714
Balance sheet / Equity and liabilities
Oslo, 21 April 2016
Finn Melbø (chairman)
Stein Gjerding Greta Torbergsen Ann Torunn Tallaksen Renate Messel Hegre
THE PENSION SCHEME FOR THE PHARMACY SECTOR / ANNUAL REPORT 2015

25THE PENSION SCHEME FOR THE PHARMACY SECTOR / ANNUAL REPORT 2015
2015 2014Cash flow from operationsContributions from members 642 897 782 587 656 064Bank interest 1 339 451 1 490 444Interest income on loans 4 487 971 6 732 837Interest on bonds/certificates 150 462 240 156 314 627Dividends 14 256 587 12 786 308Other income 1 111 050 2 893 615Total 814 555 081 767 873 895
Financial expenses paid -5 060 404 -2 024 498Pensions paid -279 046 259 -264 356 483Administrative expenses -36 521 334 -34 838 885Change in accounts payable 102 156 2 745 241Changes in other liabilities 850 526 -677 788Total -319 675 314 -299 152 412
Total cash flow from operations 494 879 766 468 721 483
Cash flow from investmentsNet realized losses/gains on shares/derivatives/hedge funds -120 284 668 37 236 878Net realized price gains on bonds/certificates 4 542 017 51 344 498Net realized returns on real estate fund 50 202 650 38 678 860Net change in loans 45 323 387 25 441 180Net losses on loans 0 354Net change in real estate fund -62 019 127 -237 348 994Net change in securities -395 209 246 -545 974 720Net change in other receivables 25 425 651 -25 138 862Total cash flow from investments -452 019 336 -655 760 806
2015 2014
Cash flow from financing activitiesPaid in capital 0 0Total cash flow from financing activities 0 0
Net cash flow for the period 42 860 430 -187 039 323
Cash and cash equivalents 01.01. 41 282 313 228 321 636Cash and cash equivalents 31.12. 84 142 743 41 282 313Net change cash and cash equivalents 42 860 430 -187 039 323
Cash flow statement

THE PENSION SCHEME FOR THE PHARMACY SECTOR / ANNUAL REPORT 201526
NOTES

27
NotesNote 1 | Accounting principles
Wherever possible the annual financial statements have been prepared in accordance with the Regulation of 20.12.2011 on annual financial statements etc. for pension companies and with the Norwegian Accounting Act that came into force on 01.01.1999.
Pension premiumsPension premiums are recorded as income as they accrue. Pension premiums are paid in each quarter in arrears.
Interest incomeInterest is recorded as income as it accrues.
Financial assets valued at mortised costBonds classified as held-to-maturity are valued at cost price, adjusted for recognized premium/discount. The pre-mium/discount at the acquisition date is recognized in the income statement spread over the bond’s remaining life.
Housing and business loans are recorded at par value as at 31.12.2015.
Financial assets at fair valueShares and mutual fundsInvestments in shares and mutual funds are booked at fair value as at 31.12.2015. Changes in value are recog-nized in the income statement. Fair value is equivalent to the market value as at 31.12.2015. Market value is based on the last official trade in 2015.
Shares in the real estate fund are included in shares and mutual funds. Shares are valued at the market value as at 31.12.2015. The market value is based on independent valuations of the properties.
Shares in the infrastructure fund are also included in shares and mutual funds. The infrastructure fund has calculated the value of the shares as at 31.12.2015 in accordance with the industry standard.
BondsInvestments in bonds are booked at fair value as at 31.12.2015. Changes in value are recognized in the income statement. Fair value is equivalent to the market value as at 31.12.2015. Market value is equivalent to the tax assessment value for 2015.
Financial derivativesForeign currency forward contracts and options are booked at fair value as at 31.12.2015. Fair value is equiva-lent to the market value as at 31.12.2015.
Securities that are valued at fair value are considered a single portfolio. The unrealized gain or loss in the portfolio is designated as the difference between the total acqui-sition cost and the total market value. Any net unrealized gain in the portfolio is allocated to the securities adjust-ment reserve. Any net unrealized loss in the portfolio is recognized as an expense in the income statement.
Foreign currencyBank deposits together with receivables and liabilities designated in foreign currencies are recorded using exchange rates as at 31.12.2015.
Insurance liabilities The calculations are based on the assumption that the pen-sion scheme will continue to operate as long as obligations exist towards its members as at 31.12.2015. Accordingly, account has been taken of all potential pension benefits provided for in the Act on the pension scheme for the phar-
macy sector, both current benefits and benefits that may be relevant in the future. Account has also been taken of the contractual pension scheme (AFP) that allows the drawing of a pension from the age of 62, subject to certain criteria.
The cash value of all scheme members’ pensions has been calculated on the basis of membership status at the balance sheet date (31.12.2015). This calculation has been carried out using standardized actuarial princi-ples, and allowance has been made for discounting and calculation of risk. The calculations are based on a linear accrual of pension benefits from initial employment until retirement, subject to adjustment for any additional periods during which the member may previously have accrued pension entitlements.
The actuarial assumptions of mortality in the case of longevity risk and mortality for mortality risk are based on the basis elements in K2005. Mortality in the case of longevity risk is also strengthened with a 15 per cent safety margin for both genders.
The assumption for rates of disability is based on K1963, boosted by a factor of 2.5.
Retained earningsRetained earnings consist of Other retained earnings. Other retained earnings comprise the pension scheme’s excess capital in relation to the pension scheme’s commitments. As a minimum the equity must cover the estimated capital adequacy requirement. The capital adequacy requirement is described in more detail in Note 14. Other retained earnings in excess of the capital ade-quacy requirement are defined as free equity. There are no guidelines limiting the application of free equity in the Pension Scheme for Pharmacy Sector.
THE PENSION SCHEME FOR THE PHARMACY SECTOR / ANNUAL REPORT 2015

28
Note 2 | Bonds classified as hold-to-maturity
Figures in NOK 1,000 Issuer
Par value
Cost price
Book value
Market value
Difference between
book and par value
Government-guaranteed 100 000 90 490 96 000 110 010 4 000Banking/finance 235 000 229 910 234 149 243 285 851Municipality/county 25 000 23 835 23 850 23 625 1 150Industry 314 783 314 783 314 783 316 485 0Energy 125 000 124 410 124 416 123 198 584
Bonds classified as hold-to-maturity: 799 783 783 428 793 199 816 602 6 584Interest earned 14 151 14 151Total book value 799 783 783 428 807 350 830 753 6 584
Proportion of above in the colle-ctive portfolio
779 046
Proportion of above in the company portfolio
28 304
Book value 1.1.2015: 385 307Additions 2015: 468 053Disposals 2015: -52 217Accrued premium/discount for the year:
1 798
Change in accrued interest 2015: 4 409Book value 31.12.2015: 807 350
All bonds classified as hold-to-maturity are listed on regulated marketplaces. All bonds are issued in NOK. The weighted average yield on bonds classified as hold-to-maturity is 4.7 per cent. The average yield is calculated on the average yield for each bond. The average yield is weighted in relation to the relevant security’s par value and added up. The difference between book and par value is recognized in the income statement over the remaining life of the bond.
Note 3 | Housing and business loans The pension scheme provides loans to its members. Housing and business loans are recorded at par value as at 31.12.2015. Past lending losses have been extremely small.. No allowances are thus made for possible loan losses.
Borrowers with housing loans are partially covered by credit insurance for which the pension scheme has self-insurance arrangements. No provisions have been made for potential claims as at 31.12.2015, since the number of claims and the sums relating to them have been low in recent years.
Specification of the loan portfolio:
Housing loan
Government- guaranteed
debenture loan
Loans for pharmacy premises Total
Number 213 2 1 216Amount 134 443 595 1 059 699 22 800 135 526 094
Proportion of above in the collective portfolio:
130 774 872
Proportion of above in the company portfolio:
4 751 222
The interest rate for housing loans was 2.70 per cent as at 31.12.2015. For Government-guar-anteed debenture loan and loans for pharmacy premises the interest rates was 3.20 per cent.
Losses etc. on loans 2015 2014 2013 2012 2011Principal written off 0 354 0 0 0Principal written off, credit insurance 0 0 27 290 0 0Interest written off 0 0 0 0 592Interest written off, credit insurance 0 0 152 0 0Previous payments written off 0 0 0 0 0Total 0 354 27 442 0 592
THE PENSION SCHEME FOR THE PHARMACY SECTOR / ANNUAL REPORT 2015

29
Note 4 | Shares / fund shares
Shares listed on the Oslo Stock Exchange
Company Cost price Book valueAf Gruppen Ord 10 547 855 17 739 518Aker 12 197 908 10 004 000Aurora Lpg Holding 11 274 398 11 247 730Borregaard Asa 12 981 119 16 865 407Cxense Asa 14 271 759 13 910 000Dnb Asa 6 640 463 11 612 448Ekornes Asa 11 622 586 13 406 929Entra Asa 8 900 541 8 906 250Europris Asa 13 500 000 12 900 000Gentian Technology As 4 500 048 4 500 048Gjensidige Forsikring Asa 11 509 063 18 473 000Kongsberg Gruppen Asa 14 423 016 16 795 350Marvine Harvest Asa 5 605 447 10 167 196Next Biometrics Group As 5 443 588 10 800 000Nextgentel Holding Asa ((formerly Telio Holding Asa) 8 233 935 6 675 500Nordic Nanovector Asa 8 298 773 3 384 000Nordic Vlsi 8 206 657 9 515 000Norwegian Air Shuttle 10 258 703 13 738 475Opera Software Asa 6 855 754 5 346 977Pioneer Property Group Asa 12 500 000 12 125 000Q-Free 7 233 162 5 837 150Renonorden Asa 6 362 347 4 657 500Ringerike Sparebank 6 493 537 7 208 136Salmar 3 876 989 10 075 000Schibsted Asa Class B 2 632 754 9 368 823Skandiabanken Asa 8 050 000 8 557 500Sparebanken Midt Norge 6 785 205 6 312 500Sparebanken Vest 5 927 180 5 378 800Telenor Asa 3 914 903 9 639 500Vistin Pharma As 8 601 415 10 700 000Weifa Asa 6 263 080 4 408 861Weifa Asa Transje 2 200 000 188 000
Company Cost price Book valueXxl Asa 14 826 479 18 360 000Yara International 10 484 437 14 246 560Total Norwegian shares 289 423 098 343 051 157
Asetek As 12 583 686 13 320 000Bakkafrost 2 213 418 7 278 040Bw Lpg Ltd. 7 935 720 8 760 000Hoegh Lng Holdings Ltd 12 801 841 12 968 800Tanker Investments Ltd 9 592 898 10 036 250Total foreign shares 45 127 562 52 363 090
Total shares listed on the Oslo Stock Exchange 334 550 661 395 414 247
Equity fundsFund Cost price Book valueBlackRock World Index Fund 229 466 126 547 030 677State Street World Index Plus Fund CTF 158 306 960 295 637 437Total foreign equity funds 387 773 086 842 668 114
Hedge funds/Special fundsFund Cost price Book valueArchmore Infrastructure Debt Platform SCA 62 877 806 68 733 614Aristeia International Ltd A 889 653 1 150 936Axonic Systematic Arbitrage Overseas Fund Ltd 23 124 869 26 962 701Blue Mountain Credit Alt Ltd Class S January 2015 264 091 313 705BlueMountain Equity Alt Ltd Eligible January 2015 Rolled 478 171 609 494Canyon Balanced (Cayman), Ltd A Initial 1 658 931 1 828 468Capeview Recovery Fund 29 514 259 35 200 164Certificates Credit Suisse Guernsey branch 545 395 1 115 097Gamco Merger Arbitrage I:USD 33 613 887 35 585 801Gottex Market Neutral Fund 1 324 179 1 834 852Gottex Market Neutral Plus Fund 1 017 046 1 338 213GSS Offshore SPC Ellington 22 886 348 30 013 878LibreMax Offshore Fund, Ltd. A Tr G:1 192 250 263 852Lyxor Tiedemann Arbitrage Strategy Fund Class I USD 36 688 325 44 264 336
THE PENSION SCHEME FOR THE PHARMACY SECTOR / ANNUAL REPORT 2015
30
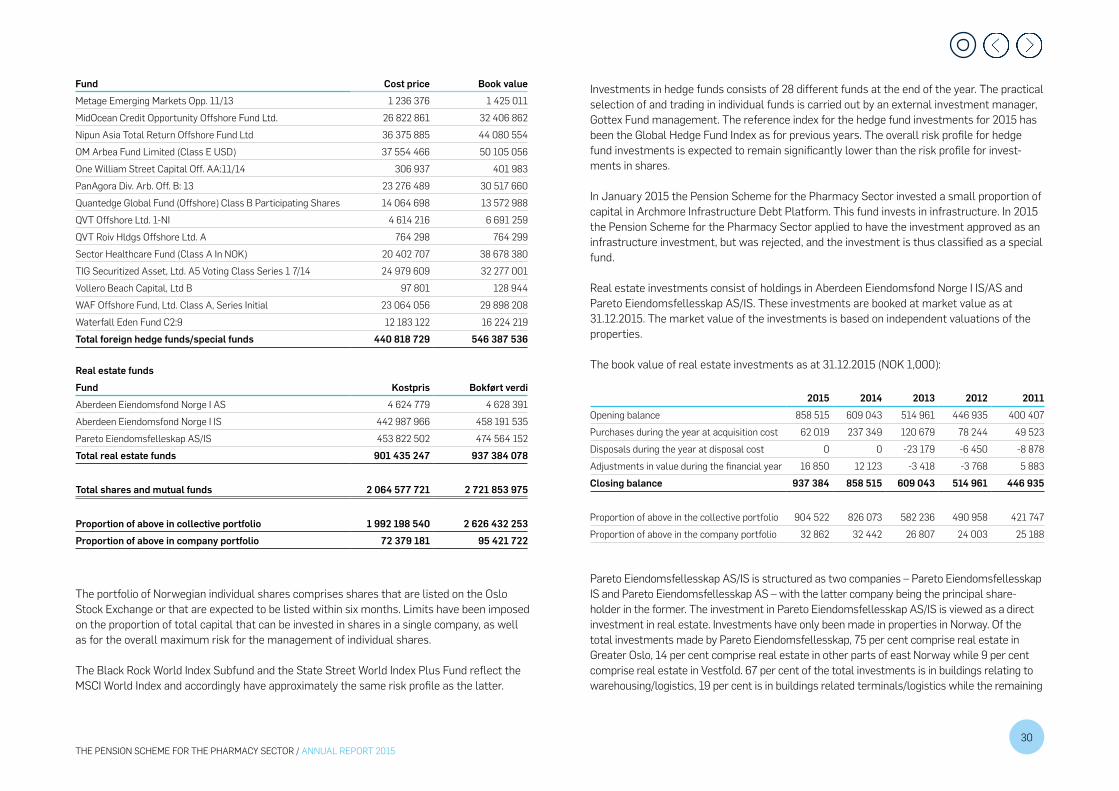
Fund Cost price Book valueMetage Emerging Markets Opp. 11/13 1 236 376 1 425 011MidOcean Credit Opportunity Offshore Fund Ltd. 26 822 861 32 406 862Nipun Asia Total Return Offshore Fund Ltd 36 375 885 44 080 554OM Arbea Fund Limited (Class E USD) 37 554 466 50 105 056One William Street Capital Off. AA:11/14 306 937 401 983PanAgora Div. Arb. Off. B: 13 23 276 489 30 517 660Quantedge Global Fund (Offshore) Class B Participating Shares 14 064 698 13 572 988QVT Offshore Ltd. 1-NI 4 614 216 6 691 259QVT Roiv Hldgs Offshore Ltd. A 764 298 764 299Sector Healthcare Fund (Class A In NOK) 20 402 707 38 678 380TIG Securitized Asset, Ltd. A5 Voting Class Series 1 7/14 24 979 609 32 277 001Vollero Beach Capital, Ltd B 97 801 128 944WAF Offshore Fund, Ltd. Class A, Series Initial 23 064 056 29 898 208Waterfall Eden Fund C2:9 12 183 122 16 224 219Total foreign hedge funds/special funds 440 818 729 546 387 536
Real estate fundsFund Kostpris Bokført verdiAberdeen Eiendomsfond Norge I AS 4 624 779 4 628 391Aberdeen Eiendomsfond Norge I IS 442 987 966 458 191 535Pareto Eiendomsfelleskap AS/IS 453 822 502 474 564 152Total real estate funds 901 435 247 937 384 078
Total shares and mutual funds 2 064 577 721 2 721 853 975
Proportion of above in collective portfolio 1 992 198 540 2 626 432 253Proportion of above in company portfolio 72 379 181 95 421 722
The portfolio of Norwegian individual shares comprises shares that are listed on the Oslo Stock Exchange or that are expected to be listed within six months. Limits have been imposed on the proportion of total capital that can be invested in shares in a single company, as well as for the overall maximum risk for the management of individual shares.
The Black Rock World Index Subfund and the State Street World Index Plus Fund reflect the MSCI World Index and accordingly have approximately the same risk profile as the latter.
Investments in hedge funds consists of 28 different funds at the end of the year. The practical selection of and trading in individual funds is carried out by an external investment manager, Gottex Fund management. The reference index for the hedge fund investments for 2015 has been the Global Hedge Fund Index as for previous years. The overall risk profile for hedge fund investments is expected to remain significantly lower than the risk profile for invest-ments in shares.
In January 2015 the Pension Scheme for the Pharmacy Sector invested a small proportion of capital in Archmore Infrastructure Debt Platform. This fund invests in infrastructure. In 2015 the Pension Scheme for the Pharmacy Sector applied to have the investment approved as an infrastructure investment, but was rejected, and the investment is thus classified as a special fund.
Real estate investments consist of holdings in Aberdeen Eiendomsfond Norge I IS/AS and Pareto Eiendomsfellesskap AS/IS. These investments are booked at market value as at 31.12.2015. The market value of the investments is based on independent valuations of the properties.
The book value of real estate investments as at 31.12.2015 (NOK 1,000):
2015 2014 2013 2012 2011Opening balance 858 515 609 043 514 961 446 935 400 407Purchases during the year at acquisition cost 62 019 237 349 120 679 78 244 49 523Disposals during the year at disposal cost 0 0 -23 179 -6 450 -8 878Adjustments in value during the financial year 16 850 12 123 -3 418 -3 768 5 883Closing balance 937 384 858 515 609 043 514 961 446 935
Proportion of above in the collective portfolio 904 522 826 073 582 236 490 958 421 747Proportion of above in the company portfolio 32 862 32 442 26 807 24 003 25 188
Pareto Eiendomsfellesskap AS/IS is structured as two companies – Pareto Eiendomsfellesskap IS and Pareto Eiendomsfellesskap AS – with the latter company being the principal share-holder in the former. The investment in Pareto Eiendomsfellesskap AS/IS is viewed as a direct investment in real estate. Investments have only been made in properties in Norway. Of the total investments made by Pareto Eiendomsfellesskap, 75 per cent comprise real estate in Greater Oslo, 14 per cent comprise real estate in other parts of east Norway while 9 per cent comprise real estate in Vestfold. 67 per cent of the total investments is in buildings relating to warehousing/logistics, 19 per cent is in buildings related terminals/logistics while the remaining
THE PENSION SCHEME FOR THE PHARMACY SECTOR / ANNUAL REPORT 2015

31
investments are in buildings relating to trade. The average weighted time remaining on lease agreements for properties in the portfolio fell during 2015 from 9.3 years to 9.1 years. At year-end 2015 gross rents for properties in the portfolio amounted to NOK 151 million.
Aberdeen Eiendomsfond Norge I IS/AS is structured as two companies – Aberdeen Eiendoms-fond Norge I IS and Aberdeen Eiendomsfond Norge I AS – with the latter company being the principal shareholder in the former. The investment in Aberdeen Eiendomsfond Norge I IS/AS is viewed as a direct investment in real estate. Investments have only been made in properties in Norway. Of Aberdeen Eiendomsfond Norge I IS/AS’ total investments, 53 per cent comprise real estate in Oslo, 13 per cent in Trondheim, 8 per cent in Bergen, 4 per cent in Stavanger and 22 per cent in other municipalities. The portfolio consists of 29 properties with around 300 different tenants. The average weighted time remaining on lease agreements for properties in the portfolio at the end of 2015 is 5.1 years, a slight decrease compared with the end of 2014. In 2015 gross rents for properties in the portfolio amounted to NOK 428 million.
None of the premises is occupied by the Pension Scheme for Pharmacy Sector.
Note 5 | Bonds
Issuer Cost price Market value Unrealized gainsBanking and finance 2 064 504 642 2 039 657 191 -24 847 450Municipality/county 555 038 030 555 264 600 226 570Government-guaranteed 53 205 909 57 189 000 3 983 091Industry 835 378 861 784 436 178 -50 942 682Energy 473 865 750 472 859 300 -1 006 450Subordinated loans 172 032 500 166 172 100 -5 860 400Total interest-bearing securities classified as financial current assets
4 154 025 692 4 075 578 370 -78 447 322
Interest earned 24 438 042Total 4 154 025 692 4 100 016 412
Proportion of above in the collective portfolio 3 956 279 595Proportion of above in the company portfolio 143 736 817
The interest-bearing securities portfolio is classified as a financial current asset and consists of interest-bearing securities listed on the Oslo Stock Exchange, Oslo ABM and Nordic
Nasdaq (Stockholm) as well as unlisted securities. All interest-bearing securities classified as financial current assets are nominated in NOK, with the exception of five securities nominated in USD and three nominated in SEK. The current effective rate of interest for variable interest securities is approximately 2.2 per cent and for fixed interest securities is approximately 2.1 per cent. The average effective rate of interest is calculated on the basis of the securities’ effective rate of interest in relation to their market value.
Note 6 | Financial derivatives The purpose of employing derivatives is to increase the effectiveness of the management of fund assets, including the potential to hedge investments. In principle the pension scheme can only invest in listed (standardized) derivatives. The underlying securities must be securi-ties in which the scheme can invest in accordance with applicable guidelines. Non-standard-ized derivatives (“over-the-counter derivatives”/“OTC derivatives”) may only be employed for hedging purposes. However this does not apply to Norwegian FRA.
As at 31.12.2015 investments were held in the following derivatives:
Nominal amountin NOK
Fair valuein NOK
Forward currency contracts:EUR -149 121 542 -154 811 256USD -923 448 714 -977 656 582GBP -78 659 646 -78 255 309SEK -51 002 486 -53 451 242NOK 1 202 232 388 1 202 232 388Total forward currency contracts 0 -61 942 001
Proportion of above in the collective portfolio (liabilities) -59 770 462Proportion of above in the company portfolio (liabilities) -2 171 539
Total derivatives recognized in the balance sheet 0 -61 942 001
During 2015 investments in foreign shares have been hedged for periods of three to six months through the use of options. Hedging arrangements have been recognized in the financial statements for 2015 at around NOK 16.8 million net. There were no active hedging positions at the end of the year. In addition, share futures, share options and some interest rate and bond futures were also traded in 2015. Derivatives have been used in an effective manner to adjust equity exposure and interest rate terms.
THE PENSION SCHEME FOR THE PHARMACY SECTOR / ANNUAL REPORT 2015

32
Note 7 | Financial instruments valued at fair value In accordance with the Act relating to annual accounts for pension companies, financial instruments valued at fair value must be classified with regard to how fair value is measured. Such classification gives an indication of the relative uncertainty related to measurement of the different levels.
The Act defines three calculation levels for how fair value is measured:
1. Fair value is measured using listed prices in active markets for identical financial instru-ments. No adjustment is carried out of these prices.
2. Fair value is measured using another observable input than the listed prices used in level 1, either directly (prices) or indirectly (derived from prices).
3. Fair value is measured using an input which is not based on observable market data (non-observable input).
Fair value hierarchy of financial instruments measured at fair value:
31.12.2015 Level 1 Level 2 Level 3
Shares and mutual funds 2 721 853 975 395 414 247 842 668 114 1 483 771 614Bonds 4 100 016 412 4 100 016 412Financial derivatives -61 942 001 -61 942 001Total 6 759 928 386 395 414 247 4 880 742 525 1 483 771 614
Note 8 | Bank deposits Of bank deposits related to operations of NOK 39,645,723 as at 31.12.2015, NOK 295,635 are restricted tax deduction funds.
As security for various derivative positions, the pension scheme is obliged to provide collateral in the form of locked-in bank deposits held in margin accounts. As at 31.12.2015 there are no such locked-in bank deposits.
Note 9 | Accounts receivables – losses on accounts receivables
Accounts receivables had a book value of NOK 149,291,979 and consisted of:
31.12.2015 31.12.2014Accounts receivables related to premium income: 148 629 198 151 230 548Accounts receivables related to loans: 662 781 790 926Provision for potential loss: 0 0Total accounts receivables: 149 291 979 152 021 474
Accounts receivables are recorded at par value as at 31.12.2015.
Recorded losses on receivables were as follows:2015 2014
Realized loss on receivables: 68 976 0Change in provision for potential loss: 0 0Recorded loss on receivables: 68 976 0
Note 10 | Other retained earnings As at 31.12.2015 other retained earnings totaled NOK 801 million. Other retained earnings and the securities adjustment fund together constitute the scheme’s excess capital.
The pension scheme has calculated capital adequacy requirements using rules similar to those applicable to private pension funds in accordance with the administrative regulations from the Ministry of Labour and Social Affairs with effect from 2011. The requirement calcu-lated for the guarantee fund as at 31.12.2015 is NOK 426,354,619 (see calculation in Note 14 below).
The capital adequacy requirement must be covered by other retained earnings. Other retained earnings less the capital adequacy requirement, but with the addition of the securi-ties adjustment fund, total NOK 867,934,996. This constitutes the scheme’s buffer capital.
THE PENSION SCHEME FOR THE PHARMACY SECTOR / ANNUAL REPORT 2015

33
Note 11 | Premium reserve The Pension Scheme for Pharmacy Sector is only obliged to perform a technical calculation of future insurance liabilities every five years. The board has nonetheless decided to perform such technical calculations annually. The results of these calculations are also used for accounting purposes.
The premium reserve corresponds to the calculated pension liabilities applied as technical reserves. These reserves must cover future pension entitlements accrued at the balance sheet date by the scheme’s members. Wherever possible the amount of provision has been calculated in accordance with the guidelines applicable to private sector pension funds. This involves the calculation of the cash value of linearly accrued pension entitlements registered on the balance sheet date for deferred, potential and current benefits in accordance with standard technical insurance principles.
The basis for the calculation is the industry tariff K2005 with a basic interest rate of 3 per cent. Mortality in the case of longevity risk is also strengthened with a 15 per cent safety margin for both genders.
The assumption for rates of disability is based on K1963, boosted by a factor of 2.5.
The provision for the premium reserve includes provisions to cover future costs relating to the administration of payments of current accrued pension entitlements. The Pension Scheme for the Pharmacy Sector has opted to make provision for these future costs in the order of 4 per cent of calculated pension liabilities. Provision has been made in respect of current pensioners, actively contributing members and former employees with deferred pensions (i.e. employees who have left member-qualifying positions and have earned pension rights).
Note 12 | Allocation of the result for the year This year’s profit of NOK 261,843,248 will be allocated to other retained earnings.
Other retained earnings totaled NOK 800,643,742 as at 31.12.2015. Other retained earnings and the securities adjustment fund together constitute the scheme’s excess capital.
Note 13 | Specification of changes in retained earnings
As at 31.12.2015 retained earnings total NOK 800,643,742. The change in retained earnings in 2015 may be specified as follows:
Retained earnings as at 31.12.2014 538 800 494+ Net profit for the year allocated to other retained earnings 261 843 248= Retained earnings as at 31.12.2015 800 643 742
THE PENSION SCHEME FOR THE PHARMACY SECTOR / ANNUAL REPORT 2015

THE PENSION SCHEME FOR THE PHARMACY SECTOR / ANNUAL REPORT 201534
Note 14 | Calculation of capital adequacy requirement Certificates & Bonds Balance Risk weight Risk-weighted balance Risk-weighted calculation base, 8%Government and central bank 157 594 334 0 0 0Investments in state-owned enterprises 0 0.1 0 0Public sector excluding government and central bank 581 928 347 0.2 116 385 669 9 310 854Domestic financial institutions and foreign credit institutions 2 284 427 440 0.2 456 885 488 36 550 839Book value of primary capital in other financial institutions 166 825 734 1 166 825 734 13 346 059Investments in industry or other business activities 1 716 590 442 1 1 716 590 442 137 327 235Total 4 907 366 297 2 456 687 333 196 534 987
Bank deposits 84 142 743 0.2 16 828 549 1 346 284
Share/fund investments 1 715 736 283 1 1 715 736 283 137 258 903
Foreign-exchange contracts 0 0 0
DerivativesFutures 0 0 0Options 1 0 0Total 0 0 0
Housing and business loansLoans other than housing guaranteed by governments/centralbanks 1 059 699 0 0 0Housing loans within 80% of the appraised value 134 443 595 0.35 47 055 258 3 764 421Other lending other than housing loans 22 800 1 22 800 1 824Total 135 526 094 47 078 058 3 766 245
Real estate investments 1 006 117 692 1 1 006 117 692 80 489 415
Accrued asset itemsAccounts receivables 149 291 979 0.5 149 742 744 74 645 990 5 971 679Other receivables 0.5 0 0 0Accrued dividends 5 956 609 0.5 4 596 688 2 978 305 238 264Accrued interest income 0.5 609 715 0 0Accrued premiums 9 054 430 0.5 5 550 000 4 527 215 362 177Prepaid expenses 48 760 0.5 48 820 24 380 1 950Total 164 351 778 82 175 889 6 574 071
Total calculation base 8 013 240 887 5 324 623 804 425 969 904
Derivatives and off-balance sheet itemsForeign-exchange contracts with a remaining maturity of < 1 year 1 202 232 388 0.02 24 044 648 0.2 4 808 930 384 714Interest rate contracts with a remaining maturity of < 1 year 0.005 0 0.2 0 0Interest rate contracts with a remaining maturity of 1 year to 5 years 0.01 0 0.2 0 0Equity contracts with a remaining maturity of < 1 year 0 0 0
Total calculation base including derivatives and off-balance sheet items 9 215 473 275 5 329 432 733 426 354 619
8% of the risk-weighted balance sheet comprises NOK 426,354,619

THE PENSION SCHEME FOR THE PHARMACY SECTOR / ANNUAL REPORT 201535
In comparison, the basis for calculating primary capital as at 31.12.2014 was as follows:Certificates & Bonds Balance Risk weight Risk-weighted balance Risk-weighted calculation base, 8%Government and central bank 423 108 775 0 0 0Investments in state-owned enterprises 0 0.1 0 0Public sector excluding government and central bank 435 535 684 0.2 87 107 137 6 968 571Domestic financial institutions and foreign credit institutions 2 017 592 756 0.2 403 518 551 32 281 484Book value of primary capital in other financial institutions 252 831 864 1 252 831 864 20 226 549Investments in industry or other business activities 1 585 585 469 1 1 585 585 469 126 846 837Total 4 714 654 548 2 329 043 021 186 323 442
Bank deposits 41 282 314 0.2 8 256 463 660 517
Share/fund investments 1 574 386 039 1 1 574 386 039 125 950 883
Foreign-exchange contracts 0 0 0
DerivativesFutures 4 903 066 0 0 0Options 3 967 958 1 3 967 958 317 437Total 8 871 024 3 967 958 317 437
Housing and business loansLoans other than housing guaranteed by governments/centralbanks 2 728 142 0 0 0Housing loans within 80% of the appraised value 178 038 418 0.35 62 313 446 4 985 076Other lending other than housing loans 130 800 1 130 800 10 464Total 180 897 360 62 444 246 4 995 540
Real estate investments 858 514 566 1 858 514 566 68 681 165
Accrued asset itemsAccounts receivables 152 021 474 0.5 149 742 744 76 010 737 6 080 859Other receivables 30 775 059 0.5 0 15 387 529 1 231 002Accrued dividends 4 974 657 0.5 4 596 688 2 487 329 198 986Accrued interest income 0.5 609 715 0 0Accrued premiums 9 550 000 0.5 5 550 000 4 775 000 382 000Prepaid expenses 51 675 0.5 48 820 25 838 2 067Total 197 372 864 98 686 432 7 894 915
Total calculation base 7 575 978 715 4 935 298 725 394 823 898
Derivatives and off-balance sheet itemsForeign-exchange contracts with a remaining maturity of < 1 year 1 028 767 522 0.02 20 575 350 0.2 4 115 070 329 206Interest rate contracts with a remaining maturity of < 1 year -70 063 120 0.005 -350 316 0.2 -70 063 -5 605Interest rate contracts with a remaining maturity of 1 year to 5 years 0.01 0 0.2 0 0Equity contracts with a remaining maturity of < 1 year 45 006 763 0 0 0
Total calculation base including derivatives and off-balance sheet items 8 579 689 879 4 939 343 732 395 147 499
8% of the risk-weighted balance sheet comprises NOK 395,147,499

THE PENSION SCHEME FOR THE PHARMACY SECTOR / ANNUAL REPORT 201536
Note 15 | Premium contributions Members contributed premium income totaling NOK 642,897,782 in 2015. By comparison, the book value of premium income was NOK 639,869,838. In 2014 members contributed NOK 587,656,064 in premiums, while the book value of premium income was NOK 593,186,172. The differential between premium income and premium contributions is attributable to the change in invoiced but unpaid premiums and the application of accrual accounting to premium income.
Note 16 | PensionsOf the pension costs within the profit and loss account, NOK 790,278 represents write-offs of pension benefit overpayments. The corresponding figure for 2014 was NOK 673,002.
Note 17 | Administrative costs Total administration costs came to NOK 26,028,828. The pension scheme has had three employees throughout 2015. Pay and social expenses for these three investment managers totaled NOK 8,777,961 in 2015 and are included in administrative costs.
Note 18 |Insurance-related administrative expenses The pension scheme is managed by the Norwegian Public Service Pension Fund. In 2015 NOK 14,457,751 was charged against income in respect of the purchase of administrative services for the pension scheme, including costs relating to bookkeeping, actuarial services and pensions management. Furthermore, NOK 278,375 was charged against income for audit services including value added tax. The entire amount was related to standard audit services. NOK 318,340 was charged against income for remuneration to board members. Miscellaneous other costs and reimbursements of expenses totaled NOK 207,429. The total insurance-related administrative costs comprise NOK 15,262,395.
In 2015 the following remuneration was paid to the Board members of the scheme:
Finn Melbø (chairman) 63 768 Stein Gjerding 62 147 Renate Messel Hegre 63 768 Ann Torunn Tallaksen 63 768 Greta Torbergsen (new) 31 884 Edvin A. Aarnes (departed) 31 884 Kristin Juliussen (deputy) 1 621 Total 318 840
Note 19 | Return on capital The estimated yield for the portfolio as a whole is as follows:
Year: 2015 2014 2013 2012 2011Return stated as % (value-adjusted): 2.37 6.61 7.55 6.60 2.47Return stated as % (recorded): 1.38 4.47* 4.63 4.35 5.00
* Corrected in connection with the 2015 annual financial statements
The return on capital shown above has been calculated in respect of the whole portfolio: i.e. both the collective and the company portfolios. From 2009 private sector pension funds are required to calculate the return on capital for the collective portfolio as a whole.
The value-adjusted returns for 2012, 2013, 2014 and 2015 are based on monthly yield calculations, while those for the previous years are based on an annual yield calculation.
Note 20 | Analysis of resultChanges in pension plan: 0.00 MNOKYield result 1): 3.07 MNOKRisk result 2): 49.25 MNOKOther result 3): 522.21 MNOKAdministration result: 0.00 MNOKInsurance result: 574.53 MNOK
1) The yield result is the difference between actual and estimated interest rates (the base rate).2) The risk result is a comparison of risk income less risk expenses. Risk income comprises received and techni-
cally estimated risk premiums for mortality and disability, as well as mortality cross-subsidy. Risk expenses are supplemented by provisions for risk events.
3) Recognized difference between invoiced and actual pension cost. A negative result indicates the receipt of insufficient premium income.

THE PENSION SCHEME FOR THE PHARMACY SECTOR / ANNUAL REPORT 201537
Revisors beretning

THE PENSION SCHEME FOR THE PHARMACY SECTOR / ANNUAL REPORT 201538
STATISTICS

THE PENSION SCHEME FOR THE PHARMACY SECTOR / ANNUAL REPORT 201539
MembersMembers 2006 2007 2008 2009 2010 2011 2012 2013 2014 2015Active 6 049 6 215 6 308 6 515 6 561 6 689 7 125 7 274 7 422 7 585 Deferred* 5 855 6 005 5 673 5 783 6 093 6 245 6 386 6 564 6 767 7 175 Pensioners 3 086 3 152 3 312 3 339 3 499 3 803 4 144 4 295 4 600 4 951
AFP 166 175 201 191 267 282 295 312 310 293 Retirement pension 1468 1518 1601 1611 1668 1825 2088 2202 2513 2955Disability pension 1113 1135 1163 1185 1217 1367 1401 1422 1415 1335Spuse pension 37 30 323 325 323 306 336 338 343 342Children's pension 302 294 24 27 24 23 24 21 19 26
Ratio actively-employed/pensioners 1.960 1.972 1.905 1.951 1.875 1.759 1.719 1.694 1.613 1.532
* If you previously have been employed by an employer with an occupational pension in the Pension Scheme for the Pharmacy Sector, you may have accrued pension entitlements for a future pension. We call this a deferred pension. In the private sector, the term “paid-up policy” is used.
The figures given are number of policies. A person can have more than one policy. For example, a person can receive partial disa-bility pension and work partly in an active position. The person will then have two policies which correspond to the two positions respectively.
The graph above to the right shows the development of the ratio of active members to pensioners in the scheme from 2006 to 2015. In 2006 there were 1.96 active members per pensioner in the scheme, while at the end of 2015 the ratio is 1.5 active members per pensioner. A declining trend, as evidenced elsewhere in society where life expectancy is increasing and there are fewer active members to finance futurepension costs. For the pension scheme, such a trend where the number of pensioners is increasing at a rate greater than the number of active-employed members, means increasing future costs to finance the coming pensioners.
Statistics
1.5
2.0
2.5
2006 2007 2008 2009 2010 2011 2012 2013 2014 2015
Ratio actively-employed/pensioners
0
1 000
2 000
3 000
4 000
5 000
6 000
7 000
8 000
2006 2007 2008 2009 2010 2011 2012 2013 2014 2015
Development in number of members
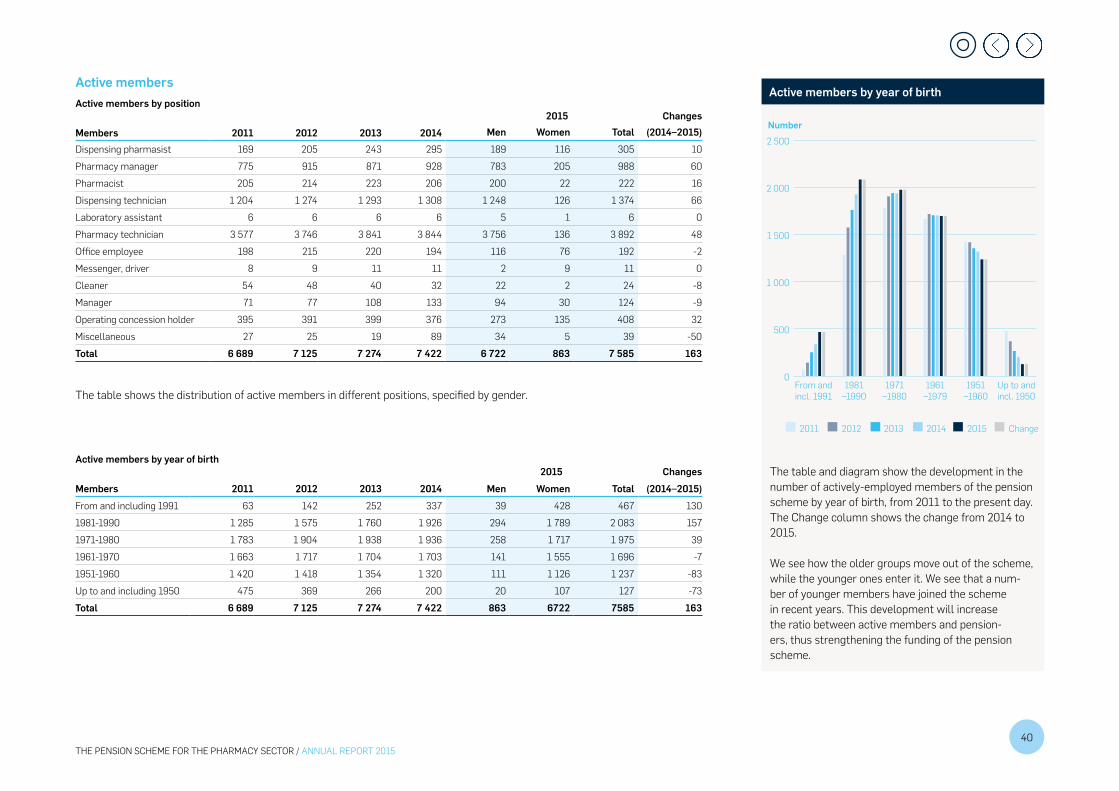
THE PENSION SCHEME FOR THE PHARMACY SECTOR / ANNUAL REPORT 201540
Active membersActive members by position
Members 2011 2012 2013 20142015 Changes
Men Women Total (2014–2015)Dispensing pharmasist 169 205 243 295 189 116 305 10Pharmacy manager 775 915 871 928 783 205 988 60Pharmacist 205 214 223 206 200 22 222 16Dispensing technician 1 204 1 274 1 293 1 308 1 248 126 1 374 66Laboratory assistant 6 6 6 6 5 1 6 0Pharmacy technician 3 577 3 746 3 841 3 844 3 756 136 3 892 48Office employee 198 215 220 194 116 76 192 -2Messenger, driver 8 9 11 11 2 9 11 0Cleaner 54 48 40 32 22 2 24 -8Manager 71 77 108 133 94 30 124 -9Operating concession holder 395 391 399 376 273 135 408 32Miscellaneous 27 25 19 89 34 5 39 -50Total 6 689 7 125 7 274 7 422 6 722 863 7 585 163
The table shows the distribution of active members in different positions, specified by gender.
Active members by year of birth2015 Changes
Members 2011 2012 2013 2014 Men Women Total (2014–2015)From and including 1991 63 142 252 337 39 428 467 1301981-1990 1 285 1 575 1 760 1 926 294 1 789 2 083 1571971-1980 1 783 1 904 1 938 1 936 258 1 717 1 975 391961-1970 1 663 1 717 1 704 1 703 141 1 555 1 696 -71951-1960 1 420 1 418 1 354 1 320 111 1 126 1 237 -83Up to and including 1950 475 369 266 200 20 107 127 -73Total 6 689 7 125 7 274 7 422 863 6722 7585 163
Number
0
500
1 000
1 500
2 000
2 500
Up to andincl. 1950
1951–1960
1961–1979
1971–1980
1981–1990
From andincl. 1991
2015 Change2014201320122011
Active members by year of birth
The table and diagram show the development in the number of actively-employed members of the pension scheme by year of birth, from 2011 to the present day. The Change column shows the change from 2014 to 2015.
We see how the older groups move out of the scheme, while the younger ones enter it. We see that a num-ber of younger members have joined the scheme in recent years. This development will increase the ratio between active members and pension-ers, thus strengthening the funding of the pension scheme.

THE PENSION SCHEME FOR THE PHARMACY SECTOR / ANNUAL REPORT 201541
Pensioners
Type of pension 2006 2007 2008 2009 2010 2011 2012 2013 2014 2015Changes
(2006–2015)AFP 166 175 201 191 267 282 295 312 310 293 76.5%Retirement pension 1468 1518 1601 1611 1668 1825 2088 2202 2513 2955 101.3%Disability pension 1113 1135 1163 1185 1217 1367 1401 1422 1415 1335 19.9%Spouse pension 302 294 323 325 323 306 336 338 343 342 13.2%Children's pension 37 30 24 27 24 23 24 21 19 26 -29.7%Total 3 086 3 152 3 312 3 339 3 499 3 803 4 144 4 295 4 600 4 951
The table shows the development in the number of pensioners from 2006 until today. The Change column shows the change from 2006 to 2015.
Retirement pensioners by age limit upon drawing of pensions
Age limit
2011 2012 2013 2014 2015Men Women Total Men Women Total Men Women Total Men Women Total Men Women Total
65 years 3 253 256 1 241 242 1 229 230 1 208 209 20 217 23768 years 90 1 262 1 352 96 1 399 1 495 106 1 491 1 597 123 1 697 1 820 311 2 569 2 88070 years 133 366 499 146 500 646 143 544 687 157 637 794 277 1 557 1 834Total 226 1 881 2 107 243 2 140 2 383 250 2 264 2 514 281 2 542 2 823 608 4 343 4 951
The table shows the number of early retirement pensioners and old-age pensioners given the age at which they drew their retire-ment pension, specified by gender.
The age limit is the time at which you must leave your position and you will normally be entitled to a retirement pension. Over time the number of pensioners with an age limit of 65 will be phased out. This follows changes to the legislation, in which the age limit for retirement was gradually increased to 70 for all groups. The last change was made in 2007.
Number
0
500
1000
1500
2000
2500
3000
20152014201320122011
Children’spension
Spousepension
Disabilitypension
Retirementpension
AFP
The diagram shows that the development in the number of pensioners over the last six years has increased for retirement pensions and disability pensions, while the number of pensioners drawing contractual pensions (AFP) has remained reasonably stable from 2011. The number of dependents’ pen-sions has also remained stable in recent years.
Pensions
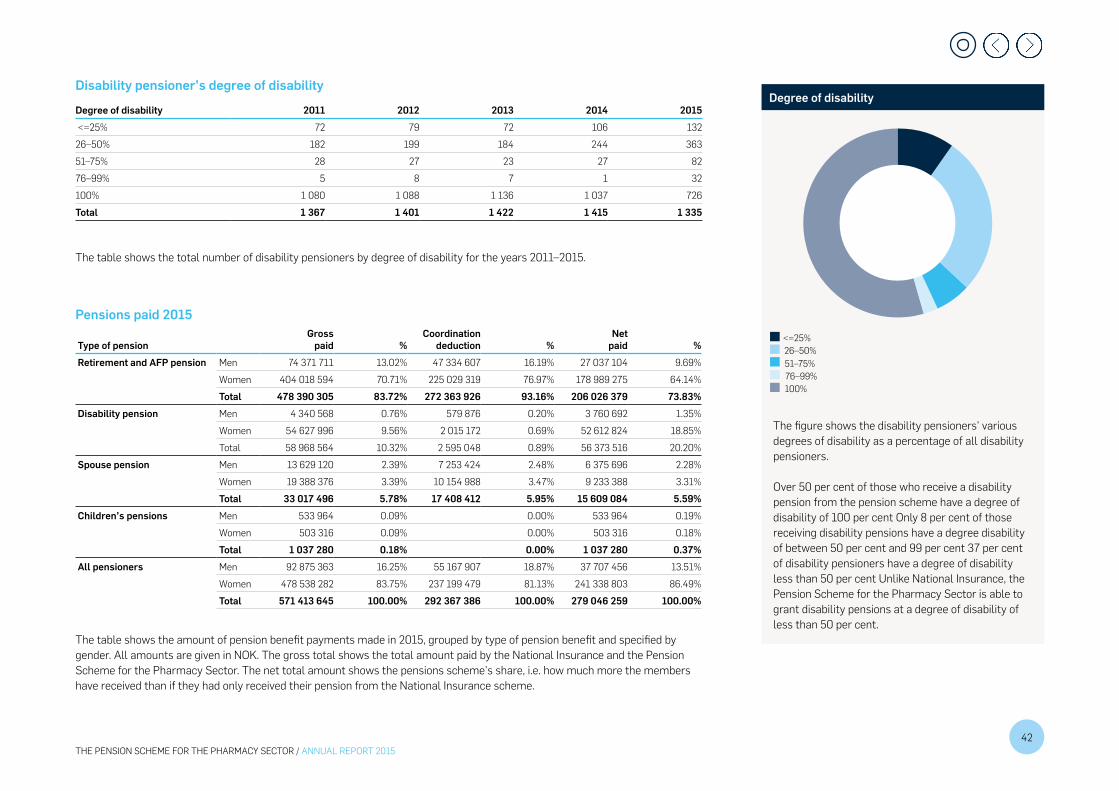
THE PENSION SCHEME FOR THE PHARMACY SECTOR / ANNUAL REPORT 201542
Disability pensioner’s degree of disability
Degree of disability 2011 2012 2013 2014 2015 <=25% 72 79 72 106 13226–50% 182 199 184 244 36351–75% 28 27 23 27 8276–99% 5 8 7 1 32100% 1 080 1 088 1 136 1 037 726Total 1 367 1 401 1 422 1 415 1 335
The table shows the total number of disability pensioners by degree of disability for the years 2011–2015.
Pensions paid 2015
Type of pension Gross
paid % Coordination
deduction % Netpaid %
Retirement and AFP pension Men 74 371 711 13.02% 47 334 607 16.19% 27 037 104 9.69% Women 404 018 594 70.71% 225 029 319 76.97% 178 989 275 64.14% Total 478 390 305 83.72% 272 363 926 93.16% 206 026 379 73.83%
Disability pension Men 4 340 568 0.76% 579 876 0.20% 3 760 692 1.35% Women 54 627 996 9.56% 2 015 172 0.69% 52 612 824 18.85% Total 58 968 564 10.32% 2 595 048 0.89% 56 373 516 20.20%
Spouse pension Men 13 629 120 2.39% 7 253 424 2.48% 6 375 696 2.28% Women 19 388 376 3.39% 10 154 988 3.47% 9 233 388 3.31% Total 33 017 496 5.78% 17 408 412 5.95% 15 609 084 5.59%
Children’s pensions Men 533 964 0.09% 0.00% 533 964 0.19% Women 503 316 0.09% 0.00% 503 316 0.18% Total 1 037 280 0.18% 0.00% 1 037 280 0.37%
All pensioners Men 92 875 363 16.25% 55 167 907 18.87% 37 707 456 13.51% Women 478 538 282 83.75% 237 199 479 81.13% 241 338 803 86.49% Total 571 413 645 100.00% 292 367 386 100.00% 279 046 259 100.00%
The table shows the amount of pension benefit payments made in 2015, grouped by type of pension benefit and specified by gender. All amounts are given in NOK. The gross total shows the total amount paid by the National Insurance and the Pension Scheme for the Pharmacy Sector. The net total amount shows the pensions scheme’s share, i.e. how much more the members have received than if they had only received their pension from the National Insurance scheme.
100%76–99%51–75%26–50%<=25%
5',(%"6#&-'#('78'+",*%&-'#('.%'*,9'9,--#"'1$2"%+%&*:,&'$"#';<=>'?#"'%&'1$2"%0"#.'+4'@88'+",*%&-A'B1&'C'+",*%&-'#('1$2"%3%*-#&.%&'?#"'1$2"%0"#.'9%//,9'78'D'EE'+",*%&-A'F%&*'GHI'#('1$2"%+%&*:,&)*-%&%'?#"'%&'1$2"%0"#.'+4'9)&."%'%&&'78'+",*%&-''5'9,-*%-&)&0'-)/'$,/6%-"J0.%&'6#&';%&*:,&*,".&)&0%&'$,"'#+,-%6()"6*,9?%-')&&()/0%'/#(%"%'1$2"%0"#.'%&&'78'IA'
The figure shows the disability pensioners’ various degrees of disability as a percentage of all disability pensioners.
Over 50 per cent of those who receive a disability pension from the pension scheme have a degree of disability of 100 per cent Only 8 per cent of those receiving disability pensions have a degree disability of between 50 per cent and 99 per cent 37 per cent of disability pensioners have a degree of disability less than 50 per cent Unlike National Insurance, the Pension Scheme for the Pharmacy Sector is able to grant disability pensions at a degree of disability of less than 50 per cent.
Degree of disability

Pension glossaryAge limitThe age limit is set by the position in which you are employed, and is the time at which you must leave your position. Most positions have a age limit of 70. The age limit should not be confused with the pension age, which indicates when you are able to leave your position with a pension.
Accrual for all yearsNew rules have been introduced for the accrual of National Insurance retirement pensions, known as accrual for all years. The rules entail that all years in which you are in employment or receive other pensionable income, from when you are 13 years of age until you reach 75, count towards the accrual of your pension entitlement.
Gross scheme / gross pensionThe term ’gross scheme’ is nor-mally used to describe pension schemes that guarantee a future (gross) pension level, regardless of any changes in National Insurance. The most usual level for retirement pensions in gross schemes is 2/3 (66 per cent) of final salary.
National InsuranceNational Insurance was established in 1967, and forms the basis for
our social and economic support system, and covers everyone who is resident in Norway.
The National Insurance base factor (G)The National Insurance base factor (G) is a key variable in the current pension system. It is used in determining pension benefits and to calculate National Insurance pensions. The National Insurance base factor, which we often refer to as ’G’, is adjusted once a year and is NOK 90 068as at 01.05.2015.
Individual guarantee(See also gross scheme / gross pen-sion). Age adjustment may result in the payment of less than 66 per cent of the contribution base in pension. Members of public sector occupational pension schemes who were born in 1958 or earlier have an individual guarantee which ensures that they will receive 66 per cent of the contribution base when they reach 67, under certain conditions.
Age adjustmentRetirement pension are allocated based on the number of years you are expected to live. This is called age adjustment. While life expec-tancy increases, everyone born in a particular year must work longer
than people born in the previous year in order to get the same pension.
Net schemePension schemes in which the pension is a supplement to other schemes. The pension is paid in full, regardless of benefits from National Insurance.
Deferred pensionIf you have previously been employed by an employer with an occupational pension in the Pension Scheme for the Pharmacy Sector, you may have accrued pension entitlements for a future pension. We call this a deferred pension. In the private sector, the term ’paid-up policy’ is used. There is a qualifying period requirement of at least 3 years for entitlement to a deferred (future) pension.
Qualifying periodThe qualifying period is the length of time you have been a member of the Pension Scheme for the Pharmacy Sector. This is normally the period in which pension contri-butions have been deducted from your salary, regardless of whether you have worked in a full-time or part-time position.
Pension transfer agreementAn agreement regarding the transfer of pension entitlements between public sector occupational pension schemes. The Pension Scheme for the Pharmacy Sector was covered by the agreement in the period 01.04.1996 –01.02.2003.
Pension ageThe pension age is the earliest age at which you can leave your position with a retirement pension. The normal pension age is 67 years. Pension age should not be confused with age limit.
Contribution baseThe income from which pension contributions are deducted, and that the pension from the Pension Scheme for the Pharmacy Sector shall be calculated from. As a rule, the contribution base is the salary, i.e. fixed annual salary and any pen-sionable supplements, which you have when you leave your position. Salary over 10G is not included.
Pension adjustmentThe Board can decide to undertake pension adjustments. The Board considers adjustment in relation to expected salary increases in the sector and adjustment of National Insurance scheme pensions.
Co-ordinationThe pension from the Pension Scheme for the Pharmacy Sector shall be co-ordinated with benefits from National Insurance. Coordina-tion regulates the distribtution of pensions from National Insurance and public sector pension schemes.
The 85-year ruleThe 85 year rule states that persons in the public sector with a special age limit can retire up to three years prior to the age limit if he sum of their age and pension-qualifying service period is 85 years or more.
> More words and phrases: www.spk.no/apotek
43THE PENSION SCHEME FOR THE PHARMACY SECTOR / ANNUAL REPORT 2015
Definitions and phrases, investment managementShareOwnership stake in a limited company. Shareholders are not personally liable for the company’s obligations. All shares (in the same class) provide equal rights within the company. Through the annual general meeting, the shareholders exercise the highest level of authority in the company.
Asset classesVarious types of securities, such as shares and bonds.
Allocation The allocation function involves allocating the funds that shall be invested in various markets and asse classes.
Tactical asset allocationinvolves choosing other asset or market schemes than in the benchmark portfolio, with the aim of achieving higher returns.
Bonds hold-to-maturity These bonds are securities that at the time of investment or reclassification are decided to be held in the portfolio until maturity of the bond (hold to maturity). This means that the return on the bond is known for the entire term. Bonds hold-to-maturity are not booked at the current market value, but any premiums or discounts are amortised evenly over the term of the bond. The return is therefore fixed for the entire term.
Buffer capital A key figure that is used to describe the risk-bearing capacity. Low buffer capital represents low riskbearing capacity. The buffer capital consists of other retained earnings, excluding the capital adequacy requirement (see below). The securities adjustment reserve is also included in the buffer capital.
DerivativeA financial contract in which the value depends on the value of an underlying variable at a future date. Options and futures contracts are examples of derivatives.
EquityThe equity in the Pension Scheme for the Pharmacy Sector consists of retained earnings. Retained earnings include the risk equalization fund and other retained earnings.
Assets under managementThe total (accounting) value of the funds that the pension scheme has under management.
Hedge fundA collective term for securities in which hedge fund managers seek to take positions in different directions to avoid one-sided risk exposure in the portfolio. «Hedging» means to insure against risk, but the aim is also to obtain high returns. The management is often based on utilizing various types of inefficiencies in the markets. The funds are generally private and closed, and are not offered to the general public. Thus, have they not been subject to the same level of regulation by the authorities as ordinary securities.
InflationSustained growth in the general level of prices. Inflation is usually measured by the consumer price index (CPI).
Capital adequacyA ratio that indicates the financial soundness of the pension scheme. There are special rules regarding how the capital adequacy shall be calculated. The capital adequacy requirement is alculated based on the scheme’s assets. The capital adequacy requirement must be covered by other retained earnings.
Credit exposureWhen bonds (see below) are issued by an issuer other than the state, there is a risk that the issuer will not fulfil the obligations of the loan agreement (credit risk). This risk is priced as an interest premium in connection with the issuance of the bonds (spread). If the issuer’s creditworthiness changes during the loan period, this is reflected in the market price of the bond. Exposure to this type of risk for bonds other than government bonds is referred to as credit exposure.
Market riskMarket risk is risk associated with fluctuations in market prices, such as share prices and interest rates.
44THE PENSION SCHEME FOR THE PHARMACY SECTOR / ANNUAL REPORT 2015

BondsStandardised transferable loans with an original maturity of at least one year. The terms of a bond, such as maturity, interest rate, interest payment dates and any provisions regulating interest rates, are agreed when the loan is issued.
Short-term bondsFor most bonds, the question of whether the bond will continue to be part of the portfolio or not (available for sale) is considered on an on-going basis. The market value of short-term bonds is assessed on an on-going basis, as opposed to longterm bonds (see above).
OptionsAn option is a common type of derivative. A distinction is made between call options and put options. A call option or put option is a right, but not an obligation, to buy or sell an under-lying asset at a pre-determined price. Possible underlying assets include shares, currency and commodity prices.
PortfolioThe aggregate amount of the securities that a fund invests in. The portfolio of the Pension Scheme for the Pharmacy Sector consists of shares, bonds, real estate, money market investments and derivatives.
Benchmark portfolioA benchmark portfolio is a hypothetical portfolio with a specific composition of securities (e.g. based on bond indices or share indices) which the results of an actual portfolio are measured against.
Reference indexThe yield on a benchmark portfolio (see above). For a portfolio consisting of a single asset class, the reference index will typically be a single market index, e.g. for Norwegian shares the Oslo Stock Exchange index.
Risk capacityAn expression for the level of risk (in investments) that is acceptable for å pension fund to have. The risk capacity is determined by the size of the buffer capital (see above).
Solvency IISolvency II is a European regulatory framework for the insurance industry. Under Solvency II, the size of the capital adequacy requirement is determined by the level of risk the company is exposed to as a whole.
Stress testTest to measure the effect of predefined market shocks. Examples of possible stress test scenarios are a 30 per cent drop in share price and 2 per cent increase in interest rate.
Exchange rateThe price of a country’s currency relative to other countries’ currencies, such as the Norwegian Krone per Euro.
Currency exposureThe pension scheme’s currency exposure is the sum of the pension scheme’s net position in foreign currency. One can talk about currency exposure in general or exposure to a single currency. For example, the pension scheme’s dollar exposure is the sum of all the scheme’s assets in dollars, less all liabilities in dollars.
Mutual fundA fund owned by an undefined group of people, in which the funds are mainly invested in securities.
45THE PENSION SCHEME FOR THE PHARMACY SECTOR / ANNUAL REPORT 2015