thrombosis: a major complications in ph neg
TRANSCRIPT

Thrombosis:
a major complications in
Ph Neg
Myeloproliferative
Neoplasms Tiziano BARBUI Hematology and Research Foundation Ospedale Papa Giovanni XXIII Bergamo, Italy

The most frequent sites of Thrombosis in MPNs
Arterial thrombosis (acute myocardial infarction, cerebral and peripheral arterial occlusion) Deep venous thrombosis and pulmonary embolism. Splanchnic and cerebral vein thromboses Microcirculatory disturbances including erythromelagia and miscarriages

Type of thrombosis in ECLAP study
(N=1638) FATAL (n=54) NON FATAL (n=187)
0
10
20
30
40
50
0
10
20
30
40
50
TIA MI DVT PE PE
25
13
6
10 33
23 20 14
46 38
13
% %
Marchioli et al, 23:2224-2232, 2005

ET-BVF study :1063 pts Events During Follow-up
Low-risk (n=517) High risk (n=546) (left untreated) (100% treated) Rate: 1.5 (%/patients/year) 2.0 (%/patients/year)
10
22
6
18
15
26
5
16
0
5
10
15
20
25
30
IMA ICTUS - TIA PAT VTE
No
. o
f th
rom
bo
sis
Low risk High risk
Carobbio et al Blood 2008, Blood 2009; Barbui JCO2011)

Copyright ©2010 American Society of Hematology. Copyright restrictions may apply.
Barbui, T. et al. Blood 2010;115:778-782
Figure 1 Cumulative incidence of fatal and nonfatal thrombotic events versus deaths from other causes (competing risk analysis) in 707 patients with primary myelofibrosis

0 60 120 180 2400
20
40
60
80
100
overall recurrences
arterial recurrences
venous recurrences
months from first thrombosis
cu
mu
lati
ve i
ncid
en
ce o
frecu
rren
t th
ro
mb
osis
in
all
pati
en
tsN=167 (7.69% pt-yrs)
N=101 (4.57% pt-yrs)
N=66 (3.12% pt-yrs)
RECURRENT THROMBOSIS IN POLYCYTHEMIA VERA AND
ESSENTIAL THROMBOCYTHEMIA
De Stefano V, Haematologica 2008

Risk factors for overall recurrent thrombosis according to the baseline characteristics (multivariable model)
1,05
1,23
1 1,050,92
0,72
1
0,72
1,67
0,53
0
0,5
1
1,5
2
2,5
Sex (M
vs
F)
Diagn
osis (P
V vs
ET)
Age a
t thr
ombo
sis (<
60 v
s >60
)
One
or m
ore
vasc
ular
risk
factor
s
Previo
us h
istor
y of
thro
mbo
sis
Type
of 1
st th
rom
bosis
(AT
vs V
N)
Antiplta
telets
age
nts
Long
-term
ora
l ant
icoa
gulata
tion
Phleb
otom
y
Any p
harm
acolog
ical c
ytor
educ
tive
treat
men
t
HR, CI 95%
De Stefano V, Haematologica 2008

1,02
1,33 1,34
0,99
1,14
0,67
1,01
0,76
0,47
0
0,5
1
1,5
2
2,5
Sex (M
vs
F)
Diagn
osis
(PV v
s ET)
Age a
t thr
ombo
sis (<
60 vs
>60
)
One
or m
ore v
ascu
lar r
isk fa
ctor
s
Previ
ous
histor
y of
thro
mbo
sis
Antip
ltate
lets
agen
ts
Long
-term
ora
l ant
icoa
gulat
atio
n
Phleb
otom
y
Any p
harm
acol
ogic
al c
ytor
educ
tive
treat
men
t
HR, CI 95%
All arterial thrombosis (N=341)
Acute Coronary Syndrome (N=106)
0,3
Cerebrovascular disease (N=191)
0,3
2,1
Risk factors for recurrent thrombosis of patients with first arterial thrombosis according to the baseline characteristics
(multivariable model)
De Stefano V, Haematologica 2008

Risk factors for recurrent thrombosis of patients with first venous thrombosis according to the baseline characteristics
(multivariable model)
1,21
0,91 0,910,72 0,72 0,66
2,26
0,420,32
0
0,5
1
1,5
2
2,5
3
3,5
4
4,5
Sex (M
vs
F)
Diagn
osis (P
V vs
ET)
Age a
t thr
ombo
sis (<
60 v
s >60
)
One
or m
ore
vasc
ular
risk
factor
s
Previo
us h
istor
y of
thro
mbo
sis
Antiplta
telets
age
nts
Long
-term
ora
l ant
icoa
gulata
tion
Phleb
otom
y
Any p
harm
acolog
ical c
ytor
educ
tive
treat
men
t
HR, CI 95%All venous thrombosis (N=160)
De Stefano V, Haematologica 2008

Rare Venous Thrombosis in MPN
Cerebral vein thrombosis Responsible for less than 1% of all strokes, most often affects young adults and children, annual incidence rates include 4 permillion of the population, 7 per million children and about 12 per million deliveris Obstruction of cerebral veins causes cerebral oedema and venous infarction, while occlusion of venous sinuses causes intracranial hypertension. Symptoms are recent unusual headache, stroke-like symptoms . The most sensitive diagnostic test is MRI ,or high resolution computed tomography (CT) as an initial examination is useful but it can be normal initially.

CVT cases
N= 48
Before diagnosis of MPN 8 (17)
At diagnosis 22 (46)
After diagnosis of MPN 18 (38)
11
TIMING OF CVT OCCURRENCE
Martinelli et al, submitted

Data during follow-up
CVT cases MPN VTE p
Median follow-up, years (range) 6.09 (0-34) 10.3 (0-31) 0.019
Cytoreductive treatment, n (%) 36 (75) 63 (72) 0.745
Long-term antithrombotic treatment, n
(%)
45 (94) 73 (84) 0.099
Recurrent thrombosis, n (%) 20 (42) 22 (25) 0.049
Venous thrombosis
Splanchnic vein thrombosis
Arterial thrombosis
Cerebral vein thrombosis
9 (19)
6 (13)
4 (8)
1 (2)
11 (13)
6 (7)
5 (6)
-
Hematological evolutions, n (%) 3 (6) 8 (9) 0.404
PPV-MF
PET-MF
Acute Leukemia
-
3 (6)
-
1 (1)
7 (8)
-
Deaths, n (%) 4 (8) 17 (20) 0.135
12
EVENTS DURING FOLLOW-UP
Martinelli et al, submitted

0.0
00
.25
0.5
00
.75
1.0
0
0 2 4 6 8 10Years from CVT/VTE
MPN with CVT MPN with VTE
.
Rate MPN pts with VTE: 4.2 % pat/year (95% CI: 2.7-6.5) Rate MPN pts with CVT: 8.8 % pat/year (95% CI: 5.7-13.6) p=0.022
13
THROMBOSIS-FREE SURVIVAL
Martinelli et al, submitted
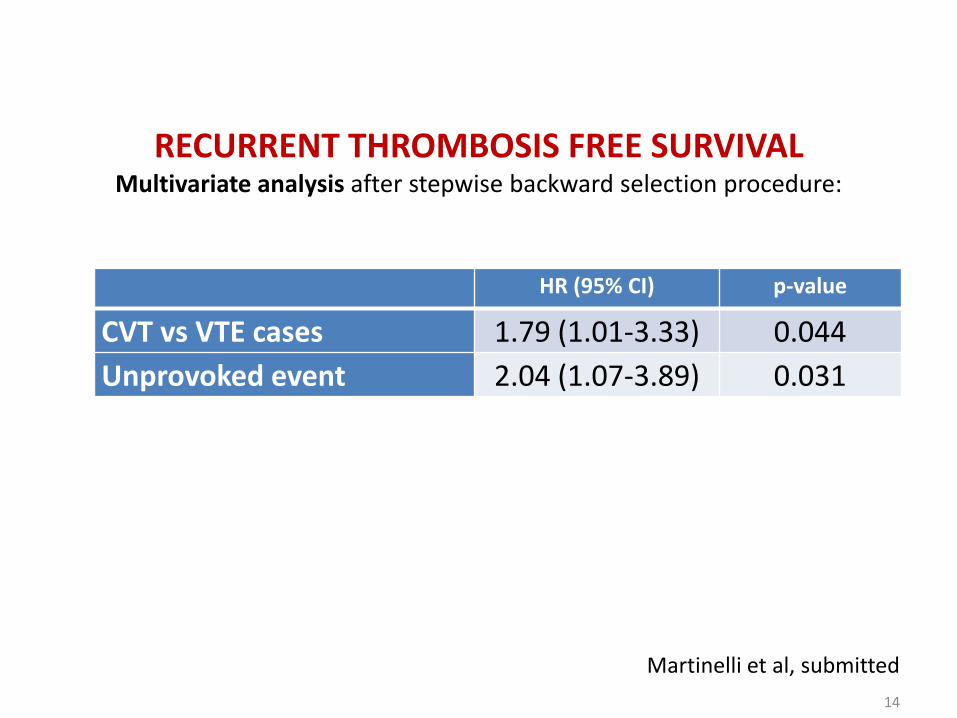
HR (95% CI) p-value
CVT vs VTE cases 1.79 (1.01-3.33) 0.044
Unprovoked event 2.04 (1.07-3.89) 0.031
RECURRENT THROMBOSIS FREE SURVIVAL Multivariate analysis after stepwise backward selection procedure:
14
Martinelli et al, submitted

Rare Thrombosis in MPN
Over the age of 40 years the annual incidence is 16/1000 of which 75% are branch retinal vein occlusion and 25% central retinal vein occlusion . Over 64 years 5/1000/year. Prevalence of JAK2 V617F 1.1% Typical presentation is with acute, painless visual loss in one eye. The diagnosis can usually be made by clinical examination alone. Risk factors are hypertension, diabetis, no thrombophilia, rare MPN Treatment with LMWH for 1–6 months (2B). Routine therapy with warfarin or anti-platelet agents is not recommended (2C).

Rare Thrombosis in MPN: Thrombotic occlusion of the placental circulation
• In MPN pregnancies the prothrombotic state may affect the remodeling of maternal spiral arteries essential for adequate blood volume delivery to the placenta.
• If remodeling of the maternal spiral arteries is
impaired by microthrombi leading to impaired blood delivery, the resultant placental hypoperfusion may form the basis of the abnormal fetal-maternal interaction and increase the risk of preeclampsia and growth restriction in MPN pregnancies.

Rare Thrombosis in MPN: Splanchnic vein thrombosis

hemodilution
occult bleeding
hypersplenism related to portal hypertension
possible elevation of Epo in BCS (liver ischemia)
SVT-DIFFICULTIES TO MEET WHO CRITERIA FOR MPN

NEW DRUGS?
“Resolution of esophageal varices in myelofibrosis during Ruxolitinib therapy : a case report”
Koschmieder , N Engl J Med. 2012
• Gastrointestinal bleeding 13 days after starting of Ruxolitinib due to esophageal varices, with one reoccurrence after 28 days.
• Treated with cyanoacrylate injections and ligations. • Spleen reduction if 42%.
• No other episodes of bleeding or needs of banding in the
subsequent two years of therapy with Ruxolitinib

Barbui, Finazzi, Falanga. Blood 2013; 122:2176
Pathogenesis of Thrombosis in MPN
Activation of the vascular endothelium
Procoagulant changes in plasma proteins
Quantitative and qualitative abnormalities of
blood cells

Neutrophil
Activated Neutrophil
Platelets
Activated Platelets
Red blood cells
Changes in red blood cell membrane
APC resistance
vessel
Blood clot activation
Activated Endothelium
Red blood cells
Platelets
TF
TF
TF
Fibrin Formation
Pathogenesis of Thrombophilia in MPN
Barbui, Finazzi, Falanga. Blood 2013; 122:2176

Eligible Patients
WHO-2008 diagnosis
All comers with no
contraindications
Standard arm HCT< 45%
Experimental arm HCT 45-50%
Median follow-up 31 months ( range 1.5-48) End-point: Arterial and venous thrombosis
1:1
NEJM 2013

Primary EndPoint
HCT
<45%
N=182
(49.9)
HCT
45-50%
N=183
(50.1)
Total
N=365
HR
(95%CI)
P
Primary Endpoint (n, %) (CV death, MI, stroke, PAT, DVT, PE, TIA and abdominal thrombosis) IR %person/year
5* (2.8)
1.1
18* (9.8)
4.4
23 (6.3)
2.7
3.91
(1.45-
10.53)
0.005
Total CV events (n, %) (Primary plus superficial vein thrombosis) IR %person/year
8 (4.4)
1.9
20 (10.9)
5.0
28 (7.7)
3.4
2.69
(1.19-
6.12)
0.012
* 0 deaths in HCT<45%; 4 deaths in HCT 45-50%
NEJM 2013

CV Death and Major Thrombosis
NEJM 2013

CYTO-PV ECLAP:
Censored Events at 3.5 Years
N (%) IR
(100
person/yrs)
N (%) IR
(100
person/yrs) Primary Endpoint
(CV death, MI, stroke, PAT, DVT,
PE, TIA and abdominal
thrombosis)
14 (3.8)
2.4
165 (10.1)
4.2
Total CV events
(Primary Endpoint plus
superficial thrombosis)
19 (5.2)
3.2
215 (13.1)
5.6
CYTO-PV Vs ECLAP: Event during FUP (censored events at Cyto-PV maximum time Fup)
Barbui et al, ASH 2013

CYTO-PV Vs ECLAP: distribution of patient at inclusion by RISK (age and previous thrombosis)
No Previous
Thrombosis
Previous Thrombosis Overall
Age <65 Age ≥65 Age <65 Age ≥65 CYTO-PV
IR per 100 person/yrs
2.0
4.4
3.8
2.9
3.2
ECLAP
IR per 100 person/yrs
2.5
4.9
5.0
10.9
5.5
Total CV events in follow-up by risk group (CV death, MI, stroke, PAT, DVT, PE, TIA, abdominal and superficial thrombosis)

PLATELET COUNT DURING THE STUDY
P=n.s.

WHITE-CELL COUNT DURING THE STUDY
P=0.001

Time-dependent multivariable analysis on the risk of major thrombosis in CYTO-PV study
(N = 365)
WBC (109/L)
Events/Pts (%)
HR (95% CI)
P-Value
< 6.0 2/54 (3.7) 1 (reference)
6.0-12 15/237 (6.3) 2.39 (0.5-10.8)
0.26
>12 11/74 ( 14.9) 4.89 (1.1-22.7)
0.04
Barbui et al, ASH 2013

30
Time-dependent multivariate analysis on the relative
risk of major thrombosis among men and women with
Polycythemia Vera (N = 1,638)*
Landolfi et al., Blood 2006
Hazard ratio (95% CI), P-value
White blood cell count
(x109/l)
10 (N=990) 1 (Reference)
10.1-15 (N=365) 1.06 (0.7-1.6), 0.8
> 15 (N=241) 1.71 (1.1-2.6), 0.02
*Model adjusted for: age, gender, time from PV diagnosis to recruitment, thrombotic or hemorrhagic events
prior to recruitment, smoking, history of diabetes, hypertension, claudicatio intermittens, erythromelalgia,
splenomegaly, circulating immature cells, leukocyte count, total blood cholesterol, phlebotomy use,
interferon use, hydroxyurea use, antiplatelets use, anticoagulants use, 32P use, busulfan use, chlorambucil
use, and pipobroman use

Prognostic studies may change over time diagnosis (PVSG,WHO-2008,WHO 2014) biomarkers

Risk Factors
for Thrombosis in ECLAP-study (PVSG-PV diagnosis)
Marchioli et al, 23:2224-2232, 2005
Events/100 persons/yr
HR
2.5 1
Events/100 persons/yr
HR
5.0
4.9
2.00
1.96
Events/100 persons/yr
HR
10.9 4.35
High-risk
Low-risk
Intermediate-risk
ECLAP cohort 1,638

Proposal: Hb/Hct values should be lowered in JAK2 mutated patients for the diagnosis of PV

Among 397 patients JAK2 mutated and with bone marrow morphology consistent with
WHO-PV
257 (65%) met the full WHO-2008 criteria.
140 (35%) were classified and treated as PV, although they did not meet the hemoglobin level threshold that is required for the diagnosis of WHO-defined PV. These patients were operationally defined as «masked PV».

Discriminating between ET and PV in JAK2V617F
patients ROC curves of hemoglobin and hematocrit
chi2(1) = 0.57 Prob>chi2 = 0.4499
Ho: area(hemoglobin) = area(hematocrit)
hematocrit 745 0.9832 0.0036 0.97622 0.99019
hemoglobin 745 0.9810 0.0036 0.97384 0.98807
Obs Area Std. Err. [95% Conf. Interval]
ROC Asymptotic Normal
0.0
00
.25
0.5
00
.75
1.0
0
Se
nsitiv
ity
0.00 0.25 0.50 0.75 1.001-Specificity
hemoglobin ROC area: 0.981
hematocrit ROC area: 0.9832
Reference
Female HB ≥ 16.0 g/dL
HCT ≥ 48%
Male HB ≥ 16.5 g/dL
HCT ≥ 49%
35 *Barbui T et al, AJH 2014

Thrombosis-free survival in masked and overt PV
0.5
00
.60
0.7
00
.80
0.9
01
.00
0 5 10 15Years from diagnosis
.
p=0.788
B C
Barbui et al, AJH 89:52-54,2013

Multivariate analysis on the relative risk of major thrombosis among patients
with masked (n=66) and overt (n=97) PV
Cox model testing mPV versus overt PV HR (95% CI) P-value
(0) Unadjusted 2.69 (1.15-3.14) 0.009
Sequentially adjusted
(1) + Age, sex
(2) + Previous thrombosis
(3) + Cardiovascular risk factors
(4) + Treatments*
2.03 (1.05-3.91)
2.16 (1.12-4.15)
2.02 (1.03-3.94)
1.71 (0.88-3.64)
0.035
0.021
0.040
0.203
Model 0: Unadjusted model. Reference category: overt PV. Model 1: age (2 categories), sex. Model 2: model 1 plus thrombotic events at/or prior to diagnosis (yes/no). Model 3: model 2 plus cardiovascular risk factors (yes/no). Model 4: model 3 plus phlebotomy use (yes/no), cytoreductive therapy (yes/no), aspirin (yes/no).

Polycythemia Vera (PV)*
Major
Criteria
1 Hemoglobin
>16.5 g/dL (men)
>16 g/dL (women
Hematocrit
>49% (men)
>48% (women)
2 BM findings consistent with WHO
criteria
3 Presence of JAK2 mutation
Minor
criteria
1 Subnormal serum erythropoietin level
2014 proposed revision for World Health Organization (WHO) Diagnostic Criteria for Polycythemia Vera
or
*PV diagnosis requires meeting either all three major criteria or the
first two major criteria and one minor criterion.

Prognostic studies may change over time diagnosis (PVSG,WHO-2008,WHO 2014) biomarkers ( JAK-2 allele burden and CALR
in ET)

THROMBOSIS in WHO-ET (inception cohort)
(n= 891)
Score: 0 low-risk
Score: 1-2 intermediate risk
Score => 3 high risk
Risk factor HR scores
Age > 60 1.50 1
CV risk factors 1.56 1
Previous thrombosis 1.93 2
JAK2 V617F 2.04 2
Barbui et al, J Clin Oncol. 2011 Aug 10;29(23):3179-84; Barbui et al,Blood 2012. Carobbio et al, Blood. 2011 Jun 2;117(22):5857-9. Epub 2011 Apr 13.
* Multivariate model adjusted for: sex, hemoglobin ,leukocyte
and platelet counts, Hydroxyurea and aspirin use.

0.5
00
.60
0.7
00
.80
0.9
01
.00
0 5 10 15.
N=535 PATIENTS
TRAINING SET
LOW
INTERMEDIATE
HIGH
p=0.0001
Barbui et al, Blood 2012

IPSET-
thrombosis
Standard
Risk factors
LOW INTERMEDIATE HIGH TOTAL
LOW
281
48%
0.59 %pts-yr
277
47%
1.55 %pts-yr
32
5%
1.77 %pts-yr
590
100%
0.95 %pts-yr
HIGH
193
31%
1.27 %pts-yr
194
31%
2.67 %pts-yr
243
39%
3.71 %pts-yr
630
100%
2.86 %pts-yr
TOTAL
474
39%
1.03 %pts-yr
471
39%
2.35 %pts-yr
275
23%
3.56 %pts-yr
1220
100%
1.77 %pts-yr
Distribution of thrombotic rates (n= 1220 patients )
according to standard risk factors and the new IPSET-
thrombosis model
Age > 60 point 1 ; CV risk factors point 1; Previous thrombosis:point 2; JAK2 V617F point 2
Barbui et al, Blood 2012

Overall, these data indicate that CALR patients are less prone to thrombotic events compared with JAK21 and MPL1; of note, their risk was similar to patients lacking any mutations.

6th INTERNATIONAL CONFERENCE ON
MYELOPROLIFERATIVE NEOPLASMS Estoril, Portugal
October 23-25, 2014
Chairs: T. Barbui, A.R. Green, R. Levine, H.L. Pahl, R. Skoda, W. Vainchenker, A. Vannucchi
To register and for further information: www.esh.org
Topics: • The genomics and genetics of MPNs
• Molecular and cellular pathogenesis of MPNs
• Diagnosis, classification and molecular monitoring
• Jak2 Inhibitors and novel therapies in MPN