thriving index comparison regions 2020
TRANSCRIPT

COMPARISON PEER REGIONS
2020 NEBRASKA THR IV IN G INDEX

Contents
Introduction
Methodology
North 81 Region
Northeast Region
Panhandle Region
Sandhills Region
Siouxland Region
Southeast Region
Southwest Region
Tri-Cities Region
03
04
06
08
10
12
14
16
18
20
The Nebraska Thriving Index provides economic developers, local elected officials and community leaders with economic and quality of life indicators to identify thriving and lagging regions so strategic, future-focused investments can be made.
2 Nebraska Thriving Index

IntroductionRecent projects from the University of Nebraska–Lincoln Bureau of Business Research have bench-marked economic growth and resources in the state’s two largest metropolitan areas — Lincoln, Neb., and Omaha, Neb. Research into the sources of growth has examined how growth is influenced by amenities enjoyed by both business and households and linkages between industries located throughout the state.
Now, the Rural Futures Institute (RFI) at the University of Nebraska (NU) has convened and funded an expanded research team from the University of Nebraska–Lincoln, the University of Nebraska at Kearney and Nebraska Extension Community Vitality Initiative to bring this analysis to all regions of Nebraska.
The first initial report was delivered online and in print in 2019. Now the second edition of this report was released in August 2020. Funding to sustain this work is a top priority. Ultimately, the goal is to provide community and state leaders with the ability to compare Nebraska regions with like peers located primarily in other states to better understand where a particular region excels or lags and to create action where needed.
3Comparison Peer Regions

The research team identified relevant comparison regions against which Nebraska regions could benchmark. The regions selected were the most similar to each of the eight Nebraska regions identified; comparison regions might be in Nebraska or in another state in the region.
Rather than take an ad-hoc approach to finding the most comparable region, the team used Mahalanobis distance matching, a technique often used in statistical analysis to find comparable samples in observational studies. In observational studies, unlike randomized studies, there is often a difference between the studied groups and the control groups. Without a random selection
process, there is often a bias in measuring effects against a control group (Feng, Jun, & Xu, 2006). To counteract this bias, Mahalanobis distance matching was created. The Mahalanobis distance itself is similar to the Euclidean distance, but it controls for covariances among variables, too. The Euclidean distance is the ordinary straight-line distance between two points in space (think distance formula or the Pythagorean Theorem).
In total, the team considered 85 regions located in Colorado, Illinois, Iowa, Kansas, Minnesota, Missouri, Montana, Nebraska, South Dakota and Wyoming. Outside of Nebraska, USDA Economic Development Administration regions were utilized.
Methodology
4 Nebraska Thriving Index

Six variables were used to compare each Nebraska region to the 85 other regions:
Population in Region – Regions with larger populations have some advantage for capturing more retail and service activity and have sufficient labor force to capture larger manufacturing firms. Percent of Population in Micropolitan Statistical Area – Micropolitan counties (tied to a population center of at least 10,000) can differ systematically in terms of economic structure than smaller non-metropolitan counties. Percent Farm Income (of Total Income in Region) and % Ranch Income (of Total Income in Region) – These two measures capture the degree to which the regional economy and its population trends are tied to trends in the agricultural sector. A focus on agricultural production also influences the diversity and entrepreneurial nature of the economy. Percent Manufacturing Employment (of Total Employment in Region) – Regional specialization in manufacturing influences economic growth and the demographic characteristics of the population.
Distance to Small MSA – Interaction with a nearby metropolitan area influences the growth patterns, demographic make-up, wealth, education attainment and age structure of a region. Distance to Large MSA – The above discussed patterns can be especially pronounced for rural areas in proximity to a Large MSA.
To start off our matching, each region and their calculated variables were used to develop a 7x7 covariance matrix, which shows how each variable varies with one another. This sets up a baseline on how each variable interacts and impacts other studied variables. Using R Statistical programming, researchers took each Nebraska region separately and processed each of the other 84 regions through the Mahalanobis distance formula. The output is a list of the 94 other regions and each region’s corresponding Mahalanobis distance value, which indicates how similar each region is to the Nebraska region we seek to study. Investigators retained the top 5-7 smallest Mahalanobis distances (most similar regions) as matches to the Nebraska region studied. The same process and calculations were repeated for each of the Nebraska regions.
Reference:Feng, Wuwei Wayne, Yu Jun, and Rong Xu. 2006. “A Method/Macro Based on Propensity Score and Mahalano-bis Distance to Reduce Bias in Treatment Comparison in Observational Study.”https://pdfs.semanticscholar.org/4851/27f2a7a73aed4cdba4c2e8db33dfa00a78a6.pdf
5Comparison Peer Regions

IOWAArea 15 Regional Planning Commissionwww.area15rpc.com
NORTH 81 REGION
MINNESOTAMid-Minnesota Development Commission www.mmrdc.org
ILLINOISBlackhawk Hills Resource Conservation and Development www.blackhawkhills.com
MISSOURIMark Twain Regional Council of Governments www.marktwaincog.com
MISSOURIPioneer Trails Regional Planning Commission www.trailsrpc.org
COUNTIESMadison, Pierce, Platte and Stanton
Comparison Peer Regions
6 Nebraska Thriving Index

Population Of Region (2017)
137,895
116,403
151,756
222,753
101,977
81,445
102.72
75.32
34.04
37.46
75.21
Distance (Miles) To Large Metropolitan Statistical Area (Population > 250,000)
86.18
Distance (Miles) To Small Metropolitan Statistical Area (Population < 250,000)
67.04
33.77
80.58
69.91
61.25
85.65
Comparison Peer Region Key1. NEBRASKA: North 81 Region
2. IOWA: Area 15 Regional Planning Commission
3. ILLINOIS: Blackhawk Hills Resource Conservation and Development
4. MISSOURI: Pioneer Trails Regional Planning Commission
5. MINNESOTA: Mid-Minnesota Development Commission
6. MISSOURI: Mark Twain Regional Council of Governments
1
2
3
4
5
6
1
2
3
4
5
6
1
2
3
4
5
6
1 2 3 4 5 6
Percent Of Population In A Micropolitan Area 100% 83.03% 83.79% 78.49% 67.55% 64.86%
Farm Income Percent Of Total Personal Income 15.77% 11.72% 11.92% 7.82% 16.53% 10.08%
Ranch Income Percent Of Total Personal Income 22.9% 10.65% 4.87% 5.57% 10.36% 5.67%
Percent Of Employment In The Manufacturing Industry 18.16% 16.40% 16.89% 16.08% 18.99% 13.88%
Comparison Region Economic Characteristics
7Comparison Peer Regions

NORTHEAST REGION
IOWARegion XII Council of Governments www.region12cog.org
IOWAMid-Iowa Development Association Council of Governments www.midascog.net
IOWANorthwest Iowa Planning & Development Commission www.nwipdc.org
NEBRASKASouthwest Region
NEBRASKAPanhandle Region
COUNTIESAntelope, Boone, Burt, Cedar, Colfax, Cuming, Dodge, Knox, Nance, Thurston and Wayne
Comparison Peer Regions
8 Nebraska Thriving Index

Population Of Region (2017)
Distance (Miles) To Large Metropolitan Statistical Area (Population > 250,000)
Distance (Miles) To Small Metropolitan Statistical Area (Population < 250,000)
Comparison Peer Region Key1. NEBRASKA: Northeast Region
2. IOWA: Region XII Council of Governments
3. IOWA: Northwest Iowa Planning & Development Commission
4. NEBRASKA: Panhandle Region
5. IOWA: Mid-Iowa Development Association Council of Governments
6. NEBRASKA: Southwest Region
1
2
3
4
5
6
1
2
3
4
5
6
1
2
3
4
5
6
1 2 3 4 5 6
Percent Of Population In A Micropolitan Area 32.85% 28.06% 38.61% 44.91% 40.38% 61.45%
Farm Income Percent Of Total Personal Income 30.31% 29.01% 22.61% 14.32% 24.03% 22.84%
Ranch Income Percent Of Total Personal Income 53.18% 33.01% 47.22% 35.22% 23.17% 48.62%
Percent Of Employment In The Manufacturing Industry 12.08% 14.26% 18.28% 5.08% 13.71% 10.27%
101,354
90,660
85,293
138,501
72,422
111,733
193.36
60.53
96.21
50.93
71.15
117.90
45.63
62.65
48.07
65.41
64.0831.98
Comparison Region Economic Characteristics
9Comparison Peer Regions

NEBRASKANortheast Region
NEBRASKASouthwest Region
WYOMINGSoutheast Wyoming Economic Development District www.southeastwyomingedd.org
IOWAMid-Iowa Development Association Council of Governments www.midascog.net
NEBRASKATri-Cities Region
COLORADOSouthern Colorado Economic Development District www.scedd.com
COUNTIESBanner, Box Butte, Cheyenne, Dawes, Deuel, Garden, Kimball, Morrill, Scottsbluff, Sheridan and Sioux
Comparison Peer Regions
PANHANDLE REGION
10 Nebraska Thriving Index
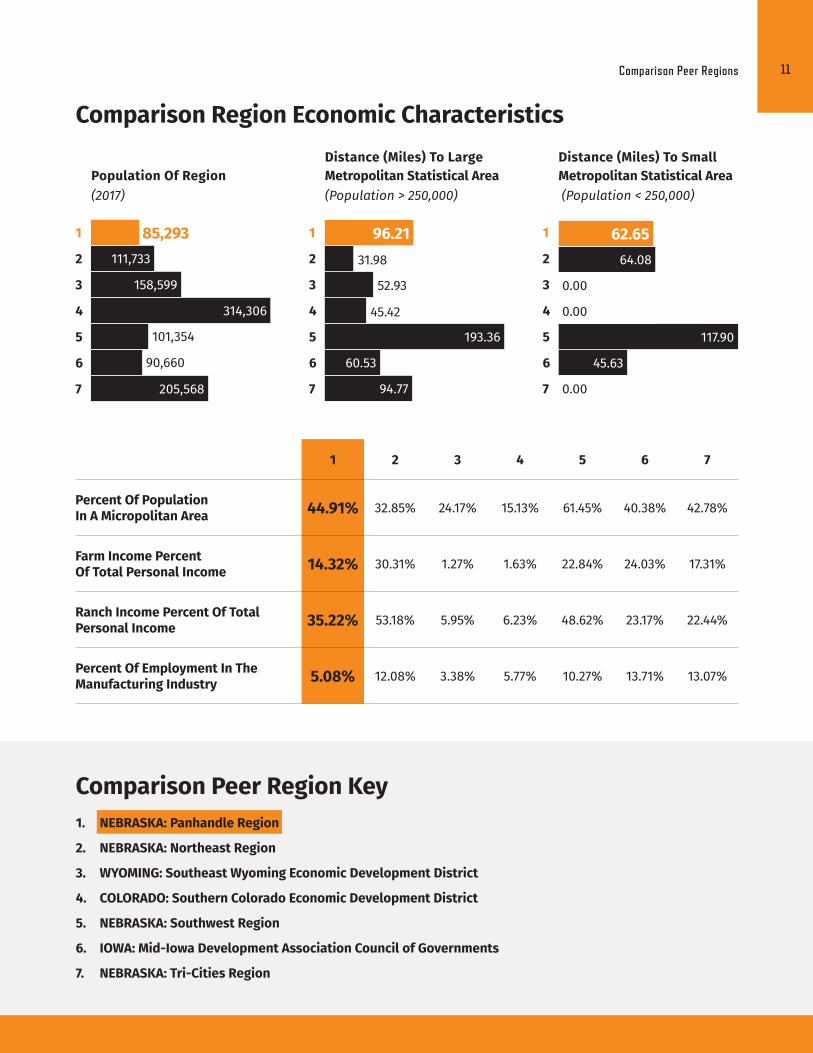
205,568
314,306
158,599
111,733
94.77
60.53
193.36
96.21
45.63
117.90
64.08
0.00
0.00
62.65
0.00
Population Of Region (2017)
Distance (Miles) To Large Metropolitan Statistical Area (Population > 250,000)
Distance (Miles) To Small Metropolitan Statistical Area (Population < 250,000)
Comparison Peer Region Key1. NEBRASKA: Panhandle Region
2. NEBRASKA: Northeast Region
3. WYOMING: Southeast Wyoming Economic Development District
4. COLORADO: Southern Colorado Economic Development District
5. NEBRASKA: Southwest Region
6. IOWA: Mid-Iowa Development Association Council of Governments
7. NEBRASKA: Tri-Cities Region
1
2
3
4
5
6
7
1
2
3
4
5
6
7
1
2
3
4
5
6
7
1 2 3 4 5 6 7
Percent Of Population In A Micropolitan Area 44.91% 32.85% 24.17% 15.13% 61.45% 40.38% 42.78%
Farm Income Percent Of Total Personal Income 14.32% 30.31% 1.27% 1.63% 22.84% 24.03% 17.31%
Ranch Income Percent Of Total Personal Income 35.22% 53.18% 5.95% 6.23% 48.62% 23.17% 22.44%
Percent Of Employment In The Manufacturing Industry 5.08% 12.08% 3.38% 5.77% 10.27% 13.71% 13.07%
90,660
101,354
85,293
45.42
52.93
31.98
Comparison Region Economic Characteristics
11Comparison Peer Regions

NEBRASKANortheast Region
NEBRASKAPanhandle Region
IOWANorthwest Iowa Planning & Development Commission www.nwipdc.org
KANSASGreat Plains Development Inc. www.gpdionline.com
NEBRASKASouthwest Region
COUNTIESBlaine, Boyd, Brown, Cherry, Custer, Garfield, Grant, Greeley, Holt, Hooker, Keya Paha, Loup, Rock, Thomas, Valley and Wheeler
Comparison Peer Regions
SANDHILLS REGION
12 Nebraska Thriving Index

210,852
85,293
101,354
138,501
111,733
180.70
96.21
193.36
50.93
31.98
163.73
199.30
62.65
117.90
48.07
64.08
73.62
Population Of Region (2017)
Distance (Miles) To Large Metropolitan Statistical Area (Population > 250,000)
Distance (Miles) To Small Metropolitan Statistical Area (Population < 250,000)
Comparison Peer Region Key1. NEBRASKA: Sandhills Region
2. NEBRASKA: Northeast Region
3. IOWA: Northwest Iowa Planning & Development Commission
4. NEBRASKA: Southwest Region
5. NEBRASKA: Panhandle Region
6. KANSAS: Great Plains Development Inc.
1
2
3
4
5
6
1
2
3
4
5
6
1
2
3
4
5
6
1 2 3 4 5 6
Percent Of Population In A Micropolitan Area 0.00% 32.85% 38.61% 61.45% 44.91% 58.84%
Farm Income Percent Of Total Personal Income 31.01% 30.31% 22.61% 22.84% 14.32% 18.57%
Ranch Income Percent Of Total Personal Income 89.49% 53.18% 47.22% 48.62% 35.22% 81.50%
Percent Of Employment In The Manufacturing Industry 5.48% 12.08% 18.28% 10.27% 5.08% 11.74%
46,693
Comparison Region Economic Characteristics
13Comparison Peer Regions

IOWASoutheast Iowa Regional Planning Commission www.seirpc.com
IOWANorth Iowa Area Council of Governments www.niacog.org
MINNESOTANorthwest Minnesota Regional Development Commission www.nwrdc.org
ILLINOISSouthwestern Illinois Metropolitan & Regional Planning Commission www.simapc.org
IOWAIowa Northland Regional Council of Governments www.inrcog.org
COUNTIESDakota and Dixon
Comparison Peer Regions
SIOUXLAND REGION
14 Nebraska Thriving Index

25,940
101,015
123,371
217,705
85,417
104,759
55.26
97.47
45.34
183.57
58.12
78.42
66.19
63.48
49.84
0.00
56.08
25.99
Population Of Region (2017)
Distance (Miles) To Large Metropolitan Statistical Area (Population > 250,000)
Distance (Miles) To Small Metropolitan Statistical Area (Population < 250,000)
Comparison Peer Region Key1. NEBRASKA: Siouxland Region
2. IOWA: Southeast Iowa Regional Planning Commission
3. MINNESOTA: Northwest Minnesota Regional Development Commission
4. IOWA: Iowa Northland Regional Council of Governments
5. IOWA: North Iowa Area Council of Governments
6. ILLINOIS: Southwestern Illinois Metropolitan & Regional Planning Commission
1
2
3
4
5
6
1
2
3
4
5
6
1
2
3
4
5
6
1 2 3 4 5 6
Percent Of Population In A Micropolitan Area 0.00% 70.36% 0.00% 0.00% 40.91% 0.00%
Farm Income Percent Of Total Personal Income 18.86% 7.07% 33.10% 11.02% 21.86% 11.97%
Ranch Income Percent Of Total Personal Income 9.90% 4.02% 2.75% 8.24% 19.56% 4.34%
Percent Of Employment In The Manufacturing Industry 33.82% 22.77% 17.49% 17.23% 18.26% 15.92%
Comparison Region Economic Characteristics
15Comparison Peer Regions

MINNESOTASouthwest Regional Development Commission www.swrdc.org
IOWARegion XII Council of Governments www.region12cog.org
MINNESOTAUpper Minnesota Valley Regional Development Commission www.umvrdc.org
IOWASouthwest Iowa Planning Council www.swipco.org
IOWAMid-Iowa Development Association Council of Governments www.midascog.net
IOWANorth Iowa Area Council of Governments www.niacog.org
SOUTH DAKOTAPlanning & Development District III www.districtiii.org
IOWASouthern Iowa Council of Governments www.sicog.com
COUNTIESButler, Fillmore, Gage, Jefferson, Johnson, Nemaha, Otoe, Pawnee, Polk, Richardson, Saline, Thayer and York
Comparison Peer Regions
SOUTHEAST REGION
16 Nebraska Thriving Index

123,371
90,660
179,672
72,422
67,739
102,695
116,889119,805
97.47
60.53
31.75
71.15
33.59
54.51
102.04
69.6136.50
63.48
45.63
77.32
65.41
56.47
79.95
58.93
91.9466.65
Population Of Region (2017)
Distance (Miles) To Large Metropolitan Statistical Area (Population > 250,000)
Distance (Miles) To Small Metropolitan Statistical Area (Population < 250,000)
Comparison Peer Region Key
1
2
3
4
5
6
7
8
9
123456789
123456789
1 2 3 4 5 6 7 8 9
Percent Of Population In A Micropolitan Area 18.03% 40.87% 0.00% 44.59% 0.00% 28.06% 0.00% 40.38% 40.91%
Farm Income Percent Of Total Personal Income 30.95% 29.70% 41.30% 29.19% 18.64% 29.01% 17.26% 24.03% 21.86%
Ranch Income Percent Of Total Personal Income 15.02% 27.59% 15.97% 21.61% 15.80% 33.01% 5.97% 23.17% 19.56%
Percent Of Employment In The Manufacturing Industry 17.40% 16.38% 12.18% 11.78% 14.21% 14.26% 11.66% 13.71% 18.26%
42,965
1. NEBRASKA: Southeast Region2. MINNESOTA: Southwest Regional Development
Commission3. MINNESOTA: Upper Minnesota Valley Regional
Development Commission4. SOUTH DAKOTA: Planning & Development
District III
5. IOWA: Southern Iowa Council of Governments6. IOWA: Region XII Council of Governments7. IOWA: Southwest Iowa Planning Council8. IOWA: Mid-Iowa Development Association
Council of Governments9. IOWA: North Iowa Area Council of Governments
Comparison Region Economic Characteristics
17Comparison Peer Regions

IOWANorthwest Iowa Planning & Development Commission www.nwipdc.org
IOWARegion XII Council of Governments www.region12cog.org
NEBRASKAPanhandle Region
MINNESOTASouthwest Regional Development Commission www.swrdc.org
IOWAMid-Iowa Development Association Council of Governments www.midascog.net
NEBRASKANortheast Region
COUNTIESArthur, Chase, Dawson, Dundy, Frontier, Furnas, Gosper, Hayes, Hitchcock, Keith, Lincoln, Logan, McPherson, Perkins and Red Willow
Comparison Peer Regions
SOUTHWEST REGION
18 Nebraska Thriving Index

90,660
116,889
72,422
111,733
85,293
138,501
101,354
45.63
91.94
65.41
64.08
62.65
48.07
117.90
60.53
69.61
71.15
96.21
50.93
193.36
31.98
Population Of Region (2017)
Distance (Miles) To Large Metropolitan Statistical Area (Population > 250,000)
Distance (Miles) To Small Metropolitan Statistical Area (Population < 250,000)
Comparison Peer Region Key1. NEBRASKA: Southwest Region
2. IOWA: Northwest Iowa Planning & Development Commission
3. NEBRASKA: Panhandle Region
4. NEBRASKA: Northeast Region
5. IOWA: Region XII Council of Governments
6. MINNESOTA: Southwest Regional Development Commission
7. IOWA: Mid-Iowa Development Association Council of Governments
1
2
3
4
5
6
7
1
2
3
4
5
6
7
1
2
3
4
5
6
7
1 2 3 4 5 6 7
Percent Of Population In A Micropolitan Area 61.45% 38.61% 44.91 % 32.85 % 28.06 % 40.87 % 40.38 %
Farm Income Percent Of Total Personal Income 22.84% 22.61% 14.32 % 30.31 % 29.01 % 29.70 % 24.03 %
Ranch Income Percent Of Total Personal Income 48.62% 47.22% 35.22 % 53.18 % 33.01 % 27.59 % 23.17 %
Percent Of Employment In The Manufacturing Industry 10.27% 18.28% 5.08 % 12.08 % 14.26 % 16.38 % 13.71 %
Comparison Region Economic Characteristics
19Comparison Peer Regions

MINNESOTARegion Nine Development Commission www.rndc.org
Comparison Peer Regions
KANSASNorth Central Regional Planning Commission www.ncrpc.org
IOWAEast Central Intergovernmental Association www.ecia.org
IOWARegion 6 Planning Commission www.region6planning.org
MINNESOTAMinnesota West Central Initiative www.wcif.org
IOWAMid-Iowa Development Association www.midascog.net
COUNTIESAdams, Buffalo, Clay, Franklin, Hall, Hamilton, Harlan, Howard, Kearney, Merrick, Nuckolls, Phelps, Sherman and Webster
TRI-CITIES REGION
20 Nebraska Thriving Index

229,775
92,708
90,660
134,720
199,113
232,374
205,568 0.000.00
0.00
Population Of Region (2017)
Distance (Miles) To Large Metropolitan Statistical Area (Population > 250,000)
Distance (Miles) To Small Metropolitan Statistical Area (Population < 250,000)
Comparison Peer Region Key1. NEBRASKA: Tri-Cities Region
2. MINNESOTA: Region Nine Development Commission
3. IOWA: East Central Intergovernmental Association
4. IOWA: Mid-Iowa Development Association
5. KANSAS: North Central Regional Planning Commission
6. IOWA: Region 6 Planning Commission
7. MINNESOTA: Minnesota West Central Initiative
1
2
3
4
5
6
7
1
2
3
4
5
6
7
1
2
3
4
5
6
7
1 2 3 4 5 6 7
Percent Of Population In A Micropolitan Area 42.78% 19.38% 23.61% 40.38% 44.99% 43.46% 44.50%
Farm Income Percent Of Total Personal Income 17.31% 14.96% 8.76% 24.03% 15.30% 16.82% 14.87%
Ranch Income Percent Of Total Personal Income 22.44% 13.97% 10.05% 23.17% 8.63% 13.88% 6.52%
Percent Of Employment In The Manufacturing Industry 13.07% 16.63% 15.17% 13.71% 14.16% 18.44% 12.35%
Comparison Region Economic Characteristics
21Comparison Peer Regions
194.92
39.07
60.53
76.88
45.39
72.89
94.77
35.81
24.87
60.57
45.63
