three-year map growth at schools using teach to one: math
TRANSCRIPT

MarGrady Research
Three-Year MAP Growth at Schools Using Teach to One: Math Jesse Margolis, PhD
February 2019

MarGrady Research
2
Three-Year MAP Growth at Schools Using Teach to One: Math
About MarGrady Research
MarGrady Research helps education leaders make better-informed decisions to improve the lives
of students. It does this through rigorous analysis of data, clear and insightful presentation of
results, and the development of lasting partnerships with the school districts, foundations, and
other education organizations it works with. See more at www.margrady.com.
Jesse Margolis is a co-founder and managing partner at MarGrady Research, where he focuses
on projects related to performance management, finance, and policy analysis for school districts
and foundations. Prior to founding MarGrady Research, Dr. Margolis was an adjunct professor
and postdoctoral fellow at New York University’s Robert F. Wagner Graduate School of Public
Service, where he researched education policy and taught statistics and econometrics. Previously,
he was an analyst and manager at the New York City Department of Education (NYCDOE) and
a consultant at The Parthenon Group. Dr. Margolis also spent two years working with school
districts in Santiago, Chile, and received a Fulbright Scholarship to spend a year studying the
public schools in São Paulo, Brazil. He has a bachelor’s degree in Applied Mathematics from
Harvard University, a master’s in Economics from New York University, and a PhD in
Economics from the City University of New York. He can be reached at [email protected]
About the Bill & Melinda Gates Foundation
Guided by the belief that every life has equal value, the Bill & Melinda Gates Foundation works
to help all people lead healthy, productive lives. In developing countries, it focuses on improving
people’s health and giving them the chance to lift themselves out of hunger and extreme poverty.
In the United States, it seeks to ensure that all people—especially those with the fewest
resources—have access to the opportunities they need to succeed in school and life. Based in
Seattle, the foundation is led by CEO Susan Desmond-Hellmann and William H. Gates Sr.,
under the direction of Bill and Melinda Gates and Warren Buffett.
Acknowledgements (Jesse Margolis)
I would like to thank the Bill & Melinda Gates Foundation, who provided the funding for this
study. I would also like to thank the staff at New Classrooms for providing some of the data used
in this study, reviewing earlier versions of this report, and providing helpful feedback. The
conclusions here do not necessarily reflect the views of either of these organizations, and any
errors are my own.

MarGrady Research
3
Three-Year MAP Growth at Schools Using Teach to One: Math
Executive Summary
Teach to One: Math (TtO) is an innovative model of teaching mathematics that re-envisions the
way in which teachers, students, and curriculum interact in middle and high school classrooms to
provide a more personalized learning experience for every student. Through a technology-
infused mix of direct instruction, collaborative work with peers, and individualized learning, TtO
seeks to introduce students to mathematics content at the right level for them.
In this study, I compare three-year math test score growth at all 14 schools that used TtO from
2015-16 to 2017-18 to a national reference group, controlling for each student’s starting score.
To measure growth in math test scores, I use the Northwest Evaluation Association’s (NWEA)
Measures of Academic Progress (MAP) test, a widely-used adaptive test that can capture growth
across a variety of grade levels. I also analyze internal TtO program data to begin to explore the
relationship between the content students are presented with during the year and their subsequent
test score gains.
Key findings from this study include:
• From fall 2015 to spring 2018, scores on the math MAP test for consistently-enrolled TtO
students improved sufficiently to raise the average school-level percentile by 20 points,
corresponding to 23% more growth, on average, than a national reference group.
• A broader group of students – including those not consistently enrolled – showed average
three-year gains of 13 school-level percentile points and 12% greater improvement in the
average math MAP test score.
• A group of “MAP growth-aligned” schools – those subject to external accountability
systems that prioritize growth on the MAP test – showed average three-year gains among
consistently-enrolled students of 38 school-level percentile points, which corresponds to
53% more growth.
• There is suggestive evidence that schools with a smaller content gap – those where the
math content presented better matched students’ tested grade level from the beginning of
the year – tended to see greater gains.
These results should be interpreted with caution. The MAP test is only one measure of math
knowledge, and the fact that students at TtO schools are growing faster than a national reference
group does not indicate that TtO caused those gains. Moreover, the national reference group may
be an imperfect comparison group for students in TtO schools, who are more likely to be poor,
Black, and/or Latino than the average American student. With these caveats noted, however, it
does appear that TtO students experienced greater three-year gains on the NWEA MAP test than
a national reference group, and these results are robust to a number of alternative specifications.

MarGrady Research
4
Three-Year MAP Growth at Schools Using Teach to One: Math
Introduction
Schools using Teach to One: Math (TtO)
help students learn traditional math topics in
a non-traditional way. In a traditional math
classroom, a teacher might deliver
instruction to an entire class and then, after
several days or weeks, evaluate the students
using a uniform assessment. In a TtO
classroom, each student learns his or her
own pace and studies topics appropriate to
his or her own level. Students learn at their
own pace through a combination of
instructional modalities, including teacher-
led instruction, collaborative learning, and
virtual (online) learning. At the end of each
day, students are assessed on their mastery
of the material, and each student’s
customized lesson plan is prepared for the
next day.
Founded in 2011 to expand New York
City’s School of One program, TtO and its
parent organization, New Classrooms, had
grown to partner with 36 schools in 11 states
by 2017-18.1 Of these 36 schools, 14 had
used TtO for three consecutive years,
providing New Classrooms the opportunity
to look at test score gains for students and
schools over a longer time horizon than in
prior analyses. Additionally, New
Classrooms has collected a wealth of
internal data that can be analyzed to better
understand how student success is related to
their level of preparation for the content they
are presented with.
The primary goal of this study is to compare
math test score growth at TtO schools to
1 As of 2017-18, 36 schools used TtO’s full program,
or core offering. Additional schools used TtO on a
partial basis or as an after-school program. As of
2018-19, TtO’s core offering is used in 39 schools.
national norms over a three-year period. To
measure growth in math test scores, I use the
Northwest Evaluation Association’s
(NWEA) Measures of Academic Progress
(MAP) test, a widely-used computer
adaptive test taken three times per year by
all students participating in TtO. I focus on
growth rather than proficiency because
many students in TtO’s partner schools are
far from the traditional proficiency cut
points – either below or above – and TtO
seeks to meet every student where they are. I
look at growth on the MAP, as opposed to
growth on state tests, for two reasons. First,
the MAP is administered consistently at all
TtO schools, providing a common yardstick
against which to compare gains across
schools. Second, the MAP is an adaptive test
that adjusts the difficulty of questions based
on student responses. Students taking the
MAP may be asked questions from a variety
of grade levels, whereas students taking
many state tests will be asked a large
number of grade-level questions, even if
those questions are too easy or too difficult
for some students. As a result, the MAP test
may provide a more accurate estimate of
growth for students who are far below or
above state standards for their grade level.
To look at three-year growth, I focus my
analysis on consistently-enrolled students at
the 14 schools that used TtO from 2015-16
to 2017-18. In particular, I analyze results
for those students who were 6th graders in
2015-16, 7th graders in 2016-17, and 8th
graders in 2017-18. I calculate the change in
test scores from the fall of 2015 to the spring
of 2018 and compare that change to national
norms in three ways.2 First, I assign each
school a status percentile in each period
2 The NWEA estimates national norms for the MAP
test by adjusting the actual scores of students who
took the MAP test in 2011-12, 2012-13, and 2013-14
to be representative of the U.S. public school

MarGrady Research
5
Three-Year MAP Growth at Schools Using Teach to One: Math
from Fall 2015 to Spring 2018 based on its
average MAP test score compared to
national norms, and calculate each school’s
change in status percentile over the three-
year period. Second, to provide more
nuanced results, I perform the same exercise
by student, assigning each student a status
percentile in each testing period and
assessing the change over three years.
Finally, I also compare student test score
gains over three years to estimated three-
year conditional growth norms from the
2015 MAP norms study.3 While I focus my
analysis on consistently-enrolled students –
those who experienced TtO for three years –
I also present results for all tested students in
the same cohort at the 14 three-year TtO
schools (regardless of whether or not those
students were consistently enrolled).
A secondary goal of the study is to better
understand the relationship between the
content students were presented with and
their test score gains. In particular, I
calculate an “effective grade level” for each
student based on his or her fall MAP test
score each year. I then compare this
effective grade level to the grade level of the
content they were exposed to during the
year. I term the difference between these
two grade levels a “content gap,” and
explore whether schools with smaller
average content gaps – those where students
are seeing content closer to their beginning-
of-year effective grade level – are showing
greater long-term gains on the MAP test.
population. For additional details, see the 2015 MAP
norming study at
https://www.nwea.org/content/uploads/2018/01/2015
-MAP-Norms-for-Student-and-School-Achievement-
Status-and-Growth.pdf 3 NWEA does not provide three-year conditional
growth norms, but I estimate them in two ways, as
discussed in detail in Appendix B.
Overall, I find evidence that TtO students
are improving on the MAP math test at a
faster rate than a nationally representative
comparison group. From fall 2015 to spring
2018, scores on the MAP math test among
consistently-enrolled TtO students improved
sufficiently to raise the average school-level
percentile by 20 points and the average
student-level percentile by 9 points.4 Over
those three years, consistently-enrolled
students at TtO schools experienced
approximately 23% more growth on the
math MAP test than a national reference
group, which corresponded to a three-year
effect size of approximately 0.16 standard
deviations. While these gains are largest for
consistently-enrolled students, they are
positive when looking at a broader group of
students at three-year TtO schools as well.
Underlying these overall gains was
significant heterogeneity by school. A group
of “MAP growth-aligned” schools – those
subject to external accountability systems
that prioritize growth on the MAP test –
showed average three-year gains of 38
school-level percentile points, which
corresponds to 15 student-level percentile
points, 53% more growth, and a 0.38 three-
year effect size. I also find suggestive
evidence that schools with a smaller content
gap – those where the content TtO presents a
student better matches his or her effective
grade level – tend to see greater gains.
These results should be interpreted with
caution. The MAP test is only one measure
of math knowledge, and the fact that
students at TtO schools grew, on average,
4 As discussed in detail later, the school-level and
student-level percentile gains are simply two
different benchmarks to contextualize the same
improvement in test scores. Because the national
school-level distribution of MAP scores is narrower
than the student-level distribution, as shown in Figure
A1 in the appendix, the same test score improvement
leads to a greater percentile gain against the school-
level distribution than the student-level distribution.

MarGrady Research
6
Three-Year MAP Growth at Schools Using Teach to One: Math
faster than a national reference group does
not indicate that TtO caused those gains.
Moreover, the national reference group may
be an imperfect comparison group for
students in TtO schools, who are more likely
to be poor, Black, and/or Latino than the
average American student.5 With these
caveats noted, however, it does appear that
TtO students grew more on the NWEA
MAP test than a national reference group,
and these results are robust to a number of
alternative specifications.
Data
This study uses a combination of student-
level data from New Classrooms and
publicly available data from the NWEA.
New Classrooms provided student-level
MAP results and demographic
characteristics for all students who
participated in TtO in any school between
2015-16 and 2017-18. MAP results included
a student’s test score (called a RIT score)
and testing time for the fall, winter, and
spring administrations of the test in each
year. Demographic characteristics included
a student’s race, sex, and indicators for
whether the student was an English
Language Learner, received special
education services, or qualified for free-or-
reduced price lunch. New Classrooms also
provided each student’s enrolled (i.e.
official) grade level in each year.6
5 There is some evidence that better matched
comparison groups may lead to similar results. See,
for example, Pane et. al. (2017)’s study of
personalized learning, where results using a Virtual
Control Group matched on student demographics and
other factors were similar to results using Conditional
Growth Norms (which is one method I use here). 6 Prior to 2017-18, New Classrooms did not always
keep separate records of a student’s enrolled grade
level, focusing instead on what the organization
referred to as an “anchor grade,” which defined the
end goal of various skill progressions a student might
see. In most cases, the anchor grade was equal to the
There are two sources of publicly-available
data from NWEA. The first is the “NWEA
2015 MAP Norms for Student and School
Achievement Status and Growth”
(subsequently referred to as the MAP
norms).7 These data are used as a
comparison point for the MAP gains of TtO
students to determine whether TtO students
have improved more or less than a
nationally representative group of students.
The MAP norms for math are developed
based on test records for over 10 million
unique students who took the MAP test
between the fall of 2011 and the spring of
2014, and the results are adjusted by NWEA
to be nationally representative. For each RIT
score in each grade in each testing term (fall,
winter, or spring) the study provides both a
student-level and school-level percentile for
that score against the estimated national
distribution of scores. The study also
provides an average score for each grade
and testing period, as well as growth norms
that represent the average growth
experienced by students between two testing
periods that are at most one year apart.
These norms are provided both overall (e.g.
for 6th graders, on average) and conditional
on a student’s starting score.
The second source of publicly-available
NWEA data is from the study “Linking the
PARCC Assessments to the NWEA MAP
Tests.”8 This study, completed by NWEA in
enrolled grade, but in some cases the two might be
different. In 2017-18, New Classrooms separated
enrolled grade from anchor grade and kept records of
both. The organization has worked to reconstruct the
correct enrolled grade for each student in prior years
from their records. 7
https://www.nwea.org/content/uploads/2018/01/2015
-MAP-Norms-for-Student-and-School-Achievement-
Status-and-Growth.pdf 8
https://www.nwea.org/content/uploads/2016/12/PAR
CC-MAP-Linking-Study-NOV2016.pdf

MarGrady Research
7
Three-Year MAP Growth at Schools Using Teach to One: Math
2016, estimates a student’s probability of
meeting grade-level standards on the
PARCC assessment at the end of the year
based on his or her fall or winter MAP
score. Historically, New Classrooms has
used this study to calculate a student’s
effective grade for internal analysis and
programming purposes. Following a similar
methodology, I calculate effective grade cut
points based on the fall MAP score required
to have a roughly 50% chance of meeting
grade-level standards on the end-of-year
PARCC exam for that grade. The effective
grade cut point for fifth grade, for example,
would be the fall MAP score that
corresponds to a 50% probability of passing
the fifth grade PARCC test at the end of the
year. Once the cut points are established,
each student is assigned an effective grade
level based on where their fall MAP score
falls relative to the grade level cut points.
Fractional grade levels are allowed, so a
student whose fall test score puts him or her
75% of the way from the grade 6 cut point to
the grade 7 cut point would be given a grade
level of 6.75, for example
Figure 1 shows demographic characteristics
of the TtO students included in this study
and compares them to national data. The
first column includes the 739 students who
were consistently enrolled in one of the 14
three-year TtO schools from the fall of 2015
to the spring of 2018. To be considered
consistently enrolled, a student had to be a
6th grader in 2015-16, a 7th grader in 2016-
17, and 8th grade in 2017-18. They also had
to be enrolled in the same school for all
Figure 1 – Demographic Profile of TtO Students Compared to the Nation
Source: TtO enrollment breakdown comes from New Classrooms. Note: the TtO enrollment numbers for consistently-enrolled students include
only students in the 14 3-Year MAP schools who were 6th graders in 2015-16, 7th graders in 2016-17, 8th graders in 2017-18, where enrolled in the same school for all three years, and had both a fall 2015 and a spring 2018 MAP score. The TtO enrollment numbers for all students in 3-Year
TtO schools include any student with a 6th grade MAP score in 2015-16, a 7th grade MAP score in 2016-17, or an 8th grade MAP score in 2017-
18. The national public school enrollment breakdown comes from the NCES Digest of Education Statistics Tables 203.70, 204.10, 204.20, and 204.60 (http://nces.ed.gov/programs/digest/current_tables.asp) as of fall 2015.
(1)
TtO: Consistently
Enrolled Students in
3-Year TtO Schools
(2)
TtO:
All Students in
3-Year TtO Schools
(3)
Nation:
All Public School
Students
Race / Ethnicity
% American Indian / Alaska Native 0% 0% 1%
% Asian / Pacific Islander 1% 1% 5%
% Black 51% 57% 16%
% Hispanic 40% 35% 26%
% White 8% 6% 49%
% Two or more races 0% 1% 3%
% Free Lunch 85% 84% 51%
% Special Education 12% 12% 13%
% English Language Learners 4% 9% 10%
Number of Students 739 1,675 50,438,000

MarGrady Research
8
Three-Year MAP Growth at Schools Using Teach to One: Math
three years and have a MAP test score in
both the fall of 2015 and the spring of 2018.
The second column includes a broader group
of students in the same 14 three-year TtO
schools. This group includes all those
students in the first column, as well as any
other students with a MAP test score in any
period between the fall of 2015 and the
spring of 2018. The final column – taken
from the federal Digest of Education
Statistics – contains a demographic
breakdown of public school enrollment for
the nation.
The demographic breakdown is quite similar
when comparing consistently-enrolled
students (column 1) to all enrolled students
(column 2) at three-year TtO schools.
English Language Learners are an
exception, with ELLs representing 4% of the
consistently-enrolled sample and 9% of the
wider sample of TtO students. Consistently-
enrolled students are also somewhat less
likely to be Black and more likely to be
Hispanic than all students. The differences
are more substantial when comparing TtO
students to the national average. TtO
students in this study are more likely to be
Black, Hispanic, and/or eligible for free or
reduced-price lunch than public school
students nationally. The share of students
requiring special education services and the
share who are English Language Learners
are similar when comparing all TtO students
in the 14 three-year schools to the national
average, though as noted earlier, the % ELL
decreases when restricting the sample to
consistently-enrolled students.
Methodology
To compare MAP gains at TtO schools to
national norms, I use three methods: change
in school-level percentile, change in student-
level percentile, and test score change vs.
estimated three-year conditional growth
norms.
Change in School-Level Percentile
To calculate the change in school-level
percentile, I first calculate the average MAP
score for the group under review: all
consistently-enrolled students in any of the
14 schools, all tested students in any of the
14 schools, or consistently-enrolled students
in a specific school. I then look up the
corresponding school-level percentile for
that score, grade, and testing season in Table
C.2 of the 2015 MAP norms study. The
change in school-level percentile is simply
the difference between the school percentile
in the spring of 2018 and the school
percentile in the fall of 2015.
Change in Student-Level Percentile
To calculate the change in student-level
percentile, I first assign a percentile to each
tested student in each season by comparing
his or her score to Table C.1 in the 2015
MAP norms study. I then calculate the
average student-level percentile for
whichever group I am considering:
consistently-enrolled students in any of the
14 schools, all students in any of the 14
schools, or consistently-enrolled students in
a specific school. The change in the student-
level percentile is the difference between the
average student percentile in the spring of
2018 and the average student percentile in
the fall of 2015.
Test Score Change vs. Estimated Three-Year Conditional Growth Norm
NWEA does not provide multi-year growth
norms in the 2015 norms study, so any
comparison of TtO gains to three-year
growth norms is necessarily speculative. The
simplest way to estimate three-year growth

MarGrady Research
9
Three-Year MAP Growth at Schools Using Teach to One: Math
norms is to calculate the difference between
the national average MAP score in the
spring of 6th grade (217.6) and the national
average MAP score in the fall of 8th grade
(230.9) from Table A in the 2015 MAP
norms study. This difference of 13.3 points
provides the unconditional growth norm. To
make this growth norm a conditional growth
norm – one that varies based on starting
score – I multiply it by the “adjustment
factor” from Table D in the 2015 MAP
norms study, where I define the adjustment
factor to be the ratio between the conditional
growth norm for a given starting percentile
and the unconditional, average growth norm
for the grade and growth period. Because the
adjustment factor varies by growth period, I
multiply the unconditional growth norm by
the average adjustment factor for three
growth periods: fall 6th grade to fall 7th
grade, fall 7th grade to spring 7th grade, and
spring 7th grade to spring 8th grade. In
addition to this method, I explore an
alternative way to calculate conditional
growth norms, described in detail in
Appendix B. However, the method
described above is preferred because it is
simple, reasonable, and provides results that
are consistent with the school-level and
student-level percentile analyses, which are
methods that require fewer assumptions.
Overall Results
Across all three methods, students in TtO
schools show greater MAP math gains than
the national reference group. Figure 2 shows
the average MAP score and school-level
percentile for the 739 consistently-enrolled
students in all 14 schools that participated in
TtO between 2015-16 and 2017-18. As
shown in the figure, the average MAP score
Figure 2 – Average MAP Score and School-Level Percentile (Consistently-Enrolled Students)
Note: includes only students who were 6th graders in 2015-16, 7th graders in 2016-17, 8th graders in 2017-18, enrolled in the same school for all
three years, and had both a fall 2015 and a spring 2018 MAP score. Students are not required to have a test score in every period to be included.
210.4
214.5
218.0216.5
219.7
223.6
221.9
225.5
227.5
15 15
18
21 21
27
31
3435
0
5
10
15
20
25
30
35
40
200
205
210
215
220
225
230
235
240
F 15-16 W 15-16 S 15-16 F 16-17 W 16-17 S 16-17 F 17-18 W 17-18 S 17-18
Avg. MAP Score
Percentile vs. All Schools
Students 739 713 730 694 718 735 707 709 739
Ave
rag
e M
AP
Sco
re
Scho
ol-L
evel
Per
cen
tile

MarGrady Research
10
Three-Year MAP Growth at Schools Using Teach to One: Math
increased from 210.4 in the fall of 2015-16,
when these students were 6th graders, to
227.5 in the spring of 2017-18, when these
students were 8th graders. This test score
increase was consistent with a 20-point
increase in the school-level percentile, from
the 15th percentile in the fall of 6th grade to
the 35th percentile in the spring of 8th grade.9
The increase in the student-level percentile
shows a similar pattern. Figure 3 shows the
school-level percentile by period on the left
and the average student-level percentile by
period on the right. Over three years, the
average student-level percentile for
consistently-enrolled students increased by
nine points, from 36 to 45.10 When
comparing test scores to the student-level
reference group, TtO students start at a
9 A similar analysis for a more recent cohort of
students suggests a slightly steeper increase over their
first two years (see Appendix C). 10 All student subgroups tested – special education,
ELL, free-or-reduced price lunch, Black, Latino,
higher percentile and go up fewer percentile
points than they do when against the school-
level distribution. This is simply because the
distribution of student-level scores is
substantially wider than the distribution of
school-level scores, as shown in Figure A1
in the appendix. Once you are well within
the bounds of the school-level distribution –
as most schools or groups of schools are –
an identical test score increase leads to a
greater percentile gain against the school-
level distribution than the student-level
distribution. Both methods are valid and
entirely consistent with one another – they
simply provide different yardsticks against
which to contextualize the size of the
observed gains at TtO schools.
White, male, and female students – show
improvements in their average student-level
percentile, and none of the differences between them
are statistically significant.
Figure 3 – School-Level and Avg. Student-Level Percentile (Consistently-Enrolled Students)
Note: includes only students who were 6th graders in 2015-16, 7th graders in 2016-17, 8th graders in 2017-18, enrolled in the same school for all
three years, and had both a fall 2015 and a spring 2018 MAP score. Students are not required to have a test score in every period to be included.
36.0 36.3
37.5
39.639.1
42.2
43.2
44.245.0
30
32
34
36
38
40
42
44
46
48
50
F 1
5-1
6
W 1
5-1
6
S 1
5-1
6
F 1
6-1
7
W 1
6-1
7
S 1
6-1
7
F 1
7-1
8
W 1
7-1
8
S 1
7-1
8
Average Student-Level Percentile
15 15
18
21 21
27
31
3435
5
10
15
20
25
30
35
40
45
F 1
5-1
6
W 1
5-1
6
S 1
5-1
6
F 1
6-1
7
W 1
6-1
7
S 1
6-1
7
F 1
7-1
8
W 1
7-1
8
S 1
7-1
8
School-Level Percentile
+20 Percentile Points vs. School-Level Distribution
+9 Percentile Points vs. Student-Level Distribution

MarGrady Research
11
Three-Year MAP Growth at Schools Using Teach to One: Math
The gains described earlier are restricted to
consistently-enrolled students to provide
insight into growth among students who
were exposed to the TtO program over three
years. We also see gains, though somewhat
smaller, when expanding the sample to
include all students tested in any time
period. As shown in Appendix D, the
school-level percentile for all students
increased by 13 points over three-years,
from 15 in the fall of 2015 to 28 in the
spring of 2018, and the average student-
level percentile increased by five points over
the same time period. Between the fall of 6th
grade and the spring of 8th grade, the
average test score for all students at the 14
three-year TtO schools increased by 14.9
points, 12% more than the national increase
of 13.3 points.
Figure 4 shows how the average three-year
change in the RIT score on the MAP test in
TtO schools compared to the estimated
three-year conditional growth norm. As
shown earlier in Figure 2, the average score
among consistently-enrolled students at TtO
11 Statistical significance calculated based on a one-
sample t-test with 739 student-level observations
comparing the null hypothesis that the mean
gains/norms is equal to one versus the alternative
schools increased by 17.1 points on the
MAP math test over three years. Each
student was assigned a separate estimated
three-year growth norm, conditional on his
or her starting score in the fall of 6th grade.
On average, students’ gains exceeded their
estimated three-year conditional growth
norms by approximately 3.1 points, which
represents 23% more growth in math test
scores over three years than the national
comparison group, a difference that is
statistically significant at the 0.05 level.11
Compared to the average 8th grade standard
deviation of 19.1 points, this improvement
represents a three-year effect size of 0.16
standard deviations.
In the appendix, I test the sensitivity of the
percentile increase and conditional growth
norm results to a variety of alternative
assumptions. I weight schools equally rather
than based on the number of tested students,
I apply MAP filters recommended for high-
stakes testing environments, and I test an
alternative method of estimating three-year
hypothesis that the mean gains/norms is not equal to
one. The standard error is robust and clustered at the
school level.
Figure 4 – Score Change vs. Estimated Three-Year Conditional Growth Norm
Note: numbers may not add due to rounding. The three-year conditional growth norm is estimated by taking the average spring 8th grade score and
subtracting the average fall 6th grade score, then adjusting by the average adjustment factor over three growth periods (see methodology section for
details). The estimated effect size divides the incremental gain by 19.1, which represents the student-level standard deviation of spring 8th grade MAP math scores. ** p < 0.01 * p < 0.05.
Results
Average Three-Year Change in RIT Score +17.1 points
Average Estimated Three-Year Conditional Growth Norm +13.9 points
Incremental Gains +3.1 points
Gains / Estimated Conditional Growth Norms 1.23*
Estimated Effect Size (Three-Year) 0.16 (three-year)
Sample Size 739 students / 14 schools

MarGrady Research
12
Three-Year MAP Growth at Schools Using Teach to One: Math
conditional growth norms.12 Under these
scenarios, the percentile gains are always
equal to or higher than those reported in the
main text. The school percentile gains range
from 20 to 28 for consistently-enrolled
students and from 13 to 22 for all students.
The student percentile gains range from 9 to
11 for consistently-enrolled students and
from 5 to 9 for all students. The gains vs.
conditional growth norms range from 0.97
to 1.40, with the preferred estimate of 1.23
roughly in between the high and low
estimates.
As shown in Figure 5, there was
considerable heterogeneity in gains by
school. Six schools saw their school-level
percentile increase by between 33 and 48
percentile points, seven schools saw more
12 In the sensitivity analysis, I apply New
Classrooms’ standard filters for high-stakes testing,
which include removing scores that are a drop of ten
or more points from the score in the immediately
prior testing period and removing scores where a
student’s testing time was 30 minutes lower than in
an adjacent testing period. These filters are generally
modest increases, ranging from one to 13
percentile points, and one school saw a
decline in its school-level percentile.
School-by-school results for average
student-level percentiles and gains vs.
conditional growth norms show a similar
pattern.
Exploratory Analysis
There are many reasons why some schools
may see greater growth over three years than
others. Perhaps the simplest is random
chance. Over any three-year period, students
in some schools are likely to grow more than
others, on average, simply by chance. In
Figure 5, the standard deviation in the
change in school-level percentiles among
based on the guidance provided by the NWEA in
“Guidance for Administering NWEA MAP/MPG
Assessments When Results are Used for High Stakes
Purposes” available at:
https://www.nwea.org/content/uploads/2017/04/Guid
ance-for-Administering-MAP-and-MPG-
Assessments-When-Results-are-Used.pdf
Figure 5 – Change in School-Level Percentile by School (Consistently-Enrolled Students)
Note: figure shows the change in the school-level percentile for consistently-enrolled students from the fall of grade 6 to the spring of grade 8. N
represents the number of consistently-enrolled students at the school.
4845
42 4036
33
13 12 127 6 4
1
-7-10
0
10
20
30
40
50
60
School
5School
1School
10School
7School
6School
4School
2School
8School
14School
11School
3School
13School
9School
12
N = 20 39 23 69 54 65 136 30 33 33 96 52 40 49

MarGrady Research
13
Three-Year MAP Growth at Schools Using Teach to One: Math
the 14 schools is 18.8 points. Is this more
than one would expect by chance? To help
answer to this question – based on one of the
ways that “chance” may affect schools – I
run a simulation where I assign all 739
consistently-enrolled students randomly to
schools in the study, keeping each school
with the same number of students.
Figure 6 shows the simulated percentile
gains by school for one simulation. While
some schools improve more than others – in
this case purely by chance – there is less
variation between schools than in the actual
results shown in Figure 5. The standard
deviation of the school-level results drops
from 18.8 points in Figure 5 (actual) to 5.9
points in Figure 6 (simulated). When
repeating this simulation ten times, the
13 The assignment of students to schools is only one
way in which “chance” or luck may lead schools to
have different MAP gains from one another through
no clear, causal mechanism. Other ways in which
average simulated standard deviation is 6.4
points with a minimum of 3.9 and a
maximum of 8.5. It seems plausible
therefore, that much of the school-level
heterogeneity we see in the actual results is
not due to chance, as least as far as chance is
defined as the random assignment of
students into schools.13
Aside from chance, there are many potential
hypotheses as to why some schools using
TtO grew more on the MAP math test than
others. In the sections below, I present
exploratory analysis related to two: the
content students are exposed to and the
external accountability systems schools face.
While too speculative to draw definitive
conclusions, these analyses point to
interesting areas for further research.
chance may affect school performance include the
quality of the teachers and the quality of the
principal, though the magnitude of the impact these
factors may have is difficult to model.
Figure 6 – Simulated Change in School-Level Percentile by School (Consistently-Enrolled Students)
Note: figure shows the simulated change in the school-level percentile for consistently-enrolled students from the fall of grade 6 to the spring of
grade 8, when students have been randomly assigned to schools (and school sizes are kept the same).
32
25 23 22 22 2219 18 17 17 16 16
10 9
-10
0
10
20
30
40
50
60
Sim.
School
9
Sim.
School
3
Sim.
School
6
Sim.
School
1
Sim.
School
7
Sim.
School
12
Sim.
School
2
Sim.
School
14
Sim.
School
11
Sim.
School
13
Sim.
School
4
Sim.
School
10
Sim.
School
8
Sim.
School
5

MarGrady Research
14
Three-Year MAP Growth at Schools Using Teach to One: Math
Content Gap
One hypothesis that may help explain the
variation in growth patterns by school is that
TtO provided a higher share of students in
high-growth schools with content that was at
the right level for them.
While there are many
ways to measure
whether content is “at
the right level” for a
student, I look at one
simple, high-level
measure here: the content gap.14 I define the
content gap as the gap between a student’s
effective grade level – that is, the grade level
at which he or she tests at – and the average
grade level of the content he or she is
exposed to.
14 This analysis explores a high-level relationship
based on the data available. Future research could
explore more nuanced ways to study the same
question: how does student success in math relate to
Over the time period of this study, the
content presented to students varied for
many reasons, with only one of them being
students’ tested ability (i.e. effective grade
level). Content also varied based on student
performance during the year as well as many
implementation decisions made by schools,
districts, and New Classrooms throughout
the year. Among these decisions, schools
and districts could implement floors or
the content they are presented? Through TtO, New
Classrooms is collecting some of the best data
available to try to answer this question.
Figure 7 – Content Gap Definition
Figure 8 – Skills and Effective Grade Level by Student in School 1 (2015-16, Grade 6)
Note: includes only students who were 6th graders in 2015-16, 7th graders in 2016-17, 8th graders in 2017-18, enrolled in the same school for all
three years, and had both a fall 2015 and a spring 2018 MAP score. Does not require a student to have a test score in every period. Effective grade level is determined based on the MAP score required to have a 50% change of scoring proficient on the PARCC test for that grade.
ContentGap
Average Grade Level of Skills
Effective Grade Level of Student = ‒
Stu
den
t 1
Stu
den
t 2
Stu
den
t 3
Stu
den
t 4
Stu
den
t 5
Stu
den
t 6
Stu
den
t 7
Stu
den
t 8
Stu
den
t 9
Stu
den
t 10
Stu
den
t 11
Stu
den
t 12
Stu
den
t 13
Stu
den
t 14
Stu
den
t 15
Stu
den
t 16
Stu
den
t 17
Stu
den
t 18
Stu
den
t 19
Stu
den
t 20
Stu
den
t 21
Stu
den
t 22
Stu
den
t 23
Stu
den
t 24
Stu
den
t 25
Stu
den
t 26
Stu
den
t 27
Stu
den
t 28
Stu
den
t 29
Stu
den
t 30
Stu
den
t 31
Stu
den
t 32
Stu
den
t 33
Stu
den
t 34
Stu
den
t 35
Stu
den
t 36
Stu
den
t 37
Stu
den
t 38
Stu
den
t 39
Gr 9 or Above
Gr 8
Gr 7
Gr 6
Gr 5
Gr 4 or Below
EnrolledGrade: 6
Grade 5 Grade 4 Grade 3
Gra
de
2
Gra
de
6
Gra
de
7Student’sEffectiveGrade:
80
40
0
30
60
Nu
mb
er o
f Sk
ills

MarGrady Research
15
Three-Year MAP Growth at Schools Using Teach to One: Math
ceilings restricting the grade level of content
students were exposed to and adjust the
tempo of the program, increasing or
decreasing the time before students were
moved on to new content, even if they
hadn’t yet demonstrated mastery.
To estimate each student’s effective grade
level in each year, I use the fall MAP test,
combined with the 2016 MAP-PARCC
Linking Study, as described in detail in the
Data section. I allow students to have
fractional grade levels, so a student whose
fall test score puts him or her 50% of the
way from the grade 6 cut point to the grade
7 cut point would be given an effective
grade level of 6.5, for example. I calculate
each student’s average content grade level as
the average grade level of all skills a student
is exposed to during a year. In grades 6-8,
consistently-enrolled students were exposed
to an average of 55 unique math skills per
year, each of which New Classrooms has
mapped to a specific grade level based on
the Common Core State Standards.
In Figure 8, we see the underlying data for
all consistently-enrolled 6th graders at
School 1, one of the 14 schools in this study.
Students are sorted into effective grade
levels based on their fall 2015 MAP test,
with higher scoring students on the left and
lower-scoring students on the right. In this
cohort, students’ scores put them in effective
grade levels ranging from 2nd grade to 7th
grade, similar to the variation in tested
ability seen in other schools. The y-axis
shows the number and level of skills each
student was exposed to through the TtO
program during the 2015-16 school year. As
one might expect, students on the left side of
the chart – with higher effective grade levels
– were exposed to more on or above grade
level skills than students on the right side of
the chart. Students on the right side of the
chart – with lower effective grade levels –
Figure 9 – Average Content Gap by Year by School
Note: includes only students who were 6th graders in 2015-16, 8th graders in 2017-18, enrolled in the same school for all three years, and had a Fall
2015-16 and Spring 2017-18 MAP score. Does not require a student to have a test score in every period. Effective grade level is determined based on the MAP score required to have a 50% change of scoring proficient on the PARCC test for that grade.
0.0
0.5
1.0
1.5
2.0
2.5
3.0
3.5
School6
School1
School10
School9
School5
School4
School13
School8
School7
School12
School11
School3
School2
School14
Co
nte
nt
Ga
p
2015-16 2016-17 2017-18 3-Year Average
MarGrady Research
16
Three-Year MAP Growth at Schools Using Teach to One: Math
tended to be exposed to predominantly
below grade-level skills.
On average, students in School 1 tested at an
effective grade level of 4.3 in 2015-16 and
were exposed to content at an average grade
level of 5.3, for a content gap of 1.0 grade
levels. This content gap increased to 1.6
grade levels in 2016-17 and 2.1 grade levels
in 2017-18. On average, across all three
years of this study, School 1 had a content
gap of 1.5 grade levels. Figure 9 shows the
content gap by year at all 14 schools in this
study. On average over three years, School 1
had the second lowest content gap.
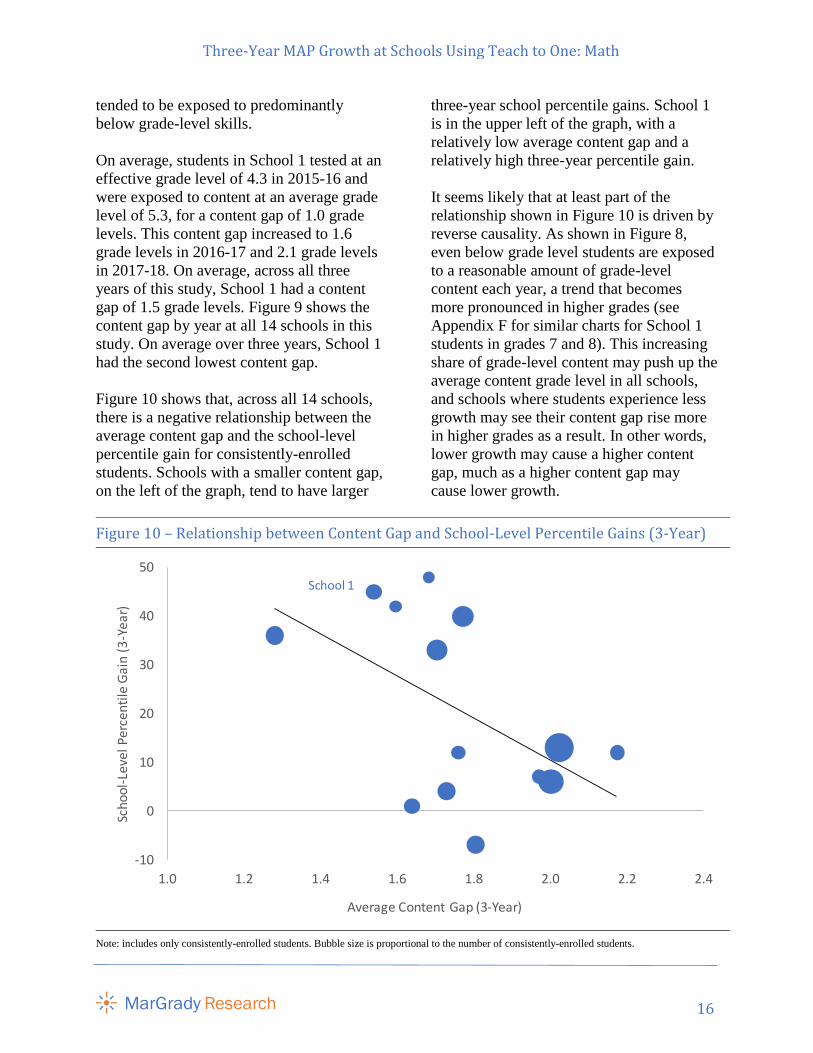
Figure 10 shows that, across all 14 schools,
there is a negative relationship between the
average content gap and the school-level
percentile gain for consistently-enrolled
students. Schools with a smaller content gap,
on the left of the graph, tend to have larger
three-year school percentile gains. School 1
is in the upper left of the graph, with a
relatively low average content gap and a
relatively high three-year percentile gain.
It seems likely that at least part of the
relationship shown in Figure 10 is driven by
reverse causality. As shown in Figure 8,
even below grade level students are exposed
to a reasonable amount of grade-level
content each year, a trend that becomes
more pronounced in higher grades (see
Appendix F for similar charts for School 1
students in grades 7 and 8). This increasing
share of grade-level content may push up the
average content grade level in all schools,
and schools where students experience less
growth may see their content gap rise more
in higher grades as a result. In other words,
lower growth may cause a higher content
gap, much as a higher content gap may
cause lower growth.
Figure 10 – Relationship between Content Gap and School-Level Percentile Gains (3-Year)
Note: includes only consistently-enrolled students. Bubble size is proportional to the number of consistently-enrolled students.
-10
0
10
20
30
40
50
1.0 1.2 1.4 1.6 1.8 2.0 2.2 2.4
Sch
oo
l-Le
vel P
erce
ntile
Gai
n (3
-Yea
r)
Average Content Gap (3-Year)
School 1

MarGrady Research
17
Three-Year MAP Growth at Schools Using Teach to One: Math
To assess the relationship in a manner less
vulnerable to this form of reverse causality,
Figure 11 shows the results of a bivariate
regression to predict the school-level
percentile gain based on the content gap
within each year. As shown in the figure, in
both 2015-16 and 2016-17, the relationship
between the annual content gap and the
annual percentile gain is statistically
insignificant (in 2015-16, the point estimate
is positive). Only in 2017-18 is the annual
relationship between the content gap and the
school-level percentile gains negative and
significant.15 As Figure 9 shows, 2017-18
was also the year with the largest content
gaps by school for most schools.
While content gaps grew over time in nearly
every school in the study, there is one factor
that may have accelerated this trend in half
the schools. In Schools 8 through 14, which
15 Appendix G shows similar results over two years
for the cohort of students who were 6th graders in
2016-17 and 7th graders in 2017-18. 16 The state, in this case, has multiple accountability
systems. One system, established by the legislature,
has state test score measures that focus only on
proficiency. The other system, established as a
department policy, focuses on both performance and
are all part of one district, all 8th grade
students studied Algebra I, which the
Common Core State Standards categorizes
as a 9th grade subject. Students in these
schools were pushed to master not only 8th
grade material, but 9th grade as well. In
addition, the district and New Classrooms
decided to set a higher TtO floor for 8th
graders in 2017-18 than was set for other
schools in this study. While Schools 1
through 7 had a floor of 5th grade in 2017-18
– meaning students could be taught skills
categorized as being at a 5th grade level if
appropriate – Schools 8 through 14 had a
floor of 6th grade in 2017-18. This higher
floor combined with a push towards 9th
grade content – despite the fact that students,
on average, were testing below a 6th grade
level in the district – led to particularly large
content gaps in many schools.
Growth-Aligned Accountability
An alternative, related hypothesis is that
growth differences (and perhaps content
gaps) between schools may be driven by
external accountability pressures. At one end
of the spectrum, some schools – such as
schools 8 through 14 in this study – are
subject to an accountability system that
focuses primarily on performance. On its
website, the district overseeing schools 8
through 14 outlines an accountability system
that gives schools rewards based entirely on
the proficiency rate achieved on state tests.16
At the other end of the spectrum, schools 4
growth on state tests, though there were no explicit
weights until the new ESSA approved system was
released in 2018. In addition to its own performance-
based accountability system, the district overseeing
Schools 8 through 14 links to the state’s
performance-based accountability system on its web
site (as of 12/1/18).
Figure 11 – Regression to Predict Annual School-Level Percentile Gain based on Annual Content Gap
Note: Robust standard errors in parentheses. Regressions weighted
by the number of consistently-enrolled students in each school. ** p<0.01, * p<0.05, ~ p<0.1
2015-16 2016-17 2017-18
Content Gap 8.190 -11.93 -11.66*
(5.935) (14.66) (5.007)
Constant -8.268 29.63 37.00*
(8.084) (27.84) (12.87)
Observations 14 14 14
R-squared 0.081 0.050 0.185

MarGrady Research
18
Three-Year MAP Growth at Schools Using Teach to One: Math
and 6 are part of a district that developed a
growth-focused accountability system based
on the NWEA’s MAP test.17 Of the test
score-based points on the district’s
accountability system, 75% are based on
MAP growth and 25% are based on MAP
performance. None of the points in this
district’s accountability system are based on
state test score results.
Figure 12 summarizes the accountability
system that each school is subject to. At the
top are those schools subject to an
accountability system that places the most
weight on growth. At the bottom are those
schools subject to an accountability system
that places the most weight on performance.
When they could be identified, Figure 12
lists district-based accountability systems,
on the assumption that those accountability
17 I also group school 5 with this MAP growth-
focused accountability group, because they are part
of a charter network where most schools – including
systems are likely to be of greatest relevance
to the school. However, in the case of
schools 1, 2, and 3, I was unable to identify
a formal district accountability system, so I
have instead noted the school-based or
statewide accountability system,
respectively.
In Figure 13, I show the change in school-
level percentile for schools divided into
three categories. The three schools –
numbers 4, 5 & 6 – in a district that uses
MAP growth as the primary factor in its
accountability system are categorized as
“MAP Growth Aligned.” The four schools –
numbers 1, 2, 3 & 7 – in districts that
include both state test score growth and state
test score performance in their
accountability systems are categorized as
“State Growth & Performance”. The seven
school 6 – are subject to external MAP growth
accountability.
Figure 12 – Growth vs. Performance in External Accountability Systems
Source: research by the author.
District Schools
Accountability
System Growth vs. Attainment
Relative
Weight on
Growth Notes
Large City A Schools 4, 5 & 6 District-based45% growth vs. 15%
attainment75%
• Uses the NWEA MAP test
• School 5 is outside the city and does not
receive an accountabilty score, but most of its
charter network does
Large City B School 7 District-based
No overall score, but
growth appears first on
the report
71%
• The district's previous accountability system
gave 60% weight to growth and 25% weight to
performance
Mid-sized City School 1 School-based
Goal 1 of local plan
targets growth and
attainment equally
50%• Accountabilty system is the charter's local plan
required for renewal
Large County Schools 2 & 3 State-based50% performance and
40% growth44%
• No known district-based accountability
system
Small City Schools 8-14 District-based100% based on state
proficiency rate0%
• District also links to state's performance-
based accountability system
• State's new ESSA accountability gives 50%
weight to growth vs. 35% to attainment
(released in 2018)

MarGrady Research
19
Three-Year MAP Growth at Schools Using Teach to One: Math
remaining schools – schools 8-14 – are
categorized as “State Proficiency Focused”
because their district focuses on proficiency
on the state test in its accountability system.
As shown in the chart, MAP Growth
Aligned schools increased their school-level
percentile by 38 points over three years,
State Growth & Performance schools
increased their school-level percentile by 20
points, and State Proficiency Focused
schools increased their school-level
percentile by seven points.
Figure 14 shows the same gains another
way, comparing the change in MAP score
by school category against the estimated
three-year conditional growth norms. The
Figure 13 – Change in School-Level Percentile by School Category
Note: figure shows percentile gain for consistently-enrolled students. The MAP Growth Aligned category includes schools 4, 5 & 6. The State Growth & Performance category includes schools 1, 2, 3 & 7. The State Proficiency Focused category includes schools 8-14.
Figure 14 – Gains / Estimated 3-Year Conditional Growth Norms by School Category
Note: Effect size calculated as the incremental gain in RIT score divided by the standard deviation of 8th grade spring math scores in the 2015 MAP Norms study. Significance calculated based on one-sample t-test. ** p < 0.01 * p < 0.05.
0 0
8
1614
23
30 31
38
5 6
11
16 1720
0
-5
-1 0-2
42
107
-10
-5
0
5
10
15
20
25
30
35
40
45
F 15-16 W 15-16 S 15-16 F 16-17 W 16-17 S 16-17 F 17-18 W 17-18 S 17-18
MAP Growth Aligned
State Growth & Performance
State Proficiency Focused
1.53**
1.26
1.02
1.0
1.1
1.2
1.3
1.4
1.5
1.6
MAP Growth Aligned State Growth & Performance State Proficiency Focused
Ga
in /
Est
imat
ed 3
-Yea
r Co
nd
.itio
nal
Gro
wth
No
rm

MarGrady Research
20
Three-Year MAP Growth at Schools Using Teach to One: Math
results show a similar pattern to the school-
level percentile gains in Figure 13, with
schools subject to more growth-aligned
accountability systems experiencing greater
gains. The three schools subject to a MAP
growth-aligned accountability system
improved their MAP score over three years
by 53% more than the estimated national
growth norms. This result is statistically
significant at traditional levels and
corresponds to a three-year effect size of
approximately 0.38 standard deviations.
Schools subject to state growth &
performance-focused accountability systems
improved their MAP score by approximately
26% more than the estimated national
growth norms, a result that is not statistically
significant at traditional levels. Finally,
schools subject to accountability systems
that focus on proficiency on state tests
showed average three-year gains nearly
identical to the estimated national norms.
Conclusion
The Teach to One: Math program is a
significant innovation in the way in which
math is taught to middle and high school
students. In an effort to provide more
personalized instruction, schools using TtO
reconfigure classrooms, invest in
technology, and re-envision the role of the
teacher. Given the investment, it is
reasonable to ask whether students
participating in the program learn more math
than they otherwise would.
This study takes one step in that direction by
asking whether students at the 14 schools
that used TtO over the last three school
years saw greater gains on the MAP math
test than a national reference group. In large
measure, the answer is yes. On average,
consistently-enrolled students at schools
using TtO between 2015-16 and 2017-18
saw their percentile ranking go up by 20
points against the school-level distribution
of scores and nine points against the student-
level distribution. These students grew an
average of 23% more than the estimated
three-year growth norms from a nationally
representative group of students, gains
which correspond to a three-year effect size
of approximately 0.16 standard deviations.
Gains are smaller but still positive for a
broader group of students, including those
who are not consistently enrolled. While this
study cannot establish causality, it is
encouraging to see average gains above
national norms, especially with a more
disadvantaged student population.
Underlying these average gains, however,
was significant heterogeneity by school.
Some schools grew substantially more than
the TtO-wide average, while others grew
less. In seeking to understand this variation,
I find two relationships that merit additional
exploration. First, there is some evidence
that schools with a smaller content gap – the
gap between students’ initial test scores and
the math content they were exposed to – saw
greater gains on the MAP test. Second, there
was a relationship between the external
accountability schools faced during this
period and their growth on the MAP test.
Schools facing a MAP growth-aligned
accountability system saw the largest gains
while schools facing a performance-focused
accountability system saw little, if any,
growth on the MAP test. While far from
conclusive, these relationships may provide
an avenue for further research as New
Classrooms seeks to identify why the TtO
program may work better for some students,
schools, and districts than others.

MarGrady Research
21
Three-Year MAP Growth at Schools Using Teach to One: Math
Appendix
Appendix A – Distribution of Student-Level vs. School-Level MAP Scores
Figure A1 shows the national student-level and school-level distribution of spring 8th grade MAP
scores from the 2015 MAP norms study. As can be seen in the figure, the student-level
distribution of scores is wider than the school-level distribution of scores, presumably because
most schools have a mix of high and low scoring students. The difference in the shape of the
distributions explains why incremental score increases that occur near the middle of the
distributions lead to greater percentile increases against the school-level distribution, since the
same score increase leads to a greater improvement in relative ranking (e.g. for the same score
increase, a school would pass more schools against the school-level distribution).
Figure A1 – National Distribution of Spring 8th Grade MAP Scores
Source: 2015 MAP Growth Norms Study.
0
1
2
3
4
5
6
7
8
9
18
0
18
2
18
4
18
6
18
8
19
0
19
2
19
4
19
6
19
8
20
0
20
2
20
4
20
6
20
8
21
0
21
2
21
4
21
6
21
8
22
0
22
2
22
4
22
6
22
8
23
0
23
2
23
4
23
6
23
8
24
0
24
2
24
4
24
6
24
8
25
0
25
2
25
4
25
6
25
8
26
0
26
2
26
4
26
6
26
8
27
0
27
2
27
4
27
6
27
8
28
0
Mo
re
Student Scores
School Scores
Num
ber
of p
erce
ntile
poi
nts
in e
ach
scor
e ba
nd

MarGrady Research
22
Three-Year MAP Growth at Schools Using Teach to One: Math
Appendix B – Estimation Methods for Three-Year Conditional Growth Norms
Figure B1 shows three one-year growth norms from Table D1 in the 2015 MAP Norms study. It
shows that, for example, the national reference group of students had an average score of 217.6
in the fall of 6th grade and improved to 225.3 by the spring of 6th grade, an increase of 7.7 points.
The chart shows smaller one-year growth for students from the spring of 6th grade to the spring
of 7th grade, and from the spring of 7th grade to the spring of 8th grade. Interestingly, the average
score at the starting point for each one-year growth period is lower than the average score for the
ending period of the previous one-year time period (e.g. the average score in the spring of 6th
grade is 225.3 when it is the end-point of a growth period, but 223.7 when it is the starting
point). This is presumably because a different group of students are used to develop the fall
grade 6 to spring grade 6 norm than are used to develop the spring grade 6 to spring grade 7
norm.
Because the 2015 MAP Norms study does not provide three-year growth norms, they must be
estimated. One simple method, referred to as Method 1 in Figure B1, is to subtract the fall 6th
grade score from the spring 8th grade score. This gives an unconditional three-year growth norm
Figure B1 – Methods for Estimating Three-Year NWEA MAP Growth Norms
Source: 2015 MAP Growth Norms Study.
217.6
225.3
223.7
228.6
226.9
230.9
210
215
220
225
230
235
Fall Grade 6 Spring Grade 6 Spring Grade 7 Spring Grade 8
Fall 6 to Spring 6 Spring 6 to Spring 7 Spring 7 to Spring 8
+7.7
+4.9
+4.0
NWEA MAP Growth Norms(2015 Study)
Method 1: 230.9 –217.9 = 13.3 points
Method 2: 7.7 + 4.9 + 4.0 = 16.6 points

MarGrady Research
23
Three-Year MAP Growth at Schools Using Teach to One: Math
of 13.3 points. An alternative method, referred to as Method 2 in Figure B1, is to add together
the three one-year growth norms shown in the figure. This gives an unconditional three-year
growth norm of 16.6 points. It is not immediately obvious which method is likely to be a better
estimate of the actual three-year growth norms, were NWEA to calculate them.
In the body of the study, I calculate gains vs. estimated three-year conditional norms based on
Method 1. Method 1 is preferred because it leads to gains that are consistent with the student
percentile gains shown elsewhere in the study. Method 1 implies a student-level percentile gain
of approximately 6 to 9 points, which is close to the actual gain of 9 points. Method 2, by
contrast, implies a student-level percentile decline of between 0 and 2 points. The actual student
percentile gain of 9 points is likely to be fairly accurate – and therefore a good reference point –
because it is based on data that are directly provided in the 2015 MAP norms study and requires
few assumptions to calculate. I provide results for Method 2 in Appendix D, which shows the
sensitivity of the overall results to various assumptions.

MarGrady Research
24
Three-Year MAP Growth at Schools Using Teach to One: Math
Appendix C – School-level Percentile Gains Over Two Years for a More Recent Cohort of Students
Figure C1 below shows the average test score increase and school-level percentile gains for the
cohort of students who were 6th graders in a TtO school in 2016-17 and 7th graders in a TtO
school in 2017-18. This cohort of students are one year younger than the cohort of students
studied in the main body of the paper and I only have two years of data on their performance.
However, they show gains over their first two years that are slightly larger than the gains shown
by the three-year cohort of students over their first two years.
This analysis includes all 21 schools that had 6th graders participate in TtO in 2016-17 and 7th
graders participate in TtO in 2017-18. This includes the 14 schools included in the three-year
analysis and seven additional schools.
Figure C1 – Average MAP Score and School-Level Percentile for Students Who Were 6th Graders in 2016-17 and 7th Graders in 2017-18
Note: the graph on the left includes only students who were 6th graders in 2016-17, 7th graders in 2017-18, enrolled in the same school for both years,
and had a Fall 2016-17 and Spring 2017-18 MAP score. The graph on the right includes all tested students in 6th grade in 2016-17 or in 7th grade in
2017-18.
210.3
214.7
219.2
217.5
221.0
224.4
1516
22
2526
31
0
5
10
15
20
25
30
35
40
205
210
215
220
225
230
235
240
F 16-17 W 16-17 S 16-17 F 17-18 W 17-18 S 17-18
Avg. MAP Score
Percentile vs. All Schools
Students 1,372 1,346 1,360 1,312 1,323 1,372 1,846 2,027 2,149 1,748 1,824 1,816
Ave
rage
MA
P S
core
Sch
oo
l-Le
vel
Per
cen
tile
Consistently Enrolled Students
210.3
214.1
218.2
216.0
218.9
223.0
1514
1819
18
25
0
5
10
15
20
25
30
35
40
205
210
215
220
225
230
235
240
F 16-17 W 16-17 S 16-17 F 17-18 W 17-18 S 17-18
Avg. MAP Score
Percentile vs. All Schools
Ave
rage
MA
P S
core
Sch
oo
l-Le
vel
Per
cen
tile
All Tested Students

MarGrady Research
25
Three-Year MAP Growth at Schools Using Teach to One: Math
Appendix D – Percentile Gains for All Tested Students
Figure D1 – School-Level and Average Student-Level Percentile (All Students)
Note: includes all tested students in all periods in the 14 schools that participated in TtO for three years from 2015-16 to 2017-18.
36.7 36.5
37.6
40.3
38.5
41.1
39.740.2
41.8
30
32
34
36
38
40
42
44
46
48
50
F 1
5-1
6
W 1
5-1
6
S 1
5-1
6
F 1
6-1
7
W 1
6-1
7
S 1
6-1
7
F 1
7-1
8
W 1
7-1
8
S 1
7-1
8
Average Student-Level Percentile
1514
16
21
19
24
22
24
28
5
10
15
20
25
30
35
40
45
F 1
5-1
6
W 1
5-1
6
S 1
5-1
6
F 1
6-1
7
W 1
6-1
7
S 1
6-1
7
F 1
7-1
8
W 1
7-1
8
S 1
7-1
8
School-Level Percentile
+13 Percentile Points vs. School-Level Distribution
+5 Percentile Points vs. Student-Level Distribution

MarGrady Research
26
Three-Year MAP Growth at Schools Using Teach to One: Math
Appendix E - Sensitivity of Overall Gain Results to Alternative Assumptions
Figure E1 shows results that appear in the body of the study highlighted in grey in column 1.
Over three years, consistently-enrolled students saw test score gains consistent with a 20
percentile point gain against the school-level distribution, a 9 percentile point gain against the
student-level distribution, and 23% more growth than the estimated three-year conditional
growth norms. When looking at all students in the 14 three-year TtO schools – not just those who
were consistently enrolled – we see percentile gains of 13 points and 5 points against the school-
and student-level distributions, respectively, and a gain in average test scores that was 12%
higher than the national gain.
Columns 2 through 8 in Figure E1 test the sensitivity of those results to alternative assumptions.
Columns 2, 4, 6, and 8 weight the results by school, rather than by student, when calculating
average gains. Columns 3, 4, 7, and 8 remove questionable test scores by applying MAP filters
recommended for high-stakes testing environments.18 Columns 5-8 estimate three-year
conditional growth norms using Method 2 – described in Appendix B – rather than Method 1.
18 These high-stakes filters, which are used by New Classrooms when reporting results, include removing scores that
are a drop of ten or more points from the score in the immediately prior testing period and removing scores where a
student’s testing time was 30 minutes lower than in an adjacent testing period. These filters are generally based on
the guidance provided by the NWEA in “Guidance for Administering NWEA MAP/MPG Assessments When
Figure E1 – Sensitivity of Overall Gain Results to Alternative Assumptions (note: the preferred results, shaded below, are shown in the main text)
* Gains / National Gains shows the increase in the average test score at TtO schools from fall of 6th grade to spring of 8th grade divided by 13.3, the
increase in the average MAP test score from fall of 6th grade to the spring of 8th grade in the 2015 MAP Norms study. Note: the School Percentile Gain, Student Percentile Gain, and Gains / National Gains are the same in columns 5-8 as in columns 1-4 because the estimation method for 3-Year
MAP growth norms does not affect these calculations.
Business Rules 1. Preferred 2 3 4 5 6 7 8
Weight Students or Schools Equally Students Schools Students Schools Students Schools Students Schools
Apply MAP High Stakes Filters No No Yes Yes No No Yes Yes
Estimation Method for 3-Year MAP
Growth Norms1 1 1 1 2 2 2 2
Consistently Enrolled Students 1. Preferred 2 3 4 5 6 7 8
School Percentile Gain 20 22 25 28 20 22 25 28
Student Percentile Gain 9 9 10 11 9 9 10 11
Growth / Conditional Growth Norm 1.23 1.26 1.31 1.35 0.97 1.00 1.03 1.08
Growth / Unconditional Growth Norm 1.28 1.31 1.37 1.40 1.03 1.05 1.09 1.12
All Students 1. Preferred 2 3 4 5 6 7 8
School Percentile Gain 13 17 16 22 13 17 16 22
Student Percentile Gain 5 7 6 9 5 7 6 9
Gains / National Gains* 1.12 1.21 1.19 1.31 1.12 1.21 1.19 1.31
MarGrady Research
27
Three-Year MAP Growth at Schools Using Teach to One: Math
Under these scenarios, the percentile gains are always equal to or higher than those reported in
the main text. The school percentile gains range from 20 to 28 for consistently-enrolled students
and from 13 to 22 for all students. The student percentile gains range from 9 to 11 for
consistently-enrolled students and from 5 to 9 for all students. The growth vs. conditional growth
norms range from 0.97 to 1.40, with the preferred estimate of 1.23 roughly in between the high
and low estimates. The simple gains vs. national gains measure – which measures the average
test score increase for all students at the 14 TtO schools vs. the national average test score
increase – ranges from 1.12 to 1.31.
Results are Used for High Stakes Purposes” available at: https://www.nwea.org/content/uploads/2017/04/Guidance-
for-Administering-MAP-and-MPG-Assessments-When-Results-are-Used.pdf

MarGrady Research
28
Three-Year MAP Growth at Schools Using Teach to One: Math
Appendix F – Content by Student at School 1 in 7th and 8th Grade
Figure F1 - Skills and Effective Grade Level by Student in School 1 (2016-17, Grade 7)
Note: includes only students who were 6th graders in 2015-16, 7th graders in 2016-17, 8th graders in 2017-18, enrolled in the same school for all three
years, and had both a fall 2015 and a spring 2018 MAP score. Does not require a student to have a test score in every period. Effective grade level is
determined based on the MAP score required to have a 50% change of scoring proficient on the PARCC test for that grade.
Stu
den
t 1
Stu
den
t 2
Stu
den
t 3
Stu
den
t 4
Stu
den
t 5
Stu
den
t 6
Stu
den
t 7
Stu
den
t 8
Stu
den
t 9
Stu
den
t 10
Stu
den
t 11
Stu
den
t 12
Stu
den
t 13
Stu
den
t 14
Stu
den
t 15
Stu
den
t 16
Stu
den
t 17
Stu
den
t 18
Stu
den
t 19
Stu
den
t 20
Stu
den
t 21
Stu
den
t 22
Stu
den
t 23
Stu
den
t 24
Stu
den
t 25
Stu
den
t 26
Stu
den
t 27
Stu
den
t 28
Stu
den
t 29
Stu
den
t 30
Stu
den
t 31
Stu
den
t 32
Stu
den
t 33
Stu
den
t 34
Stu
den
t 35
Stu
den
t 36
Stu
den
t 37
Stu
den
t 38
Stu
den
t 39
Gr 9 or Above
Gr 8
Gr 7
Gr 6
Gr 5
Gr 4 or Below
EnrolledGrade: 7
Grade 6 Grade 5 Grade 3
Gra
de
2
Gra
de
8
Gra
de
9Student’sEffectiveGrade:
60
30
0
30
60
Nu
mb
er
of
Skill
s
Gra
de
7
Grade 4

MarGrady Research
29
Three-Year MAP Growth at Schools Using Teach to One: Math
Figure F2 - Skills and Effective Grade Level by Student in School 1 (2017-18, Grade 8)
Note: includes only students who were 6th graders in 2015-16, 7th graders in 2016-17, 8th graders in 2017-18, enrolled in the same school for all three
years, and had both a fall 2015 and a spring 2018 MAP score. Does not require a student to have a test score in every period. Effective grade level is
determined based on the MAP score required to have a 50% change of scoring proficient on the PARCC test for that grade.
Stu
den
t 1
Stu
den
t 2
Stu
den
t 3
Stu
den
t 4
Stu
den
t 5
Stu
den
t 6
Stu
den
t 7
Stu
den
t 8
Stu
den
t 9
Stu
den
t 10
Stu
den
t 11
Stu
den
t 12
Stu
den
t 13
Stu
den
t 14
Stu
den
t 15
Stu
den
t 16
Stu
den
t 17
Stu
den
t 18
Stu
den
t 19
Stu
den
t 20
Stu
den
t 21
Stu
den
t 22
Stu
den
t 23
Stu
den
t 24
Stu
den
t 25
Stu
den
t 26
Stu
den
t 27
Stu
den
t 28
Stu
den
t 29
Stu
den
t 30
Stu
den
t 31
Stu
den
t 32
Stu
den
t 33
Stu
den
t 34
Stu
den
t 35
Stu
den
t 36
Stu
den
t 37
Gr 9 or Above
Gr 8
Gr 7
Gr 6
Gr 5
Gr 4 or Below
EnrolledGrade: 8
Grade 6 Grade 5 Grade 3
Gra
de
2
Grade 8
Student’sEffectiveGrade:
0
30
60
Nu
mb
er
of
Skill
s
Gra
de
7
Grade 4Grade 9
60
30

MarGrady Research
30
Three-Year MAP Growth at Schools Using Teach to One: Math
Appendix G – Two-Year Content Gap Analysis for Cohort Who Were 6th Graders in 2016-17
Figure G1 – Relationship Between Content Gap and School-Level Percentile Gains (2-Year)
Note: this figure shows the relationship between the average content gap (x-axis) and school-level percentile gain (y-axis) over two years for the
cohort of students who were 6th graders in 2016-17, 7th graders in 2017-18, consistently enrolled in the same school, and had a fall 2016 and spring
2018 MAP test score. The bubble size is proportional to the number of consistently-enrolled students.
Figure G2 – Regression to Predict Annual School-Level Percentile Gain Based on Annual Content Gap
Note: this figure shows the results of an Ordinary Least Squares regression to predict the annual school-level percentile gain based on the annual
content gap for the 21 schools that participated in TtO with 6th graders in 2016-17 and 7th graders in 2017-18. The analysis includes only consistently-
enrolled students who were 6th graders in 2016-17, 7th graders in 2017-18, consistently enrolled in the same school, and had a fall 2016 and spring 2018 MAP test score. Robust standard errors in parentheses. Regressions weighted by the number of consistently-enrolled students in each school.
** p<0.01, * p<0.05, ~ p<0.1
-30
-20
-10
0
10
20
30
40
50
0.5 1.0 1.5 2.0 2.5
Sch
oo
l-Le
vel P
erce
ntile
Gai
n (2
-Yea
r)
Average Content Gap (2-Year)
Grade 6 Grade 7
2016-17 2017-18
Content Gap 1.480 -12.43**
(9.434) (3.974)
Constant 5.585 30.17**
(12.40) (7.087)
Observations 21 21
R-squared 0.002 0.404