three total maximum daily loads for indicator bacteria in ... · three total maximum daily loads...
TRANSCRIPT

Draft for Public Comment April 2012
Three Total Maximum Daily Loads for Indicator Bacteria in the Carters Creek Watershed Segment 1209C, 1209D, 1209L Assessment Units 1209C_01, 1209D_01, 1209L_01
Water Qual i ty P lanning Divis ion, Off ice of Water
TEXAS COMMISSION ON ENVIRONMENTAL QUALITY

Three Total Maximum Daily Loads for Indicator Bacteria in the Carters Creek Watershed
Texas Commission on Environmental Quality ii For Public Comment, April 2012
Distributed by the Total Maximum Daily Load Team
Texas Commission on Environmental Quality MC-203
P.O. Box 13087 Austin, Texas 78711-3087
E-mail: [email protected]
TMDL project reports are available on the TCEQ website at: <www.tceq.texas.gov/goto/tmdl/>
This TMDL report is based in large part on the report titled:
“Contractor Draft Report Three Total Maximum Daily Loads for Indicator Bacteria in Carters Creek Watershed,”
prepared by the Texas Institute for Applied Environmental Research
The preparation of this report was financed in part through grants from the U.S. Environmental Protection Agency.
In compliance with the Americans with Disabilities Act, this document may be requested in alter-nate formats by contacting the TCEQ at 512/239-0028,
Fax 239-4488, or 1-800-RELAY-TX (TDD), or by writing to P.O. Box 13087, Austin, TX 78711-3087.

Three Total Maximum Daily Loads for Indicator Bacteria in the Carters Creek Watershed
Texas Commission on Environmental Quality iii For Public Comment, April 2012
Contents Executive Summary ............................................................................................................................ 1 Introduction ........................................................................................................................................ 3 Problem Definition .............................................................................................................................. 4
Ambient Indicator Bacteria Concentrations ................................................................................. 5 Watershed Overview ...................................................................................................................... 5
Endpoint Identification ...................................................................................................................... 11 Source Analysis ................................................................................................................................. 12
Regulated Sources ........................................................................................................................ 12 Domestic and Industrial Wastewater Treatment Facilities ................................................... 12
Sanitary Sewer Overflows ............................................................................................................ 13 TPDES-Regulated Stormwater .................................................................................................... 13
Illicit Discharges ..................................................................................................................... 15 Unregulated Sources .................................................................................................................... 16
Wildlife and Unmanaged Animal Contributions ................................................................... 16 Unregulated Agricultural Activities and Domesticated Animals .......................................... 16 Failing On-site Sewage Facilities ........................................................................................... 17 Domestic Pets ......................................................................................................................... 17 Bacteria Survival and Die-off ................................................................................................. 18
Linkage Analysis ................................................................................................................................ 18 Load Duration Curve Analysis .....................................................................................................20
Load Duration Curve Results ................................................................................................. 23 Margin of Safety ................................................................................................................................ 23 Pollutant Load Allocation ................................................................................................................. 26
Wasteload Allocation ................................................................................................................... 27 Load Allocation ............................................................................................................................ 31 Allowance for Future Growth ...................................................................................................... 32 Margin of Safety Equation ........................................................................................................... 33 TMDL Calculations ...................................................................................................................... 33
Seasonal Variation ............................................................................................................................ 37 Public Participation ........................................................................................................................... 38 Implementation and Reasonable Assurances .................................................................................. 38
Key Elements of an I-Plan ........................................................................................................... 39 References ......................................................................................................................................... 41
Figures Figure 1. Carters Creek watershed .............................................................................................. 2 Figure 2. Carters Creek watershed showing geographic and political locations and features .. 7 Figure 3. Selected photographs as examples of stream conditions in Country Club
Branch, Burton Creek, and Carters Creek .................................................................. 8 Figure 4. Wastewater treatment facilities (WWTFs) and monitoring stations within the
Carters Creek watershed .............................................................................................. 9 Figure 5. 2006 Land use/land cover within the entire Carters Creek watershed .................... 10 Figure 6. Load duration curve with flow regimes for station 11795, Country Club
Branch, Segment 1209D .......................................................................................... 24 Figure 7. Load duration curve with flow regimes for station 11783, Burton Creek,
Segment 1209L .......................................................................................................... 24

Three Total Maximum Daily Loads for Indicator Bacteria in the Carters Creek Watershed
Texas Commission on Environmental Quality iv For Public Comment, April 2012
Figure 8. Load duration curve with flow regimes for station 11784, Carters Creek, Segment 1209C .......................................................................................................... 25
Figure 9. Load duration curve with flow regimes for station 11785, Carters Creek, Segment 1209C .......................................................................................................... 25
Figure 10. Load Duration curves with flow regimes for the inlets and outlets of 1209D, 1209L, and 1209C ..................................................................................................... 26
Figure 11. Urbanized areas within the Carters Creek watershed (Source: 2000 Census) ........ 29 Figure A-1. Allocation loads for Segment 1209D as a function of water quality criteria ............ 44 Figure A-2. Allocation loads for Segment 1209L as a function of water quality criteria ............. 45 Figure A-3. Allocation loads for Segment1209C as a function of water quality criteria .............. 46
Tables Table 1. Summary of routine monitoring E. coli data from August 1997–December 2010 .... 6 Table 2. 2006 Land Use/Land Cover of the Carters Creek watershed ..................................... 9 Table 3. 2006 Land Use/Land Cover of the Carters Creek watershed, excluding the
Burton Creek watershed ............................................................................................. 11 Table 4. 2006 Land Use/Land Cover of the Burton Creek watershed, excluding Country
Club Lake, Country Club Branch, and Fin Feather Lake watersheds ........................ 11 Table 5. 2006 Land Use/Land Cover of the Country Club Branch watershed ........................ 11 Table 6. List of permitted discharge facilities for the Carters Creek watershed .................... 14 Table 7. Summary of SSO incidences in the Carters Creek watershed from January 2005 –
April 2011 ................................................................................................................... 15 Table 8. Phase II MS4 permits associated with the TMDL area watersheds ......................... 15 Table 9. Area under the jurisdiction of stormwater permits for Carters Creek, Burton
Creek, and Country Club Branch .............................................................................. 15 Table 10. Livestock statistics in Brazos County ....................................................................... 19 Table 11. OSSFs in the TMDL Watersheds ............................................................................... 19 Table 12. Estimated households and pet populations within TMDL watersheds ....................20 Table 13. Summary of TMDL and LATL calculations for Country Club Branch (Segment
1209D), Burton Creek (Segment 1209L), and Carters Creek (Segment 1209C) ...... 33 Table 14 Computed MOS for Country Club Branch (1209D), Burton Creek (Segment
1209L) and Carters Creek (Segment 1209C) ............................................................. 34 Table 15. Wasteload allocations for TPDES-permitted facilities.............................................. 34 Table 16. Recent discharges from domestic WWTFs into Segments 1209L and 1209C .......... 35 Table 17. Future Growth computations for Burton Creek (Segment 1209L) and Carters
Creek (Segment 1209C .............................................................................................. 35 Table 18. Regulated stormwater computation for Country Club Branch (Segment 1209D),
Burton Creek (Segment 1209L) and Carters Creek (Segment 1209C ....................... 36 Table 19. Computed unregulated stormwater term for Country Club Branch (1209D),
Burton Creek (Segment 1209L) and Carters Creek (Segment 1209C) ..................... 36 Table 20. TMDL allocation summary for Country Club Branch ( Segment 1209D),
Burton Creek (Segment 1209L) and Carters Creek (Segment 1209C) ..................... 37 Table 21. Final TMDL allocations for Country Club Branch (Segment 1209D), Burton
Creek (Segment 1209L) and Carters Creek (Segment 1209C) .................................. 37

Three Total Maximum Daily Loads for Indicator Bacteria in the Carters Creek Watershed
Texas Commission on Environmental Quality v For Public Comment, April 2012
List of Acronyms AU Assessment Unit AVMA American Veterinary Medical Association BMP Best Management Practice CFR Code of Federal Regulations cms Cubic Meters per Second DMR Discharge Monitoring Report E. coli Escherichia coli EPA U.S. Environmental Protection Agency FDC Flow Duration Curve FG Future Growth ha Hectare I/I Inflow and Infiltration I-Plan Implementation Plan LA Load Allocation LDC Load Duration Curve M3 Cubic Meter MGD Million Gallons per Day mL Milliliter mm Millimeter MOS Margin of Safety MPN Most Probable Number MS4 Municipal Separate Storm Sewer System NEIWPCC New England Interstate Water Pollution Control Commission NPDES National Pollutant Discharge Elimination System OSSF Onsite Sewage Facility SSO Sanitary Sewer Overflow SWAT Soil and Water Assessment Tool SWMP Stormwater Management Program SWQMIS Surface Water Quality Monitoring Information System TCEQ Texas Commission on Environmental Quality TIAER Texas Institute for Applied Environmental Research TMDL Total Maximum Daily Load TPDES Texas Pollutant Discharge Elimination System TWRI Texas Water Resources Institute USGS United States Geological Survey WLA Wasteload Allocation WQMP Water Quality Management Plan WWTF Wastewater Treatment Facility

Three Total Maximum Daily Loads for Indicator Bacteria in the Carters Creek Watershed
Texas Commission on Environmental Quality vi For Public Comment, April 2012

Texas Commission on Environmental Quality 1 For Public Comment, April 2012
Three Total Maximum Daily Loads for Indicator Bacteria
in the Carters Creek Watershed
Executive Summary This document describes total maximum daily loads for Country Club Branch, Carters Creek, and Burton Creek where concentrations of indicator bacteria ex-ceed the criteria used to evaluate attainment of the primary contact recreation use. The TCEQ first identified the impairments to Carters Creek in the 1999 Clean Water Act Section 303(d) List and Schedule for Development of Total Maximum Daily Loads (TMDLs) and to Burton Creek and Country Club Branch in the 2006 Texas Water Quality Inventory and 303(d) List.
Country Club Branch, Carters Creek, and Burton Creek lie within the Navasota River watershed (Figure 1). Carters Creek, a perennial stream, originates in southeastern Brazos County and flows 17 miles before joining the Navasota River. Burton Creek is a tributary of Carters Creek, and Country Club Branch is a tribu-tary to Burton Creek. The drainage area of the Carters Creek watershed, including Burton Creek and Country Club Branch, covers about 58 square miles.
Two small lakes are also located within the Carters Creek watershed—Fin Feather Lake, which lies directly upstream of Country Club Branch, and Country Club Lake, which lies directly upstream of Burton Creek. Bacteria levels in Fin Feather Lake and Country Club Lake are supporting primary contact recreation uses. These two segments are, therefore, not further considered for total maximum daily load development.
Portions of the growing cities of Bryan and College Station, defined in the 2000 U.S. Census as urbanized areas, lie within the Carters Creek, Burton Creek, and Country Club Branch watersheds.
Seven regulated facilities are located within the watersheds of these creeks and lakes; four of the facilities treat and discharge domestic wastewater and three fa-cilities discharge industrial wastewater. Two of the three industrial facilities, At-kins Power Station and the Arkema facility, are located in the watershed of Fin Feather Lake. Since Fin Feather Lake has acceptable bacteria levels, Atkins Power Station and the Arkema facility will not be considered in the load allocation.
Escherichia coli (E. coli) are the preferred indicator bacteria for assessing the primary contact recreation use in freshwater, and were used for development of the TMDL. The criteria for assessing attainment of the contact recreation use are expressed as the number (or “counts”) of E. coli bacteria, typically given as the

Figure 1. Carters Creek watershed

Three Total Maximum Daily Loads for Indicator Bacteria in the Carters Creek Watershed
Texas Commission on Environmental Quality 3 For Public Comment, April 2012
most probable number (MPN). The primary contact recreation use is not sup-ported when the geometric mean of all E. coli samples exceeds 126 MPN per 100 milliliter (mL), or if individual samples exceed 399 MPN per 100 mL more than 25 percent of the time.
Historical ambient water-quality data for indicator bacteria were analyzed on four TCEQ monitoring stations in the Carters Creek, Burton Creek, and Country Club Branch watersheds. The geometric means of E. coli from all four stations (two located on Carters Creek and one each on Burton Creek and Country Club Branch) exceeded the standard.
The most probable sources of indicator bacteria within the watersheds of the im-paired assessment units (AUs) are stormwater runoff from permitted municipal separate storm sewer system (MS4) sources, dry weather discharges (illicit dis-charges) from storm sewers, sanitary sewer overflows, and unregulated sources such as wildlife, unmanaged feral animals, livestock, and pets.
A load duration curve (LDC) analysis was used to quantify allowable pollutant loads and specific TMDL allocations for point and nonpoint sources of indicator bacteria. The allocations are discussed in the section “TMDL Calculations.”
The wasteload allocation (WLA) for wastewater treatment facilities (WWTFs) was established as the permitted flow multiplied by the geometric mean criterion for the indicator bacteria less the margin of safety (MOS). Compliance with these TMDLs is based on keeping indicator bacteria concentrations below the geomet-ric mean criterion.
Future growth of existing or new point sources was determined using population projections. The TMDL calculations in this report will guide determination of the assimilative capacity of each stream under changing conditions, including future growth. Wastewater discharge facilities will be evaluated case by case.
Introduction Section 303(d) of the federal Clean Water Act requires all states to identify waters that do not meet, or are not expected to meet, applicable water quality standards. States must develop a TMDL for each pollutant that contributes to the impair-ment of a listed water body. The TCEQ is responsible for ensuring that TMDLs are developed for impaired surface waters in Texas.
A TMDL is like a budget—it determines the amount of a particular pollutant that a water body can receive and still meet its applicable water quality standards. TMDLs are the best possible estimates of the assimilative capacity of the water body for a pollutant under consideration. A TMDL is commonly expressed as a load with units of mass per period of time, but may be expressed in other ways.

Three Total Maximum Daily Loads for Indicator Bacteria in the Carters Creek Watershed
Texas Commission on Environmental Quality 4 For Public Comment, April 2012
The TMDL Program is a major component of Texas’ overall process for managing the quality of its surface waters. The program addresses impaired or threatened streams, reservoirs, lakes, bays, and estuaries in, or bordering on, the state of Texas. The primary objective of the TMDL Program is to restore and maintain the beneficial uses—such as drinking water supply, recreation, support of aquatic life, or fishing—of impaired or threatened water bodies. This TMDL addresses im-pairments to the primary contact recreation use due to exceeding indicator bacte-ria criteria in Carters Creek, Burton Creek, and Country Club Branch.
Section 303(d) of the Clean Water Act and the implementing regulations of the U.S. Environmental Protection Agency (EPA) in Title 40 of the Code of Federal Regulations (CFR), Part 130 (40 CFR 130) describe the statutory and regulatory requirements for acceptable TMDLs. The EPA provides further direction in its Guidance for Water Quality-Based Decisions: The TMDL Process (EPA, 1991). This TMDL document has been prepared in accordance with those regulations and guidelines.
The TCEQ must consider certain elements in developing a TMDL. They are de-scribed in the following sections of this report:
Problem Definition Endpoint Identification Source Analysis Linkage Analysis Margin of Safety Pollutant Load Allocation Seasonal Variation Public Participation Implementation and Reasonable Assurance
Upon adoption of the TMDL report by the TCEQ and subsequent EPA approval, these TMDLs will become an update to the State’s Water Quality Management Plan (WQMP).
Problem Definition The TCEQ first identified the impairment to the contact recreation use for Carters Creek (Segment 1209C) in the 1999 Clean Water Act Section 303(d) List and Schedule for Development of Total Maximum Daily Loads (TCEQ, 1999). Im-pairment to the contact recreation use for Burton Creek (Segment 1209L) and Country Club Branch (Segment 1209D) was first identified in the 2006 Texas Water Quality Inventory and 303(d) List (TCEQ, 2006). The impaired AUs in Segments 1209C, 1209L, and 1209D are 1209C_01, 1209L_01, and 1209D_01 (TCEQ, 2008; 2010a).

Three Total Maximum Daily Loads for Indicator Bacteria in the Carters Creek Watershed
Texas Commission on Environmental Quality 5 For Public Comment, April 2012
Because all three impaired creeks each have only one AU, the AU descriptor is unnecessarily cumbersome. In this report, Carters Creek will be referred to syn-onymously with Segment 1209C, Burton Creek with Segment 1209L, and Country Club Branch with Segment 1209D. These three segments comprise the TMDL ar-ea addressed in this report. The phrase “TMDL watersheds” will be used when referring to the area of all three impaired segments, and “Carters Creek water-shed” will be used when referring to both the TMDL watersheds and non-impaired watersheds of Fin Feather Lake and Country Club Lake.
Segments 1209C, 1209D, and 1209L are listed due to impairment of the primary contact recreation use caused by elevated levels of indicator bacteria. The stand-ards for water quality are defined in the Texas Surface Water Quality Standards (TCEQ, 2010b). E. coli are the preferred indicator bacteria for assessing the rec-reational use in freshwater, and were used for analysis to support TMDL devel-opment for the Carters Creek watershed. The criteria for assessing attainment of the primary contact recreation use are expressed as the number (or “counts”) of E. coli bacteria, given as the most probable number (MPN). For the E. coli indica-tor, if the minimum sample requirement is met, the primary contact recreation use is not supported when:
the geometric mean of all E. coli samples exceeds 126 MPN per 100 mL; and/or individual samples exceed 399 MPN per 100 mL more than 25 per-
cent of the time.
Ambient Indicator Bacteria Concentrations Table 1 shows a summary of historical ambient indicator bacteria data from the TCEQ Surface Water Quality Monitoring Information System (SWQMIS) data-base for monitoring stations in the TMDL watersheds. As indicated in Table 1, all stations exceeded the geometric mean criterion of 126 MPN/100 ml. Therefore, Segments 1209C, 1209D, and 1209L—Carters Creek, Burton Creek, and Country Club Branch—do not support the contact recreation use.
Watershed Overview The Carters Creek watershed lies within the Navasota River watershed, which is entirely within Brazos County (Figure 2). Carters Creek (Segment 1209C), a per-ennial stream, originates in southeastern Brazos County and flows 17 miles before joining the Navasota River. Burton Creek (Segment 1209L) is a tributary of Cart-ers Creek, and Country Club Branch (Segment 1209D) is a tributary to Burton Creek (see Figure 3 for representative stream conditions).
Two small lakes are also located within the Carters Creek watershed—Fin Feather Lake (Segment 1209B), which lies directly upstream of Country Club Branch, and Country Club Lake (Segment 1209A), which lies directly upstream of Burton Creek. Bacteria levels in Segments 1209A and 1209B support primary contact

Three Total Maximum Daily Loads for Indicator Bacteria in the Carters Creek Watershed
Texas Commission on Environmental Quality 6 For Public Comment, April 2012
recreation uses. These two segments, therefore, are not further considered in this TMDL report.
Table 1. Summary of routine monitoring E. coli data from August 1997–December 2010
Downloaded from SWQMIS October 2011. Stations provided in an upstream to downstream order.
Seg-ment Station Location
No. of Samples
Range of Measured
E. coli Concentrations (MPN/100 mL)
Station Geometric
Mean (MPN/100 mL)
Segment Geometric
Mean (MPN/100 mL)
1209D 11795 Duncan Street 13 2 to >2,500 583 583
1209L 11783 State Hwy 6 30 12 to >24,000 517 517
1209C 11784 State Hwy 30 34 4 to >24,000 643 705
11785 Bird Pond Road 44 4 to >24,000 757
The drainage area of the entire Carters Creek watershed covers about 58 square miles. Portions of the growing Cities of Bryan and College Station, defined in the 2000 U.S. Census as urbanized areas, lie within the Carters Creek watershed. Among the seven regulated facilities located within the watershed, four of the fa-cilities treat and discharge domestic wastewater and three facilities discharge in-dustrial wastewater (Figure 4). Two of the three industrial facilities, Atkins Power Station and Arkema, are located in the watershed of Fin Feather Lake. Because bacteria levels in the lake are acceptable, Atkins Power Station and the Arkema facility will not be considered in the TMDL load allocation process.
The western portion of the Carters Creek watershed is dominated by developed urban areas; the eastern portion is rural (Figure 5). The dominant land use cate-gory within the watershed is developed, which accounts for over 53% of the area, followed by rangeland, which comprises nearly 29% of the area (Table 2). When excluding the Burton Creek watershed area, Carters Creek watershed is predomi-nately urban in its western portion and predominately rural (e.g., wooded and rangeland) in its eastern portion. The urban landscape (developed use) accounts for over 47% of the area. The categories of forest and rangeland are the dominant uses for the rural portion of the watershed (Table 3).
In contrast, the Burton Creek watershed (excluding Country Club Branch water-shed) is dominated by urban landscape, with the developed land use comprising almost 100 percent of the area (Table 4). Developed land comprises 100 percent of the area of the Country Club Branch watershed (Table 5).

Three Total Maximum Daily Loads for Indicator Bacteria in the Carters Creek Watershed
Texas Commission on Environmental Quality 7 For Public Comment, April 2012
Figure 2. Carters Creek watershed showing geographic and political locations and features

Three Total Maximum Daily Loads for Indicator Bacteria in the Carters Creek Watershed
Texas Commission on Environmental Quality 8 For Public Comment, April 2012
The climate in the Carters Creek watershed is subtropical humid with warm summers and dry winters (Office of Texas State Climatologist, 1983). As recorded by a National Weather Service Network Station in College Station (1971-2000), the normal daily minimum temperature is 57.7°F, normal daily maximum tem-perature is 79.4°F, and normal daily average temperature is 68.6°F. The normal annual precipitation is 39.7 inches.
Country Club Branch at Duncan Street Burton Creek at Sul Ross Park
(Source: TIAER, Aug. 2007) (Source: TWRI, Aug. 2010)
Carters Creek at Pond Road Carters Creek at William Fitch Pkwy
(Source: TWRI, Dec. 2010) (Source: TIAER, Aug. 2007)
Figure 3. Selected photographs as examples of stream conditions in Country Club Branch, Burton Creek, and Carters Creek

Three Total Maximum Daily Loads for Indicator Bacteria in the Carters Creek Watershed
Texas Commission on Environmental Quality 9 For Public Comment, April 2012
Figure 4. Wastewater treatment facilities (WWTFs) and monitoring stations within the Carters Creek watershed
Table 2. 2006 Land Use/Land Cover of the Carters Creek watershed
Source: Spatial Sciences Laboratory. Includes Burton Creek watershed.
Description Area (ha) % of Total
Developed 8,071 53.70
Rangeland 4,355 28.97
Forest 2,421 16.10
Agricultural Land* 88 0.59
Open Water 80 0.53
Barren Land 16 0.11
Total 15,031 100
* Agricultural Land is used for the production of annual crops, woody crops, and grasses for livestock grazing or hay crops.

Three Total Maximum Daily Loads for Indicator Bacteria in the Carters Creek Watershed
Texas Commission on Environmental Quality 10 For Public Comment, April 2012
Figure 5. 2006 Land use/land cover within the entire Carters Creek watershed
Source: Spatial Science Laboratory. Agricultural Land is used for the production of annual crops, woody crops, and grasses for livestock grazing or hay crops.

Three Total Maximum Daily Loads for Indicator Bacteria in the Carters Creek Watershed
Texas Commission on Environmental Quality 11 For Public Comment, April 2012
Table 3. 2006 Land Use/Land Cover of the Carters Creek watershed, excluding the Burton Creek watershed
(Source: Spatial Sciences Laboratory)
Description Area (ha) % of Total
Developed 6,292 47.52
Rangeland 4,353 32.88
Forest 2,420 18.28
Open Water 70 0.53
Agricultural Land* 88 0.67
Barren Land 16 0.12
Total 13,239 100
* Agricultural Land is used for the production of annual crops, woody crops, and grasses for livestock grazing or hay crops.
Table 4. 2006 Land Use/Land Cover of the Burton Creek watershed, excluding Country Club Lake, Country Club Branch, and Fin Feather Lake watersheds
(Source: Spatial Sciences Laboratory)
Description Area (ha) % of Total
Developed 1,411 99.996
Rangeland 0.058 0.004
Total 1,411 100
Table 5. 2006 Land Use/Land Cover of the Country Club Branch watershed
(Source: Spatial Sciences Laboratory)
Description Area (ha) % of Total
Developed 70 100
Total 70 100
Endpoint Identification All TMDLs must identify a quantifiable water quality target that indicates the de-sired water quality condition and provides a measurable goal for the TMDL. The TMDL endpoint also serves to focus the technical work to be accomplished and as a criterion against which to evaluate future conditions.
The endpoint for the TMDLs in this report is to maintain concentrations of E. coli below the geometric mean criterion of 126 MPN/100 mL. This is the endpoint in Carters Creek (1209C), Burton Creek (1209L), and Country Club Branch (1209D).

Three Total Maximum Daily Loads for Indicator Bacteria in the Carters Creek Watershed
Texas Commission on Environmental Quality 12 For Public Comment, April 2012
Source Analysis Potential sources of indicator bacteria pollution can be divided into two primary categories: regulated and unregulated. Pollution sources that are regulated have permits under the Texas Pollutant Discharge Elimination System (TPDES) and the National Pollutant Discharge Elimination System (NPDES). Examples of reg-ulated sources are wastewater treatment facility (WWTF) discharges; industrial facilities with individual stormwater permits and/or discharging treated industri-al wastewater and/or groundwater; and stormwater discharges from industries, construction activities, and MS4s.
Unregulated sources are typically nonpoint source in nature, meaning the pollu-tion originates from multiple locations and is usually carried to surface waters by rainfall runoff. Nonpoint sources are not regulated by permit.
With the exception of WWTFs, which receive individual WLAs (see the “Wasteload Allocation” section), the regulated and unregulated sources in this section are presented to give a general account of the different sources of bacteria expected in the watershed. These are not meant to be used for allocating bacteria loads or interpreted as precise inventories and loadings.
Regulated Sources Permitted sources are regulated by permit under the TPDES and the NPDES pro-grams. WWTF outfalls and stormwater discharges from industries, construction, and MS4s are the permitted sources in Segments 1209C, 1209D, and 1209L.
Domestic and Industrial Wastewater Treatment Facilities Among the seven regulated facilities located within the watershed, four of the fa-cilities treat and discharge domestic wastewater, two facilities discharge industri-al wastewater, and one facility is permitted to discharge industrial stormwater. The Texas A&M University Central Utility provides electric service and their dis-charge is associated with cooling water blow down. As stated previously, two of the industrial facilities are not considered because they discharge to Fin Feather Lake. The remaining four facilities are authorized to treat and discharge residen-tial and municipal wastewater.
The permitted discharge limits for each of the five facilities that are possible sources, and the actual average discharges for the period of available data from Discharge Monitoring Reports (DMRs), are provided in Table 6. The compliance histories for these facilities indicate some situations have occurred that have the potential of causing bacterial contamination in the watersheds.

Three Total Maximum Daily Loads for Indicator Bacteria in the Carters Creek Watershed
Texas Commission on Environmental Quality 13 For Public Comment, April 2012
Sanitary Sewer Overflows Sanitary sewer overflows (SSOs) are unauthorized discharges that must be ad-dressed by the responsible party, either the TPDES permittee or the owner of the collection system that is connected to a permitted system. SSOs in dry weather most often result from blockages in the sewer collection pipes caused by tree roots, grease, and other debris. Inflow and infiltration (I/I) are typical causes of SSOs under conditions of high flow in the WWTF system. Blockages in the line may exacerbate the I/I problem. Other causes, such as a collapsed sewer line, may occur under any condition.
The TCEQ maintains a database of SSO data collected from municipalities in the Carters Creek watershed. The SSO data from January 2005 through April 2011 is summarized in Table 7. There were approximately 304 SSOs reported in the Carters Creek watershed and they averaged 7,485 gallons per event. The volume of the median was much lower at 100 gallons per event because most SSO events were small. The largest SSO event volume reported was 2 million gallons, which occurred on January 29, 2010. This large SSO volume accounted for 88% of the total SSO volume reported from all events.
TPDES-Regulated Stormwater When evaluating stormwater for a TMDL allocation, a distinction must be made between stormwater originating from an area under a TPDES or NPDES-regulated discharge permit and stormwater originating from areas not under a TPDES or NPDES-regulated discharge permit. Stormwater discharges fall into two categories:
1) stormwater subject to regulation, which is any stormwater originating from TPDES-regulated Phase I or Phase II MS4, stormwater discharges associated with industrial activities, and stormwater discharges from regulated construc-tion activities; and
2) stormwater runoff not subject to regulation.
3) The geographic region of the Carters Creek watershed covered by MS4 per-mits is that portion of the study area defined by the 2000 Census as being an urbanized area (Figure 2). All MS4s in the Carters Creek watershed are regu-lated under Phase II general permits (Table 8). The percentages of land area under the jurisdiction of stormwater permits are shown in Table 9 for each of the three impaired watersheds.

Table 6. List of permitted discharge facilities for the Carters Creek watershed
TCEQ/EPA Permit
Receiving Stream Name
Facility Name
Permitted Flow Limit
(MGD†) Actual Avg. Flow
(MGD) (Time period)
Standard Indus-trial Classifica-tion Description
Reporting Requirement
for E. coli Levels
Disinfection Requirement
WQ0001906-000 TX0027952
Fin Feather Lake City of Bryan/ Atkins Power Station
0.385 Not available (recent permit)
Electric services No None
WQ0001393-000 TX0108863
Fin Feather Lake Arkema Inc. 0.12 No constant flow Pesticides and agricultural chemi-cals, not elsewhere classified
No None
WQ0004002-000 TX0002747
Carters Texas A&M University/ Central Utility
0.93 0.28 (Jan 2008-May 2009)
Electric services No None
WQ0010024-006 TX0047163
Carters City of College Station/ Carters Creek WWTF
9.5 5.92 (Jan 2008-May 2009)
Sewerage systems Yes UV system
WQ0010426-001 TX0022616
Burton City of Bryan Burton Creek WWTF
8.0 4.50 (Jan 2008-May 2009)
Sewerage systems Yes Chlorination
WQ0012296-001 TX0085456
Carters R&B Mobile Park LLC/ Glen OaksMHP WWTF
0.013 0.008 (Jan 2008-May 2009)
Operators of resi-dential mobile home sites
No Chlorination
WQ0013153-001 TX0098663
Carters City of College Station/ Carter Lake WWTF
0.0085 0.004* (Jan 2008-Dec 2009)
Sewerage systems No Other**
†MGD: million gallons per day
*Monthly Discharge data for Carter Lake WWTF was not available for the months of Oct 2008 through May 2009, July 2009, and August 2009.
**21-day residence time serves as disinfection

Three Total Maximum Daily Loads for Indicator Bacteria in the Carters Creek Watershed
Texas Commission on Environmental Quality 15 For Public Comment, April 2012
Table 7. Summary of SSO incidences in the Carters Creek watershed from January 2005 – April 2011
Volumes are presented in gallons which were estimated by the reporting entity.
No. of Incidences
Total Gallons*
Average Volume
(gallons)
Median Volume
(gallons)
Minimum Volume (gallons)
Maximum Volume (gallons)
304 2,275,522 7,485 100 2 2,000,000
Table 8. Phase II MS4 permits associated with the TMDL area watersheds
All Phase II entities are covered under TPDES General Permit No. TXR040000.
Regulated Entity Name NPDES Permit Number
Brazos County TXR040172
City of Bryan TXR040336
City of College Station TXR040008
Texas A&M University TXR040237
Texas Department of Transportation TXR040181
Table 9. Area under the jurisdiction of stormwater permits for Carters Creek, Burton Creek, and Country Club Branch
Segment
Area under jurisdic-tion of MS4 permits
(ha) Total watershed area
(ha)
Percentage of drain-age area under juris-diction of MS4 per-
mits (%)
1209D 70 70 100.0
1209L 1,394 1,411 98.8
1209C 6,754 13,240 51.0
Illicit Discharges Bacteria loads can enter the streams from MS4 outfalls that contain authorized sources as well as illicit discharges under both dry and wet weather conditions. The term “illicit discharge” is defined in TPDES General Permit No. TXR040000 for Phase II MS4s as “Any discharge to a municipal separate storm sewer that is not entirely composed of stormwater, except discharges pursuant to this general permit or a separate authorization and discharges resulting from emergency fire-fighting activities.” Illicit discharges can be categorized as either direct or indirect contributions. Examples of illicit discharges identified in the Illicit Discharge De-tection and Elimination Manual: A Handbook for Municipalities (NEIWPCC, 2003) include:

Three Total Maximum Daily Loads for Indicator Bacteria in the Carters Creek Watershed
Texas Commission on Environmental Quality 16 For Public Comment, April 2012
Examples of Direct illicit discharges:
sanitary wastewater piping that is directly connected from a home to the storm sewer;
materials that have been dumped illegally into a storm drain catch basin; a shop floor drain that is connected to the storm sewer; and a cross-connection between the sanitary sewer and storm sewer systems.
Examples of Indirect illicit discharges:
an old and damaged sanitary sewer line that is leaking fluids into a cracked storm sewer line; and
a failing septic system that is leaking into a cracked storm sewer line or causing surface discharge into the storm sewer.
Unregulated Sources Unregulated sources of indicator bacteria are generally nonpoint and can ema-nate from wildlife, various agricultural activities, unregulated urban runoff, fail-ing on-site sewage facilities (OSSFs), unmanaged animals, and domestic pets.
Wildlife and Unmanaged Animal Contributions E. coli bacteria are common inhabitants of the intestines of all warm blooded an-imals, including wildlife such as mammals, birds, and unmanaged feral animals. In developing bacteria TMDLs, it is important to identify by watershed the poten-tial for bacteria contributions from wildlife, birds, and unmanaged feral animals. Wildlife are naturally attracted to riparian corridors of streams and rivers. With direct access to the stream channel, the direct deposition of wildlife waste can be a concentrated source of bacteria loading to a water body. Fecal bacteria from wildlife are also deposited onto land surfaces, where it may be washed into near-by streams by rainfall runoff. In the TMDL watersheds avian species also fre-quent the watershed and its riparian corridor in particular. However, there are currently insufficient data available to estimate populations and spatial distribu-tion of wildlife and avian species in the watershed. Consequently, it is difficult to assess the magnitude of bacteria contributions from wildlife species as a general category. Studies in other watersheds have found avian species to be important contributors to the bacteria load (e.g., Hussong et al., 1979; Hyer and Moyer, 2003). There is also little information available on contributions from feral ani-mals in the watershed.
Unregulated Agricultural Activities and Domesticated Animals A number of agricultural activities that do not require permits can also be sources of fecal bacteria loading. Livestock are present throughout the more rural por-tions of the TMDL watersheds. These animals can serve as sources of bacteria loadings entering the TMDL watersheds.

Three Total Maximum Daily Loads for Indicator Bacteria in the Carters Creek Watershed
Texas Commission on Environmental Quality 17 For Public Comment, April 2012
A number of livestock are raised in Brazos County. Table 10 lists the statistics of livestock in Brazos County based on 2007 Census of Agriculture (USDA, 2007). It should be noted that the data in Table 10 are for the entirety of Brazos County, which is the lowest level of spatial data available on livestock from the census. As countywide data the tabular values do not reflect actual numbers in the TMDL watersheds, but do reflect anticipated relative livestock populations, e.g., more cattle and calves present in the watershed than goats. Activities, such as livestock grazing close to water bodies and farmers’ use of manure as fertilizer, can con-tribute E. coli to nearby water bodies. The county-wide livestock numbers in Ta-ble 10 are provided to demonstrate that livestock are a potential source of bacte-ria in the watershed. These livestock numbers, however, are not used to develop an allocation of allowable bacteria loading to livestock.
Failing On-site Sewage Facilities In July/August 2008 enquiries were undertaken into the conditions of OSSFs within the TMDL watersheds. The following information was obtained through personal communications with Mr. Don Plitt; the Brazos County designated OSSF program representative (Plitt, 2008). According to an estimate generated by the Brazos County Health Department, 455 households operated OSSFs within the TMDL watersheds portion of Brazos County (Table 11). The OSSF representa-tive for Brazos County reported that the soils in the county were mainly tight clays, with little sand, which are not ideal for septic systems with traditional soil adsorption fields. The representative estimated that the majority of all newly permitted OSSFs in the county were aerobic systems with pressurized distribu-tion systems. Problems with OSSFs in the county were reported to typically stem from overused and poorly maintained systems, although OSSFs in general within the county were regarded as being in good operation. It was also reported that the tight clay soils that predominate in the county mean that heavy rainfall events can cause particular problems for the underground septic systems with soil ad-sorption fields, many of which were installed in the 1970s.
Domestic Pets The number of domestic pets in the TMDL watersheds was estimated based on human population and number of households obtained from the U.S. Census Bu-reau (U.S. Census Bureau, 2009). The information obtained from the U.S. Census Bureau included population and household projections based on the 2000 census for tracts that encompassed the watersheds of Segments 1209C, 1209D, and 1209L. The tract level data were multiplied by the proportion of each census tract within the watershed to generate an estimate of the watershed’s population and number of households. This estimation assumes that the population/households are uniformly distributed within the area of each census tract, which is the best estimate that can be made with the available data.

Three Total Maximum Daily Loads for Indicator Bacteria in the Carters Creek Watershed
Texas Commission on Environmental Quality 18 For Public Comment, April 2012
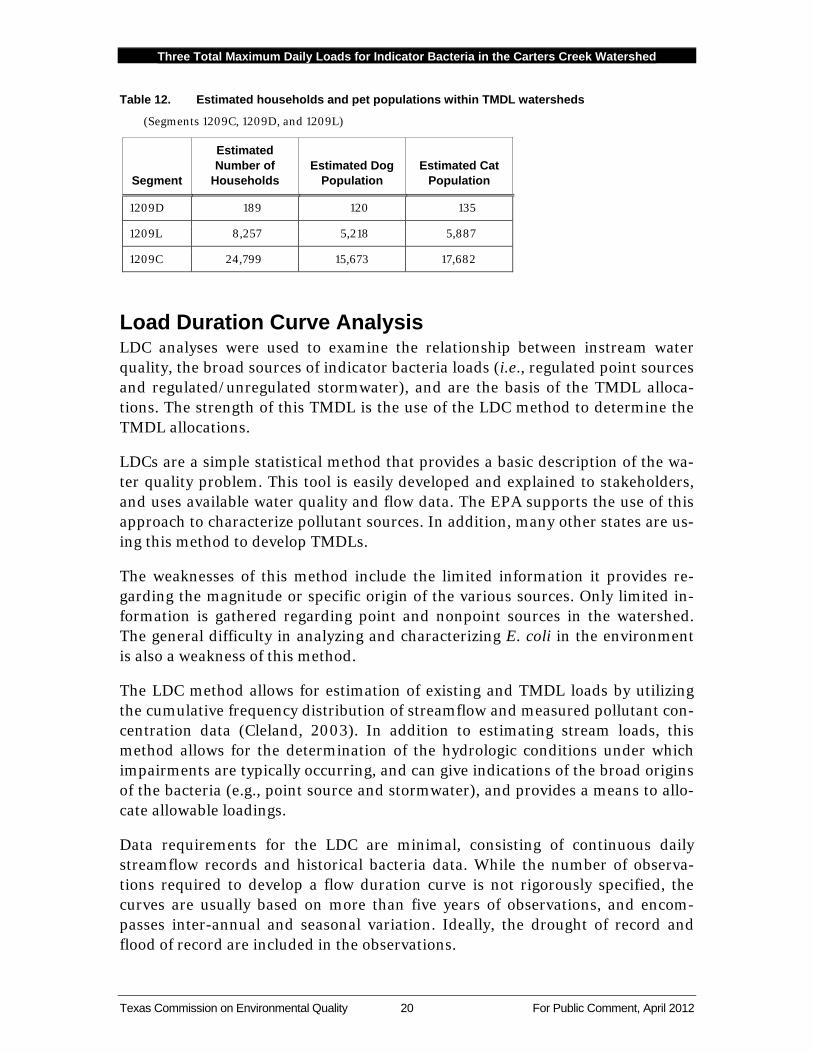
Fecal matter from dogs and cats may be transported to streams by runoff in both urban and rural areas and can be a potential source of bacteria loading. Table 12 summarizes the estimated number of dogs and cats for the impaired segments of the TMDL area watershed. Pet population estimates were calculated as the esti-mated number of dogs (0.632) and cats (0.713) per household (AVMA, 2009).
Bacteria Survival and Die-off Bacteria are living organisms that survive and die. Certain enteric bacteria can survive and replicate in organic materials if appropriate conditions prevail (e.g., warm temperature). Fecal organisms can survive and replicate from improperly treated effluent during their transport in pipe networks, and they can survive and replicate in organic rich materials such as compost and sludge. While the die-off of indicator bacteria has been demonstrated in natural water systems due to the presence of sunlight and predators, the potential for their re-growth is less well understood. Both processes (replication and die-off) are in-stream processes and are not considered in the bacteria source loading estimates of each water body in the TMDL area.
Linkage Analysis Establishing the relationship between instream water quality and the source of loadings is an important component in developing a TMDL. It allows for the evaluation of management options that will achieve the desired endpoint. The re-lationship may be established through a variety of techniques.
Generally, if high bacteria concentrations are measured in a water body at low to median flow in the absence of runoff events, the main contributing sources are likely to be point sources or direct deposition from animals and illicit discharges. During ambient flows, these constant inputs to the system will increase pollutant concentrations depending on the magnitude and concentration of the sources. As flows increase in magnitude, the impact of point sources is typically diluted, and would therefore be a smaller part of the overall concentrations.
Bacteria contributions from permitted and unregulated stormwater sources are greatest during runoff events. Rainfall runoff, depending upon the severity of the storm, has the capacity to carry indicator bacteria from the land surface into the receiving stream. Generally, this loading follows a pattern of low concentration in the water body just before the rain event, followed by a rapid increase in bacteria concentrations in the water body as the first flush of storm runoff enters the re-ceiving stream. Over time, the concentrations diminish because the sources of indicator bacteria are attenuated as runoff washes them from the land surface and the volume of runoff decreases following the rain event.

Three Total Maximum Daily Loads for Indicator Bacteria in the Carters Creek Watershed
Texas Commission on Environmental Quality 19 For Public Comment, April 2012
Table 10. Livestock statistics in Brazos County
Source: USDA, 2007. Countywide data; values not exclusively for the TMDL watersheds.
Livestock Number
Cattle and Calves 54,135
Hogs and Pigs 778
Chickens (W)
Ducks (W)
Emus 23
Geese 92
Ostriches (W)
Pheasants (W)
Pigeons or Squab 6
Other poultry (W)
Horses and Ponies 3,395
Sheep and Lambs 550
Deer* 986
Elk (W)
Goats 1,461
Llamas 47
Mules, Burros, and Donkeys
424
Alpacas 38
Rabbits 196
*Deer estimated in the census do not include wild deer.
Note: W denotes withheld to avoid disclosing data from individual farms.
Table 11. OSSFs in the TMDL Watersheds
(Source: Brazos County Health Department)
Location Number of OSSFs
Bird Pond Rd 31
Tonkaway Lake Rd 25
Rock Prairie Rd 30
Harris Lane 44
Carter Lake Rd 15
Nunn Jones 13
Ranchero Rd 11
Vista Lane 10
Pamela Lane 8
High Lonesome 9
Deer Run 23
Deerfield 11
Pate 9
Golden Nugget 10
Golden Trail 25
Rainbow Trail 3
Golden Mist 14
Roans Chapel 9
Hicks Lane 21
Wallis 13
Marino Rd 45
South Oaks 24
Sandpiper 21
Harpers Ferry Rd 31
Total 455
Three Total Maximum Daily Loads for Indicator Bacteria in the Carters Creek Watershed
Texas Commission on Environmental Quality 20 For Public Comment, April 2012
Table 12. Estimated households and pet populations within TMDL watersheds
(Segments 1209C, 1209D, and 1209L)
Segment
Estimated Number of
Households Estimated Dog
Population Estimated Cat
Population
1209D 189 120 135
1209L 8,257 5,218 5,887
1209C 24,799 15,673 17,682
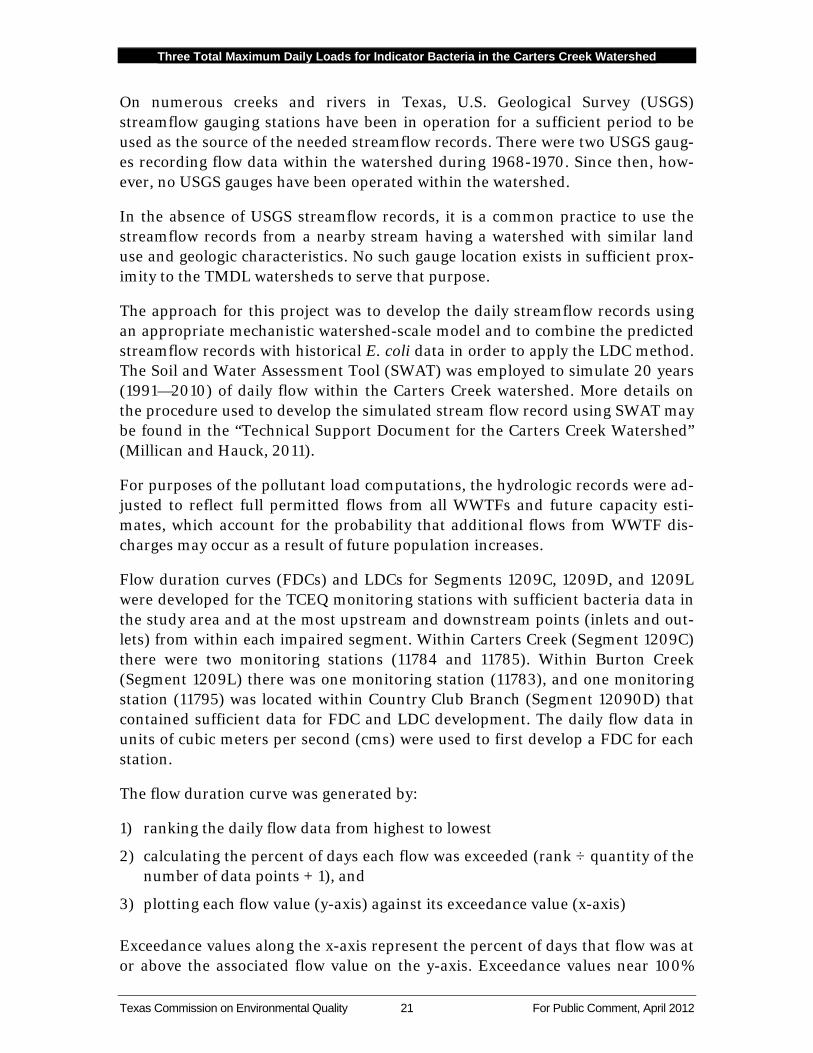
Load Duration Curve Analysis LDC analyses were used to examine the relationship between instream water quality, the broad sources of indicator bacteria loads (i.e., regulated point sources and regulated/unregulated stormwater), and are the basis of the TMDL alloca-tions. The strength of this TMDL is the use of the LDC method to determine the TMDL allocations.
LDCs are a simple statistical method that provides a basic description of the wa-ter quality problem. This tool is easily developed and explained to stakeholders, and uses available water quality and flow data. The EPA supports the use of this approach to characterize pollutant sources. In addition, many other states are us-ing this method to develop TMDLs.
The weaknesses of this method include the limited information it provides re-garding the magnitude or specific origin of the various sources. Only limited in-formation is gathered regarding point and nonpoint sources in the watershed. The general difficulty in analyzing and characterizing E. coli in the environment is also a weakness of this method.
The LDC method allows for estimation of existing and TMDL loads by utilizing the cumulative frequency distribution of streamflow and measured pollutant con-centration data (Cleland, 2003). In addition to estimating stream loads, this method allows for the determination of the hydrologic conditions under which impairments are typically occurring, and can give indications of the broad origins of the bacteria (e.g., point source and stormwater), and provides a means to allo-cate allowable loadings.
Data requirements for the LDC are minimal, consisting of continuous daily streamflow records and historical bacteria data. While the number of observa-tions required to develop a flow duration curve is not rigorously specified, the curves are usually based on more than five years of observations, and encom-passes inter-annual and seasonal variation. Ideally, the drought of record and flood of record are included in the observations.
Three Total Maximum Daily Loads for Indicator Bacteria in the Carters Creek Watershed
Texas Commission on Environmental Quality 21 For Public Comment, April 2012
On numerous creeks and rivers in Texas, U.S. Geological Survey (USGS) streamflow gauging stations have been in operation for a sufficient period to be used as the source of the needed streamflow records. There were two USGS gaug-es recording flow data within the watershed during 1968-1970. Since then, how-ever, no USGS gauges have been operated within the watershed.
In the absence of USGS streamflow records, it is a common practice to use the streamflow records from a nearby stream having a watershed with similar land use and geologic characteristics. No such gauge location exists in sufficient prox-imity to the TMDL watersheds to serve that purpose.
The approach for this project was to develop the daily streamflow records using an appropriate mechanistic watershed-scale model and to combine the predicted streamflow records with historical E. coli data in order to apply the LDC method. The Soil and Water Assessment Tool (SWAT) was employed to simulate 20 years (1991—2010) of daily flow within the Carters Creek watershed. More details on the procedure used to develop the simulated stream flow record using SWAT may be found in the “Technical Support Document for the Carters Creek Watershed” (Millican and Hauck, 2011).
For purposes of the pollutant load computations, the hydrologic records were ad-justed to reflect full permitted flows from all WWTFs and future capacity esti-mates, which account for the probability that additional flows from WWTF dis-charges may occur as a result of future population increases.
Flow duration curves (FDCs) and LDCs for Segments 1209C, 1209D, and 1209L were developed for the TCEQ monitoring stations with sufficient bacteria data in the study area and at the most upstream and downstream points (inlets and out-lets) from within each impaired segment. Within Carters Creek (Segment 1209C) there were two monitoring stations (11784 and 11785). Within Burton Creek (Segment 1209L) there was one monitoring station (11783), and one monitoring station (11795) was located within Country Club Branch (Segment 12090D) that contained sufficient data for FDC and LDC development. The daily flow data in units of cubic meters per second (cms) were used to first develop a FDC for each station.
The flow duration curve was generated by:
1) ranking the daily flow data from highest to lowest
2) calculating the percent of days each flow was exceeded (rank ÷ quantity of the number of data points + 1), and
3) plotting each flow value (y-axis) against its exceedance value (x-axis)
Exceedance values along the x-axis represent the percent of days that flow was at or above the associated flow value on the y-axis. Exceedance values near 100%

Three Total Maximum Daily Loads for Indicator Bacteria in the Carters Creek Watershed
Texas Commission on Environmental Quality 22 For Public Comment, April 2012
occur during low flow or drought conditions while values approaching 0% occur during periods of high flow or flood conditions.
Bacteria LDCs were then developed by multiplying each streamflow value along the flow duration curves by the E. coli criterion (126 MPN/100 mL) and by the conversion factor to convert to loading in colonies per day. This effectively dis-plays the LDC as the TMDL curve of maximum allowable loading:
TMDL (MPN/day) = criterion * flow (cms) * conversion factor
Where:
Criterion = 126 MPN/100 mL (E. coli)
Conversion factor (to MPN/day) = 8.64E+08 100 mL/m3 * seconds/day
The resulting curve plots each bacteria load value (y-axis) against its exceedance value (x-axis). Exceedance values along the x-axis represent the percent of days that the bacteria load was at or above the allowable load on the y-axis.
Historical bacteria data were then superimposed on the allowable bacteria LDC. Historical E. coli data were obtained from the TCEQ SWQMIS database. Each historical E. coli measurement was associated with the streamflow on the day of measurement and converted to a bacteria load. The associated streamflow for each bacteria loading was compared to the flow duration curve data to determine its value for “percent days flow exceeded,” which becomes the “percent of days load exceeded” value for plotting the E. coli loading. Each load was then plotted on the load duration curve at its percent exceedance. This process was repeated for each E. coli measurement at each station. Points above a curve represent exceedances of the bacteria criterion and its associated allowable loadings.
The flow exceedance frequency can be subdivided into hydrologic condition clas-ses to facilitate the diagnostic and analytical uses of FDCs and LDCs. The hydro-logic classification scheme utilized for the Carters Creek watershed TMDLs is as follows: very high flows (0–10%), high flows (10–50%), and low flows (50–100%). These three flow regimes were based on hydrology (shape of the FDCs). Additional information explaining the load duration curve method may be found in Cleland (2003) and NDEP (2003).
FDCs and LDCs were developed for the four TCEQ monitoring stations and at the most upstream and downstream points (inlets and outlets) from within each im-paired segment. The median loading of the very high flow regime (0-10% exceedance) is used for the Carters Creek, Burton Creek, and Country Club Branch TMDL calculations. The median loading of the very high flow regime (5% exceedance) is used for the TMDL calculations, because it represents a reasona-ble, yet high, value for the allowable pollutant load allocation.

Three Total Maximum Daily Loads for Indicator Bacteria in the Carters Creek Watershed
Texas Commission on Environmental Quality 23 For Public Comment, April 2012
Load Duration Curve Results At the TCEQ monitoring station locations (Figure 4), load relationships and pos-sible sources were defined through LDCs created with historical E. coli data and the associated daily average flow for the flow duration curves (Figures 6-9). Exceedances in the historical data above the geometric mean criterion of 126 MPN/100 mL at stations 11783, 11784, 11785, and 11795 were a common occur-rence across all flow regimes. E. coli loading exceedances were also not restricted to wet-weather events but occurred during conditions not influenced by rainfall runoff as well. (Note that wet-weather events for historical E. coli loadings on the LDCs were determined from rainfall measured at the National Weather Service Station in College Station, Texas.) Because spatial variability in rainfall is often large, errors may occur in designation of historical data as being associated with either wet weather or non-wet weather conditions.
The LDCs for the inlets and outlets of Segments 1209D, 1209L, and 1209C do not have associated historical E. coli data and were constructed for developing the TMDL allocation for each of the segments (Figure 10). The inlet LDC defines the upstream allowable loading entering the segment and outlet LDC defines the al-lowable loading leaving the segment. As anticipated the allowable loading in-creases in the downstream direction from inlet to outlet and from Segment 1209D to Segment 1209L to Segment 1209C.
Margin of Safety The MOS is used to account for uncertainty in the analysis used to develop the TMDL and thus provide a higher level of assurance that the goal of the TMDL will be met. According to EPA guidance (EPA, 1991), the MOS can be incorporated into the TMDL using two methods:
1) Implicitly incorporating the MOS using conservative model assumptions to develop allocations; or
2) Explicitly specifying a portion of the TMDL as the MOS and using the re-mainder for allocations.
The MOS is designed to account for any uncertainty that may arise in specifying water quality control strategies for the complex environmental processes that af-fect water quality. Quantification of this uncertainty, to the extent possible, is the basis for assigning an MOS.

Three Total Maximum Daily Loads for Indicator Bacteria in the Carters Creek Watershed
Texas Commission on Environmental Quality 24 For Public Comment, April 2012
Figure 6. Load duration curve with flow regimes for station 11795, Country Club Branch,
Segment 1209D
E. coli samples collected within 4 days of a precipitation event exceeding 10 mm are designated as triangles.
Figure 7. Load duration curve with flow regimes for station 11783, Burton Creek, Segment 1209L
E. coli samples collected within 4 days of a precipitation event exceeding 10 mm are designated as triangles.

Three Total Maximum Daily Loads for Indicator Bacteria in the Carters Creek Watershed
Texas Commission on Environmental Quality 25 For Public Comment, April 2012
Figure 8. Load duration curve with flow regimes for station 11784, Carters Creek, Segment 1209C
E. coli samples collected within 4 days of a precipitation event exceeding 10 mm are designated as triangles.
Figure 9. Load duration curve with flow regimes for station 11785, Carters Creek, Segment 1209C
E. coli samples collected within 4 days of a precipitation event exceeding 10 mm are designated as triangles.

Three Total Maximum Daily Loads for Indicator Bacteria in the Carters Creek Watershed
Texas Commission on Environmental Quality 26 For Public Comment, April 2012
Figure 10. Load Duration curves with flow regimes for the inlets and outlets of 1209D, 1209L,
and 1209C
The TMDLs covered by this report incorporate an explicit MOS by setting a target for indicator bacteria loads that is 5 percent lower than the geometric mean crite-rion. For contact recreation, this equates to a geometric mean target of 120 MPN/100 mL of E. coli. The net effect of the TMDL with MOS is that the allowa-ble pollutant loading of each water body is slightly reduced.
Pollutant Load Allocation The TMDL represents the maximum amount of a pollutant that the stream can receive in a single day without exceeding water quality standards. The pollutant load allocations for the selected scenarios were calculated using the following equation:
TMDL = ΣWLA + ΣLA + ΣFG + MOS
Where:
WLA = wasteload allocation, the amount of pollutant allowed by permitted or regulated dischargers
LA = load allocation, the amount of pollutant allowed by unregulated sources

Three Total Maximum Daily Loads for Indicator Bacteria in the Carters Creek Watershed
Texas Commission on Environmental Quality 27 For Public Comment, April 2012
FG = loadings associated with future growth from potential permitted fa-cilities
MOS = margin of safety load
As stated in 40 CFR, §130.2(1), TMDLs can be expressed in terms of mass per time, toxicity, or other appropriate measures. For E. coli, TMDLs are expressed as MPN/day, and represent the maximum one-day load the stream can assimilate while still attaining the standards for surface water quality.
The bacteria TMDLs for the 303(d)-listed Segments 1209C, 1209D, and 1209L as cov-ered in this report were derived using LDCs developed for the outlet of each impaired segment. The estimated maximum allowable loads of E. coli for each of the segments was determined as that corresponding to the median flow within the very high flow regime.
Wasteload Allocation TPDES-permitted wastewater treatment facilities are allocated a daily wasteload (WLAWWTF) calculated as their full permitted discharge flow rate multiplied by the instream geometric criterion after reductions for the MOS. This is expressed in the following equation:
WLAWWTF = Criterion * flow (MGD) * Conversion Factor * (1 – FMOS)
Where:
Criterion = 126 MPN/100 mL
Flow (MGD) = full permitted flow
Conversion factor = 3.7854E+07 100 mL / MGD
FMOS = fraction of loading assigned to margin of safety (5% or 0.05)
In Segment 1209C there are three facilities that treat domestic wastewater, Cart-ers Creek WWTF (WQ0010024-006), Glen Oaks MHP WWTF (WQ0012296), and Carter Lake WWTF (WQ0013153). In Segment 1209C there is also one facili-ty that has a discharge associated with cooling water blowdown, Texas A&M Cen-tral Utility (WQ0004002). The combined loading from these facilities represent the WLAWWTF allocation for Segment 1209C. In Segment 1209L there is only one facility, Burton Creek WWTF (WQ0010426), therefore loading from this facility represents the entire WLAWWTF allocation in that segment. Segment 1209D has no facilities regulated for discharge to include in the WLAWWTF term.
Stormwater discharges from MS4, industrial, and construction areas are consid-ered permitted or regulated point sources. Therefore, the WLA calculations must also include an allocation for regulated stormwater discharges (WLASW). A sim-plified approach for estimating the WLA for these areas was used in the develop-ment of these TMDLs due to the limited amount of data available, the complexi-

Three Total Maximum Daily Loads for Indicator Bacteria in the Carters Creek Watershed
Texas Commission on Environmental Quality 28 For Public Comment, April 2012
ties associated with simulating rainfall runoff, and the variability of stormwater loading.
The percentage of each watershed that is under the jurisdiction of stormwater permits (i.e., defined as the area designated as urbanized area in the 2000 US Census) is used to estimate the amount of the overall runoff load to be allocated as the regulated stormwater contribution in the WLASW component of the TMDL (Figure 11). The LA component of the TMDL corresponds to direct nonpoint run-off and is the difference between the total load from stormwater runoff and the portion allocated to WLASW.
Thus, WLASW is the sum of loads from regulated stormwater sources and is calcu-lated as follows:
ΣWLASW = (TMDL - ΣWLAWWTF – LA - ΣFG - MOS) * FDASWP
Where:
ΣWLASW = sum of all permitted or regulated stormwater loads
TMDL = total maximum daily load
ΣWLAWWTF = sum of all WWTF loads
LA = load allocation, the amount of pollutant allowed by unregulated sources.
ΣFG = sum of future growth loads from potential permitted facilities
MOS = margin of safety load
FDASWP = fractional proportion of drainage area under jurisdiction of stormwater permits
Additional stormwater dischargers represent additional flow that is not account-ed for in the current allocations. In urbanized areas currently regulated by an MS4 permit, development and/or re-development of land in urbanized areas must implement the control measures/programs outlined in an approved Stormwater Management Program (SWMP). Although additional flow may occur from development or re-development, loading of the pollutant of concern should be controlled and/or reduced through the implementation of best management practices (BMPs) as specified in both the NPDES or TPDES permit and the SWMP.
An iterative, adaptive management approach will be used to address stormwater discharges. This approach encourages the implementation of structural or non-structural controls, implementation of mechanisms to evaluate the performance of the controls, and finally, allowance to make adjustments (e.g., more stringent controls or specific BMPs) as necessary to protect water quality.

Three Total Maximum Daily Loads for Indicator Bacteria in the Carters Creek Watershed
Texas Commission on Environmental Quality 29 For Public Comment, April 2012
Figure 11. Urbanized areas within the Carters Creek watershed (Source: 2000 Census)
The TCEQ intends to implement the individual WLAs through the permitting process as monitoring requirements and/or effluent limitations as required by the amendment of 30 Texas Administrative Code Chapter 319 which became ef-fective November 26, 2009. WWTFs discharging to the TMDL Segments will be

Three Total Maximum Daily Loads for Indicator Bacteria in the Carters Creek Watershed
Texas Commission on Environmental Quality 30 For Public Comment, April 2012
assigned an effluent limit based on the TMDL. Monitoring requirements are based on permitted flow rates and are listed in §319.9.
The permit requirements will be implemented during the routine permit renewal process. However, there may be a more economical or technically feasible means of achieving the goal of improved water quality and circumstances may warrant changes in individual WLAs after this TMDL is adopted. Therefore, the individual WLAs, as well as the WLAs for stormwater, are non-binding until implemented via a separate TPDES permitting action, which may involve preparation of an up-date to the state’s Water Quality Management Plan. Regardless, all permitting actions will demonstrate compliance with the TMDL.
The executive director or commission may establish interim effluent limits and/or monitoring-only requirements at a permit amendment or permit renewal. These interim limits will allow a permittee time to modify effluent quality in or-der to attain the final effluent limits necessary to meet the TCEQ and EPA ap-proved TMDL allocations. The duration of any interim effluent limits may not be any longer than three years from the date of permit re-issuance. New permits will not contain interim effluent limits because compliance schedules are not allowed for a new permit.
Where a TMDL has been approved, domestic WWTF TPDES permits will require conditions consistent with the requirements and assumptions of the WLAs. For NPDES/ TPDES-regulated municipal, construction stormwater discharges, and industrial stormwater discharges, water quality-based effluent limits that imple-ment the WLA for stormwater may be expressed as BMPs or other similar re-quirements, rather than as numeric effluent limits (November 12, 2010, memo-randum from EPA relating to establishing WLAs for stormwater sources). The EPA memo states that:
“...the Interim Permitting Approach Policy recognizes the need for an iterative approach to control pollutants in stormwater discharges...[s]pecifically, the policy anticipates that a suite of BMPs will be used in the initial rounds of permits and that these BMPs will be tailored in subsequent rounds.”
Using this iterative adaptive BMP approach to the maximum extent practicable is appropriate to address the stormwater component of this TMDL.
This TMDL is, by definition, the total of the sum of the WLA, the sum of the LA, and the MOS. Changes to individual WLAs may be necessary in the future in or-der to accommodate growth or other changing conditions. These changes to indi-vidual WLAs do not ordinarily require a revision of the TMDL document; instead, changes will be made through updates to the TCEQ’s Water Quality Management Plan. Any future changes to effluent limitations will be addressed through the
Three Total Maximum Daily Loads for Indicator Bacteria in the Carters Creek Watershed
Texas Commission on Environmental Quality 31 For Public Comment, April 2012
permitting process and by updating the Water Quality Management Plan (WQMP).
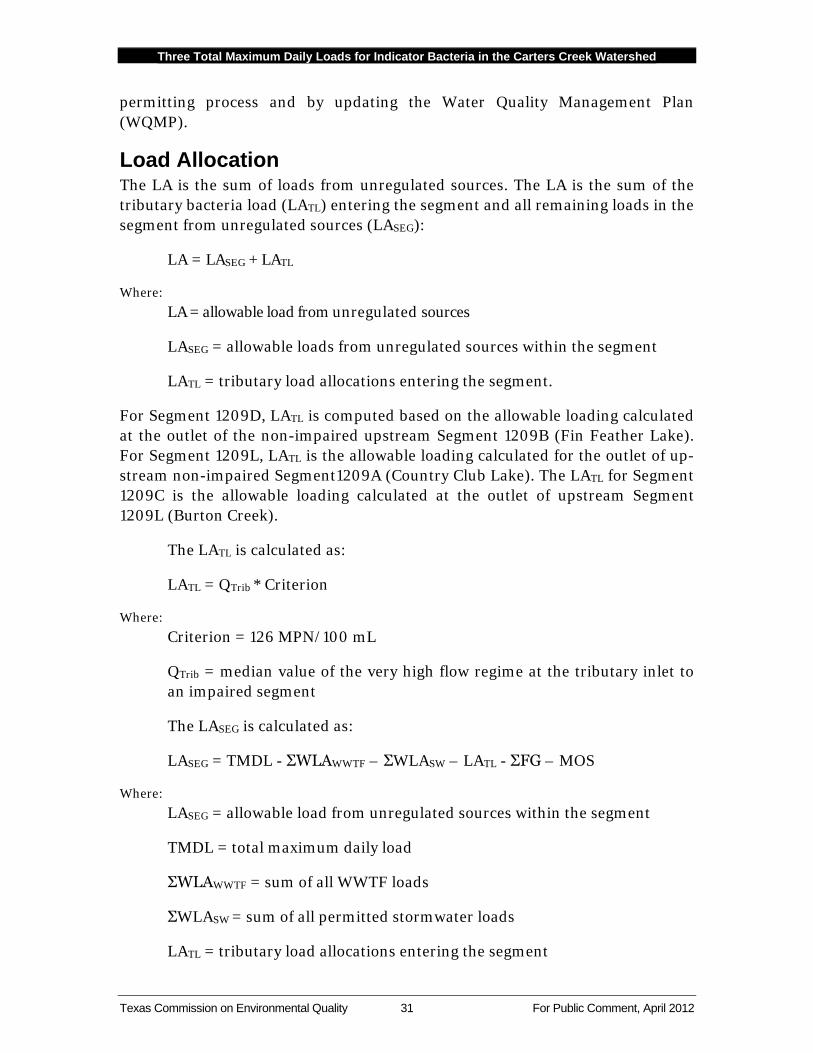
Load Allocation The LA is the sum of loads from unregulated sources. The LA is the sum of the tributary bacteria load (LATL) entering the segment and all remaining loads in the segment from unregulated sources (LASEG):
LA = LASEG + LATL
Where:
LA = allowable load from unregulated sources
LASEG = allowable loads from unregulated sources within the segment
LATL = tributary load allocations entering the segment.
For Segment 1209D, LATL is computed based on the allowable loading calculated at the outlet of the non-impaired upstream Segment 1209B (Fin Feather Lake). For Segment 1209L, LATL is the allowable loading calculated for the outlet of up-stream non-impaired Segment1209A (Country Club Lake). The LATL for Segment 1209C is the allowable loading calculated at the outlet of upstream Segment 1209L (Burton Creek).
The LATL is calculated as:
LATL = QTrib * Criterion
Where:
Criterion = 126 MPN/100 mL
QTrib = median value of the very high flow regime at the tributary inlet to an impaired segment
The LASEG is calculated as:
LASEG = TMDL - ΣWLAWWTF – ΣWLASW – LATL - ΣFG – MOS
Where:
LASEG = allowable load from unregulated sources within the segment
TMDL = total maximum daily load
ΣWLAWWTF = sum of all WWTF loads
ΣWLASW = sum of all permitted stormwater loads
LATL = tributary load allocations entering the segment

Three Total Maximum Daily Loads for Indicator Bacteria in the Carters Creek Watershed
Texas Commission on Environmental Quality 32 For Public Comment, April 2012
ΣFG = sum of future growth loads from potential permitted facilities
MOS = margin of safety load
The TMDL equation can thus be expanded to show the components of WLA and LA:
TMDL = ΣWLAWWTF + ΣWLASW + LASEG + LATL + ΣFG +MOS
Allowance for Future Growth The future growth component of the TMDL equation addresses the requirement to account for future loadings that may occur as a result of population growth, changes in community infrastructure, and development. Specifically, this TMDL component takes into account the probability that new flows from WWTF dis-charges may occur in the future. The assimilative capacity of streams increases as the amount of flow increases. Increases in flow allow for additional indicator bac-teria loads if the concentrations are at or below the contact recreation standard.
Currently, four municipal WWTFs that service the Bryan/College Station area discharge into either Burton Creek or Carters Creek. Since the area within the Country Club Branch watershed is serviced by the Burton Creek WWTF, future growth for Country Club Branch is addressed in the Burton Creek TMDL compu-tations. To account for the probability that new flows from WWTF discharges may occur in Carters and Burton creeks, a provision for future growth was in-cluded in the TMDL calculations based on an estimate of the population increase for the cities of College Station and Bryan from year 2010 estimates to year 2030 projections obtained from the Texas Water Development Board (TWDB, 2006). Assuming an even distribution of estimated and projected populations, the per-cent increase calculated was directly applied to current discharge amounts for each WWTF. The discharge from the Texas A&M Central Utility plant was not in-cluded in the future growth estimate since population growth should not directly impact future discharges from this facility. Thus, the future growth (FG) is calcu-lated as follows:
FG = Criterion * [(%Pop30 * ∑ DMR] * Conversion Factor * (1 – FMOS)
Where:
Criterion = 126 MPN/100 mL
%Pop30 = estimated percent increase in population between 2010 and 2030
∑ DMR = sum of average discharge (MGD) of each WWTF in the segment as reported in the DMRs for January 2008 – May 2009 (or most recently available data on January 4, 2010)

Three Total Maximum Daily Loads for Indicator Bacteria in the Carters Creek Watershed
Texas Commission on Environmental Quality 33 For Public Comment, April 2012
Conversion factor = 3.7854 x 10⁷ 100 mL / million gallons
FMOS = fraction of loading assigned to margin of safety (5% or 0.05)
Margin of Safety Equation The MOS is only applied to the allowable loading for a segment and is not applied to the tributary load allocations (LATL) that enters the segment as an external loading (i.e., originates outside the segment). Therefore the MOS is expressed mathematically as the following:
MOS = 0.05 * (TMDL – LATL)
Where:
MOS = margin of safety load
TMDL = total maximum allowable load
LATL = tributary load allocations entering segment
TMDL Calculations The TMDL was calculated based on the median flow in the 0-10 percentile range (very high flow regime) from the LDC developed for the outlet of each impaired segment (Figure 10). Each term in the TMDL equation was determined based on the equations provided previously.
Table 13 summarizes the calculation of the TMDL and LATL for each segment. Based on the information in Table 13, the MOS can be computed (Table 14).
Table 15 summarizes the daily allowable loading of E. coli assigned to WLAWWTF based on the full permitted flow of the four regulated dischargers located in Seg-ment 1209C and the one regulated discharger located in Segment 1209L.
Table 16 provides recent discharge information for the four municipal WWTFs in the Carters and Burton creeks watershed that are used in the calculation of the future growth term. Table 17 summarizes the computation of future growth load-ings based on recent DMR records and population estimates for year 2010 and projections for 2030 for the cities of Bryan and College Station.

Three Total Maximum Daily Loads for Indicator Bacteria in the Carters Creek Watershed
Texas Commission on Environmental Quality 34 For Public Comment, April 2012
Table 13. Summary of TMDL and LATL calculations for Country Club Branch (Segment 1209D), Burton Creek (Segment 1209L), and Carters Creek (Segment 1209C)
Segment Receiving Water
Tributary Flow; QTrib
a (cms)
Tributary Allow-able Loading; LATL
a (Billion MPN/100 mL)
Outlet Flow b
(cms)
TMDLb (Billion
MPN/100 mL)
1209D Country Club Branch 0.0817 8.890 0.132 14.38
1209L Burton Creek 0.288 31.31 1.8359 199.9
1209C Carters Creek 1.8359 199.9 7.483 814.6
a Inlet median flow and loading from very high flow regime
b Outlet median flow and loading from very high flow regime
Table 14 Computed MOS for Country Club Branch (1209D), Burton Creek (Segment 1209L) and Carters Creek (Segment 1209C)
Segment MOS
(Billion MPN/day)
1209D 0.2746
1209L 8.428
1209C 30.74
Table 15. Wasteload allocations for TPDES-permitted facilities
AU TPDES Number
Out-fall
NPDES Number
Permittee/Facility Name
Final Permitted
Flow (MGD)
E. coli WLAWWTF *
(Billion MPN/day)
1209L_01 WQ0010426-001
001 TX0022616 City of Bryan / Burton Creek WWTF
8.0 36.25
Total 8.0 36.25
1209C_01 WQ0010024-006
001 TX0047163 City of College Station / Carter Creek WWTF
9.5 43.05
1209C_01 WQ0004002-000
001 TX0002747 Texas A&M University / Central Utility
0.93 4.214
1209C_01 WQ0012296-001
001 TX0085456 R&B Mobile Home Park LLC / Glen Oaks MHP WWTF
0.013 0.0589
1209C_01 WQ0013153-001
001 TX0098663 City of College Station / Carter Lake WWTF
0.0085 0.03851
Total 10.4515 47.36
* Load includes a reduction for MOS of 5%

Three Total Maximum Daily Loads for Indicator Bacteria in the Carters Creek Watershed
Texas Commission on Environmental Quality 35 For Public Comment, April 2012
Table 16. Recent discharges from domestic WWTFs into Segments 1209L and 1209C
TPDES/NPDES Permit AU Facility Name
Actual Average Flow (MGD) Time Period
WQ0010426 TX0022616
1209L_01 Burton Creek WWTF 4.50
Jan 2008—May 2009
Total Discharge 1209L_01 4.50
WQ0010024 TX0047163
1209C_01 Carter Creek WWTF 5.92 Jan 2008—Mar 2009
WQ0012296 TX0085456
1209C_01 Glen Oaks MHP WWTF 0.008 Jan 2008—May 2009
WQ0013153 TX0098663
1209C_01 Carter Lake WWTF 0.004 Jan 2008—Dec 2009*
Total Discharge 1209C_01 5.932
*Monthly Discharge data for Carter Lake WWTF was not available for the months of Oct 2008 through May 2009, July 2009, and August 2009.
Table 17. Future Growth computations for Burton Creek (Segment 1209L) and Carters Creek (Segment 1209C
Segment
2010 Population Estimate
(Bryan & Col-lege Station)
2030 Population Estimate
(Bryan & Col-lege Station)
Population Increase
2010 to 2030
Current Wastewater Production
(MGD)
Additional Wastewater Production
(MGD)
Future Growth* (Billion
MPN/day)
1209L 155,570 199,712 28.4% 4.50 1.28 5.785
1209C 155,570 199,712 28.4% 5.93 1.68 7.625
* Future growth includes a reduction for MOS of 5%
Based on the 2000 US Census urbanized area (Figure 11), 100% of the area of Segment 1209D is located within the jurisdiction regulated by stormwater permits. The area of Segment 1209L that is located within the jurisdiction regulated by stormwater permits constitutes 98.8% of its area (total segment area of 1,411 ha of which 1,394 ha are under stormwater permit regulation). The area of Segment 1209C that is located within the ju-risdictional area regulated by stormwater permits constitutes 51.0% of its area (total seg-ment area of 13,240 ha of which 6,754 ha are under stormwater permit regulation). Table 18 summarizes the computation of term WLASW.
The LASEG is the allowable bacteria loading assigned to unregulated sources with-in the Segment. The total segment area of Segment 1209D is regulated by storm-water permits; therefore, its LASEG is 0. For Segment 1209L, 17 ha or 1.2% of its drainage area is not regulated by stormwater permits. For Segment 1209C,

Three Total Maximum Daily Loads for Indicator Bacteria in the Carters Creek Watershed
Texas Commission on Environmental Quality 36 For Public Comment, April 2012
6,486 ha or 49.0% of its drainage area is not regulated by stormwater permits. Table 19 summarizes the computation of the term LASEG.
Table 18. Regulated stormwater computation for Country Club Branch (Segment 1209D), Burton Creek (Segment 1209L) and Carters Creek (Segment 1209C
All loads expressed as Billion MPN/day
Segment TMDL WLAWWTF Future Growth LATL MOS FDASWP WLASW
1209D_01 14.38 0 0 8.890 0.2746 1.000 5.217
1209L_01 199.9 36.25 5.785 31.31 8.428 0.988 116.7
1209C_01 814.6 47.36 7.625 199.9 30.74 0.510 269.8
Table 19. Computed unregulated stormwater term for Country Club Branch (1209D), Burton Creek (Segment 1209L) and Carters Creek (Segment 1209C)
Segment LASEG
(Billion MPN/day)
1209D 0
1209L 1.409
1209C 259.2
Table 20 summarizes the TMDL calculations for Segments 1209D, 1209L, and 1209C. The TMDL was calculated based on the median flow in the 0-10 percentile range (very high flow regime) for flow exceedance from the LDC developed for the outlet of each segment. Allocations are based on the current geometric mean criterion for E. coli in freshwater of 126 MPN/100 mL for each component of the TMDL.
The final TMDL allocations needed to comply with the requirements of 40 CFR 130.7 include the future growth component within the WLAWWTF while alloca-tions to permitted MS4 entities are designated as WLAsw (Table 21). The LA com-ponent of the final TMDL allocations includes both tributary bacteria loadings (LATL) and loadings arising from within each segment from unregulated sources (LASEG).
In the event that the criterion changes due to future revisions in the state’s sur-face water quality standards, Appendix A provides guidance for recalculating the allocations in Table 21. Figures A-1, A-2, and A-3 of Appendix A were developed to demonstrate how assimilative capacity, TMDL calculations, and pollutant load allocations change in relation to a number of proposed water quality criteria for E. coli. The equations provided, along with Figures A-1, A-2, and A-3, allow calcu-

Three Total Maximum Daily Loads for Indicator Bacteria in the Carters Creek Watershed
Texas Commission on Environmental Quality 37 For Public Comment, April 2012
lation of new TMDLs and pollutant load allocations based on any potential new water quality criterion for E. coli.
Table 20. TMDL allocation summary for Country Club Branch ( Segment 1209D), Burton Creek (Segment 1209L) and Carters Creek (Segment 1209C)
All loads expressed as Billion MPN/day
Segment Stream Name TMDL a MOS b WLAWWTF c WLASW
d LASEG e LATL
f Future
Growth g
1209D Country Club Branch 14.38 0.2746 0 5.217 0 8.890 0
1209L Burton Creek 199.9 8.428 36.25 116.7 1.409 31.31 5.785
1209C Carters Creek 814.6 30.74 47.36 269.8 259.2 199.9 7.625
a TMDL = Median flow (high flow regime) * 126 MPN/100 mL * Conversion Factor; where the Conver-sion Factor = 8.64E+08 100 mL/m3 * seconds/day; Median Flow from Table 13
b MOS = 0.05 * (TMDL – LATL); (see Table 14) c WLAWWTF = Criterion (126 MPN/day) * Flows (MGD) * Conversion Factor * (1-FMOS); where Flow is the sum of full permitted flows from regulated discharging facilities (Table 15); Conversion Factor = 3.7854 x 10⁷ 100 mL/MGD; and FMOS is the fraction of loading assigned to MOS (0.05)
d WLASW = (TMDL - WLAWWTF – LATL - FG - MOS) * FDASWP; (see Table 18)
e LASEG = TMDL - WLAWWTF - WLASW – LATL - FG - MOS; (see Table 18)
f LATL = QTrib * Criterion (126 MPN/day) * Conversion Factor (see Table 17)
g FG = Criterion * (%Pop30 * DMR2YR) * Conversion Factor * (1 – FMOS); where Criterion = 126 MPN/100 mL; Conversion Factor = 3.7854 x 10⁷ 100 mL / MGD; FMOS = fraction of loading assigned to margin of safety (5% or 0.05); and DMR2YR and %Pop30 are from Table 15
Table 21. Final TMDL allocations for Country Club Branch (Segment 1209D), Burton Creek (Segment 1209L) and Carters Creek (Segment 1209C)
All loads expressed as Billion MPN/day
Segment with AU TMDL WLAWWTF
* WLASW LA ** MOS
1209D_01 14.38 0 5.217 8.890 0.2746
1209L_01 199.9 42.03 116.7 32.72 8.428
1209C_01 814.6 54.98 269.8 459.1 30.74
*WLAWWTF includes the future potential allocation to wastewater treatment facilities
** LA = LASEG + LATL
Seasonal Variation Federal regulations (40 CFR §130.7(c)(1)) require that TMDLs account for sea-sonal variation in watershed conditions and pollutant loading. Seasonality in E. coli data was examined in the Carters Creek watershed (Millican and Hauck, 2011). The variability was insufficient to indicate that seasonality is a significant factor; therefore, it is not considered in the TMDL calculations.

Three Total Maximum Daily Loads for Indicator Bacteria in the Carters Creek Watershed
Texas Commission on Environmental Quality 38 For Public Comment, April 2012
Public Participation The TCEQ maintains an inclusive public participation process. From the incep-tion of the investigation, the project team sought to ensure that stakeholders were informed and involved. Communication and comments from the stakeholders in the watershed strengthen TMDL projects and their implementation.
The TCEQ and the Texas Institute for Applied Environmental Research (TIAER) are jointly providing coordination for public participation in this project. A series of public meetings have been conducted over recent years to keep the public aware of the TMDL process and to engage public participation. Public meetings were held in College Station on April 22, 2008, January 29, 2008, November 5, 2009, and April 29, 2010. The meetings introduced the TMDL process, identified the impaired segments and the reason for the impairment, reviewed historical data, and described potential sources of bacteria within the watershed. In addi-tion, the meetings gave TCEQ the opportunity to solicit input from all interested parties within the study area and provided a starting point for development of an Implementation Plan (I-Plan).
Subsequent to these meetings, the Texas Water Resources Institute (TWRI) initi-ated efforts with the TCEQ to lead development of the I-Plan. These I-Plan devel-opment efforts by TWRI, which are discussed under Key Elements of an I-Plan later in this report, continued in parallel to the TMDL development. Information on past and future meetings for the Carters Creek watershed bacteria TMDL is on the TCEQ website at <www.tceq.texas.gov/implementation/water/tmdl/85-carterscreek.html>.
Implementation and Reasonable Assurances The issuance of permits consistent with TMDLs through TPDES provides reason-able assurance that WLAs in this TMDL report will be achieved. Per federal re-quirements, each TMDL is included in an update to Texas WQMP as a plan ele-ment.
The WQMP coordinates and directs the state’s efforts to manage water quality and maintain or restore designated uses throughout Texas. The WQMP is contin-ually updated with new, more specifically focused plan elements, as identified in federal regulations 40 CFR 130.6(c). Commission adoption of a TMDL is the state’s certification of the associated WQMP update.
Because the TMDL does not reflect or direct specific implementation by any sin-gle pollutant discharger, the TCEQ certifies additional elements to the WQMP after the I-Plan is approved by the commission. Based on the TMDL and I-Plan, the TCEQ will propose and certify WQMP updates to establish required water-

Three Total Maximum Daily Loads for Indicator Bacteria in the Carters Creek Watershed
Texas Commission on Environmental Quality 39 For Public Comment, April 2012
quality-based effluent limitations necessary for specific TPDES wastewater dis-charge permits.
For MS4 permits, the TCEQ will normally establish BMPs, which are narrative effluent limits according to federal rules, and where numeric effluent limitations are infeasible. BMPs are a substitute for effluent limitations, as allowed by federal rules, where numeric effluent limitations are infeasible (see November 22, 2002, memorandum from EPA relating to establishing TMDL WLAs for stormwater sources). When such practices are established in an MS4 permit, the TCEQ will not identify specific implementation requirements applicable to a specific TPDES stormwater permit through an effluent limitation update. Rather, the TCEQ might revise a stormwater permit, require a revised Stormwater Management Program or Pollution Prevention Plan, or implement other specific revisions af-fecting stormwater dischargers in accordance with an adopted I-Plan.
Strategies for achieving pollutant loads in TMDLs from both point and nonpoint sources are reasonably assured by the state’s use of an I-Plan. The TCEQ is com-mitted to supporting implementation of all TMDLs adopted by the commission.
I-Plans for Texas TMDLs use an adaptive management approach that allows for refinement or addition of methods to achieve environmental goals. This adaptive approach reasonably assures that the necessary regulatory and voluntary activi-ties to achieve pollutant reductions will be implemented. Periodic, repeated eval-uations of the effectiveness of implementation methods ascertain whether pro-gress is occurring, and may show that the original distribution of loading among sources should be modified to increase efficiency. I-Plans will be adapted as nec-essary to reflect needs identified in evaluations of progress.
Key Elements of an I-Plan An I-Plan includes a detailed description and schedule of the regulatory and vol-untary management measures to implement the WLAs and LAs of particular TMDLs within a reasonable time period. I-Plans also identify the organizations responsible for carrying out management measures, and a plan for periodic eval-uation of progress. EPA does not approve I-Plans for Texas TMDLs.
Strategies to optimize compliance and oversight are identified in an I-Plan when necessary. Such strategies may include additional monitoring and reporting of effluent discharge quality to evaluate and verify loading trends, adjustment of an inspection frequency or a response protocol to public complaints, and escalation of an enforcement remedy to require corrective action of a regulated entity con-tributing to an impairment.
The TCEQ works with stakeholders and interested governmental agencies to de-velop and support I-Plans and track their progress. The I-Plan for this project was developed concurrently with the TMDLs. The cooperation required to devel-

Three Total Maximum Daily Loads for Indicator Bacteria in the Carters Creek Watershed
Texas Commission on Environmental Quality 40 For Public Comment, April 2012
op an I-Plan for approval by the commission becomes a cornerstone for the shared responsibility necessary for carrying out the plan.
Ultimately, the I-Plan will identify the commitments and requirements to be im-plemented through specific permit actions and other means. For these reasons, the I-Plan that is adopted may not approximate the predicted loadings identified category-by-category in the TMDL and its underlying assessment. However, with certain exceptions, the I-Plan must nonetheless meet the overall loading goal es-tablished by the EPA-approved TMDL.
The TWRI is working with the TCEQ to lead development of the Implementation Plan. Through the stakeholder group led by the TWRI, the resources and exper-tise of the local organizations and individuals are brought together to set priori-ties, provide flexibility, and consider appropriate social and economic factors. In-formation on I-Plan development and related material is on the TWRI website at <www.tceq.texas.gov/waterquality/tmdl/85-carterscreek.html>.

Three Total Maximum Daily Loads for Indicator Bacteria in the Carters Creek Watershed
Texas Commission on Environmental Quality 41 For Public Comment, April 2012
References American Veterinary Medical Association. 2009. U.S. Pet Ownership 2007.
<www.avma.org/reference/marketstats/ownership.asp>. Accessed April 1, 2010.
Cleland, B. 2003. TMDL Development from the Bottom Up—Part III: Duration Curves and Wet-Weather Assessments. America’s Clean Water Foundation, Washington, DC.
EPA. 1991. Guidance for Water Quality-Based Decisions: The TMDL Process. <www.epa.gov/OWOW/tmdl/decisions/>. Accessed April 1, 2010.
Hussong, D., J. M. Damaré, R. J. Limpert, W. J. L. Sladen, R. M. Weiner & R. R. Colwell. 1979. Microbial impact of Canada geese (Branta canadensis) and whistling swans (Cygnus columbianus columbianus) on aquatic ecosystems. Applied and Environ-mental Microbiology 37: 14-20.
Hyer, K. E. & D. L. Moyer. 2003. Patterns and sources of fecal coliform bacteria in three streams in Virginia, 1999-2000. Water-Resources Investigations Report 03-4115. USGS, Richmond, VA.
Millican, J. and L. Hauck. 2011. Final Draft—Technical Support Document for Bacteria TMDLs Carters Creek Watershed (Segments 1209D, 1209L, & 1209C). Prepared for Texas Commission on Environmental Quality by Texas Institute for Applied Envi-ronmental Research, Tarleton State University, Stephenville, TX. <www.tceq.texas.gov/assets/public/implementation/water/tmdl/85carters/85-techsupportfinal07082011.pdf>
NDEP (Nevada Division of Environmental Protection). 2003. Load duration curve meth-odology for assessment and TMDL development. <ndep.nv.gov/bwqp/ loadcurv.pdf>. Accessed April 1, 2010.
NEIWPCC (New England Interstate Water Pollution Control Commission). 2003. Illicit Discharge Detection and Elimination Manual. January 2003.
Office of Texas State Climatologist. 1983. Available online at: <www.met.tamu.edu/ osc/TXclimat.html>. Accessed April 1, 2010.
Plitt, Don. 2008. Personal communication with Don Plitt, Brazos County designated OSSF program representative. August 12, 2008.
TCEQ. 1999 State of Texas Clean Water Act Section 303(d) List and Schedule for Devel-opment of Total Maximum Daily Loads. SFR-058/99. December 1999.
TCEQ. 2006 Texas Water Quality Inventory and 303(d) List. <www.tceq.texas.gov/ compliance/monitoring/water/quality/data/06twqi/twqi06.html>. Accessed April 1, 2010.
TCEQ. 2008 Texas Water Quality Inventory and 303(d) List. <www.tceq.texas.gov/ compliance /monitoring/water/ quality/data/08twqi/twqi08.html>. Accessed April 1, 2010.
TCEQ. 2010a. Draft 2010 Texas 303(d) List (February 5, 2010). <www.tceq.texas.gov/ assets/public/compliance/monops/water/10twqi/2010_303d.pdf> Accessed June 29, 2010.
TCEQ. 2010b. Texas Surface Water Quality Standards, 2010 update, 30 TAC 307. <www.tceq.texas.gov/assets/public/permitting/waterquality/standards/docs/TSWQS2010_rule.pdf>. Accessed July 21, 2011.

Three Total Maximum Daily Loads for Indicator Bacteria in the Carters Creek Watershed
Texas Commission on Environmental Quality 42 For Public Comment, April 2012
TWDB. 2006 Population Projections Data. Online at <www.twdb.state.tx.us/wrpi/ data/proj/popproj.htm>. Accessed April 1, 2010.
U.S. Census Bureau. 2009. Online at <www.census.gov/>. Accessed April 1, 2010.
USDA (U.S. Department of Agriculture). 2007 Census of Agriculture Volume 1 County Level Data. Online at <www.agcensus.usda.gov/Publictions/2007/Full_Report/ Volume_1,_Chapter_2_County_Level/Texas/index.asp >. Accessed October 19, 2011.

Three Total Maximum Daily Loads for Indicator Bacteria in the Carters Creek Watershed
Texas Commission on Environmental Quality 43 For Public Comment, April 2012
Appendix A. Equations for Calculating TMDL Allocations for
Changed Contact Recreation Standard

Three Total Maximum Daily Loads for Indicator Bacteria in the Carters Creek Watershed
Texas Commission on Environmental Quality 44 For Public Comment, April 2012
Figure A-1. Allocation loads for Segment 1209D as a function of water quality criteria
Equations for calculating new TMDL and allocations (in 109 MPN/day)
TMDL = 0.11413 * Std
WLAWWTF = 0
WLAsw = 0.04140 * Std
LA = 0.07055 * Std
MOS = 0.002179 * Std
Where:
Std = Revised Contact Recreation Standard
WLAWWTF = Wasteload allocation (permitted WWTF load + future growth)
WLASW = Wasteload allocation (permitted stormwater)
LA = Total load allocation (unregulated source contributions)
MOS = Margin of Safety

Three Total Maximum Daily Loads for Indicator Bacteria in the Carters Creek Watershed
Texas Commission on Environmental Quality 45 For Public Comment, April 2012
Figure A-2. Allocation loads for Segment 1209L as a function of water quality criteria
Equations for calculating new TMDL and allocations (in 109 MPN/day)
TMDL = 1.58624 * Std
WLAWWTF = 42.03
WLAsw = 1.25571 * Std – 41.53227
LA = 0.26364 * Std – 0.50134
MOS = 0.06689 * Std
Where:
Std = Revised Contact Recreation Standard
WLAWWTF = Wasteload allocation (permitted WWTF load + future growth)
WLASW = Wasteload allocation (permitted stormwater)
LA = Total load allocation (unregulated source contributions)
MOS = Margin of Safety

Three Total Maximum Daily Loads for Indicator Bacteria in the Carters Creek Watershed
Texas Commission on Environmental Quality 46 For Public Comment, April 2012
Figure A-3. Allocation loads for Segment1209C as a function of water quality criteria
Equations for calculating new TMDL and allocations (in 109 MPN/day)
TMDL = 6.4650 * Std
WLAWWTF = 54.98
WLAsw = 2.3642 * Std – 28.046
LA = 3.8569 * Std – 26.9359
MOS = 0.2440 * Std
Where:
Std = Revised Contact Recreation Standard
WLAWWTF = Wasteload allocation (permitted WWTF load + future growth)
WLASW = Wasteload allocation (permitted stormwater)
LA = Total load allocation (unregulated source contributions)
MOS = Margin of Safety