three most important ideas to take away
TRANSCRIPT

1
CENTER FOR AIR TRANSPORTATION SYSTEMS RESEARCHCENTER FOR AIR TRANSPORTATION SYSTEMS RESEARCH
Terminal ChaosGeorge L. Donohue, Ph.D. and Russell Shaver III, Ph.D.
Volgenau School of Information Technology and Engineering
May 2010
© George L. Donohue 2009
CATSRCATSR
2
Three Most Important Ideas to take Away
from Today‟s Discussion
1. Major US Airports are Overscheduled
1. Slot Control & Allocation Policy Must be Designed
2. FAA cannot Fix this Problem as it is Currently Organized
1. Separate Safety Oversight from Operations
2. Outsource ATC Command Center & Upper Airspace Operational Responsibility
3. Move to a Fee for Service System
3. The Rules of the Game MUST be Changed1. Congress is the Major Player
2

2
CATSRCATSR
33
Setting the Stage
Major US Airports are over-scheduled
Congestion in one area causes congestion throughout the NAS
Single airline or airport is incapable of altering the situation
Only ATM policy changes can fix the situation
• Multiple players with differing goals:
Congress, Airlines, Airports, AirTraffic Control, Passengers
In order to choose appropriate ATM policy alternatives we need to
understand consequences of alternative actions!
Thus, we need to study major Metroplex and Airline Interdependencies
and be able to predict the most important „levers‟ to use to manage
congestion and safety.
3
CATSRCATSR
4
The Predicted Growth in Aviation Demand is based on
Passenger Demand NOT Aircraft Operations
• Larger Aircraft will be required to meet X2 or X3 demand
• Business Jet and VLJ Air Taxi Service will emerge to compete with Commercial aviation due to current System Failure
• May not be able to put the Geni back in the Bottle
• Environmental Implications?
• New Aircraft (e.g. B 787) should be Environmentally Friendly & Fuel Efficient (Emissions/passenger/mi.?)
• US airlines are not currently ordering them due to poor financial position
• New Public Policy will be needed to Deal with these Complex Adaptive System Problems
• NextGen System not addressing these issues
• Airports cannot make these changes by themselves

3
CATSRCATSR
5
Air Transportation System (ATS) is a CAS
with 6 Interacting Network Layers
Government Regulatory Control Layer
Physical Layer (i.e. Cities, Airports, Demographics)
Weather Layer (Thunderstorms, Ice Storms)
Airline Layer (Routes, Schedules, A/C size)
TSA/FAA Layer (ATC Radar, Radios, Ctr’s, Unions)
Passenger/Cargo Layer (Delays, Cancellations)
•The ATS is a Public - Private Partnership with
conflicting objective functions:
•Public – Commerce and safety; interest groups
•Private – Profit maximization
CATSRCATSR
6
Outline
• How Bad and widespread is the Problem• What Has Changed Since 1947
• Passenger QOS
• NYC Example
• What are the Underlying Causes• Too Many Scheduled Flights into Too Few Runways
• Why the Airlines cannot fix the Problem Themselves• Prisoners Dilemma and Curse of the Commons
• Safety is the Underlying Capacity Constraint• Current Safety Trends
• Airport Arrival Time Slot Auctions
• Economic Impact
• What Should the Congress Do

4
CATSRCATSR
7
What has Changed since 1947?
•Modern Jet Aircraft “Gate-to-Gate”
Travel Time is the Same or Longer than
Propeller aircraft (DC-6 circa 1947) for
many routes in NE Triangle
• Typical Jet Aircraft is 70%
Faster and fly's 80% Higher
•Jet Aircraft can fly Over most bad
weather
•Modern Commercial Jet Aircraft can
land in very low visibility
•Airport Congestion Causes Most ATC
Delays and Airline Schedule Padding
Masks Real “Gate-to-Gate” Delay
•WHAT HAS NOT CHANGED
• Air Traffic Controllers talking
to Pilots using WW II AM Radio
Technology
CATSRCATSR
8
Passenger Total Delay – Airports
• 10 of the OEP-35 airports 50% Total EPTD
• some airports significantly impact Passenger Delay more than
others (e.g. ORD, ATL, DFW and MCO)
50%
Close Network of OEP35 Airport in 2004

5
CATSRCATSR
9
Today‟s Lack of Predictability is
Predictable!
CATSRCATSR
10
FAA‟s Role in Poor Quality of Service:
GDPs occurs almost everyday…
• The number of GDPs is steadily
increasing over the years.• There is a 87% chance that at least
one GDP will be implemented in the
NAS every day.
• The number of FAA initiated Ground Delay Programs (GDPs) in the
NAS has been increasing.
[1998 – 2007] [2000 – 2007]

6
CATSRCATSR
11
EWR GDPs (2007): Most Not Weather Related
• 197 GDPs in 2007.
• GDP Duration:
Average 10 hours.
• GDP Lead Time:
Average 96 minutes
• GDP Scope:
• 51% Tier scope
(NoWest+Canada )
(All +Canada)
• 49% Distance scope
(1800nm+Canada)
• GDP Capacity (PAAR):
• Average 10 flights/15
minutes.
CATSRCATSR
12
20 U.S. airports generate most of the GDPs

7
CATSRCATSR
13
Key Nodes in National Network are Predicted to be
Saturated – Even with New Runways and Technology!
2007 2015 2025
New York New York New York
Los Angeles Los Angeles
Philadelphia Philadelphia
San
Francisco
San
Francisco
Atlanta
Las Vegas
Phoenix
San DiegoFAA FACT 2 Report May 2007
Predicted Congested
Metropolitan Regions
with all NEXTGEN
Technology and Runway
Improvements
Airports of
Interest
13
CATSRCATSR
14
NYNJ comparison to Comparable
European Airports - ATC Terminal Delay
Data taken from ACI-NA,
EC PR2006 and FAA ASPM
Total Total Average Delays
Airport Movements Passengers Minutes
2005 2000 2005 2000 2006
Frankfurt, Gr (FRA) 490,147 458,731 52,219,412 49,360,630 2.7
London, UK (LHR) 477,884 466,815 67,915,403 64,606,826 3
Newark (EWR) 437,402 450,187 33,999,990 34,188,468 28.8
Amsterdam, NL (AMS) 420,736 432,480 44,163,098 39,606,925 0.7
New York Laguardia (LGA) 404,853 384,554 <29,000,000 <28,000,000 23.4
Munich (MUC) 398,838 - <29,000,000 1.8
New York Kennedy (JFK) <353,000 <384,000 41,885,104 32,856,220 24.3
Madrid, Sp (MAD) 415,677 <384,000 41,940,059 32,893,190 1.8

8
CATSRCATSR
15
Airline Load Factors are Increasing
45
50
55
60
65
70
75
80
85
90
1960 1970 1980 1990 2000 2010
Year
Per
cen
t A
ircr
aft
Sea
ts O
ccu
pie
d (
Aver
age) Load Factor
(Anticipated)
Load Factor ATA
Historical Data
CATSRCATSR
16
Aircraft at Critical Hub Airports
are Getting Smaller
0
20
40
60
80
100
120
140
160
180
200
ATL BOS DFW EWR IAD IAH JFK LGA ORD PHL
Nu
mb
er
of
Seats
July 2002 July 2007
Taken from Dorothy Robyn Brooking Paper July 2008

9
CATSRCATSR
17
-$3,000
-$2,000
-$1,000
$0
$1,000
$2,000
$3,000
$4,000
Pro
fit/
Lo
ss (
$M
)
Top 21 Airline reports to BTS
21-Carrier Total
0
20
40
60
80
100
120
140
160
180
Ave
rage
Air
craf
t Si
ze
Average Aircraft Size
NAS
NYMP
SFMP
The Grand Experiment:
1990 - 2008
0.45
0.5
0.55
0.6
0.65
0.7
0.75
0.8
Ave
rage
Lo
ad F
acto
rs
Average Load Factors
NAS
NYMP
SFMP
0
100,000,000
200,000,000
300,000,000
400,000,000
500,000,000
600,000,000
700,000,000
800,000,000
Pas
sen
gers
Passengers
NAS
NYMP
SFMP
Increased Demand Down Gauging
Increased Flights
Increased
Load Factors
Airline Profit Reports
17
NAS
NAS
SFNY
NAS = National Airspace
NY = New York Metroplex
SF = San Francisco Metroplex
Profit
Loss
0
5
10
15
20
25
30
Rat
io o
f Fu
el C
ost
s/ L
and
ing
Fee
s
Fuel Cost to Landing Fees Ratios 2005 through 2008
Increased Fuel Prices
have shocked System far
more than adjustments
to Landing Fees could
have
Economic Behavior Airline Behavior Results
CATSRCATSR
18
A Major Research Focus: Passenger Capacity
How will Airline Scheduling Behavior be influenced by future Changes in Technology (i.e. NEXTGEN, B787, A380, etc.) , ATM Policy (i.e. Slot Controls, CDM rules, etc.) and the Economic Environment?
• Will limiting airport scheduled operations affect the number of markets served and the aircraft gauge servicing them?
• Will Increasing fuel prices affect airline scheduling and/or the aircraft gauge?
• Will new aircraft fuel efficiency offset potential Down-gauging trends?
18
10
CATSRCATSR
19
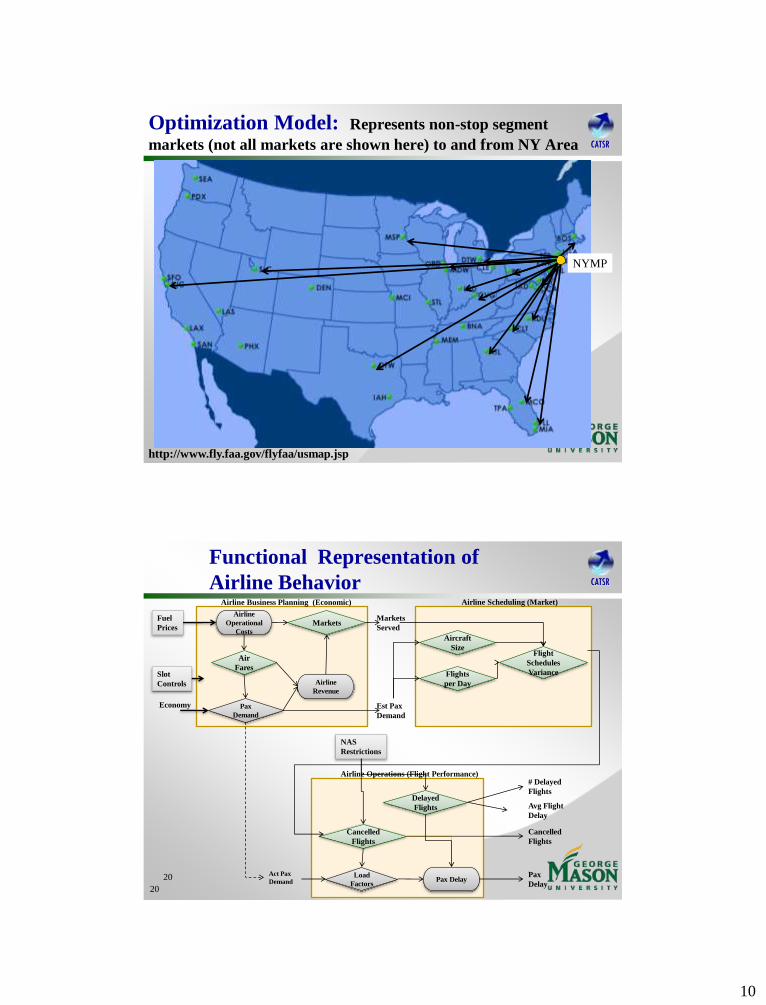
Optimization Model: Represents non-stop segment
markets (not all markets are shown here) to and from NY Area
19
NYMP
http://www.fly.faa.gov/flyfaa/usmap.jsp
CATSRCATSR
20
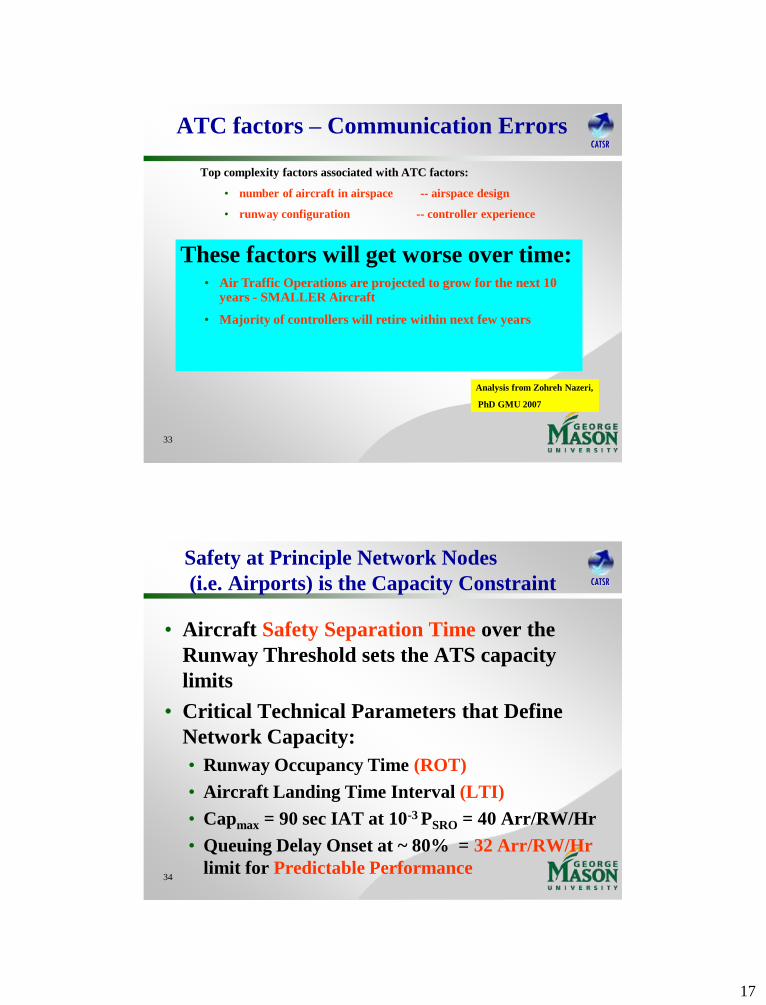
Functional Representation of
Airline BehaviorAirline Business Planning (Economic)
Fuel
Prices
Markets
Served
Est Pax
Demand
Airline
Operational
Costs
Air
Fares
Pax
Demand
Airline
Revenue
Markets
Aircraft
Size
Flights
per Day
Flight
Schedules
Variance
Airline Scheduling (Market)
Airline Operations (Flight Performance)
Cancelled
Flights
Load
Factors
Act Pax
Demand
Delayed
Flights
Pax DelayPax
Delay
NAS
Restrictions
Cancelled
Flights
# Delayed
Flights
Avg Flight
Delay
Slot
Controls
20
Economy

11
CATSRCATSR
21
Outline
• How Bad and widespread is the Problem• What Has Changed Since 1947
• Passenger QOS
• NYC Example
• What are the Underlying Causes• Too Many Scheduled Flights into Too Few Runways
• Why the Airlines cannot fix the Problem Themselves• Prisoners Dilemma and Curse of the Commons
• Safety is the Underlying Capacity Constraint• Current Safety Trends
• Airport Arrival Time Slot Auctions
• Economic Impact
• What should Congress Do?
CATSRCATSR
22
JFK Scheduled Gate-In/Gate-Out Demand
Distribution (Count - Summer 07 ASPM)
22
Gross Over-
Scheduling

12
CATSRCATSR
23
Jet Blue and Delta AL are Competing for the JFK Market:
Passengers Pay the Price in Flight Delays and Cancellations
5 AM 10 AM 3 PM 8 PM Midnight
JFK Summer 2007 Departures
0
5
10
15
20
25
0 20 40 60 80 100 120
24 Hours in 15 min. Epochs
Fli
gh
t D
epa
rtu
res
per
15
Min
ure
Ep
och
FAA Announced Departure Rate
(weekday AVG +/- 2)
Airline's Scheduled Departures
CATSRCATSR
24
JFK Scheduled Wheels-On/Wheels-Off Demand
Distribution (Count - Summer 07 ASPM)
24
Schedule Padding for
Expected Taxi Delays

13
CATSRCATSR
25
JFK Actual Wheels-On/Wheels-Off Demand
Distribution (Count - Summer 07 ASPM)
25
FAA ATC
Effect
DOT CAP
CATSRCATSR
26
Result of this Schedule on Network Delay:
AVG Wheels-Off Delays At JFK (ASPM)
26
95 Minutes!

14
CATSRCATSR
27
Effect of LGA Slot Control Program:
Still Unacceptably High Network Delays!
27
60 Minutes!
CATSRCATSR
28
Outline
• How Bad and widespread is the Problem• What Has Changed Since 1947
• Passenger QOS
• NYC Example
• What are the Underlying Causes• Too Many Scheduled Flights into Too Few Runways
• Why the Airlines cannot fix the Problem Themselves• Prisoners Dilemma and Curse of the Commons
• Safety is the Underlying Capacity Constraint• Current Safety Trends
• Airport Arrival Time Slot Auctions
• What should the Congress Do?

15
CATSRCATSR
29
Why do the Airlines Schedule beyond the Maximum Safe
RW Capacity with Flights that Loose Revenue?
• There is no government regulation to limit schedules for safety or compensate passengers for delays and cancellations
• These were errors in the 1978 Deregulation Act
• Passenger surveys indicate that frequency and price are the most desirable characteristics of a flight
• Passengers are not told of consequences of schedule to travel predictability
• If any one airline decided to offer rational schedules, their competition will offer more frequency to capture market share
• Thus, still producing delays and cancellations for all
• In Game Theory, this is called the Prisoner‟s Dilemma
CATSRCATSR
30
Outline
• How Bad and widespread is the Problem• What Has Changed Since 1947
• Passenger QOS
• NYC Example
• What are the Underlying Causes• Too Many Scheduled Flights into Too Few Runways
• Why the Airlines cannot fix the Problem Themselves• Prisoners Dilemma and Curse of the Commons
• Safety is the Underlying Capacity Constraint• Current Safety Trends
• Airport Arrival Time Slot Auctions
• Economic Impact
• What should the Congress Do?

16
CATSRCATSR
31
Part 121 (Scheduled Commercial)
Accident Rates are Increasing
My filtered part-121 accidents
y = 0.0533x + 1.0647
0
0.5
1
1.5
2
2.5
1995
1996
1997
1998
1999
2000
2001
2002
2003
2004
2005
2006
count per
millio
n o
pera
tions
Analysis from Zohreh Nazeri, PhD GMU 2007
CATSRCATSR
32
Trends for Incidents Associated with Accidents
Trends of the factors in incident databases
• Pilot factors decreasing
• Aircraft factors slowly decreasing
• ATC factors increasing
Pilot primary factors in ASRS reports
y = -7.1868x + 123.33
0
20
40
60
80
100
120
140
160
19951996
19971998
19992000
20012002
20032004
20052006
cou
nt p
er
mill
ion
op
era
tion
s
Aircraft primary factors in ASRS reports
y = -3.8007x + 683.79
0
200
400
600
800
1000
1995
1996
1997
1998
1999
2000
2001
2002
2003
2004
2005
2006
cou
nt p
er
mill
ion
op
era
tion
s
ATC primary factors in ASRS reports
y = 0.0824x + 29.716
0
10
20
30
40
50
1995
1996
1997
1998
1999
2000
2001
2002
2003
2004
2005
2006
count
per
mill
ion o
pera
tions ATC incidents in FAA/OED data, Terminal
y = 1.4581x + 18.118
0
5
10
15
20
25
30
35
40
95 96 97 98 99 00 ;01 02 03 04
count per
millio
n
opera
tions
Analysis from Zohreh Nazeri,
PhD GMU 2007
17
CATSRCATSR
33
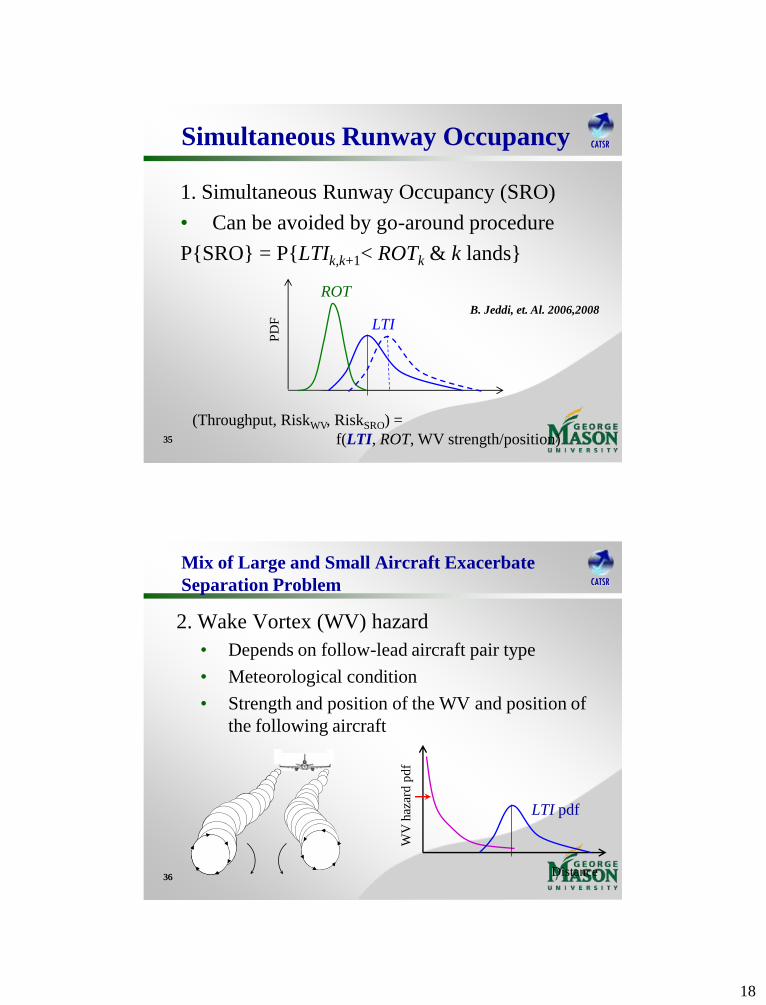
ATC factors – Communication Errors
Top complexity factors associated with ATC factors:
• number of aircraft in airspace -- airspace design
• runway configuration -- controller experience
These factors will get worse over time:• Air Traffic Operations are projected to grow for the next 10
years - SMALLER Aircraft
• Majority of controllers will retire within next few years
Analysis from Zohreh Nazeri,
PhD GMU 2007
CATSRCATSR
34
Safety at Principle Network Nodes
(i.e. Airports) is the Capacity Constraint
• Aircraft Safety Separation Time over the
Runway Threshold sets the ATS capacity
limits
• Critical Technical Parameters that Define
Network Capacity:
• Runway Occupancy Time (ROT)
• Aircraft Landing Time Interval (LTI)
• Capmax = 90 sec IAT at 10-3 PSRO = 40 Arr/RW/Hr
• Queuing Delay Onset at ~ 80% = 32 Arr/RW/Hr
limit for Predictable Performance
18
CATSRCATSR
3535
Simultaneous Runway Occupancy
1. Simultaneous Runway Occupancy (SRO)
• Can be avoided by go-around procedure
P{SRO} = P{LTIk,k+1< ROTk & k lands}
ROT
LTI
PD
F
(Throughput, RiskWV, RiskSRO) =
f(LTI, ROT, WV strength/position)
B. Jeddi, et. Al. 2006,2008
CATSRCATSR
3636
Mix of Large and Small Aircraft Exacerbate
Separation Problem
2. Wake Vortex (WV) hazard
• Depends on follow-lead aircraft pair type
• Meteorological condition
• Strength and position of the WV and position of
the following aircraft
WV
haz
ard
pd
f
Distance
LTI pdf
19
CATSRCATSR
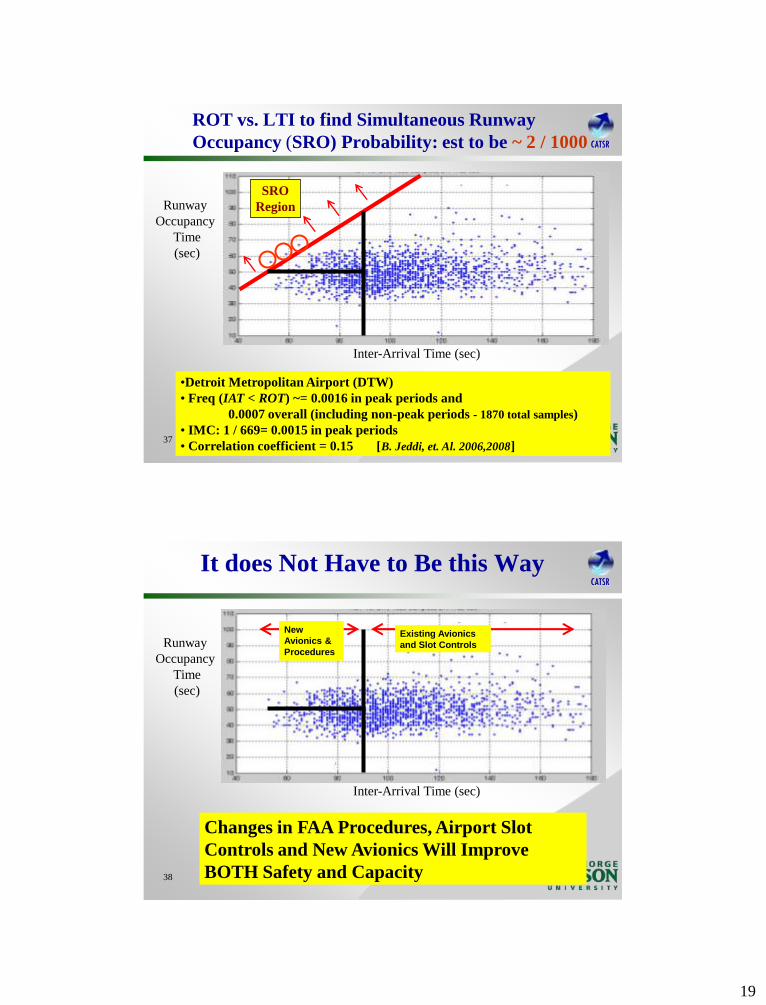
37
ROT vs. LTI to find Simultaneous Runway
Occupancy (SRO) Probability: est to be ~ 2 / 1000
Inter-Arrival Time (sec)
Runway
Occupancy
Time
(sec)
SRO
Region
•Detroit Metropolitan Airport (DTW)
• Freq (IAT < ROT) ~= 0.0016 in peak periods and
0.0007 overall (including non-peak periods - 1870 total samples)
• IMC: 1 / 669= 0.0015 in peak periods
• Correlation coefficient = 0.15 [B. Jeddi, et. Al. 2006,2008]
CATSRCATSR
38
It does Not Have to Be this Way
Inter-Arrival Time (sec)
Runway
Occupancy
Time
(sec)
New
Avionics &
Procedures
Existing Avionics
and Slot Controls
Changes in FAA Procedures, Airport Slot
Controls and New Avionics Will Improve
BOTH Safety and Capacity

20
CATSRCATSR
3939
Risk vs. Throughput
Risk is the other side of the throughput coin!
7 7.5 8 8.5 9 9.5 10 10.50
0.01
0.02
0.03
0.04
0.05
0.06
0.07Runway Related Risk vs. Throughput
THROUGHPUT (Arr per quarter hour)
RIS
K =
P
( L
TI
< R
OT
)
Linear
Worse than Linear
B. Jeddi, GMU Ph.D.,2008
CATSRCATSR
40
• What would happen if schedules at major airports were Capped at Safe, Predictable Runway Capacity and allocated by a Market mechanism?• What markets would be served?
• How would airline schedules change?
– Frequency
– Equipment (#seats per aircraft)
• How would passenger demand change?
– At airport
– On routes
• How would airfares change?
– What would happen to airline profit margins?
• How would airport and network delays be altered?
A Natural DoT – Congressional Question?
Is There an Optimal Allocation of Scarce Runway Resources?

21
CENTER FOR AIR TRANSPORTATION SYSTEMS RESEARCHCENTER FOR AIR TRANSPORTATION SYSTEMS RESEARCH
Economic Optimum Slot Allocation is at
80 - 90% Max Capacity
Donohue and Shaver, Terminal Chaos 2008
CATSRCATSR
42
Preliminary Model Results

22
CATSRCATSR
43
Calculated Optimum Airline Schedule to an All
Weather Predictable Schedule Restriction at LGA
Estimate of Aircraft Up-Gauging
0
50
100
150
200
250
300
19 to 37 44 to 50 69 to 77 88 to
110
117 to
133
138 to
158
166 to
181
194 to
225
Aircraft Seating Capacity
Nu
mb
er o
f D
ail
y F
lig
hts
Current Fleet Allocation - 1010 Flts
90% Optimum Fleet Allocation - 806 Flts
RESULTS:
•20 % Fewer
Scheduled Flights
using a Mix of
LARGER Aircraft
•Increased Passenger
Throughput
•Same Airfares
•Loss of 3
Unprofitable Markets
•70% Less Delay
L. Lee Ph.D. GMU 2006
CATSRCATSR
44 $-
$20
$40
$60
$80
$100
$120
$140
25 50 75 100 125 150 175 200 225 250 275 375 425
Co
st/
pax
/ fl
igh
t h
ou
r
Aircraft Size (seats)
2008 Aircraft Fuel Costs / Pax/ Flight Hour
$2
$4
$5
$7
$8
Aircraft Gauge
(Model Results versus Fuel Price)
44
0
50
100
150
200
250
300
350
400
450
25 50 75 125 150 175
# o
f Fl
igh
ts
Aircraft Size
LGA 2007 Model Selection of Aircraft for different Fuel Prices
2.06
3.53
5
$-
$10
$20
$30
$40
$50
$60
25 50 75 100 125 150 175 200 225 250 275 375 425
Cost
/ pa
x/ f
light
hou
r
Aircraft Size (seats)
Aircraft Costs (minus Fuel)/ Pax/ Flight Hour
2007 Direct Cost
2007 Cost
2008 Direct Cost
2008 Cost
Increased Fuel Prices
have greater effect on
larger aircraft
J. Ferguson Ph.D. cand. 2009

23
CATSRCATSR
45
LGA 2007 Demand & Airfare
45
Airport
QTR
Fuel Price
Historical Data
Profitable
Markets
Capacity 8 10 12 8 10 12 8 10 12
Flights 792 844 856 704 730 738 572 582 586
Avg. Aircraft Size 75 72 72 60 60 59 66 66 65
Seats 59,150 61,100 61,800 42,450 43,500 43,650 37,750 38,150 38,300
Markets 58 59 61 60 61 61 50 50 51
Profitable
Markets Out 3 2 0 1 0 0 1 1 0
61
$2.06 $3.53 $5
61 51
LGA
3QTR 2007
73 Markets, 1003 Flights, 62 Average Seat Size, 62442 Seats
J. Ferguson Ph.D. cand. 2009
CATSRCATSR
46
LGA 2007 Demand & Airfare
46
Airport
QTR
Fuel Price
Historical Data
Profitable
Markets
Capacity 8 10 12 8 10 12 8 10 12
Flights 792 844 856 704 730 738 572 582 586
Avg. Aircraft Size 75 72 72 60 60 59 66 66 65
Seats 59,150 61,100 61,800 42,450 43,500 43,650 37,750 38,150 38,300
Markets 58 59 61 60 61 61 50 50 51
Profitable
Markets Out 3 2 0 1 0 0 1 1 0
61
$2.06 $3.53 $5
61 51
LGA
3QTR 2007
73 Markets, 1003 Flights, 62 Average Seat Size, 62442 Seats
J. Ferguson Ph.D. cand. 2009

24
CATSRCATSR
47
EWR 2007 & 2008 Demand & Airfare
47
Airport
QTR
Fuel Price
Historical Data
Profitable
Markets
Capacity
Flights
Avg. Aircraft
Size
Seats
Markets
Profitable
Markets Out
EWR
97
70850
79
1
10
592
83
49200
65
4
3QTR 2007 3QTR 2008
99 Markets, 920 Flights, 78
Average Seat Size, 72290
Seats
93 Markets, 917 Flights, 74
Average Seat Size, 68302
Seats
10
728
$2.06 $3.53
80 69
J. Ferguson Ph.D. cand. 2009
CATSRCATSR
48
Observations to Date
Airlines are NOT increasing Passenger Capacity
by up-gauging at Congested airports
Airlines tend to retain non-profitable flights for
strategic reasons (model does not)
Fuel Price increases tend to REDUCE average
gauge size and number of markets served
Slot Control Caps tend to allow Airlines to
capture Scarcity Rents
48

25
CATSRCATSR
49
Outline
• How Bad and widespread is the Problem• What Has Changed Since 1947
• Passenger QOS
• NYC Example
• What are the Underlying Causes• Too Many Scheduled Flights into Too Few Runways
• Why the Airlines cannot fix the Problem Themselves• Prisoners Dilemma and Curse of the Commons
• Safety is the Underlying Capacity Constraint• Current Safety Trends
• Airport Arrival Time Slot Auctions
• Economic Impact
• What Should the Congress Do?
CATSRCATSR
50
Congress Should Do the Following
1. Support DoT efforts to Reduce Network-wide
Congestion and Return Air Travel Predictability
2. Provide DoT with unambiguous Authority to
Allocate Safety Limited Airport Capacity
Efficiently (i.e. Maximum Efficient Gauge) using
Market Mechanisms
3. Support Proposals to Separate FAA Safety
Oversight Responsibility from Operational
Responsibility

26
CATSRCATSR
51
Congress Should Do the Following
1. Support DoT efforts to Reduce Network-wide Congestion and Return Air Travel Predictability
2. Provide DoT with unambiguous Authority to Allocate Safety Limited Airport Capacity Efficiently using Market Mechanisms
3. Support Proposals to Separate FAA Safety Oversight Responsibility from Operational Responsibility
CATSRCATSR
52
Slot Control and Allocation: Outstanding Issues
that need to be Addressed
• What are the Airport/Airline/DOT Property Rights?
• What is the Best Equity Metric?
• How should Max. Capacity be Determined?
• What Fraction of Max. Capacity should be Allocated?
• How Should these Airport Operations be Coordinated?
• How should Small and Medium sized Communities be Served?
• How will Market Allocation affect Service?
• Desired Market Service Redundancy?
• Desired Market Service Frequency?
• Desired Aircraft Gauge Distribution?

27
CATSRCATSR
53
Congress Should Do the Following
1. Support DoT efforts to Reduce Network-wide Congestion and Return Air Travel Predictability
2. Provide DoT with unambiguous Authority to Allocate Safety Limited Airport Capacity Efficiently using Market Mechanisms
3. Support Proposals to Separate FAA Safety Oversight Responsibility from Operational Responsibility
CATSRCATSR
54
FAA Safety vs. Operations Responsibility
1. A Corporatized “Fee-for-Service” based Upper Airspace ANSP would be able to Modernize the System Faster and Safer than the current approach
2. Command Center Too sophisticated a function for FAA personnel & not Safety Critical- should be outsourced to industry
1. Growth in ATC System Command Center Ground Delay Programs => A Scheduling Overload Band-Aid
2. A Ration by Passenger Rule Could be used to influence Airline behavior vs. Ration by Schedule currently in use
28
CATSRCATSR
55
Center for Air Transportation System Research
Publications and Information
• http://catsr.ite.gmu.edu
–Other Useful Web Sites
• http://mytravelrights.com
• http://gao.gov
• http://www.airconsumer.ost.dot.gov
CATSRCATSR
56
BACKUP Material

29
CATSRCATSR
57
LGA 2008 Demand & Airfare
57
Airport
QTR
Fuel Price
Historical Data
Profitable
Markets
Capacity 8 10 12 8 10 12 8 10 12
Flights 784 850 856 692 724 730 518 518 518
Avg. Aircraft
Size 67 65 64 65 64 64 73 73 73
Seats 52,250 54,850 55,050 44,800 46,150 46,550 37,950 37,950 37,950
Markets 64 65 65 58 59 59 34 34 34
Profitable
Markets Out 1 0 0 1 0 0 0 0 0
$2.06 $3.53 $5
65 59 34
LGA
3QTR 2008
75 Markets, 989 Flights, 63 Average Seat Size, 62545 Seats
J. Ferguson Ph.D. cand. 2009
CATSRCATSR
58
Summary of European Passenger Bill of Rights -
http://news.bbc.co.uk/1/hi/business/4267095.stm
• Overbooked Flights• Passengers can now get roughly double the existing compensation if they are bumped off a
flight.
– Compensation must be paid immediately.
– These passengers must also be offered the choice of a refund, a flight back to their original point of departure, or an alternative flight to continue their journey.
• May also have rights to meals, refreshments, hotel accommodation if necessary even free e-mails, faxes or telephone calls.
• Cancelled Flights • Offered a refund of your ticket, along with a free flight back to your initial point of
departure, when relevant. Or, alternative transport to your final destination.
• Rights to meals, refreshments, hotel accommodation if necessary, even free e-mails or telephone calls.
– Airlines can only offer you a refund in the form of travel vouchers if you agree in writing
• Refunds may also be paid in cash, by bank transfer or cheque
• If the reason for your flight's cancellation is "within the airline's control", it must pay compensation.
• Compensation for cancellations must be paid within seven days.
• Delayed Flights • Airline may be obliged to supply meals and refreshments, along with accommodation if an
overnight stay is required.
• If the delay is for five hours or more, passengers are also entitled to a refund of their ticket with a free flight back to your initial point of departure if this is relevant.
30
CATSRCATSR
59
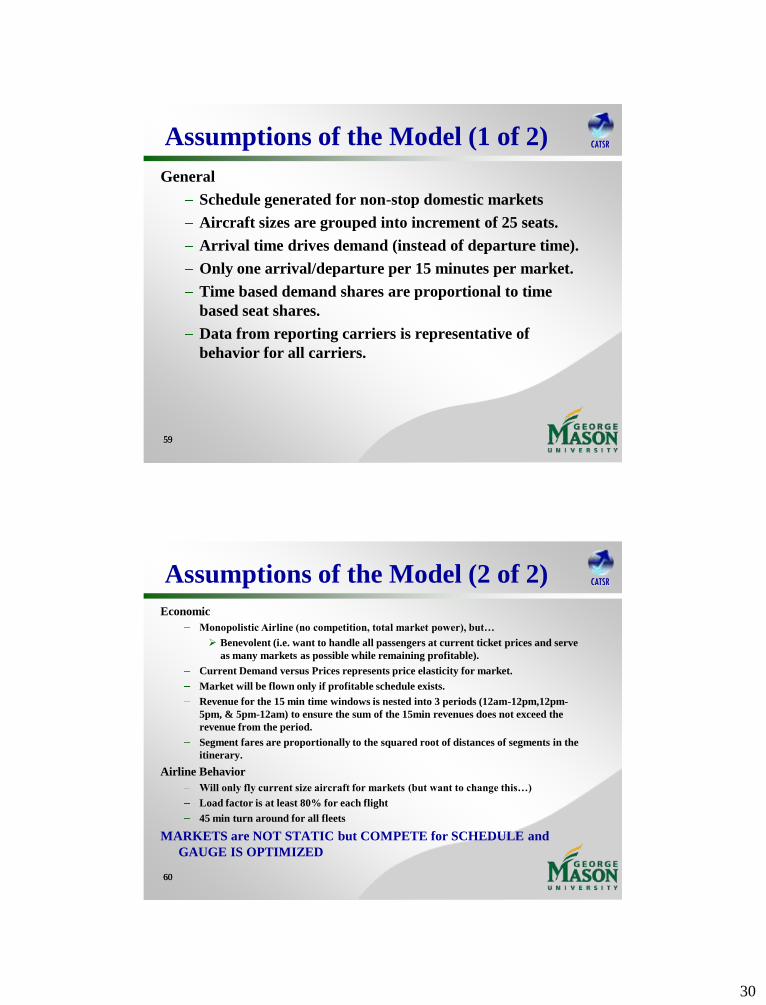
Assumptions of the Model (1 of 2)
59
General
Schedule generated for non-stop domestic markets
Aircraft sizes are grouped into increment of 25 seats.
Arrival time drives demand (instead of departure time).
Only one arrival/departure per 15 minutes per market.
Time based demand shares are proportional to time
based seat shares.
Data from reporting carriers is representative of
behavior for all carriers.
CATSRCATSR
60
Assumptions of the Model (2 of 2)
60
Economic
Monopolistic Airline (no competition, total market power), but…
Benevolent (i.e. want to handle all passengers at current ticket prices and serve
as many markets as possible while remaining profitable).
Current Demand versus Prices represents price elasticity for market.
Market will be flown only if profitable schedule exists.
Revenue for the 15 min time windows is nested into 3 periods (12am-12pm,12pm-
5pm, & 5pm-12am) to ensure the sum of the 15min revenues does not exceed the
revenue from the period.
Segment fares are proportionally to the squared root of distances of segments in the
itinerary.
Airline Behavior
Will only fly current size aircraft for markets (but want to change this…)
Load factor is at least 80% for each flight
45 min turn around for all fleets
MARKETS are NOT STATIC but COMPETE for SCHEDULE and
GAUGE IS OPTIMIZED

31
CATSRCATSR
61
Schedule Optimization Model
Maximize Airline Profit
Master Problem - IP
Maximize Airline Market Profit
Sub Problem - LP
ST:ST: Flow Constraint
planes
Period Demand
Period Revenue
Relaxed 15min
Relaxed Period
Supply-Demand =0Uncongested Capacity
One Schedule per Market
Column
Generation
Dual Prices
Set Packing Multi-commodity Flow
61
Capacity (per 15 min) minus
International, Cargo, Other
FlightsSupply (seats flown) – International
Connector Demand ≥ 0
One Arrival/ Departure /market /15 min
CATSRCATSR
62
Design of Experiments
62
Airport
QTR
Fuel Price
Capacity 8 10 12 8 10 12 8 10 12 8 10 12 8 10 12 8 10 12 8 10 12 8 10 12
$2.06 $3.53
3QTR 2007 3QTR 2008
LGA EWR
3QTR 2007
$2.06 $3.53 $5.00 $2.06 $3.53 $5.00
Capacity 8 = 8 arrivals and 8 departures per 15 min
= 64 arrivals and departures per hour
Capacity 10 = 10 arrivals and 10 departures per 15 min
= 80 arrivals and departures per hour
Capacity 12 = 12 arrivals and 12 departures per 15 min
= 96 arrivals and departures per hour