three key messages on tuberculosis control world tuberculosis day 2010 ecdc tb team european centre...
TRANSCRIPT
Three key messages on tuberculosis control
World Tuberculosis Day 2010
ECDC TB TeamEuropean Centre for Disease Prevention and ControlStockholm, 24 March 2010

Message 1The treatment success rate in the EU/EEA is too low to meet global targets
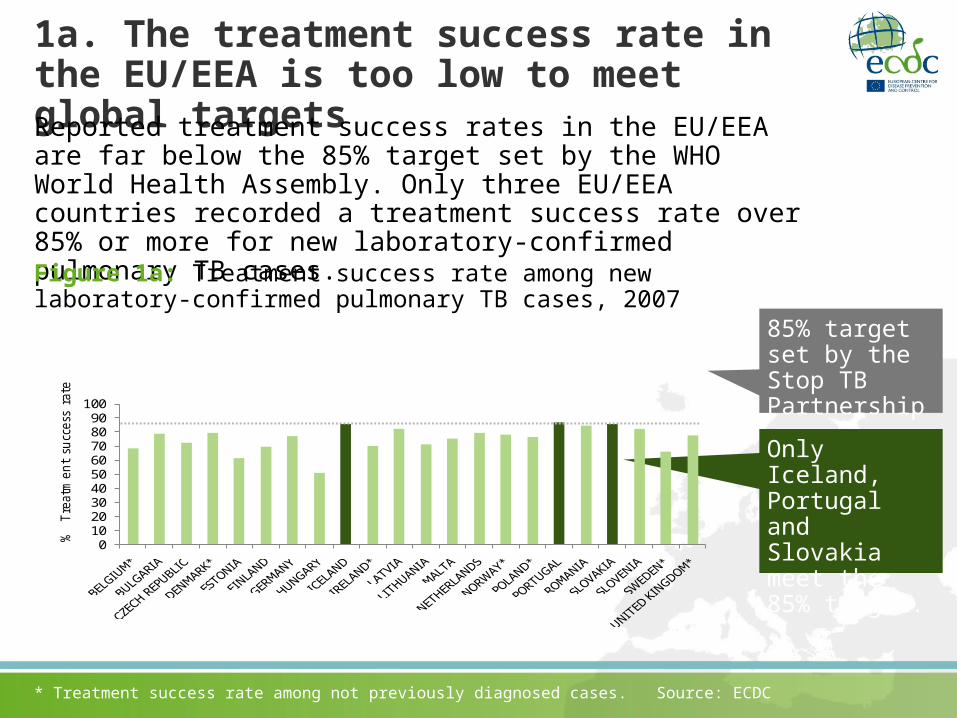
1a. The treatment success rate in the EU/EEA is too low to meet global targetsReported treatment success rates in the EU/EEA are far below the 85% target set by the WHO World Health Assembly. Only three EU/EEA countries recorded a treatment success rate over 85% or more for new laboratory-confirmed pulmonary TB cases.
* Treatment success rate among not previously diagnosed cases. Source: ECDC
85% target set by the Stop TB Partnership.
Only Iceland, Portugal and Slovakia meet the 85% target.
Figure 1a: Treatment success rate among new laboratory-confirmed pulmonary TB cases, 2007
0102030405060708090
100
% Tre
atm
ent
succ
ess
rate

1b. The treatment success rate in the EU/EEA is too low to meet global targetsFigure 1b: Percentage success rate among laboratory-confirmed new pulmonary TB cases, EU/EEA, 2007
71 to 84%
≥ 85%
60 to 70%
< 60%
Not included or not reporting
Source: ECDC
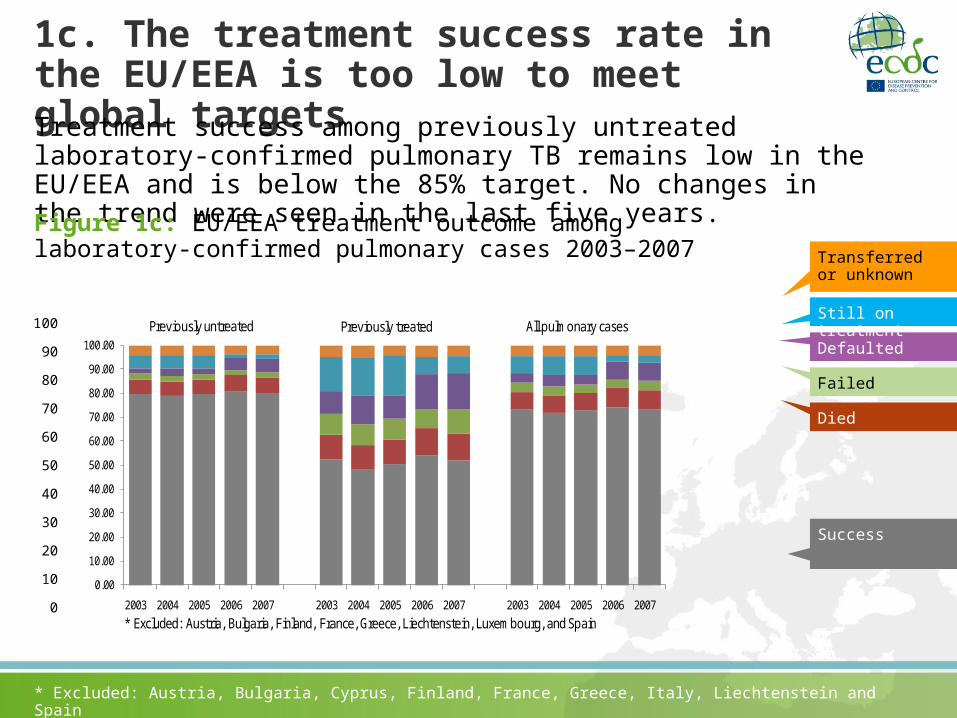
1c. The treatment success rate in the EU/EEA is too low to meet global targetsTreatment success among previously untreated laboratory-confirmed pulmonary TB remains low in the EU/EEA and is below the 85% target. No changes in the trend were seen in the last five years. Figure 1c: EU/EEA treatment outcome among laboratory-confirmed pulmonary cases 2003–2007
0.00
10.00
20.00
30.00
40.00
50.00
60.00
70.00
80.00
90.00
100.00
2003 2004 2005 2006 2007 2003 2004 2005 2006 2007 2003 2004 2005 2006 2007
* Excluded: Austria, Bulgaria, Finland, France, Greece, Liechtenstein, Luxembourg, and Spain
Previously untreated Previously treated All pulmonary cases
Success
Died
Failed
Defaulted
Still on treatment
Transferred or unknown
* Excluded: Austria, Bulgaria, Cyprus, Finland, France, Greece, Italy, Liechtenstein and Spain
100
90
80
70
60
50
40
30
20
10
0
Message 2Multidrug-resistant tuberculosis (MDR TB) remains a problem in the EU/EEA
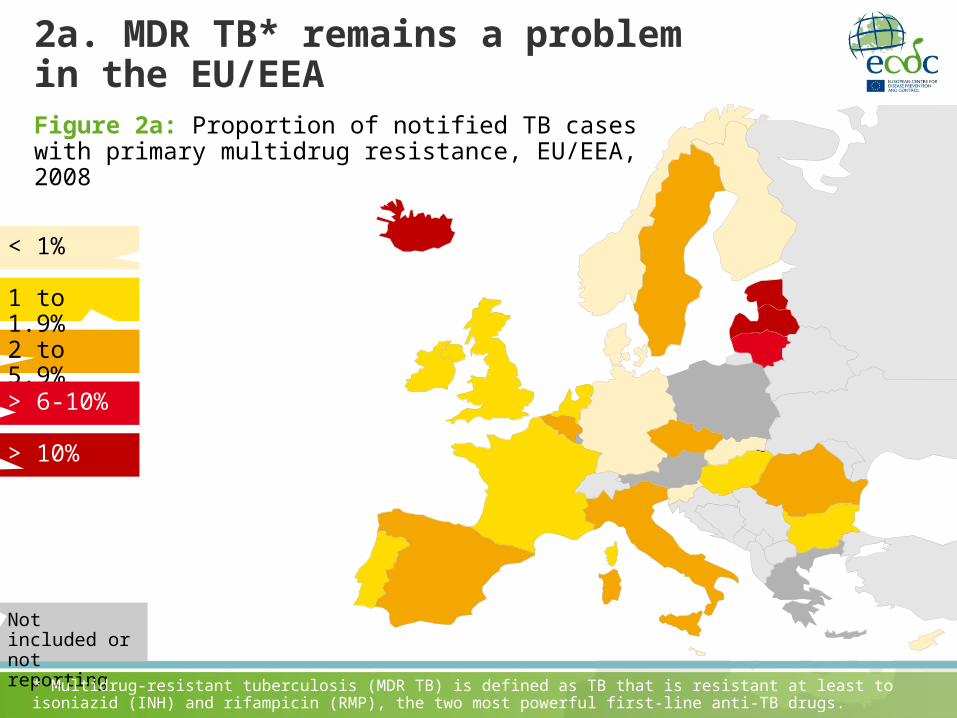
2a. MDR TB* remains a problem in the EU/EEAFigure 2a: Proportion of notified TB cases with primary multidrug resistance, EU/EEA, 2008
2 to 5.9%
> 10%
1 to 1.9%
> 6-10%
< 1%
Not included or not reporting
* Multidrug-resistant tuberculosis (MDR TB) is defined as TB that is resistant at least to isoniazid (INH) and rifampicin (RMP), the two most powerful first-line anti-TB drugs.

2b. MDR TB remains a problem in the EU/EEA Treatment success rate among MDR TB cases is extremely low (31%).
78%
31%
7%
17%
3%
17%
6%
13%
2%
17%
5% 5%
0
10
20
30
40
50
60
70
80
90
MDR MDR MDR MDR MDR MDR
Success Died Failed Defaulted Still on treatment
Transferred or unknown
Figure 2b: Treatment outcome of all* MDR TB cases, compared to all non-MDR cases, EU/EEA, 2006**
* Pulmonary and extra-pulmonary ** Both groups are 2006 treatment cohorts
Non-MDR Non-MDR Non-MDR Non-MDR Non-MDRNon-MDR

Message 3The decline in tuberculosis has levelled off in the EU/EEA

3a. The decline in tuberculosis has levelled off in the EU/EEA
Figure 3a: TB notification rates by incidence grouping, 1995–2008 and 2002–2008
Source: ECDC
The decrease in TB notification rates has stagnated in the EU/EEA.
The decline seen in countries with high and intermediate incidence rates contributes substantially to the average EU/EEA decline.
<20/100 000
EU/EEA
>20/100 000
Noti
fica
tion r
ate
(per
100
00
0 p
opula
tion)
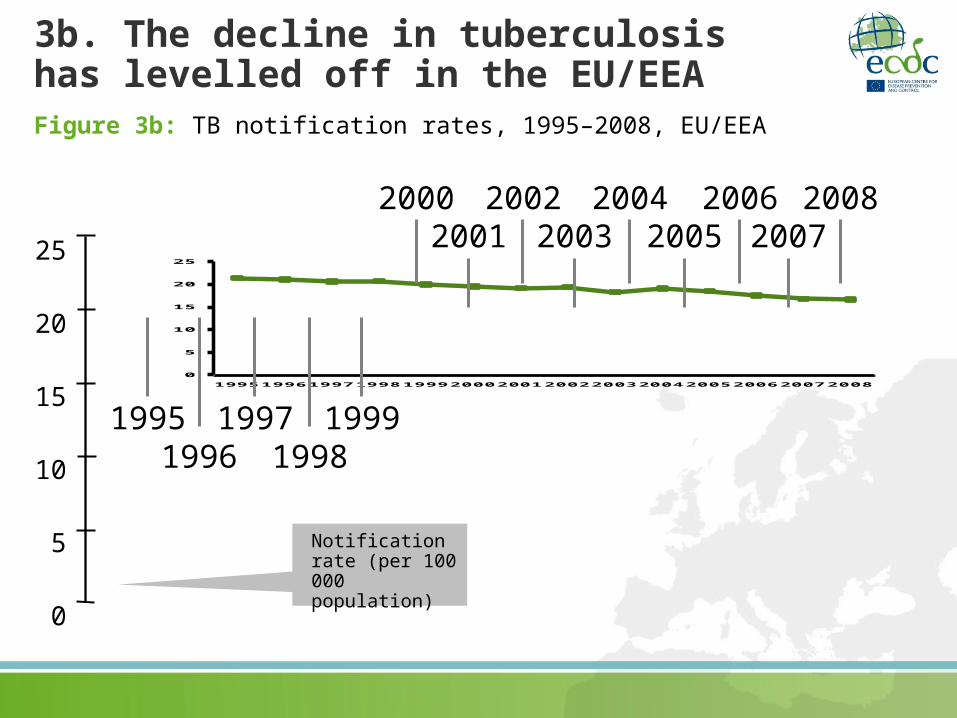
3b. The decline in tuberculosis has levelled off in the EU/EEA
0
5
10
15
20
25
19951996199719981999200020012002200320042005200620072008
19951996
19971998
1999
2000
25
20
15
10
5
0
20012002
20032004
20052006
20072008
Notification rate (per 100 000 population)
Figure 3b: TB notification rates, 1995–2008, EU/EEA