three key findings - the sports esquires – putting...
TRANSCRIPT

Three Key Findings
1. Exponent’s Statistical Analysis of the Difference in Average Pressure Drops is Wrong Because it Ignores Timing.
2. Exponent Improperly Draws Conclusions Based on the Variability in Halftime Pressure Measurements Despite Conceding that the Variability is Statistically Insignificant.
3. If the Logo Gauge was Used to Measure the Patriots Balls Before the Game, Then 8 of 11 were Above Exponent’s Expected Outcome.
CONFIDENTIAL NFLPA_BRADY003423
Finding 1:
Exponent’s “Most Significant” Statistical Analysis Ignores Timing
CONFIDENTIAL NFLPA_BRADY003424
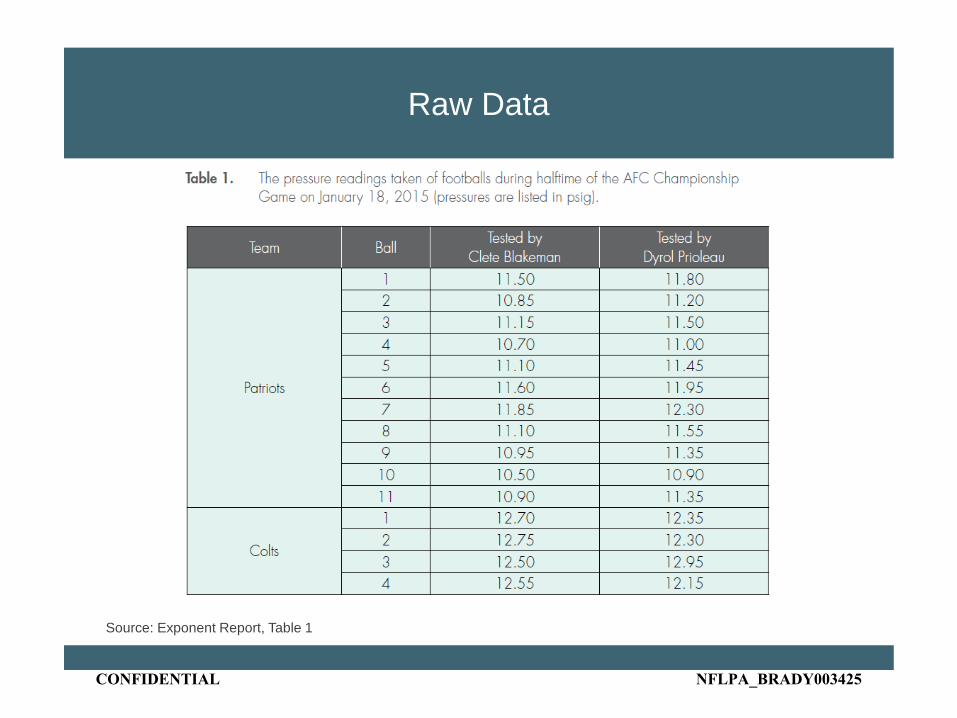
Raw Data
Source: Exponent Report, Table 1
CONFIDENTIAL NFLPA_BRADY003425
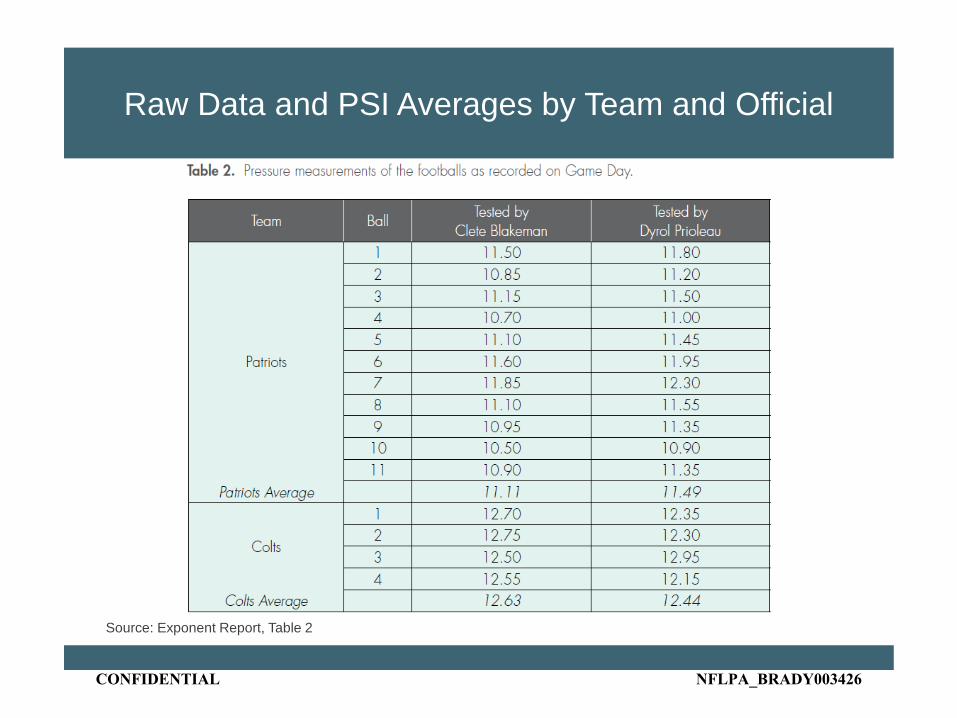
Raw Data and PSI Averages by Team and Official
Source: Exponent Report, Table 2
CONFIDENTIAL NFLPA_BRADY003426

Exponent Scenario 3
Source: Exponent Report, Table 5
“Note that for the remainder of this report, when the Game Day data are discussed, it should be taken to mean that the data from Scenario 3 are the data being referenced.” (Exponent Report, p. 12)
CONFIDENTIAL NFLPA_BRADY003427
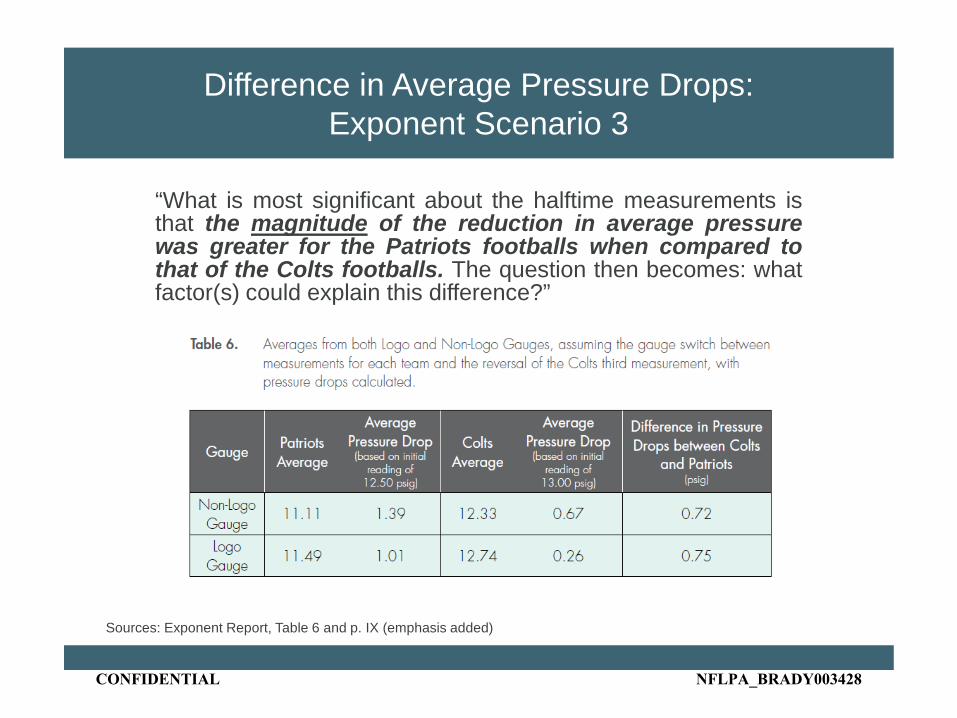
Difference in Average Pressure Drops: Exponent Scenario 3
Sources: Exponent Report, Table 6 and p. IX (emphasis added)
“What is most significant about the halftime measurements is that the magnitude of the reduction in average pressure was greater for the Patriots footballs when compared to that of the Colts footballs. The question then becomes: what factor(s) could explain this difference?”
CONFIDENTIAL NFLPA_BRADY003428
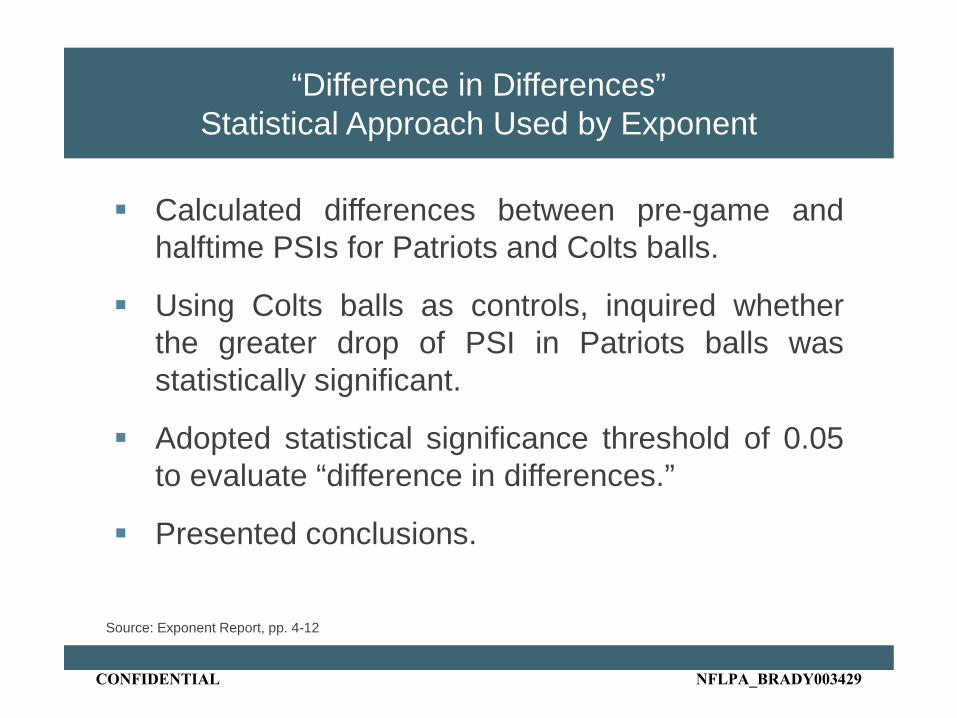
“Difference in Differences” Statistical Approach Used by Exponent
Calculated differences between pre-game and halftime PSIs for Patriots and Colts balls.
Using Colts balls as controls, inquired whether the greater drop of PSI in Patriots balls was statistically significant.
Adopted statistical significance threshold of 0.05 to evaluate “difference in differences.”
Presented conclusions.
Source: Exponent Report, pp. 4-12
CONFIDENTIAL NFLPA_BRADY003429

Exponent’s Conclusions From Difference in Differences Statistical Analysis
Sources: Exponent Report, Table 8 and p. 11 (emphasis added)
“As shown in Table 8, the p-value for all of the above scenarios is less than 0.05. This indicates that regardless of which of the above four sets of assumptions are made about the gauges used to generate the Game Day data, the difference between the average pressure drop of the Patriots and Colts footballs is statistically significant. In other words, in all cases studied, the additional pressure drop exhibited by the Patriots footballs is unlikely to have occurred by chance.”
CONFIDENTIAL NFLPA_BRADY003430
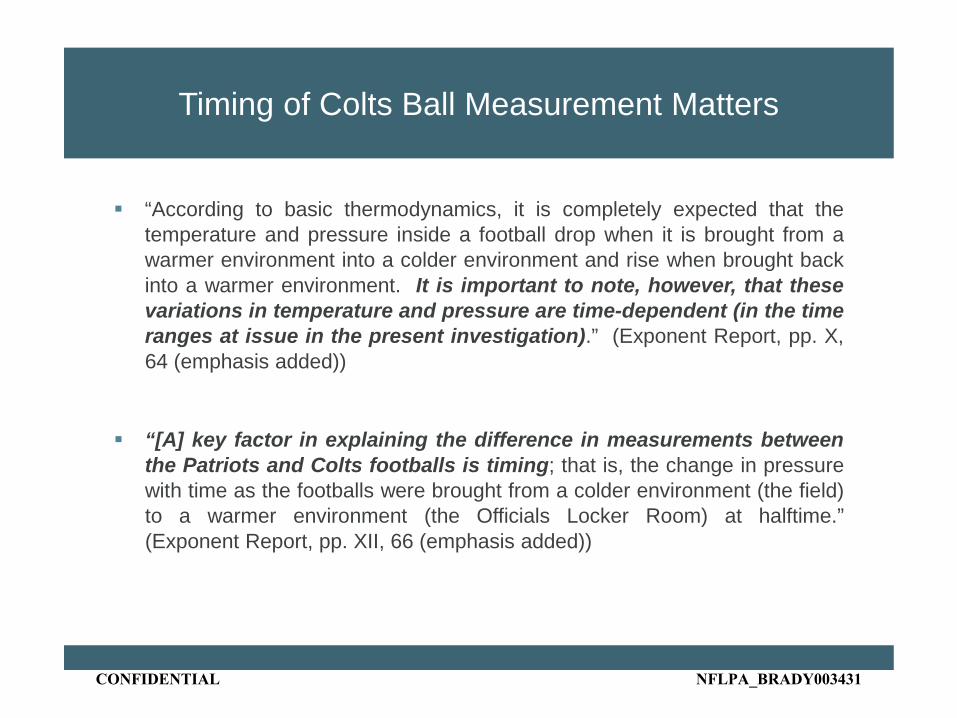
Timing of Colts Ball Measurement Matters
“According to basic thermodynamics, it is completely expected that the temperature and pressure inside a football drop when it is brought from a warmer environment into a colder environment and rise when brought back into a warmer environment. It is important to note, however, that these variations in temperature and pressure are time-dependent (in the time ranges at issue in the present investigation).” (Exponent Report, pp. X, 64 (emphasis added))
“[A] key factor in explaining the difference in measurements between the Patriots and Colts footballs is timing; that is, the change in pressure with time as the footballs were brought from a colder environment (the field) to a warmer environment (the Officials Locker Room) at halftime.” (Exponent Report, pp. XII, 66 (emphasis added))
CONFIDENTIAL NFLPA_BRADY003431
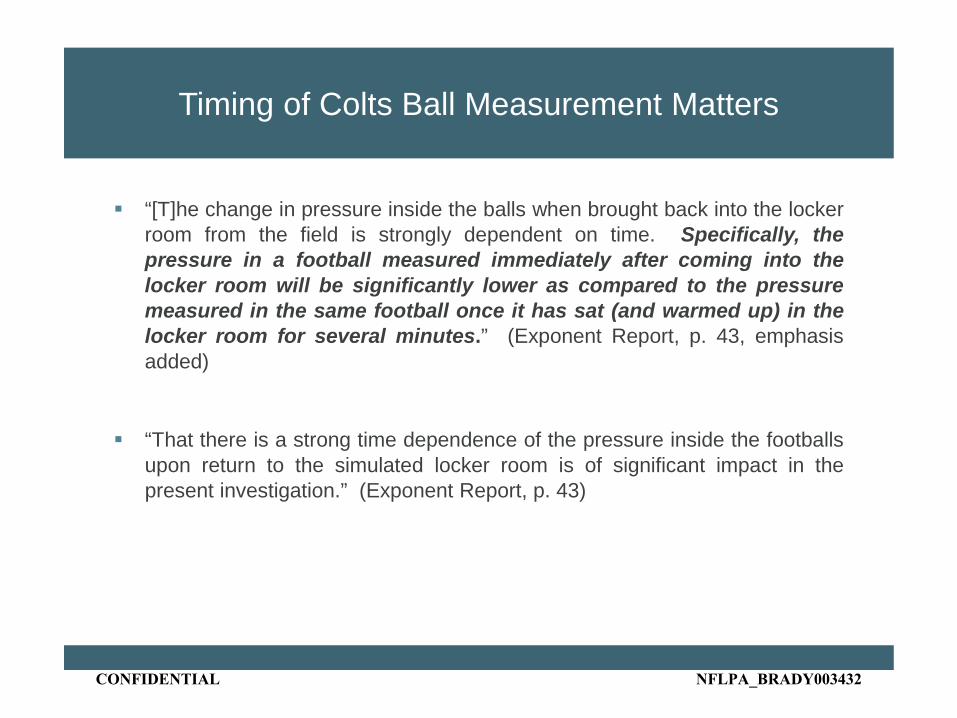
Timing of Colts Ball Measurement Matters
“[T]he change in pressure inside the balls when brought back into the locker room from the field is strongly dependent on time. Specifically, the pressure in a football measured immediately after coming into the locker room will be significantly lower as compared to the pressure measured in the same football once it has sat (and warmed up) in the locker room for several minutes.” (Exponent Report, p. 43, emphasis added)
“That there is a strong time dependence of the pressure inside the footballs upon return to the simulated locker room is of significant impact in the present investigation.” (Exponent Report, p. 43)
CONFIDENTIAL NFLPA_BRADY003432

Exponent’s Figure 22: Time Simulation Results
Source: Exponent Report, Figure 22
CONFIDENTIAL NFLPA_BRADY003433
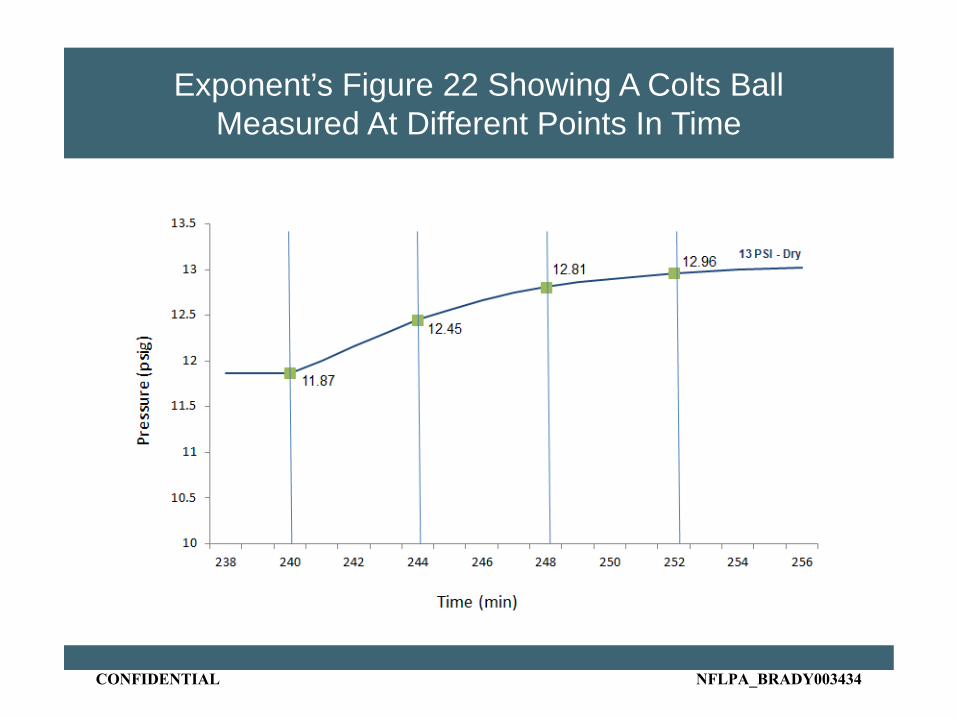
Exponent’s Figure 22 Showing A Colts Ball Measured At Different Points In Time
CONFIDENTIAL NFLPA_BRADY003434

Make Apples-to-Apples Comparisons Controlling for Time
Case 1: Measurement of Colts balls immediately after measurement of Patriots balls (Exponent’s assumption).
Case 2: Measurement of Colts balls at the end of halftime (Exponent’s alternative).
Case 3: Case 2, now accounting for drier Colts balls if tested at the end of halftime.
CONFIDENTIAL NFLPA_BRADY003435
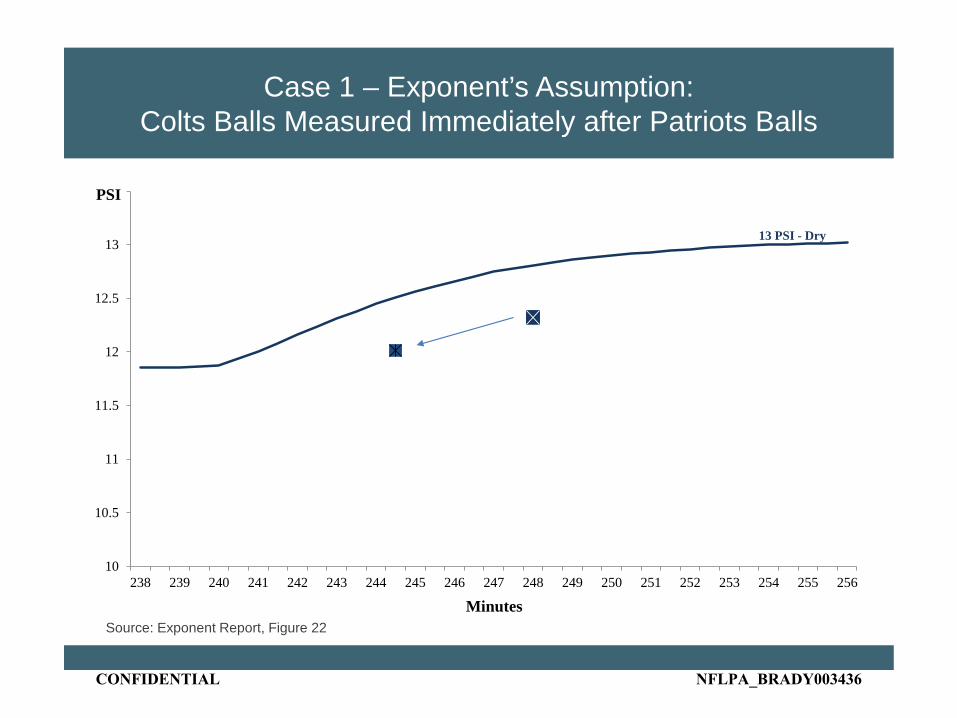
Case 1 – Exponent’s Assumption: Colts Balls Measured Immediately after Patriots Balls
Source: Exponent Report, Figure 22
10
10.5
11
11.5
12
12.5
13
13.5
238 239 240 241 242 243 244 245 246 247 248 249 250 251 252 253 254 255 256
PSI
Minutes
13 PSI - Dry
CONFIDENTIAL NFLPA_BRADY003436

Case 1 – Exponent’s Assumption: Colts Balls Measured Immediately after Patriots Balls
Ignoring Timing (Exponent)
Accounting for Timing
Difference in differences 0.72 – 0.75 0.41 – 0.44 p-value 0.004 0.067
CONFIDENTIAL NFLPA_BRADY003437

Case 2: Colts Balls Measured After Reinflation of Patriots Balls
“According to information provided by Paul, Weiss, during the halftime period, three events pertaining to the footballs are known to have occurred: 1. The air pressure measurements of 11 Patriots footballs were taken
and recorded. 2. The air pressure measurements of four Colts footballs were taken
and recorded. 3. The reinflation and regauging of 11 Patriots footballs to a level
within the 12.5–13.5 psig range was performed. According to information provided by Paul, Weiss, it is clear that of the three events listed above, the measuring of the Patriots balls occurred first. Although there remains some uncertainty about the exact order and timing of the other two events, it appears likely the reinflation and regauging occurred last.”
Source: Exponent Report, p. 2 (emphasis added)
CONFIDENTIAL NFLPA_BRADY003438
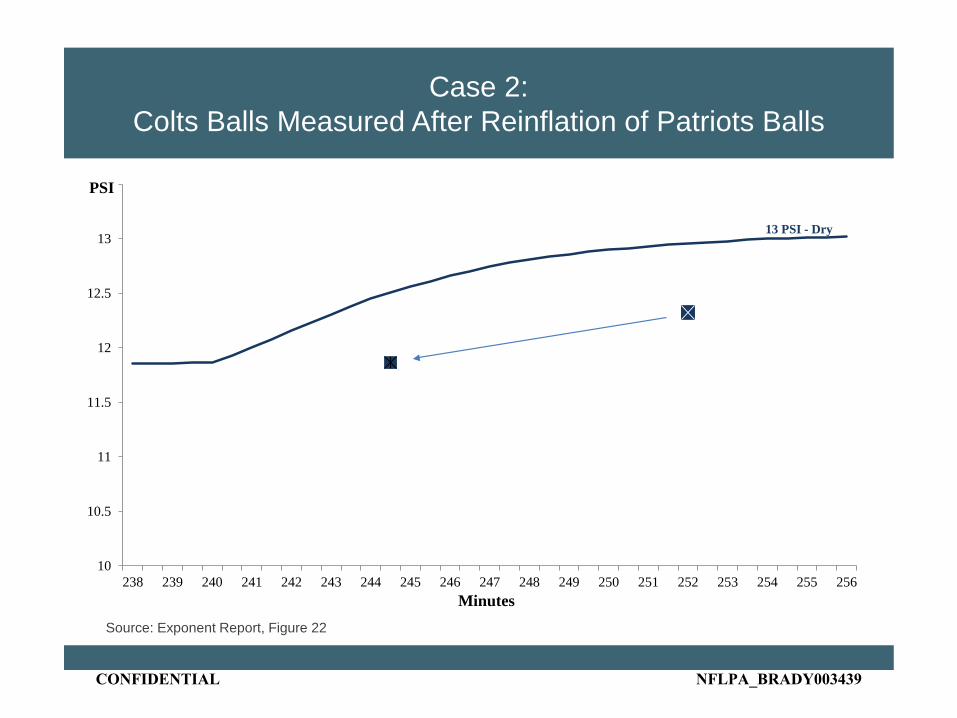
Case 2: Colts Balls Measured After Reinflation of Patriots Balls
Source: Exponent Report, Figure 22
10
10.5
11
11.5
12
12.5
13
13.5
238 239 240 241 242 243 244 245 246 247 248 249 250 251 252 253 254 255 256
PSI
Minutes
13 PSI - Dry
CONFIDENTIAL NFLPA_BRADY003439
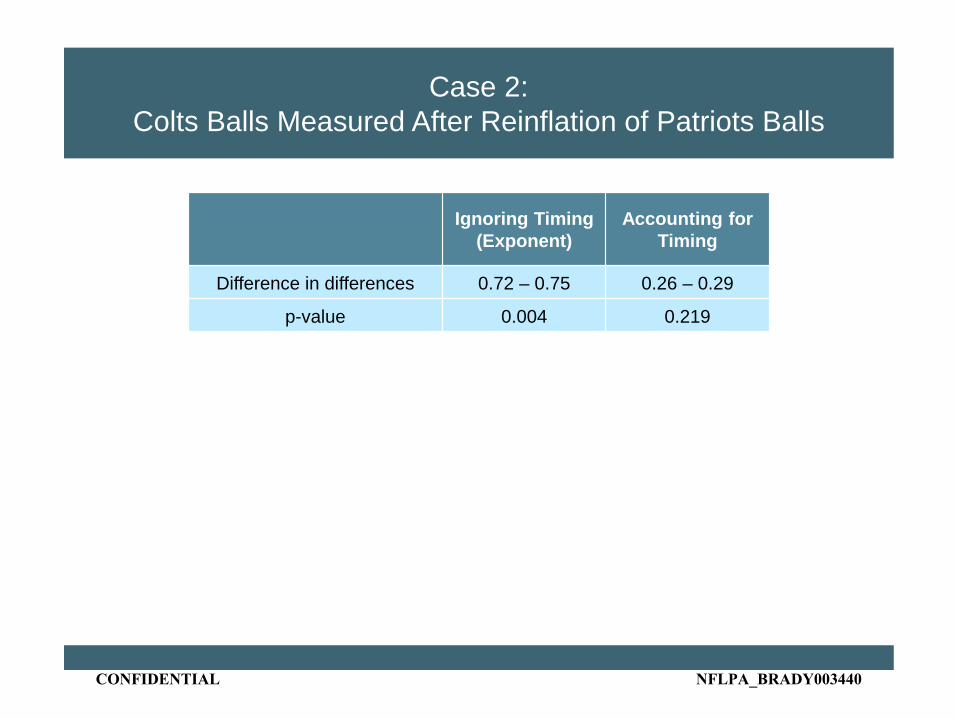
Case 2: Colts Balls Measured After Reinflation of Patriots Balls
Ignoring Timing (Exponent)
Accounting for Timing
Difference in differences 0.72 – 0.75 0.26 – 0.29
p-value 0.004 0.219
CONFIDENTIAL NFLPA_BRADY003440
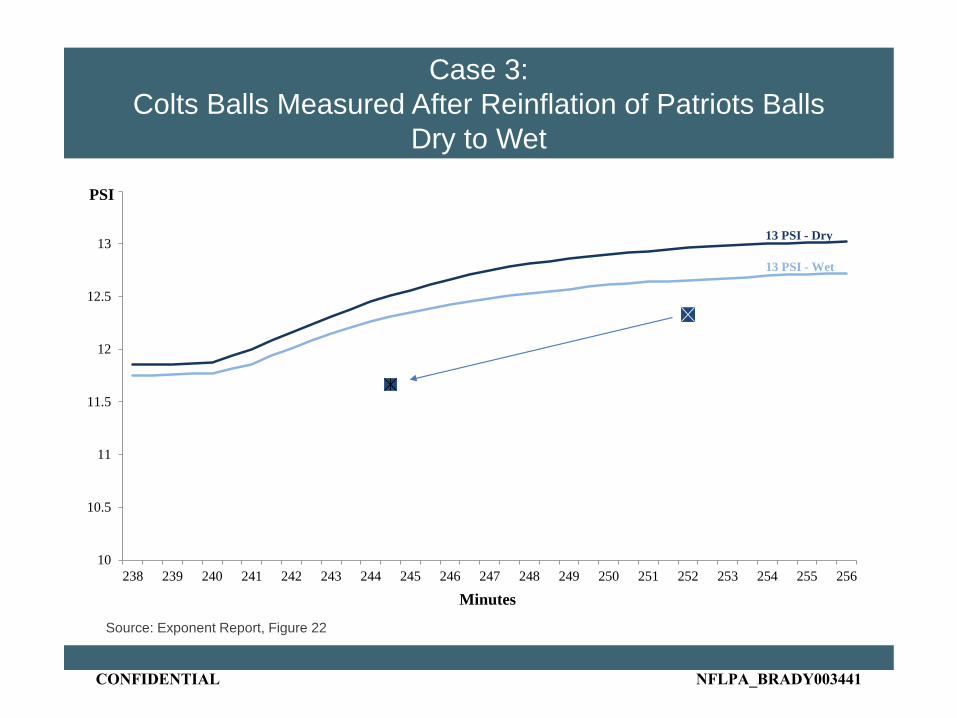
Case 3: Colts Balls Measured After Reinflation of Patriots Balls
Dry to Wet
Source: Exponent Report, Figure 22
10
10.5
11
11.5
12
12.5
13
13.5
238 239 240 241 242 243 244 245 246 247 248 249 250 251 252 253 254 255 256
PSI
Minutes
13 PSI - Dry
13 PSI - Wet
CONFIDENTIAL NFLPA_BRADY003441
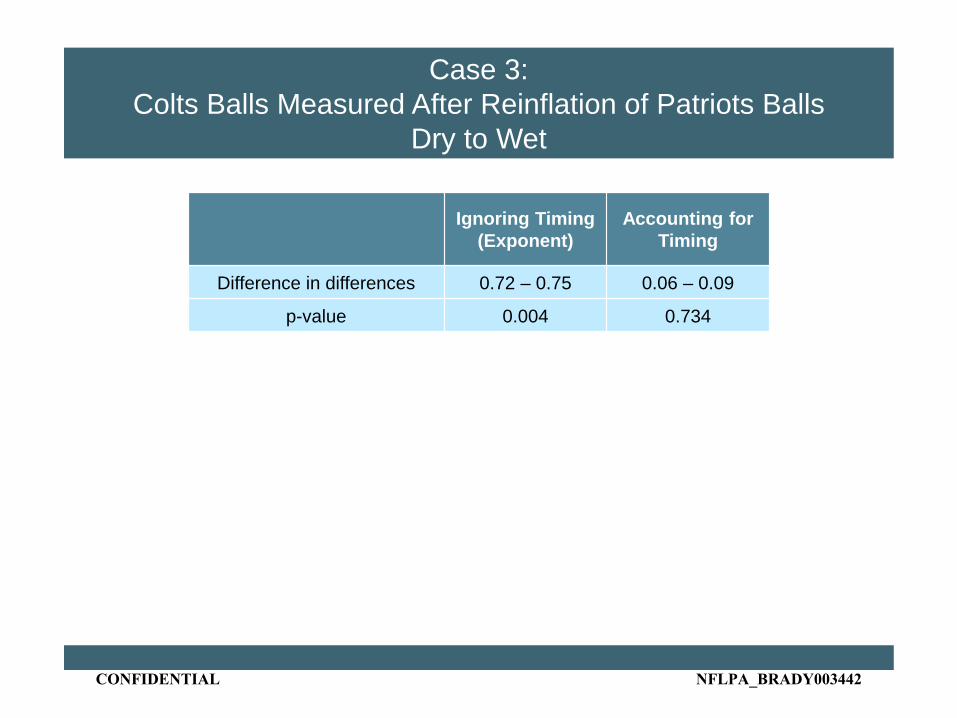
Case 3: Colts Balls Measured After Reinflation of Patriots Balls
Dry to Wet
Ignoring Timing (Exponent)
Accounting for Timing
Difference in differences 0.72 – 0.75 0.06 – 0.09
p-value 0.004 0.734
CONFIDENTIAL NFLPA_BRADY003442

Finding 2:
Exponent Improperly Draws Conclusions from its Statistical Variability Analysis
CONFIDENTIAL NFLPA_BRADY003443

Conclusion about Variability in Halftime Pressure Measurements
“In addition to noting the difference in average pressure drops between the Colts and Patriots footballs when measured at halftime, we observed that there appears to be a difference in the variability of the measurements recorded for each team. Although we found the difference between the variability in halftime pressure measurements of the Patriots and the Colts footballs not to be statistically significant, we can draw certain conclusions on variability when these data are reconsidered in the context of our experimental results.”
“Specifically, the fluctuations in the halftime pressures of Patriots footballs exceed in magnitude the fluctuations that can be attributed to the combined effects of the various physical, usage, and environmental factors we examined. Therefore, subject to discovery of an as yet unidentified and unexamined factor, it is our view that the most plausible explanation for the variability in the Patriots measurements recorded at halftime is that the 11 Patriots footballs measured by the officials at halftime did not all start the game at or near the same pressure.”
Sources: Exponent Report, pp. XIV and 68 (emphases added)
CONFIDENTIAL NFLPA_BRADY003444
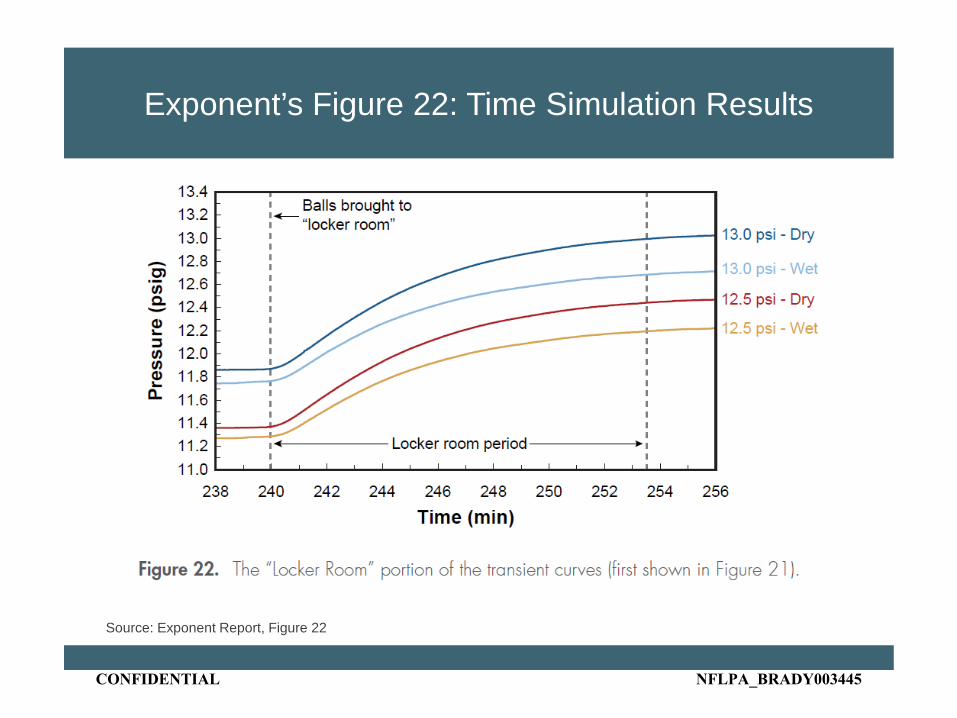
Exponent’s Figure 22: Time Simulation Results
Source: Exponent Report, Figure 22
CONFIDENTIAL NFLPA_BRADY003445
Finding 3:
If the Logo Gauge was Used Pre-Game, then 8 of 11 Patriots Balls were Above
Exponent’s Expected Outcome
CONFIDENTIAL NFLPA_BRADY003446
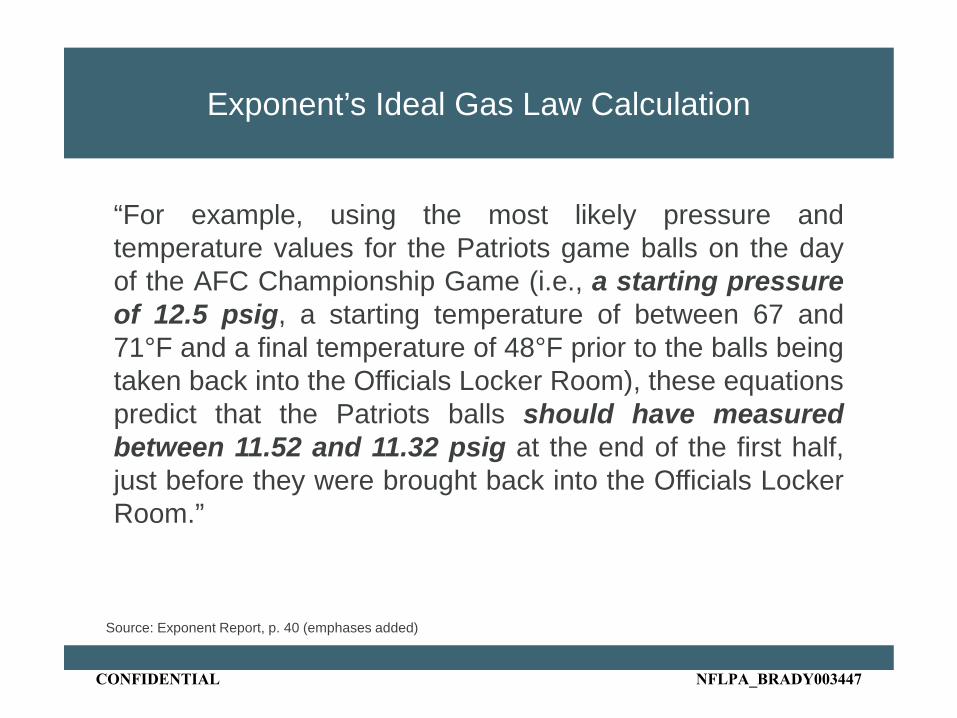
Exponent’s Ideal Gas Law Calculation
“For example, using the most likely pressure and temperature values for the Patriots game balls on the day of the AFC Championship Game (i.e., a starting pressure of 12.5 psig, a starting temperature of between 67 and 71°F and a final temperature of 48°F prior to the balls being taken back into the Officials Locker Room), these equations predict that the Patriots balls should have measured between 11.52 and 11.32 psig at the end of the first half, just before they were brought back into the Officials Locker Room.”
Source: Exponent Report, p. 40 (emphases added)
CONFIDENTIAL NFLPA_BRADY003447
Exponent Misapplies Patriots Balls Measurements In Ideal Gas Law Formula
“Once the game day measurements are converted into their corresponding Master Gauge pressures (in order to provide for a direct comparison with the results predicted by the calculations). . .” (Exponent Report, p. 40, emphasis added)
Exponent concludes that 8 out of 11 balls are below the lower bound of the range. (Exponent Report, p. 40)
Yet Exponent does not make Master Gauge conversion to adjust initial PSI reading. (Exponent Report, Table 10)
CONFIDENTIAL NFLPA_BRADY003448
Pre-Game Measurements Using the Logo Gauge
“Although [Referee] Anderson’s best recollection is that he used the Logo Gauge, he said that it is certainly possible that he used the Non-Logo Gauge.” (Wells Report p. 52, emphasis added)
“We have been told by Paul, Weiss that there remains some uncertainty as to which of the two gauges was used prior to the game.” (Exponent Report, p. IX)
“[T]he Logo Gauge generally overestimated the Master Gauge by ~0.3-0.4 psig. . .” (Exponent Report, p. 20)
CONFIDENTIAL NFLPA_BRADY003449
Correcting Initial PSI of Patriots Balls Using Master Gauge Conversion Formula
Applying Exponent’s Master Gauge conversion formula, the initial PSI for the Patriots Balls would actually have been 12.17 – not 12.5 – if the Logo Gauge was used pre-game. (Exponent, p. 28)
CONFIDENTIAL NFLPA_BRADY003450

Corrected Results
Initial PSI Not Master-Gauge
Adjusted
Initial PSI Master-Gauge
Adjusted Lower Bound of Expected
Ideal Gas Law PSI
11.32 11.01
Number of Patriots Balls
Above 3 8
Below 8 3
Inputting an initial PSI of 12.17 to the Ideal Gas Law formula, 8 of 11 Patriots balls are above the lower bound of the expected range.
CONFIDENTIAL NFLPA_BRADY003451
Three Key Findings
1. Exponent’s Statistical Analysis of the Difference in Average Pressure Drops is Wrong Because it Ignores Timing.
2. Exponent Improperly Draws Conclusions Based on the Variability in Halftime Pressure Measurements Despite Conceding that the Variability is Statistically Insignificant.
3. If the Logo Gauge was Used to Measure the Patriots Balls Before the Game, Then 8 of 11 were Above Exponent’s Expected Outcome.
CONFIDENTIAL NFLPA_BRADY003452