three essays on corporate acquisitions, bidders' liquidity
TRANSCRIPT

Louisiana State UniversityLSU Digital Commons
LSU Doctoral Dissertations Graduate School
2006
Three essays on corporate acquisitions, bidders'liquidity, and monitoringHuihua LiLouisiana State University and Agricultural and Mechanical College, [email protected]
Follow this and additional works at: https://digitalcommons.lsu.edu/gradschool_dissertations
Part of the Finance and Financial Management Commons
This Dissertation is brought to you for free and open access by the Graduate School at LSU Digital Commons. It has been accepted for inclusion inLSU Doctoral Dissertations by an authorized graduate school editor of LSU Digital Commons. For more information, please [email protected].
Recommended CitationLi, Huihua, "Three essays on corporate acquisitions, bidders' liquidity, and monitoring" (2006). LSU Doctoral Dissertations. 42.https://digitalcommons.lsu.edu/gradschool_dissertations/42
THREE ESSAYS ON CORPORATE ACQUISITIONS, BIDDERS’ LIQUIDITY, AND MONITORING
A Dissertation
Submitted to the Graduate Faculty of the Louisiana State University and
Agriculture and Mechanical College In partial fulfillment of the
Requirements for the degree of Doctor of Philosophy
In
The Interdepartmental Program in Business Administration (Finance)
by Huihua Li
Bachelor, FuDan University, 1997 Master, FuDan University, 2000
M.S., Louisiana State University, 2004 August, 2006

ii
Acknowledgements
I would like to express my most sincere gratitude and appreciation to my committee chair,
Dr. Harley Ryan, for his inspiration, guidance, encouragement and support throughout my Ph.D.
study in LSU. I am also deeply indebted to my committee members, Dr. Ji-Chai Li, Dr. Gary
Sanger, Dr. William Lane and Dr. Sudipta Sarangi for their valuable comments and helpful
suggestions. Special thanks also go to other faculty members and staff in the Department of
Finance.

iii
Table of Contents
ACKNOWLEDGEMENTS………….…………………………………………………………ii
ABSTRACT...…………………………………………………………………………..……..v
CHAPTER 1 INTRODUCTION……………………………………………………………….1
CHAPTER 2 ACQUISITIONS AND BIDDERS’ LIQUIDITY: EVIDENCE FROM SUCCESSFUL AND UNSUCCESSFUL TAKEOVERS…….……….4
2.1 Introduction……………………………………………………………………………4 2.2 Hypothesis…………………………………………………………………….……….8 2.2.1 Successful Takeovers and Liquidity…………………………………...………8 2.2.2 Unsuccessful Takeovers and Liquidity………………………………...………9 2.3 Data…………………………………………………………………………...……10 2.4 Methods………………………………………………………………………………14 2.4.1 Changes in the Rate of Information Arrival………………………….………14 2.4.2 Microstructure Elements Analysis……………………………………………15 2.4.3 Information Production Hypothesis or Firm Characteristics Hypothesis…….18 2.5 Empirical Results………………………………………………….…………………20 2.5.1 Changes in the Rate of Information Arrival………………………….………20 2.5.2 Microstructure Elements Analysis……………………………………………22 2.5.2-1 Liquidity Changes for Successful Bidders and
Unsuccessful Bidders……………………………………………….22 2.5.2-2 Comparison of Liquidity Changes for Public and Private
Acquisitions and Related and Unrelated Acquisitions……….……..29 2.5.2-3 Comparison of Liquidity Changes for Bidders that Use
Different Methods of Payments…………………………………….35 2.5.2-4 Comparison of Liquidity Changes for Public and Private,
Related and Unrelated Unsuccessful Bidders………………………39 2.5.3 Information Asymmetry Changes…………………………………………….43 2.5.3-1 Price Impact…………………………………………………..……….43 2.5.3-2 Probability of Information-Based Trading…………………..………..47 2.5.4 Tests of Information Production Hypothesis and Firm
Characteristics Hypothesis………………………………………….…………49 2.5.5 Other Tests……………………………………………………………………52
2.5.6 Multivariate Test…………………………………………………...…………59 2.6 Conclusions……………………………………………………………….………….63
CHAPTER 3 LIQUIDITY AND MARKET MONITORING: AN EXAMINATION OF
CHANGES IN MARKET MONITORING FOR SUCCESSFUL BIDDERS………………………………………………….66
3.1 Introduction………………………………………………………………………..…66 3.2 Data…………………………………………………………………………………68 3.3 Methods………………………………………………………………………………71 3.3.1 Price Informativeness…………………………………………………………71

iv
3.3.2 Stock Price Performances………………………………………………….....72 3.3.3 Operating Performance……………………………………………………….74 3.3.4 Firm Value, Blockholder and Institutional Investor……………..….………..75 3.4 Empirical Results…………………………………………………………………….76 3.4.1 Comparison of Changes in Price Informativeness for LI and LD Groups…76 3.4.2 Comparison of Changes in Equity Returns for LI and LD Groups………......76 3.4.3 Comparison of Changes in Operating Performance for LI and LD Groups….84
3.4.4 Comparison of Changes in Bidders’ Tobin’s Q, Blockholder or Institutional Holdings…………………………………………….…….90
3.4.5 Check for Business Cycle…………………………………………………….93 3.4.6 Endogeneity and Causality Issues…………………………………………….95 3.5 Conclusions………………………………………………………………………..…98
CHAPTER 4 LIQUIDITY AND CORPORATE GOVERNANCE: AN EXAMINATION OF CHANGES IN CORPORATE GOVERNANCE FOR SUCCESSFUL
BIDDERS…………………………………………………………………..99 4.1 Introduction……………………………………………………………..……………99 4.2 Data…………………………………………………………………………………102 4.3 Methods…………………………………………………………………..…………102 4.3.1 Executive Compensation……………………………………………………102 4.3.1-1 Compensation Compositions………………………………………...102 4.3.1-2 Pay-for-Performance Sensitivity: Stock Options and
Restricted Stocks………………………..…………………………104 4.3.2 Board Characteristics………………………………………………………..106 4.3.2-1 Board Characteristics………………………………………………...106 4.3.2-2 Compensation Packages of Board of Directors……………………...107 4.3.3 Other Measures……………………………………………………………...107 4.4 Empirical Results…………………………………………………………………...108 4.4.1 CEO/Top Executives’ Compensation Packages…………………………….108 4.4.2 Board Characteristics and Board Compensation……………………………114 4.4.3 Multivariate Analysis………………………………………………………..122 4.5 Conclusions………………………………………………………………...……….125
CHAPTER 5 CONCLUSIONS……………………………………………………………...127
REFERENCES……………………………………………………………………………....129
VITA…………………………………………………………………………………………134

v
Abstract
This dissertation consists of three essays on corporate acquisitions, bidders’ liquidity and
monitoring. In the first essay, “Acquisitions and Bidders’ Liquidity: Evidence from Successful
and Unsuccessful Takeovers”, I examine the impact of corporate acquisitions on bidders’
liquidity. I find that liquidity improves for bidders that complete the takeovers but remains
unchanged or decreases for unsuccessful bidders. Takeovers of public firms result in similar
liquidity improvements as do takeovers of private firms. Takeovers that use stock as the method
of payment have significantly more improvement in liquidity than takeovers that use cash as the
payment method. These results suggest that changes in firm characteristics provide the primary
impetus for liquidity improvements following acquisitions. They also support the premise that
bundling two publicly held claims reduces the information advantage of informed traders.
In essay two, “Liquidity and Market Monitoring: An Examination of Changes in Market
Monitoring for Successful Bidders”, I use takeover as a liquidity-changing event to examine
empirically the relation between liquidity and monitoring of the firm. Dividing acquisitions into
liquidity-improved and liquidity-decreased groups, I find that the Hasbrouck (1993) pricing error
decreases significantly for the liquidity-improved bidders but increases significantly for the
liquidity-decreased bidders. This evidence suggests that price becomes more (less) informative
for the liquidity-improved (decreased) bidders and therefore provides greater incentives for
outsiders to monitor the firm. Consistent with improved monitoring, I find that the
liquidity-improved bidders have better operating performance and higher firm value than the
liquidity-decreased bidders.
In essay three, “Liquidity and Corporate Governance: An Examination of Changes in
Corporate Governance for Successful Bidders”, I examine empirically the influence of liquidity

vi
on a firm’s corporate governance. I find that compared to the liquidity-decreased bidders,
executives for the liquidity-improved bidders have significantly larger size- and
industry-adjusted increases in cash and total compensation after the acquisitions. The
pay-for-performance sensitivity of executive compensation decrease significantly for the
liquidity-improved bidders. These results support the proposition that an improvement in
liquidity results in a more informative stock price that enables a firm to write more efficient
contracts.

- 1 -
Chapter 1 Introduction
My dissertation examines how corporate acquisitions influence bidders’ liquidity and how
changes in liquidity impact bidders’ external and internal monitoring. This dissertation is an
attempt to link corporate finance and market microstructure together. Both corporate finance and
market microstructure have drawn plenty of attention in the finance area, however, the relation
between corporate finance and market microstructure has been largely unexplored. My
dissertation tries to fill in this void.
My dissertation consists of three essays. The first essay examines the impact of corporate
acquisitions on bidders’ liquidity. The second essay examines the impact of changes in liquidity
on bidders’ external monitoring and the third essay examines the impact of changes in liquidity
on bidders’ managerial compensation and corporate governance.
Acquisitions create changes in firm characteristics and produce new information about the
firm. Theories suggest that both firm characteristics and information generation can affect a
firm’s liquidity in the stock market. In the first essay, “Acquisitions and Bidders’ Liquidity:
Evidence from Successful and Unsuccessful Takeovers”, I examine the impact of corporate
acquisitions on bidders’ liquidity. I find that liquidity improves for bidders that complete the
takeovers but remains unchanged or decreases for unsuccessful bidders. Takeovers of public
firms result in similar liquidity improvements as do takeovers of private firms, but takeovers of
public firms have greater reduction in information asymmetry than takeovers of private firms.
Takeovers that use stock as the method of payment have significantly more improvement in
liquidity than takeovers that use cash as the payment method. These results suggest that changes
in firm characteristics provide the primary impetus for liquidity improvements following
acquisitions. They also support the premise that bundling two publicly held claims reduces the

- 2 -
information advantage of informed traders, which improves liquidity by lowering adverse
selection costs faced by market makers.
In essay two, “Liquidity and Market Monitoring: An Examination of Changes in Market
Monitoring for Successful Bidders”, I use takeover as a liquidity-changing event to examine
empirically the relation between liquidity and monitoring of the firm. Holmstrom and Tirole
(1993) argue that as a firm’s liquidity improves the marginal value of information about the firm
increases and the informed investors have a stronger incentive to monitor the firm since they are
more likely to benefit from their actions. Dividing acquisitions into liquidity-improved and
liquidity-decreased groups, I find that the Hasbrouck (1993) pricing error decreases significantly
for the liquidity-improved bidders but increases significantly for the liquidity-decreased bidders.
This evidence suggests that price becomes more (less) informative for the liquidity-improved
(decreased) bidders and therefore provides greater incentives for outsiders to monitor the firm.
Consistent with improved monitoring, I find that the liquidity-improved bidders have better
operating performance and higher firm value than the liquidity-decreased bidders.
In essay three, “Liquidity and Corporate Governance: An Examination of Changes in
Corporate Governance for Successful Bidders”, I examine empirically the influence of liquidity
on a firm’s corporate governance. I find that compared to the liquidity-decreased bidders,
executives for the liquidity-improved bidders have significantly larger size- and
industry-adjusted increases in cash compensation and total compensation after the acquisitions.
The pay-for-performance sensitivity of executive compensation, measured as the
incentive-intensity of stock option awards and the mix of stock option award to cash
compensation, decrease significantly for the liquidity-improved bidders. These results support
the proposition that an improvement in liquidity results in a more informative stock price that

- 3 -
enables a firm to write more efficient contracts. They are also consistent with the premise that a
more informative price system improves firm transparency, which reduces the need to make pay
sensitive to stock-price performance.

- 4 -
Chapter 2 Acquisitions and Bidders’ Liquidity: Evidence from Successful and Unsuccessful Takeovers
2.1 Introduction
Financial theory suggests that the liquidity of a firm’s shares in the financial markets
directly and indirectly influences firm value. Although many studies find relations between firm
characteristics (e.g., size) and market liquidity, how liquidity changes following decisions that
alter the characteristics of the firm remains relatively unexplored. In this essay, I propose that the
acquisition of another firm will affect liquidity. To test this proposition, I examine successful
takeovers and unsuccessful takeover attempts of public and private firms. On average, I find that
liquidity improves for successful takeovers only. Takeovers of public firms and private firms
both result in liquidity improvements for the bidders, but takeovers of public firms lead to greater
reduction in adverse selection problems. Bidders that use stock as a method of payment have
more improvements in liquidity than bidders that use cash as a method of payment. These results
suggest that changes in firm characteristics (increases in firm size, for example), and not
information produced during the acquisition process, provide the primary impetus for liquidity
improvement. The findings support the premise that bundling two publicly held claims reduces
the information advantage of informed traders, which improves liquidity by lowering adverse
selection costs faced by market makers. In addition, the results with respect to method of
payment support Merton’s (1987) proposition that an increase in the firm’s investor base
improves the firm’s liquidity.
The liquidity of a firm influences firm value for several reasons. First, investors maximize
expected returns net of transaction costs, and in equilibrium they require higher returns to hold
stocks with higher transaction costs. Therefore, a more liquid firm has a higher market value
(e.g., Amihud and Mendeson, 1986; Brennan and Subrahmanyam, 1996). Second, higher

- 5 -
liquidity lowers the cost of capital of a firm, and as a result expands the growth opportunities
available to the firm. Recognizing this fact, Arthur Levitt, former chairman of the SEC,
recommends high quality accounting standards because they can “improve liquidity [and] reduce
capital costs” (Easley and O’Hara, 2004). Third, higher levels of liquidity allows informed
traders to gain greater profits on their information (Kyle, 1985), and therefore provides greater
incentives for investors to gather information and monitor the firm (Holmstrom and Tirole, 1993).
Presumably, more monitoring will lead to better managed and more valuable firms.
Despite the importance of liquidity to firm value, researchers have provided scant empirical
evidence on the relation between decisions in the firm and changes in liquidity. One exception is
a paper by Lipson and Mortal (2003), who find that the bidder’s liquidity improves after the
successful takeover. However, they cannot determine the reason of the liquidity improvement for
the bidders. Financial theories suggest that both the information generated during the takeover
process and the changes in firm characteristics can drive the liquidity improvement for the bidder.
Although Lipson and Mortal suggest that firm characteristics influence the changes in liquidity,
they cannot rule out the possibility that information generated during the takeover process causes
the changes in liquidity.
Corporate acquisitions can influence bidders’ liquidity in at least two ways. First, corporate
acquisitions generate more public information for the bidders. Bidders make more disclosures
and attract more investor attention during the acquisition process. I refer to this premise as the
information production hypothesis. Diamond (1985) argues that public information improves
liquidity and makes all traders better off by reducing the need for individuals to gather
information. Hasbrouck (1991) argues that public information improves liquidity because private
information is the advance knowledge of public information, and better public disclosure reduces

- 6 -
the influence of private information. Second, the bidder of a successful takeover incurs changes
in firm characteristics that can affect its liquidity. I refer to this proposition as the firm
characteristics hypothesis. For example, a successful takeover bundles the claims on two
individual firms together. Subrahmanyam (1991), and Gorton and Pennacchi (1993) show that
the adverse selection problem is typically lower in a basket of securities. The decrease in the
adverse selection cost will lead to an improvement in liquidity. In addition, after the takeover, the
bidder increases in firm size. A larger firm usually has more trading volume and more analysts,
which results in lower information asymmetry and higher liquidity.
To distinguish between these hypotheses, I examine a sample of both successful and
unsuccessful takeovers. Unsuccessful takeover attempts, like successful acquisitions generate
information during the takeover process, but they do not change the characteristics of the firm. I
find that during the takeover process, changes in analysts’ coverage (forecast accuracy,
dispersion of forecasts, and number of news produced) of successful bidders are not significantly
different from those of unsuccessful bidders. However, liquidity improves for successful bidders,
but not for unsuccessful bidders. Altogether, these results suggest that changes in bidders’
characteristics, such as bundling two claims or an increase in size, drive the liquidity
improvement for successful bidders.
In my univariate analysis, I find that bidders that acquire private firms enjoy a similar
magnitude of liquidity improvements as do bidders that acquire public firms. However, after
controlling for other factors such as changes in the number of market makers or the size of the
deal, I find that bidders that acquire public firms have significantly greater improvements in
liquidity than bidders that acquire private firms. Furthermore, bidders that acquire public firms
experience greater reduction in the adverse selection problem measured as PIN (the probability

- 7 -
of information-based trading) than do bidders that acquire private firms. This evidence lends
support to the firm characteristics hypothesis. In my sample, the relative size of the target to the
bidder is significantly greater for bidders that acquire public firms. After the successful
completion of takeovers, bidders that acquire public firms increase more (both in absolute terms
and in relative terms) in size than do bidders that acquire private firms. Larger firms tend to
attract more analysts’ and have more trading volume, which decreases the adverse selection
(improves liquidity) for larger firms.
I find that successful bidders that use stock as a method of payment have significantly more
improvement in liquidity than successful bidders that use cash as a method of payment. Merton
(1987) argues that an increase in the investor base improves the firm’s liquidity. It is likely that a
bidder that uses stock as a method of payment in the acquisition will increase its investor base
since at least some of the shareholders in the acquired firm, who do not own shares in the
acquiring firm prior to the acquisition, will hold onto their shares afterward. Assuming that this
is the case, the result for stock payment appears to support Merton’s prediction.
Changes in liquidity for bidders that acquire firms in unrelated businesses do not appear to
be different from liquidity changes for bidders that make related acquisitions. If an acquisition of
an unrelated firm reduces the information advantage of informed traders in the combined firm,
this finding fails to support the bundling of claims predictions of Subrahmanyam (1991), and
Gorton and Pennacchi (1993). However, it is plausible that investors are well informed about all
public firms, which reduces the power of this test. Similarly, investors could be poorly informed
about all private firms, which again would reduce the power of the test.

- 8 -
The rest of the paper is organized as follows. Section 2 discusses the hypotheses of the paper.
Section 3 describes the data and the methods I use in the tests. Section 4 presents the empirical
results and Section 5 concludes.
2.2 Hypothesis
2.2.1 Successful Takeovers and Liquidity
Financial theories suggest two opposing effects of a successful takeover on the bidder’s
liquidity. Following Huson and MacKinnon (2003), I develop these two competing hypotheses.
I first identify several reasons that corporate acquisitions improve bidders’ liquidity. First, a
corporate acquisition changes a bidder’s firm characteristics. On one hand, a corporate
acquisition bundles claims on two individual assets together. Security design literature suggests
that the information asymmetry problem decreases in a basket of securities. Subrahmanyam
(1991) and Gorton and Pennacchi (1993) argue that informed investors, who have private
information on one particular security, become less informed when facing a basket of securities.
Their argument implies that when a bidder becomes more diversified through a takeover, the
informed investors lose their information advantage and the information asymmetry among
investors of the bidder decreases. On the other hand, a successful acquisition leads to an increase
in the bidder’s size. A larger company usually has lower information asymmetry and higher
liquidity because it typically attracts more analysts, has more press coverage and has higher
trading volume.
Second, a bidder attracts more attention and generates more public information during the
acquisition process. Diamond (1985) argues that public information improves liquidity and
makes all traders better off because it reduces the need for individuals to gather information.

- 9 -
Hasbrouck (1991) argues that private information is the advance knowledge of public
information and public disclosures reduces the impact of private information.
It is also likely that a successful takeover might decrease the bidder’s liquidity. The bidder
generates public information during the acquisition process. Huson and MacKinnon (2003)
hypothesize that public information could increase information asymmetry. They hypothesize
that public information complements informed investors’ private information, and informed
investors gain an even higher information advantage with better public information. On the other
hand, when firms with separate market prices combine into one firm with only one market price
(e.g., acquiring a public firm), the new single price does not provide investors with the same
level of information as two separate prices. This less informative price exacerbates the
information asymmetry among investors and decreases the bidder’s liquidity.
2.2.2 Unsuccessful Takeovers and Liquidity
Similar to successful bidders, unsuccessful bidders attract investor attention and generate
more public information during the takeover process. However, because their takeover attempts
finally fail, unsuccessful bidders do not incur changes in firm characteristics, such as bundling
claims together or increasing in firm size. I identify three possible effects of a takeover attempt
on unsuccessful bidders’ liquidity.
First, if the information generated during the acquisition process influences bidders’
liquidity and if private information is the advance knowledge of public information, then more
public information improves liquidity (Hasbrouck 1991; Diamond 1985), and unsuccessful
bidders enjoy liquidity improvements. Second, if the information generated during the
acquisition process influences bidders’ liquidity but public information only serves to
complement investors’ private information, then unsuccessful bidders incur decreases in liquidity

- 10 -
after their takeover attempts fail. Third, if the information generated during the acquisition
process has no effect on bidders’ liquidity, takeover attempts will have no effect on unsuccessful
bidders’ liquidity.
2.3 Data
I collect from the Securities Data Corporation’s (SDC) Mergers and Acquisitions (M&A)
Database a list of successful and unsuccessful mergers and tender offers for domestic targets,
with the initial bid announced between April 1st, 1995 and December 31st, 2001.1 To be included
in the analysis, an acquisition must meet the following criteria. (1) The announcement date and
the effective/withdrawal date of the takeover can be verified through the Lexis/Nexis; (2) The
bidder is a U.S. firm listed on the NYSE, AMEX or NASDAQ; (3) The bidder has 300 days of
return data on CRSP and 80 days of transaction data in the NYSE Trade and Quote Database
(TAQ) before and after the announcement and effective/withdrawal date of the takeover; (4) The
successful bidder acquires more than fifty percent and owns one hundred percent of the target
firm’s shares after the takeover; (5). The deal value is over 10 percent of the bidder’s market
value two weeks before the takeover announcement; (6). The firm does not attempt another
takeover between its pre- and post- takeover event window; (7). The bidder’s stock price is
above three dollars; (8). The takeover does not have such confounding events as stock split,
addition into and deletion from the market index. I obtain the analysts’ data from the I/B/E/S. I
collect the number of news data from Lexis/Nexis.
My final sample consists of 1552 successful takeovers and 516 unsuccessful takeover
attempts.
1 I use Cusip numbers to merge the data from SDC with data from CRSP and TAQ. I match by hand those firms that cannot be merged by Cusip number.

- 11 -
Table 1 presents the distribution and summary statistics of the successful takeover sample
and the unsuccessful takeover sample from 1995 to 2001 respectively. Bidder size is the bidder’s
market value two weeks before the takeover announcement. Transaction value is the total value
of consideration paid or attempt to be paid by a bidder, excluding fees and expenses. If the target
is a publicly traded firm, I classify the takeover as a public takeover. If the target is a privately
held firm, I classify the takeover as a private takeover2. If the target has the same first two-digit
SIC code as the bidder, I classify the takeover as a related takeover. If the target does not have
the same first two-digit SIC code as the bidder, I classify it as an unrelated takeover.
Panel A shows that both the successful and unsuccessful samples have the takeovers
concentrated in year 1997 to 1999, and both of them have the fewest observations in year 2001.
A comparison of the bidder size and the deal value shows that on average a successful bidder is
larger and aims at a larger target than an unsuccessful bidder. However, the relative size of the
target to the bidder is quite similar in both samples. The median bidder size and transaction value
of the successful sample are 226 and 86 million dollars respectively, which are significantly
greater than those of the unsuccessful sample. However, the relative size of the target to the
bidder is 0.31 for the successful sample, only marginally significantly different from 0.40 for the
unsuccessful sample.
Panel B and Panel E present the summary statistics of the sub-samples within the successful
samples and the unsuccessful samples. Panel B and Panel D show that overall the bidder of a
public takeover is larger and seeks to acquire a larger firm than the bidder of a private takeover,
and that the relative size of the target to the bidder is significantly larger for a public takeover. In
addition, Panel B shows that within the successful takeover sample, there are more private
2 My sample also includes takeovers of subsidiaries, I include them in the full sample, but I do not examine them separately in this essay when I examine and compare changes for bidders that make private and public takeovers.

12
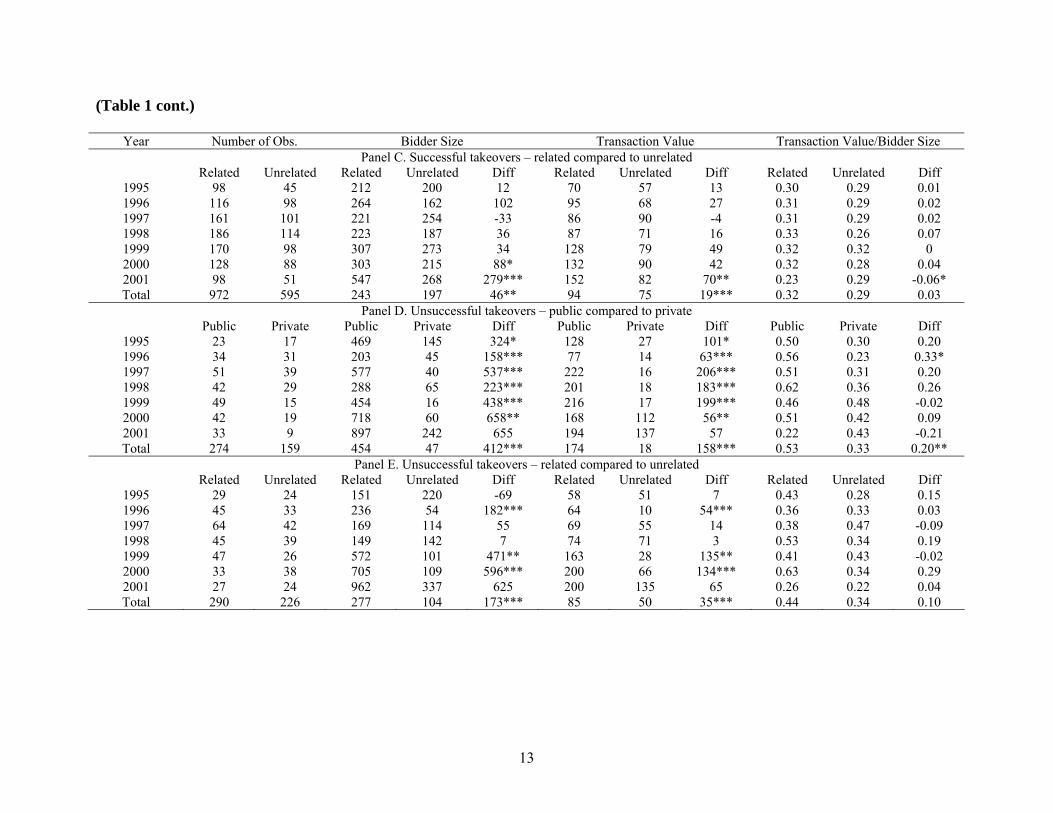
Table 1. Distribution Information and Summary Statistics
This table presents the distribution and summary statistics of the successful takeover sample and the unsuccessful takeover sample over the 1995 to 2001 period respectively. The bidder size is the bidder’s market value two weeks before the takeover announcement. The transaction value is the total value of consideration paid (or attempted to be paid) by a bidder, excluding fees and expenses. If the target is a publicly traded firm, I classify the takeover as a public takeover. If the target is a privately held firm, I classify the takeover as a private takeover. If the target has the same first two digit SIC code as the bidder, I classify the takeover as a related takeover. If the target does not have the same first two digit SIC code as the bidder, I classify the takeover as an unrelated takeover. Both the bidder size and transaction value are in millions of dollars. All the numbers reported are medians.
Year Number of Obs Bidder Size Transaction Value Transaction Value/Bidder Size Panel A. Full sample - Successful takeovers compared to unsuccessful takeovers
Success Unsuccess Success Unsuccess Diff Success Unsuccess Diff Success Unsuccess Diff 1995 143 53 207 157 50 64 54 10 0.29 0.34 -0.05 1996 214 78 177 94 83*** 74 31 43*** 0.30 0.34 -0.05 1997 262 106 239 151 88* 86 60 26* 0.30 0.40 -0.1 1998 300 84 208 144 64* 84 73 11 0.30 0.53 -0.23** 1999 268 73 300 404 -104 111 125 -14 0.32 0.41 -0.09 2000 216 71 280 388 -108 98 128 -30 0.31 0.45 -0.14 2001 149 51 421 764 -343** 107 194 -87 0.26 0.25 0.01 Total 1552 516 226 166 60*** 86 67 19*** 0.31 0.40 -0.09*
Panel B. Successful takeovers – public compared to private Public Private Public Private Diff Public Private Diff Public Private Diff
1995 43 57 507 99 408*** 215 34 181*** 0.32 0.27 0.05 1996 54 86 642 120 522*** 271 31 240*** 0.49 0.27 0.22*** 1997 75 98 660 132 528*** 366 34 332*** 0.57 0.19 0.38*** 1998 89 116 657 128 529*** 399 31 368*** 0.53 0.22 0.31*** 1999 78 110 860 132 728*** 458 36 422*** 0.52 0.24 0.28*** 2000 64 87 1015 128 887*** 580 45 535*** 0.38 0.24 0.14** 2001 43 54 1995 338 1657*** 554 63 491*** 0.35 0.17 0.18*** Total 446 608 736 126 610*** 345 35 310*** 0.48 0.23 0.25***
13
(Table 1 cont.)
Year Number of Obs. Bidder Size Transaction Value Transaction Value/Bidder Size Panel C. Successful takeovers – related compared to unrelated
Related Unrelated Related Unrelated Diff Related Unrelated Diff Related Unrelated Diff 1995 98 45 212 200 12 70 57 13 0.30 0.29 0.01 1996 116 98 264 162 102 95 68 27 0.31 0.29 0.02 1997 161 101 221 254 -33 86 90 -4 0.31 0.29 0.02 1998 186 114 223 187 36 87 71 16 0.33 0.26 0.07 1999 170 98 307 273 34 128 79 49 0.32 0.32 0 2000 128 88 303 215 88* 132 90 42 0.32 0.28 0.04 2001 98 51 547 268 279*** 152 82 70** 0.23 0.29 -0.06* Total 972 595 243 197 46** 94 75 19*** 0.32 0.29 0.03
Panel D. Unsuccessful takeovers – public compared to private Public Private Public Private Diff Public Private Diff Public Private Diff
1995 23 17 469 145 324* 128 27 101* 0.50 0.30 0.20 1996 34 31 203 45 158*** 77 14 63*** 0.56 0.23 0.33* 1997 51 39 577 40 537*** 222 16 206*** 0.51 0.31 0.20 1998 42 29 288 65 223*** 201 18 183*** 0.62 0.36 0.26 1999 49 15 454 16 438*** 216 17 199*** 0.46 0.48 -0.02 2000 42 19 718 60 658** 168 112 56** 0.51 0.42 0.09 2001 33 9 897 242 655 194 137 57 0.22 0.43 -0.21 Total 274 159 454 47 412*** 174 18 158*** 0.53 0.33 0.20**
Panel E. Unsuccessful takeovers – related compared to unrelated Related Unrelated Related Unrelated Diff Related Unrelated Diff Related Unrelated Diff
1995 29 24 151 220 -69 58 51 7 0.43 0.28 0.15 1996 45 33 236 54 182*** 64 10 54*** 0.36 0.33 0.03 1997 64 42 169 114 55 69 55 14 0.38 0.47 -0.09 1998 45 39 149 142 7 74 71 3 0.53 0.34 0.19 1999 47 26 572 101 471** 163 28 135** 0.41 0.43 -0.02 2000 33 38 705 109 596*** 200 66 134*** 0.63 0.34 0.29 2001 27 24 962 337 625 200 135 65 0.26 0.22 0.04 Total 290 226 277 104 173*** 85 50 35*** 0.44 0.34 0.10

14
takeovers than public takeovers. In the sample, there are 608 successful private takeovers but
only 446 successful public takeovers. However, within the unsuccessful sample, there are more
failed/withdrawn public takeovers than private takeovers. As Panel D demonstrates, in this
sample, there are 159 unsuccessful private takeovers and 274 unsuccessful public takeovers.
Panel C and Panel E show that though the bidder of a related takeover is larger and aims at
a larger target than the bidder of an unrelated takeover, the relative size of the target to the bidder
is similar in both samples.
2.4 Methods
2.4.1 Changes in the Rate of Information Arrival
Kyle (1985) and Ross (1989) argue that a higher return volatility suggests a higher
information arrival rate. Empirical evidence from tests of market efficiency lends support to this
argument. Patell and Wolfson (1984) find that return volatility increases following releases of
earnings/dividends news. Ederington and Lee (1993) find that return volatility increases at the
scheduled macroeconomic news on interest rates. A corporate acquisition or an acquisition
attempt changes the bidder’s information environment and firm characteristics, which could lead
to a change in its information arrival rate and influences the bidder’s liquidity. To compare the
information arrival rate for bidders before and after the acquisition, I follow the method
suggested by Huson and MacKinnon (2003). I estimate the following regressions with daily data,
and compare the standard deviation of its residuals for each bidder.
preit
premt
prei
prei
preit rr εβα ++=
postit
postmt
posti
posti
postit rr εβα ++=
where itr is the daily stock return for a bidder and mtr is the daily return for the CRSP
value-weighted index. The pre-takeover period runs from 300 to 50 days before the takeover

15
announcement date and the post-takeover period runs from 50 to 300 days after the takeover
effective/withdrawal date.
2.4.2 Microstructure Elements Analysis
I use several microstructure measures to measure liquidity and information asymmetry. In
particular, the liquidity measures include the absolute and relative time-weighted quoted spreads,
the time-weighted quoted depth, and the absolute and relative effective spreads. The information
asymmetry measures include the price impact and the probability of information-based trading
(PIN).
I focus the analysis on the transaction data of the exchange on which the firm is listed. As in
Huang and Stoll (1996 and 1997), I restrict to the trades that are coded as regular for analysis.
All prices and quotes must be positive, and ask price must be greater than bid price. Since NYSE
opens as a call market and continues as a continuous auction market for the rest of the day, for
NYSE-listed firms, I follow Lin, Sanger and Booth (1995) and exclude the first transaction on
each day if it is not preceded by a quote.
The liquidity measures I use include the absolute and relative quoted spread, the absolute
and relative effective spreads and depth. The absolute quoted spread (or the dollar spread) is the
difference between the ask and bid prices. The relative quoted spread is the dollar spread divided
by the quote midpoint. The quoted depth is the average of the ask and bid sizes for a quote. To
account for the different length of time over which each quote is valid, I calculate the time
weighted quoted spreads/depth as Hedge and McDermott (2003). The time-weighted quoted
spread (depth) is the spread (depth) weighted by the length of time each quote is valid.
I measure the effective spread as twice the absolute value of the difference between the
trade price and the prevailing quote midpoint. I calculate the relative effective spread as the

16
effective spread divided by the prevailing quote midpoint. Lee and Ready (1991) document that
quotes may be recorded 5 or 6 seconds ahead of the trades that triggered them and they suggest
using “a time-delayed quote” method to find the prevailing quote. However, Peterson and Sirri
(2003) find that the power of effective spread as a proxy for transaction cost improves if trades
are not lagged. Thus, I identify the prevailing quote without lagging the trades.
The information asymmetry measures I use include the price impact and the probability of
information based trading.
Huang and Stoll (1997) argue that large orders are usually broken up as they are executed
and they suggest collapsing a sequence of related trades to one order. I collapse the trades when I
examine the information asymmetry measures. If a sequence of trades is executed at the same
price on the same side of the market without any change in the quotes, I define this sequence as a
single trade.
First, I use price impact to measure the information asymmetry problem. Trades can move
prices when there is asymmetric information about the asset’s value. The higher the information
asymmetry the greater the price impacts of trades (Copeland and Galai 1983, Glosten and
Milgrom 1985, Jones and Lipson 1999). Researchers usually calculate the price impact of a trade
by comparing the prevailing quotes before a transaction to the quotes immediately after. Jones
and Lipson (1999) demonstrate that on average, it takes several transactions for the eventual
price impact to be incorporated into the quotes. Following Jones and Lipson (1999), I measure
the price impact by comparing the quote midpoint immediately prior to a trade to the quote
midpoint after 5 transactions. The price impact is calculated as the absolute value of the log of
the quoted midpoint ratio:
)(lnt
it
MPMP
absPI += , where i equals to 5.

17
Second, I use the probability of information-based trading (PIN) suggested by Easley,
Hvidkjaer and O’Hara (2002) to measure the information asymmetry problem. Microstructure
models can be viewed as a description of the game between the market maker and the traders.
Market makers watch the data and update their beliefs about the information-based trading (for
example, Kyle 1985). Market makers will widen the bid-ask spreads when they perceive more
information-based trading. Therefore, PIN provides a reasonable proxy for the information
asymmetry problem.
In Easley, Hvidkjaer and O’Hara (2002) model, at each trading day, there is a probability
α of information arrival. This information can be bad news with a probability of δ , and good
news with a probability of δ−1 . There are three kinds of traders in the market: uninformed
buyers, uninformed sellers and informed investors. Orders from uninformed buyers (sellers)
arrive at a rate of bε ( sε ) and orders from informed investors arrive at a rate of μ , and all of
them obey Poisson Distributions. Informed investors sell when there is bad news and buy when
there is good news. Following these assumptions, we can estimate α , μ , bε and sε by
maximizing the following likelihood function
!)(
!!!)1(),|( )(
Se
Be
Se
BeSBL
Ss
Bb
Ss
Bb sbsb
εμεαδ
εεαθ εμεεε +
+−= +−−−−
!!)(
)1( ))(
Se
Be
Ss
Bb sb
εεμδα εεμ −+− +
−+ ,
and then calculate PIN as,bs
PINεεαμ
αμ++
= .
When calculating PIN, I classify trades as buys or sells using Lea and Ready (1991) method.
If the trade price is higher (lower) than the prevailing quoted midpoint, I classify this trade as a
buy (sell). If the trade price is same as the prevailing quoted mid-point, I use the “tick test” to

18
classify this trade. If a trade’s price is higher (lower) than the previous trade, this trade is
classified as an uptick (downtick). If a trade’s price is the same as the previous trade, but the last
price change is an uptick (downtick), this trade is classified as a zero-uptick (zero-downtick). A
trade is a buy if it is an uptick or zero-uptick, otherwise it is a sell.
2.4.3 Information Production Hypothesis or Firm Characteristics Hypothesis
The information production hypothesis refers to the effect of the information produced
during the takeover process on bidders’ liquidity. It does not refer to the information produced
after the takeover process. In contrast, all changes after the takeovers, including changes in the
level of information produced for the bidders that result from the completed acquisition, are
classified as changes in firm characteristics or changes related to firm characteristics. The firm
characteristics hypothesis examines the liquidity effects of both the changes in firm
characteristics and the changes related to firm characteristics.
First, I examine the information production hypothesis - whether the information produced
during the takeover process drives the liquidity changes for the bidders. I use the number of news
stories as a proxy for information production and compare the number of news stories produced
during the takeover process between the successful and unsuccessful bidders. If information
production drives the change in liquidity, I expect bidders with more news stories to exhibit
greater changes in liquidity. Particularly, if private information is essentially the advance
knowledge of public information (Hasbrouck 1991), I expect to observe bidders with more news
stories to enjoy greater improvements in liquidity. I also use analysts’ coverage to measure
information produced during the takeover process. In particular, I examine changes in analysts’
coverage for the bidders during the takeover process and compare the differences between the
successful and unsuccessful takeovers.

19
Second, I examine and compare changes in analysts’ coverage between the successful and
unsuccessful bidders after the effective/withdrawal date of the takeovers. This test could shed
light on the firm characteristics hypothesis. Successful bidders have significant changes in firm
characteristics after the takeovers. These changes in firm characteristics (such as increase in firm
size) could influence the firm’s analysts’ coverage which then impacts the firm’s liquidity. In
contrast, unsuccessful bidders do not incur significant changes in firm characteristics, which
could lead to no significant changes in analysts following and no changes in liquidity.
To better distinguish between the information production hypothesis and firm
characteristics hypothesis, I examine and compare liquidity changes of a group of paired bidders.
These paired bidders compete to acquire the same target firm. One completes the takeover
successfully and the other withdraws its takeover attempt. Since these paired bidders compete for
the same target firm, they are likely to get the similar amount of public attention and press
coverage, and most likely they produce a similar amount of information during the takeover
process. However, because there is only one winner of the paired bidders, in the end only the
successful bidder incurs changes in firm characteristics. Given these characteristics, to compare
liquidity changes between these paired bidders could distinguish between the information
production hypotheses and firm characteristics hypothesis. That is, if the information produced
during the takeover process does not drive the liquidity changes, then only the successful bidders
of the paired bidders experience liquidity changes; otherwise, the unsuccessful bidders will also
incur liquidity changes.
I obtain 27 paired bidders that compete to acquire the same target firm and compare their
changes in liquidity-relative and absolute quoted spreads, quoted depth and relative and absolute

20
effective spreads. 26 of the 27 paired bidders compete to acquire the same public target and 1 of
the 27 paired bidders competes for the same private target.
2.5 Empirical Results
2.5.1 Changes in the Rate of Information Arrival
Table 2 presents the changes in the information arrival rate of bidders prior to and after the
announcement date and effective/withdrawal date of the takeovers.
Panel A of Table 2 presents the changes in the standard deviation of market model residuals
for the successful and unsuccessful samples. The median standard deviation of market model
residuals for the successful takeover group is 3.1 percent before the takeover and increases to 3.3
percent after the takeover. This 20 basis-point (bp) increase is significant at the 0.01 level. The
median standard deviation of market model residuals for the unsuccessful takeover group also
increases significantly from 3.8 percent to 4.2 percent.
Panel B to Panel E presents the changes in the standard deviation of market model residuals
for various sub-samples within the successful or unsuccessful sample. On average, each
sub-sample incurs a significant increase in the standard deviation of market model residuals after
the completion or withdrawal of the takeovers. For example, Panel C shows that the median
standard deviation of market model residuals increases 20 bps for both the related and unrelated
successful bidders and Panel E shows that it increases 30 bps for both the related and unrelated
unsuccessful bidders.
The increase in volatility suggests that more information (public or private) about the bidder
flows into the market, and the bidder’s stock price becomes more informative after the
acquisitions. Habib, Johnsen and Naik (1997) argue that a more informative price makes

21
Table 2. Changes in Standard Deviation of Market Model Residuals
This table reports the standard deviation of market model residual of the bidders. The market model applied is:
preit
premt
prei
prei
preit rr εβα ++=
postit
postmt
posti
posti
postit rr εβα ++=
where itr is the daily stock return for a bidder and mtr is the CRSP value-weighted index. I calculate the standard deviation of market model residual for each bidder prior to and after the announcement date and effective/withdrawal date of the takeover and report the medians of each group. I match each firm’s standard deviation of market model residual prior to and after the takeover and calculate its difference. The cell value I report in difference is the median of the paired difference in standard deviation of market model residual for each group.
Panel A. Full sample - Successful takeovers compared to unsuccessful takeovers Success Unsuccess Difference
Pre-announcement Days (-300,-50) 0.031 0.038 0.033 0.042 Post-takeover Days (50,300)
Difference 0.002*** 0.003*** -0.001* Panel B. Successful takeovers – public compared to private
Public Private Difference 0.029 0.036 0.031 0.037
Pre-announcement Days (-300,-50) Post-takeover Days (50,300)
Difference 0.002*** 0.002*** 0.000 Panel C. Successful takeovers – related compared to unrelated
Related Unrelated Difference 0.031 0.031 0.033 0.033
Pre-announcement Days (-300,-50) Post-takeover Days (50,300)
Difference 0.002*** 0.002*** 0.000 Panel D. Unsuccessful takeovers – public compared to private
Public Private Difference 0.032 0.047 0.038 0.054
Pre-announcement Days (-300,-50) Post-takeover Days (50,300)
Difference 0.004*** 0.003*** 0.001 Panel E. Unsuccessful takeovers – related compared to unrelated
Related Unrelated Difference 0.034 0.042 0.039 0.047
Pre-announcement Days (-300,-50) Post-takeover Days (50,300)
Difference 0.003*** 0.003*** 0.000 * significant at the 0.1 level; ** significant at the 0.05 level; *** significant at the 0.01 level

22
uninformed investors better off, attracts more uninformed investors and leads to a decrease in
transaction costs and price impact.
2.5.2 Microstructure Elements Analysis
2.5.2-1 Liquidity Changes for Successful Bidders and Unsuccessful Bidders
Table 3 reports and compares the changes in relative spreads, absolute spreads and depth for
successful and unsuccessful bidders. Panel A presents and compares changes in relative spreads,
which include time-weighted quoted relative spreads (quoted relative spreads) and relative
effective spreads. Panel B presents and compares changes in absolute spreads, which include
time-weighted quoted absolute spreads (quoted absolute spreads), absolute effective spreads and
time-weighted quoted depth (quoted depth). Since the data are highly skewed, I report medians
in Table 3. Particularly, the level reported (i.e. the number reported in each event window) is the
median value and the change reported (i.e. the number reported in change) is the median value of
pair-differences.
I focus the analysis on changes in relative spreads because they capture the economic
significance of spread to dealers and investors. In fact, absolute spreads do not have much
meaning if we do not consider the relevant price levels. Overall, the evidence in Table 3
indicates that liquidity measured as relative spreads improves for successful bidders, but stays
stable op decreases for unsuccessful bidders.
Panel A of Table 3 presents and compares changes in relative spreads, which include
relative quoted spread and relative effective spread, for successful and unsuccessful bidders. The
relative quoted spread for successful bidders is 1.354 percent before the takeover. It decreases
significantly to 1.258 percent and to 1.288 percent in the [+1, +2] and [+1, +4] intervals after the
takeover. This decrease persists over the subsequent eighty trading days. In the [+61, +80]

23
Table 3: Liquidity Changes for Successful and Unsuccessful Bidders
This table shows changes in liquidity for both the successful and unsuccessful bidders. Panel A shows the changes in the time-weighted relative quoted spreads and the relative effective spreads. Panel B shows the changes in the time-weighted absolute quoted spreads, the absolute effective spreads and the time-weighted quoted depth. The absolute quoted spread is the difference between the ask price and the bid price of a quote. The absolute effective spread is twice the absolute value of the difference between the trade price and the prevailing quote midpoint. The depth is the average of ask and bid size for a quote. The relative quoted spread is the absolute quoted spread divided by the quoted midpoint. The relative effective spread is the absolute effective spread divided by the prevailing quote midpoint. The time-weighted absolute quoted spread (relative quoted spread, depth) is the absolute quoted spread (relative quoted spread, depth) weighted by the length of time over which each quote is valid. The numbers reported are medians.
Panel A: Changes in Relative Spreads (%) Relative Quoted Spreads Relative Effective Spreads Success Unsuccess Difference Success Unsuccess Difference
Days (-80,-21) 1.354 1.533 1.012 1.240 Days (+1, +2) 1.258 1.672 0.906 0.900
Change -0.087*** 0.001** -0.088*** -0.063*** 0.008** -0.071***
Days (+1,+4) 1.288 1.611 0.904 0.891 Change -0.075*** 0.002*** -0.077*** -0.060*** 0.018*** -0.078***
Days (+1, +20) 1.280 1.764 0.922 0.920 Change -0.075*** 0.021*** -0.096*** -0.060*** 0.021*** -0.081***
Days(+21, +40) 1.265 1.707 0.918 0.937 Change -0.082*** 0.037*** 0.119*** -0.061*** 0.020*** -0.081***
Days(+41, +60) 1.287 1.730 0.912 0.912 Change -0.083*** 0.013*** -0.096*** -0.062*** 0.014*** -0.076***
Days(+61, +80) 1.228 1.652 0.908 0.856 Change -0.088*** -0.000 -0.088*** -0.067*** -0.000 -0.067***

24
(Table 3 cont.)
Panel B: Changes in Absolute Spreads and Depth Quoted Spreads Effective Spreads Depth Success Unsuccess Difference Success Unsuccess Difference Success Unsuccess Difference
Days (-80,-21) 0.213 0.179 0.074 0.062 22.5 23.0 Days (+1, +2) 0.202 0.150 0.070 0.055 20.9 25.6
Change -0.012*** -0.024*** -0.012*** -0.005*** -0.007*** 0.002*** -0.245*** 0.218** -0.463*** Days (+1,+4) 0.202 0.151 0.070 0.054 21.6 26.0
Change -0.016*** -0.023*** 0.007 -0.004*** -0.007*** 0.003*** -0.214*** 0.059** -0.155*** Days (+1, +20) 0.201 0.151 0.071 0.053 22.5 26.9
Change -0.009*** -0.020*** 0.011*** -0.003*** -0.006*** 0.003*** -0.010 0.571*** -0.581*** Days(+21, +40) 0.199 0.152 0.071 0.054 22.32 25.68
Change -0.012*** -0.030*** -0.018*** -0.004*** -0.007*** 0.003*** -0.198*** 0.713*** -0.911*** Days(+41, +60) 0.194 0.146 0.068 0.053 22.42 27.54
Change -0.016*** -0.027*** 0.011*** -0.005*** -0.008*** 0.003*** -0.181 0.149** -0.33*** Days(+61, +80) 0.193 0.147 0.068 0.051 22.19 26.33
Change -0.0186*** -0.030*** 0.011*** -0.006 -0.009*** 0.003*** -0.127** 0.347* -0.474*** *significant at the 0.1 level; ** significant at the 0.05 level; *** significant at the 0.01 level

25
interval, the relative quoted spread decreases to 1.228 percent. In contrast, the relative quoted
spread for unsuccessful bidders increases and then stays stable after the withdrawal of the
takeover. The relative quoted spread is 1.533 percent before the takeover. It changes significantly
to 1.672 percent in the [+1, +2] interval and to 1.611 percent in the [+1, +4] interval. In the first
and second 20 trading days after the takeover withdrawal, the relative quoted spread increases to
1.764 percent and 1.707 percent, and both changes are significant at the 0.01 level. However, in
the fourth 20 trading days’ interval, the relative quoted spread is not significantly different from
its pre-takeover counterpart. Furthermore, Column 4 of Panel A indicates that the increase in
liquidity measured as the relative quoted spread is greater for successful bidders than for
unsuccessful bidders at the 0.01 level for all intervals.
Panel A of Table 3 also shows that after the takeovers, the relative effective spread
decreases significantly for successful bidders but stays stable or increases significantly for
unsuccessful bidders. The relative effective spread of successful bidders decreases from 1.012
percent to 0.906 percent immediately after the takeover. This decrease persists in the 80 trading
days after the takeover, and in the [+61, +80] interval it decreases to 0.908 percent, significantly
smaller than its pre-takeover counterpart. In contrast, for unsuccessful bidders, the relative
effective spread does not decrease significantly after the takeover. Before the takeover, the
relative effective spread is 1.240 percent. In the first and second 20 trading days after the
takeover withdrawal, the relative effective spread increases 0.021 percent and 0.020 percent
respectively, and both changes are significant at the 0.01 level. In the fourth 20 trading days, it
returns to its pre-takeover level. Furthermore, Column 7 of Panel A indicates that the increase in
liquidity measured as the relative effective spread is greater for successful bidders than for
unsuccessful bidders at the 0.01 level for all intervals.

26
For completeness, I also examine changes in absolute spreads and depth. I report the results
in Panel B. As explained, because of the influence of size or price level, these measures do not
provide good estimates of changes in liquidity.
Liquidity improves for successful bidders after the takeovers. However, this finding could
be driven by the information generated during the takeover process, or the changes in firm
characteristics - the effect of bundling claims together or the increases in firm size. We cannot
distinguish between these two hypotheses based on an analysis of successful bidders only. Thus,
I also examine unsuccessful takeovers but find that liquidity does not improve for unsuccessful
bidders after they withdraw their offers. Both successful bidders and unsuccessful bidders
produce public information during the acquisition process, but unsuccessful bidders do not
bundle claims together or increase in firm size. Hence, this evidence suggests that information
generated during the takeover process does not have a persistent influence on the bidders’
liquidity. Liquidity improves for successful bidders because of changes in firm characteristics:
the effect of claim bundling or increase in firm size.
My sample includes the takeovers or the attempted takeovers announced between April 1,
1995 and Dec.31, 2001. During this period, NYSE reduced the minimum price variation (tick)
from an eighth to a sixteenth and later from a sixteenth to a penny. Specifically, on June 24, 1997,
the New York Stock Exchange (NYSE) reduced the tick size for quoting and trading stocks from
an eighth to a sixteenth, and beginning on January 29, 2001, the New York Stock Exchange
started quoting and trading all its listed issues in increments of a penny rather than in increments
of a sixteenth of a dollar. These reductions in the tick size could possibly drive my findings. To
examine this possibility, I exclude the takeovers or the attempted takeovers that announced

27
Table 4. Liquidity Changes for Successful and Unsuccessful Bidders after Excluding Takeovers Announced before June 24, 1997 (January 29, 2001) and Completed or Withdrawn after June 24, 1997 (January 29, 2001)
This table shows changes in liquidity for both the successful and unsuccessful bidders announced before June 24, 1997 (January 29, 2001) and completed or withdrawn after June 24, 1997 (January 29, 2001). It shows the changes in the time-weighted relative quoted spreads and the relative effective spreads. The absolute quoted spread is the difference between the ask price and the bid price of a quote. The absolute effective spread is twice the absolute value of the difference between the trade price and the prevailing quote midpoint. The depth is the average of ask and bid size for a quote. The relative quoted spread is the absolute quoted spread divided by the quoted midpoint. The relative effective spread is the absolute effective spread divided by the prevailing quote midpoint. The time-weighted absolute quoted spread (relative quoted spread, depth) is the absolute quoted spread (relative quoted spread, depth) weighted by the length of time over which each quote is valid. The numbers reported are medians.
Relative Quoted Spreads Relative Effective Spreads Successful Unsuccessful Difference Successful Unsuccessful Difference
Days (-80,-21) 1.361 1.514 1.01 1.194 Days (+1, +2) 1.267 1.682 0.910 1.226
Change -0.08*** 0.002*** -0.082*** -0.062*** 0.015*** -0.077***
Days (+1,+4) 1.300 1.607 0.927 1.227 Change -0.07*** 0.013*** -0.083*** -0.054*** 0.019*** -0.073***
Days (+1, +20) 1.288 1.765 0.926 1.250 Change -0.07*** 0.034*** -0.104*** -0.054*** 0.019*** -0.073***
Days(+21, +40) 1.287 1.693 0.940 1.271 Change -0.074*** 0.053*** -0.127*** -0.057*** 0.022*** -0.079***
Days(+41, +60) 1.307 1.745 0.943 1.235 Change -0.08*** 0.028*** -0.108*** -0.054*** 0.018*** -0.072***
Days(+61, +80) 1.259 1.653 0.929 1.221 Change -0.081*** 0.016** -0.097*** -0.061*** 0.008** -0.069***
* significant at the 0.1 level; ** significant at the 0.05 level; *** significant at the 0.01 level

28
Table 5. Liquidity Changes after Controlling for Index This table presents the changes in time-weighted quoted spreads, time-weighted relative quoted spreads and time-weighted depth of successful and unsuccessful takeovers before and after the takeover announcement date and effective/withdrawal date respectively, after controlling for the S&P 500 index. The pre-event window is from 80 to 21 days before the takeover announcement date. Numbers reported are the median paired differences from the pre-event level, after adjusting for the changes in the S&P 500 index
Relative Quoted Spreads Quoted Spreads Depth Changes Success Unsuccess Difference Success Unsuccess Difference Success Unsuccess Difference
Days (+1, +2) -0.082*** -0.006*** -0.076*** -0.016*** -0.031*** 0.015*** 2.89*** 11.20*** -8.31
Days (+1,+4) -0.081*** 0.003*** -0.084*** -0.015*** -0.031*** 0.016*** 6.09*** 17.65*** -11.56***
Days (+1, +20) -0.072*** 0.019*** -0.091*** -0.014*** -0.032*** 0.018*** 10.52*** 14.08*** -3.56
Days(+21, +40) -0.071*** 0.044*** -0.115*** -0.020*** -0.035*** 0.015*** 18.87 29.73 -10.86*
Days(+41, +60) -0.080*** 0.020** -0.100*** -0.023*** -0.040*** 0.017*** 20.16*** 29.45*** 9.29**
Days(+61, +80) -0.088*** -0.006*** -0.082*** -0.027*** -0.040*** 0.013*** 23.28*** 34.68*** 11.4* *significant at the 0.1 level; ** significant at 0.05 level; *** significant at the 0.01 level

29
before June 24, 1997 (January 29, 2001) and completed or withdrawn after June 24, 1997
(January 29, 2001). The results are statistically and qualitatively similar. Results are reported in
Table 4.
As an additional check against the systematic liquidity effects of tick-size change, I use
the S&P500 index fund as a proxy for market and examine the quoted liquidity changes (relative
quoted spread in particular) after controlling for the market liquidity. The results, presented in
Table 5, are statistically and qualitatively similar to the results in Table 3
Table 5 shows that the relative quoted spread decreases significantly for successful
bidders in all event windows after the takeover. For example, it decreases 0.082 percent in the
first two days after the takeover and decreases 0.088 percent for the 61 to 80 days after the
takeover. In contrast, the relative quoted spread does not show a consistent and significant
decrease for unsuccessful bidders. In the first two days after the takeover, the unsuccessful
bidders have a 0.006 percent decrease in its relative quoted spread. However, in the [+1, +20],
[+21, +40], and [+41, +60] intervals, the relative quoted spread increases 0.019 percent, 0.044
percent and 0.020 percent for unsuccessful bidders respectively. This evidence suggests that the
liquidity improvement for successful bidders is not driven by the changes in tick size.
2.5.2-2 Comparison of Liquidity Changes for Public and Private Acquisitions and Related and Unrelated Acquisitions
In this section, I compare liquidity changes between bidders that acquire public firms to
bidders that acquire private firms. I also compare liquidity changes between bidders that make
related acquisitions to those that make unrelated acquisitions. Because investors are likely to be
better informed about public firms than private firms, informed investors will lose more of their
information advantage when the bidder acquires a private firm than when the bidder acquires a
public firm. Hence, to compare the liquidity changes of bidders that acquire public and private

30
firms tests the bundling claims hypothesis. Furthermore, the volume of acquisitions involving
privately held companies has already reached a level that exceeds the takeover volume for
public-traded firms (Ang and Kohers, 2001), therefore, to include acquisitions of privately held
companies in the study provides a better understanding of how acquisitions influence bidders’
liquidity. Panel A of Table 6 presents and compares the liquidity changes for bidders that acquire
public and private firms.
Panel A of Table 6 shows that bidders that acquire private firms have similar improvements
in liquidity as bidders that acquire public firms. Consider the changes in quoted relative spreads
in the [+1, +20] interval for example. The quoted relative spread decreases 0.085 percent for
bidders that acquire public firms, which is not significantly different from the decrease of 0.083
percent for bidders that acquire private firms.
Panel B of Table 6 reports and compares the liquidity changes for bidders that make related
and unrelated takeovers. Bidders that make related and unrelated takeovers both enjoy liquidity
improvements, but there is no persistent and significant difference between these two
sub-samples. For example, in the [+21, +40] after the effective date of the takeover, the relative
effective spread decreases 0.084 and 0.075 percent for related and unrelated takeovers
respectively, but the difference between these decreases is not significantly different from zero.
However, this result could be driven by the method I use to define related and unrelated
acquisitions. Furthermore, investors are likely to be poorly (well) informed about all private
(public) firms, which reduces the power of this test.
In Table 6, I classify related and unrelated takeovers based on the first 2-digit SIC code of
the bidder and the target. This classification is based on the assumption that firms in similar
industries are related to each other. However, it is also possible that some firms, which are not in

31
Table 6. Liquidity Changes for Subsamples of Successful Bidders
This table shows the changes in liquidity for the subsamples of the successful bidders. Panel A shows and compares the liquidity changes for the successful bidders of the public and private takeovers. Panel B shows and compares the liquidity changes for the successful bidders of related and unrelated takeovers. The absolute quoted spread is the difference between the ask price and the bid price of a quote. The absolute effective spread is twice the absolute value of the difference between the trade price and the prevailing quote midpoint. The depth is the average of ask and bid size for a quote. The relative quoted spread is the absolute quoted spread divided by the quoted midpoint. The relative effective spread is the absolute effective spread divided by the prevailing quote midpoint. The time-weighted absolute quoted spread (relative quoted spread, depth) is the absolute quoted spread (relative quoted spread, depth) weighted by the length of time over which each quote is valid. The numbers reported are medians.
Panel A: Public compared to private takeovers Relative Quoted Spreads (%) Relative Effective Spreads (%) Public Private Difference Public Private Difference
Days (-80,-21) 0.815 1.924 0.570 1.444 Days (+1, +2) 0.668 1.712 0.470 1.258
Change -0.093*** -0.087*** -0.006 -0.046*** -0.078*** 0.032 Days (+1,+4) 0.666 1.724 0.479 1.271
Change -0.087*** -0.075 -0.012 -0.047*** -0.073*** 0.026 Days (+1, +20) 0.650 1.741 0.480 1.280
Change -0.085*** -0.083*** -0.002 -0.050*** -0.075*** 0.025 Days(+21, +40) 0.669 1.77 0.484 1.288
Change -0.074*** -0.086*** 0.012 -0.047*** -0.080*** 0.033 Days(+41, +60) 0.682 1.794 0.508 1.340
Change -0.084*** -0.092*** 0.008 -0.059*** -0.077*** 0.018 Days(+61, +80) 0.685 1.726 0.510 1.293
Change -0.082*** -0.082*** 0.000 -0.060*** -0.080*** 0.020

32
(Table 6 cont.)
Quoted Spreads Effective Spreads Depth Public Private Difference Public Private Difference Public Private Difference
Days (-80,-21) 0.188 0.240 0.062 0.087 32.33 20 Days (+1, +2) 0.165 0.231 0.056 0.085 33.23 20
Change -0.020*** -0.006* -0.014*** -0.006*** -0.004*** -0.002*** 0.833*** -0.740*** 1.573*** Days (+1,+4) 0.167 0.236 0.057 0.085 31.05 20
Change -0.022*** -0.005 -0.017*** -0.006*** -0.002** -0.004*** 0.099** -0.636*** 0.735*** Days (+1, +20) 0.169 0.228 0.057 0.084 33.19 20
Change -0.017*** -0.005** -0.012*** -0.004*** -0.002*** -0.002*** 0.793*** -0.189*** 0.982*** Days(+21, +40) 0.166 0.226 0.056 0.084 33.76 20
Change -0.019*** -0.007*** -0.012*** -0.006*** -0.004*** -0.002*** 0.358*** -0.404*** 0.762*** Days(+41, +60) 0.159 0.219 0.055 0.081 33.71 20
Change -0.025*** -0.012*** -0.013*** -0.008*** -0.005*** -0.003*** 0.115* -0.204** 0.319*** Days(+61, +80) 0.162 0.216 0.053 0.081 32.30 20
Change -0.027*** -0.013*** -0.014*** -0.009*** -0.006*** -0.003*** 0.071 -0.186 0.257*

33
(Table 6 cont.)
Panel B: Related compared to unrelated takeovers Relative Quoted Spreads (%) Relative Effective Spreads (%) Related Unrelated Difference Related Unrelated Difference
Days (-80,-21) 1.308 1.429 0.976 1.057 Days (+1, +2) 1.213 1.334 0.858 0.982
Change -0.092*** -0.073*** -0.019 -0.073*** -0.047*** -0.026** Days (+1,+4) 1.243 1.344 0.858 1.016
Change -0.087*** -0.063*** -0.024 -0.068*** -0.045*** -0.023** Days (+1, +20) 1.237 1.343 0.881 0.994
Change -0.089*** -0.064*** 0.025** -0.067*** -0.051*** -0.016** Days(+21, +40) 1.228 1.314 0.900 0.997
Change -0.084*** -0.075*** -0.009 -0.065*** -0.049*** -0.016 Days(+41, +60) 1.250 1.326 0.893 0.983
Change -0.084*** -0.080*** -0.004 -0.060*** -0.064*** 0.004 Days(+61, +80) 1.160 1.319 0.854 0.992
Change -0.092*** -0.080*** -0.012 -0.060*** -0.070*** 0.010 Quoted Spreads Effective Spreads Depth Related Unrelated Difference Related Unrelated Difference Related Unrelated Difference
Days (-80,-21) 0.215 0.212 0.076 0.074 22 23.39 Days (+1, +2) 0.202 0.202 0.069 0.070 20.30 21.52
Change -0.014*** -0.007*** -0.007** -0.006*** -0.003*** -0.003** -0.203*** -0.740*** 0.537 Days (+1,+4) 0.202 0.202 0.070 0.070 20.93 22.34
Change -0.013*** -0.009*** -0.004* -0.005*** -0.004*** -0.001** -0.157** -0.428*** 0.271 Days (+1, +20) 0.200 0.204 0.071 0.071 21.61 23.61
Change -0.011*** -0.005*** -0.006** -0.004*** -0.002*** -0.002*** 0 -0.117 0.117 Days(+21, +40) 0.198 0.202 0.071 0.069 22.26 22.52
Change -0.014*** -0.009*** -0.005** -0.005*** -0.003*** -0.002** -0.142 -0.393** 0.251 Days(+41, +60) 0.196 0.191 0.069 0.067 22.26 22.52
Change -0.018*** -0.014*** -0.004** -0.006*** -0.004*** -0.002** -0.142 -0.393** 0.251 Days(+61, +80) 0.193 0.196 0.068 0.067 22.17 22.89
Change -0.020*** -0.014** -0.006*** -0.007*** -0.005*** -0.002** -0.040 -0.530** 0.49* * significant at the 0.1 level; ** significant at the 0.05 level; *** significant at the 0.01 level

34
Table 7. Liquidity Changes between Related and Unrelated Takeovers This table presents and compares liquidity changes between related and unrelated successful public takeovers. If the correlation of stock returns between the bidder and the target is positive, I classify the takeover as a related takeover. If the correlation of stock returns between the bidder and the target is negative, I classify the takeover as an unrelated takeover. The stock returns I examine are from three hundred days to fifty days before the announcement day of the takeover. The numbers reported are the changes in each measure.
Changes in relative quoted spread
Changes in relative effective spread
mean median mean median Unrelated -0.247 -0.117 -0.187 -0.051 Related -0.107 -0.067 -0.102 -0.047
Difference -0.140 -0.050 -0.085 -0.004 (p-value) (0.477) (0.441) (0.576) (0.370)
* significant at the 0.1 level; ** significant at the 0.05 level; *** significant at the 0.01 level

35
the same/similar industry, could also be related to each other and such relatedness is reflected in
the movements of their stock prices’ responses to news/information. Therefore, I divide the
successful takeovers into related and unrelated based on the bidder’s stock return correlation
with the target’s return. I then compare liquidity changes between these two groups of bidders.
In Table 7, if the bidder’s stock return has a positive correlation with the target’s stock
return, the takeover is classified as related. If the bidder’s return and the target’s return are
negatively correlated, the takeover is classified as unrelated. Table 7 indicates that the changes in
liquidity between successful and unsuccessful bidders are not significantly different. This result
is similar if I classify takeovers as related or unrelated based on the magnitude rather than the
sign of the correlation. Overall, results in Table 7 strengthen the findings that related and
unrelated successful bidders have similar liquidity improvements after the takeovers.
2.5.2-3 Comparison of Liquidity Changes for Bidders that Use Different Methods of Payments
Methods of payments could influence liquidity changes of the bidders. On one hand, a
bidder that uses stock as a medium of exchange could enjoy more liquidity improvement than a
bidder that uses cash as a medium of exchange. Hansen (1987) argues that bidders prefer to use
stock as a medium of exchange when they are less certain of the target’s value3. Based on
Hansen, after a stock acquisition, the bidder’s informed investor will face a basket of securities
that consist of some security he has no information advantage. Compared to informed investors
of the bidder in a cash acquisition, informed investors of the bidder in a stock takeover will lose
more of their information advantage after the takeover. Therefore, bidders using stock as a
medium of exchange will enjoy greater liquidity improvements. Alternatively, Merton (1987)
argues that an increase in the investor base improves a firm’s liquidity. A bidder that uses stock 3 An alternative argument is that bidders choose to use stock in acquisitions because they perceive their stocks to be overvalued (Myers and Majluf, 1984)

36
as the medium of exchange will increase its investor base because some of the shareholders in
the acquired firm, who do not own shares in the bidder prior to the acquisition, will hold onto the
bidder’s shares afterward.
Alternatively, if the target has concentrated ownership before the acquisition, then using
stock as the medium of exchange could create a large, and most likely, informed owner of the
bidder after the acquisition. In this scenario, bidders that use stock as the medium of exchange
could have less improvement in liquidity than bidders that use cash as the medium of exchange.
To examine this issue, I obtain from the successful takeover sample a group of bidders that
use either cash or stock as the payment method and examine and compare their liquidity changes.
Panel A of Table 8 displays and compares changes in relative quoted spreads and relative
effective spreads for successful stock and cash takeovers. Bidders that use stock as the method of
payment display significantly and consistently greater improvements in liquidity than bidders
that use cash as the method of payment. For example, the relative quoted spread of bidders that
make stock takeovers decreases 0.130 percent in the [+1, +20] interval, significantly greater than
the decrease of 0.062 percent for the bidders that make cash takeovers.
Chang (1998) examines bidders’ returns at the takeover announcement when the bidder
makes a private acquisition. He finds that bidders experience a positive abnormal return when
they use stock in these private transactions, but have no abnormal return if they use cash. Chang
(1998) further argues that bidders that offer stock in a private transaction could create a new
informed investor. This new informed investor provides monitoring and hence reduces
information asymmetries4. In this essay, I examine and compare changes in liquidity for private
4 This is debatable. A new informed investor could increase or decrease information asymmetry. Chang argues that it will decrease information asymmetry.

37
Table 8. Liquidity Changes for Successful Takeovers Using Different Methods of Payments
This table shows the changes in liquidity for the subsamples of the successful bidders that use either stock or cash as a method of payment. Cash takeover refers to the takeover that uses only cash as the method of payment while stock takeover refers to the takeover that uses only stock as the method of payment. Panel A shows and compares the liquidity changes for the cash and stock takeovers of the full sample. Panel B shows and compares the liquidity changes for the cash and stock takeovers of the private takeover sample. The relative quoted spread is the absolute quoted spread divided by the quoted midpoint, while the absolute quoted spread is the difference between the ask price and the bid price of a quote. The relative effective spread is the absolute effective spread divided by the prevailing quote midpoint, while the absolute effective spread is twice the absolute value of the difference between the trade price and the prevailing quote midpoint.
Panel A: Full Sample-Cash compared to Stock Relative Quoted Spreads (%) Relative Effective Spreads (%) Cash Stock Difference Cash Stock Difference
Days (-80,-21) 1.317 1.168 0.957 0.938 Days (+1, +2) 1.280 0.907 0.874 0.714
Change -0.053*** -0.140*** 0.087*** -0.056*** -0.093*** 0.037*** Days (+1,+4) 1.340 0.897 0.895 0.726
Change -0.048*** -0.154*** 0.106*** -0.037*** -0.100*** 0.063*** Days (+1, +20) 1.325 0.952 0.917 0.732
Change -0.062*** -0.130*** 0.068*** -0.045*** -0.090*** 0.045*** Days(+21, +40) 1.272 0.922 0.915 0.715
Change -0.064*** -0.129*** 0.065*** -0.041*** -0.102*** 0.061*** Days(+41, +60) 1.330 0.899 0.919 0.721
Change -0.061*** -0.107*** 0.046*** -0.041*** -0.096*** 0.055*** Days(+61, +80) 1.269 0.941 0.928 0.728
Change -0.071*** -0.126*** 0.055*** -0.049*** -0.101*** 0.052***

38
(Table 8 cont.)
Panel B: Private Takeover Sample -Cash compared to Stock Cash Stock Difference Cash Stock Difference
Days (-80,-21) 1.825 1.642 1.343 1.319 Days (+1, +2) 1.722 1.376 1.166 1.118
Change -0.063 -0.214*** 0.151*** -0.054 -0.191*** 0.137*** Days (+1,+4) 1.700 1.417 1.271 1.130
Change -0.057 -0.278*** 0.221*** -0.036 -0.182*** 0.146*** Days (+1, +20) 1.726 1.364 1.223 1.094
Change -0.065** -0.200*** 0.135*** -0.047* -0.165*** 0.118*** Days(+21, +40) 1.738 1.260 1.210 1.022
Change -0.058 -0.159*** 0.101*** -0.033 -0.183*** 0.150*** Days(+41, +60) 1.830 1.447 1.340 1.105
Change -0.065* -0.180*** 0.115*** -0.038* -0.151*** 0.113** Days(+61, +80) 1.666 1.584 1.222 1.139
Change -0.064** -0.186*** 0.122*** -0.058** -0.187*** 0.129** * significant at the 0.1 level; ** significant at the 0.05 level; *** significant at the 0.01 level

39
takeovers that use different methods of payments. Panel B of Table 8 shows the result. Panel B
shows that bidders that make private stock takeover have significantly more improvements in
liquidity than bidders that make private cash takeovers. For example, bidders that make private
stock takeovers have a 0.186 percent decrease in relative quoted spread in the [61, 80] interval,
while bidders that make private cash takeovers only have 0.064 percent decrease.
Merton (1987) argues that the investor base of a firm influences the firm’s liquidity. It is
reasonable to argue that a private stock takeover enlarges the bidder’s investor base to a greater
extent than a private cash takeover. Since the investor base improves a firm’s liquidity, a bidder
that makes a private stock takeover will enjoy more improvements in liquidity than a bidder that
makes a private cash takeover. The evidence documented in Panel B of Table 8 supports
Merton’s (1987) argument.
2.5.2-4 Comparison of Liquidity Changes for Public and Private, Related and Unrelated Unsuccessful Bidders
Panel A of Table 9 shows and compares liquidity changes for unsuccessful bidders that
make public and private takeover attempts. Panel B shows and compares liquidity changes for
unsuccessful bidders that make related and unrelated takeover attempts. In each subsample, the
bidders’ liquidity gets worse and then stays stable after their takeover attempts fail. Furthermore,
Table 9 does not show any persistent and significant difference between the liquidity changes of
paired sub-samples. This result implies that the information generated during the takeover
process does not have a significant influence on unsuccessful bidders, related or unrelated,
private or public. It also implies that the combination, increase in firm size and other changes in
firm characteristics are important.
Take the unsuccessful bidders that make private takeover attempts for example. Panel A of
Table 9 shows that for the first 40 days after they withdrawn their takeover attempts, this group

40
Table 9. Liquidity Changes for Subsamples of Unsuccessful Bidders
This table shows the changes in liquidity for the subsamples of the unsuccessful bidders. Panel A shows and compares the liquidity changes for the unsuccessful bidders of the public and private takeovers. Panel B shows and compares the liquidity changes for the unsuccessful bidders of related and unrelated takeovers. The absolute quoted spread is the difference between the ask price and the bid price of a quote. The absolute effective spread is twice the absolute value of the difference between the trade price and the prevailing quote midpoint. The depth is the average of ask and bid size for a quote. The relative quoted spread is the absolute quoted spread divided by the quoted midpoint. The relative effective spread is the absolute effective spread divided by the prevailing quote midpoint. The time-weighted absolute quoted spread (relative quoted spread, depth) is the absolute quoted spread (relative quoted spread, depth) weighted by the length of time over which each quote is valid. The numbers reported are medians.
Panel A: Public compared to private takeovers Relative Quoted Spreads (%) Relative Effective Spreads (%) Public Private Difference Public Private Difference
Days (-80,-21) 0.997 3.270 1.125 1.194 Days (+1, +2) 0.939 3.758 1.196 1.100
Change -0.037 0.204*** -0.241*** 0.026* -0.004 0.030 Days (+1,+4) 0.976 3.920 1.166 1.148
Change -0.026 0.215*** -0.241** 0.022 -0.003 0.025 Days (+1, +20) 1.064 3.856 1.171 1.220
Change -0.016 0.241*** -0.257*** 0.051** -0.011* 0.062 Days(+21, +40) 1.074 3.505 1.274 1.169
Change 0.006 0.002*** 0.004* 0.032** 0.010** 0.022 Days(+41, +60) 1.009 3.829 1.167 1.145
Change -0.004 0.159 -0.163 0.019* -0.003 0.022 Days(+61, +80) 1.026 3.812 1.222 1.074
Change -0.004 0.122 0.126 0.005 -0.020 0.025

41
(Table 9 cont.)
Quoted Spreads Effective Spreads Depth Public Private Difference Public Private Difference Public Private Difference
Days (-80,-21) 0.174 0.201 0.061 0.063 28.10 19.90 Days (+1, +2) 0.144 0.162 0.056 0.056 33.72 20
Change -0.018*** -0.028*** -0.010 -0.009*** -0.011*** 0.002 0.634** 0.096* 0.538 Days (+1,+4) 0.147 0.168 0.052 0.056 35.65 20
Change -0.020*** -0.027*** 0.007 -0.008*** -0.009*** 0.001 0.145** 0.014 0.131 Days (+1, +20) 0.148 0.158 0.055 0.053 33.61 20
Change -0.017*** -0.025*** 0.008 -0.008*** -0.008*** 0.000 0.930** 0.522*** 0.408 Days(+21, +40) 0.148 0.167 0.055 0.056 33.20 20
Change -0.020*** -0.032*** 0.012 -0.012*** -0.009*** -0.003 1.297 0.391*** 0.906 Days(+41, +60) 0.143 0.165 0.056 0.056 32.85 20.59
Change -0.024*** -0.028*** 0.004 -0.012*** -0.010*** -0.002 0.144 0.688** -0.544 Days(+61, +80) 0.137 0.169 0.054 0.053 33.16 20
Change -0.025*** -0.036*** 0.011 -0.012*** -0.011 -0.001 0.316 0.536** -0.22
Panel B: Related compared to unrelated takeovers Relative Quoted Spreads (%) Relative Effective Spreads (%) Related Unrelated Difference Related Unrelated Difference
Days (-80,-21) 1.346 2.014 1.156 1.369 Days (+1, +2) 1.292 2.285 1.227 1.113
Change -0.029 0.053*** -0.082** 0.030*** -0.028 0.058*** Days (+1,+4) 1.308 2.309 1.240 1.206
Change -0.003 0.041*** -0.044 0.033*** -0.021 0.054** Days (+1, +20) 1.453 2.211 1.238 1.355
Change 0.019*** 0.044*** -0.025 0.035*** -0.009 0.044 Days(+21, +40) 1.400 2.241 1.274 1.271
Change 0.037*** 0.052*** -0.015 0.034*** -0.023 0.057** Days(+41, +60) 1.315 2.038 1.146 1.394
Change 0.015* 0.012 0.003 0.027*** -0.021 0.048 Days(+61, +80) 1.398 2.217 1.133 1.407
Change 0.018* -0.056 0.074 0.017* -0.032 0.049

42
(Table 9 cont.)
Quoted Spreads Effective Spreads Depth Related Unrelated Difference Related Unrelated Difference Related Unrelated Difference
Days (-80,-21) 0.183 0.175 0.063 0.060 23.33 22.25 Days (+1, +2) 0.149 0.151 0.059 0.052 25.91 24.37
Change -0.027*** -0.020*** -0.007 -0.007*** -0.011*** 0.004** 0.159** 0.304 -0.145 Days (+1,+4) 0.149 0.154 0.057 0.054 26.18 25.46
Change -0.027*** -0.018*** -0.009 -0.007*** -0.009*** 0.002 0.046* 0.202* -0.156 Days (+1, +20) 0.150 0.155 0.055 0.053 26.02 28.05
Change -0.022*** -0.017*** -0.005 -0.007*** -0.007*** 0.000 0.161** 0.926** -0.765 Days(+21, +40) 0.151 0.155 0.056 0.055 26.66 24.94
Change -0.026*** -0.021*** -0.005 -0.007*** -0.010*** 0.003 0.556** 1.124** -0.568 Days(+41, +60) 0.147 0.145 0.056 0.054 28.17 25.97
Change -0.031*** -0.021*** -0.010 -0.008*** -0.011*** 0.003 0.095* 0.816 -0.721 Days(+61, +80) 0.150 0.144 0.054 0.052 26.00 27.31
Change -0.033*** -0.026*** -0.007 -0.010*** -0.012*** 0.002 0.114 0.905* -0.791 * significant at the 0.1 level; ** significant at the 0.05 level; *** significant at the 0.01 level

43
of bidders have significant increases in relative quoted spreads. For the 41 to 80 days after they
withdraw their takeovers, the relative quoted spread does not have significant differences from
its pre-takeover level.
2.5.3 Information Asymmetry Changes
Thus far, my results show that liquidity measured as the quoted relative spread and the
relative effective spread improves for successful bidders but stays stable/decreases for
unsuccessful bidders. In this section I analyze the changes in information asymmetry for
successful and unsuccessful bidders. The analyses focus on the changes in the price impact and
changes in the probability of information based trading of the bidders.
2.5.3-1 Price Impact
Panel A of Table 10 displays and compares the changes in price impact for the successful
and unsuccessful bidders. For successful bidders, the 5-quote measure of price impact is 58bp
before the takeover, and it decreases significantly to 48bp (49bp) in the first two (four) days after
the takeover. The decrease in price impact for successful bidders persists. Their 5-quote measure
price impact is 53.8bp, 53.1bp and 54bp in the first, second and third 20-day period after the
takeovers, all of which are significantly smaller than their pre-takeover counterparts. In the [+61,
+80] interval, the 5-quote measure price impact is 53bp, which is still significantly smaller than
its pre-takeover level. For unsuccessful bidders, however, the 5-quote measure of price impact
stays stable or even increases significantly after their takeover attempt fails. In summary, Panel
A of Table 10 shows that the price impact decreases for successful bidders, but increases/stays
stable for unsuccessful bidders and their differences in changes are significantly different from
each other.

44
Table 10. Changes in Price Impact around the Takeovers
This table examines and compares changes in price impacts of the bidders around the takeovers. It focuses on the transaction data of the exchange on which the firm is listed. Price impact is measured by comparing the quoted midpoint immediately prior to a trade to the quoted midpoint after 5 transactions. The value reported is the median of the means in each group.
Panel A. Full sample - Successful takeovers compared to unsuccessful takeovers Success Unsuccess Difference
Days (-80,-21) 0.0058 0.0054 Days (+1, +2) 0.0048 0.0051
Change -0.00038*** 0.00001** -0.00039*** Days (+1,+4) 0.0049 0.0056
Change -0.00038*** 0.000042*** -0.00042*** Days (+1, +20) 0.00538 0.0061
Change -0.0003*** 0.0001*** -0.0004*** Days(+21, +40) 0.00531 0.0063
Change -0.0003*** 0.00006*** -0.00036*** Days(+41, +60) 0.0054 0.0063
Change -0.0003*** 0.00014*** -0.00044*** Days(+61, +80) 0.0053 0.0062
Change -0.0004*** 0.00014 -0.00054*** Panel B. Successful takeovers – public compared to private
Public Private Difference Days (-80,-21) 0.0037 0.0069 Days (+1, +2) 0.0030 0.0059
Change -0.00036*** -0.00049*** 0.00013*** Days (+1,+4) 0.0031 0.0065
Change -0.00038*** -0.00049*** 0.00011*** Days (+1, +20) 0.0032 0.0065
Change -0.00037*** -0.00032*** -0.00005*** Days(+21, +40) 0.0032 0.0068
Change -0.00035*** -0.00032*** -0.00003*** Days(+41, +60) 0.0030 0.0067
Change -0.00041*** -0.00032 -0.00009*** Days(+61, +80) 0.0032 0.0068
Change -0.00044*** -0.00029* -0.00015***

45
(Table 10 cont.)
Panel C. Successful takeovers – related compared to unrelated Related Unrelated Difference
Days (-80,-21) 0.00513 0.0059 Days (+1, +2) 0.00446 0.0052
Change -0.00038*** -0.00035*** -0.00003*** Days (+1,+4) 0.0047 0.0054
Change -0.00036*** -0.00042*** 0.00006*** Days (+1, +20) 0.0050 0.0060
Change -0.00034*** -0.00033** -0.00001*** Days(+21, +40) 0.0050 0.0061
Change -0.00032*** -0.00027*** -0.00005*** Days(+41, +60) 0.0051 0.0059
Change -0.00030*** -0.00041*** 0.00011*** Days(+61, +80) 0.0051 0.0057
Change -0.00033*** -0.00036*** 0.00003*** Panel D. Unsuccessful takeovers – public compared to private
Public Private Difference Days (-80,-21) 0.0048 0.0054 Days (+1, +2) 0.0049 0.0048
Change 0.00006* -0.00001 0.00007*** Days (+1,+4) 0.0049 0.0054
Change -0.00001 0.0001* -0.00011*** Days (+1, +20) 0.0047 0.0061
Change 0.00021 0.0001*** 0.00011*** Days(+21, +40) 0.0054 0.0062
Change 0.0002** 0.00004* 0.00016*** Days(+41, +60) 0.0051 0.0060
Change 0.00019 0.00011* 0.00008*** Days(+61, +80) 0.0049 0.0060
Change 0.0002 0.0001** 0.0001*** Panel E. Unsuccessful takeovers – related compared to unrelated
Related Unrelated Difference Days (-80,-21) 0.0054 0.0050 Days (+1, +2) 0.0051 0.0051
Change 0.000064*** -0.00006 0.000124*** Days (+1,+4) 0.0054 0.0059
Change 0.00009*** -0.00003 0.00012*** Days (+1, +20) 0.0058 0.0068
Change 0.000027*** 0.0001** -0.000073*** Days(+21, +40) 0.0060 0.0066
Change 0.0002*** -0.00013 0.00033*** Days(+41, +60) 0.0059 0.0065
Change 0.0002*** -0.00004 0.00024*** Days(+61, +80) 0.0062 0.0062
Change 0.00014** 0.00011** 0.00003*** * significant at the 0.1 level; ** significant at the 0.05 level; *** significant at the 0.01 level

46
Panel B of Table 10 displays and compares changes in price impact between successful
bidders that make public and private acquisitions. Panel C displays and compares changes in
price impact between successful bidders that make related and unrelated acquisitions. All the
sub-samples enjoy persistent decreases in price impacts. This suggests that all subsamples of the
successful bidders have lower information asymmetry after the takeovers. In addition, I also find
that successful bidders that acquire a public target have significantly greater reductions in the
price impact than successful bidders that acquire a private target. For example, Panel B of Table
10 shows that in the first 20 trading days after the takeover, the price impact decreases 3.7bp and
3.2bp for the bidder of a public firm and of a private firm respectively, and the decreases are
significantly different from each other at the 0.01 level. However, from Panel C we cannot
observe a persistent and significant difference in the changes of price impacts between related
and unrelated takeovers. In addition, I classify the takeovers as related and unrelated based on
the stock return correlation between the bidder and the target and examine and compare their
changes in price impacts. Consistent with Panel C, I do not find significant differences between
related and unrelated successful bidders either.
Panel D displays and compares changes in price impact between unsuccessful bidders that
make public and private acquisition attempts. Panel E displays and compares changes in price
impact between unsuccessful bidders that make related and unrelated acquisition attempts. These
sub-samples either have no significant change or have significant increases in price impact,
which implies that their information asymmetry stays stable or increases after they withdraw
their takeover attempts. In the second 20 trading days after the takeover withdrawal, the price
impact increases significantly from 48bp to 54bp for the unsuccessful bidder of a public target
firm, and from 54bp to 61bp for the unsuccessful bidder of a private target firm. In addition,

47
Panel E also shows that the information asymmetry for the unsuccessful bidders of related and
unrelated takeovers stays stable or increases after the takeover attempts fail.
2.5.3-2 Probability of Information-Based Trading
Panel A of Table 11 displays and compares changes in PIN for the successful and
unsuccessful bidders. The PIN for successful bidder decreases significantly from 22.26 percent
to 21.62 percent after the takeover, but increases insignificantly from 21.02 percent to 21.13
percent for unsuccessful bidders. The difference in change between these two groups is
significantly different at the 0.01 level.
Panel B to Panel E display and compare changes in PIN between various sub-samples. On
average, they display the same pattern as the full samples. That is, each sub-sample of successful
bidders displays a significant decrease in PIN and each sub-sample of unsuccessful bidders
shows no significant changes in PIN. Similar to the changes in price impact, successful bidders
that acquire a public target experience a significantly larger decrease in PIN than successful
bidders that acquire a private target.
In sum, evidences from Table 10 and Table 11 indicate that the information asymmetry
measured as the price impact and the PIN decreases for successful bidders, but (depending on the
window of analysis) remains the same or even increases for unsuccessful bidders. This suggests
that the adverse selection problem associated with the market maker trading against an informed
trader decreases significantly for the successful bidders, but not for the unsuccessful bidders.
Similar to their successful counterparts, unsuccessful bidders also produce information during
the takeover process, but they do no experience changes in firm characteristics, such as bundling
claims or increasing in firm size. The finding that the information asymmetry problem only

48
Table 11. Changes in Probability of Information-Based Trading around the Takeovers
This table examines and compares changes in probability of information-based trading of the bidders around the takeovers. Probability of information-based trading is calculated based on Easley, Hvidkjaer and O’Hara (2002)’s structural model. In the model, at each trading day, there is a probability α of information arrival. This information can be bad news with a probability ofδ , and good news with a probability of δ−1 . There are three kinds of traders in the market: uninformed buyers, uninformed sellers and informed investors. Orders from uninformed buyers (sellers) arrive at a rate of bε ( sε ) and orders from informed investors arrive at a rate ofμ , and all of them obey Poisson Distributions. Informed investors sell when there is bad news and buy when there is good news. Allα ,μ , bε and sε are estimated via maximizing likelihood function derived from the structural model.
!)(
!!!)1(),|( )(
Se
Be
Se
BeSBL
Ss
Bb
Ss
Bb sbsb
εμεαδ
εεαθ εμεεε +
+−= +−−−−
!!
)()1( ))(
Se
Be
Ss
Bb sb
εεμδα εεμ −+− +
−+
Based on these estimates, PIN (probability of informed trading) is calculated as,bs
PINεεαμ
αμ++
= .
The value reported in the parentheses is p-value.
Panel A. Full sample - Successful takeovers compared to unsuccessful takeovers Success Unsuccess Difference
Pre-announcement Days (-80,-1) 22.26 21.02 Post-takeover Days (1,80) 21.62 21.13
Change -0.85*** 0.45 -1.3***
Panel B. Successful takeovers – public compared to private Public Private Difference
Pre-announcement Days (-80,-1) 19.66 23.18 Post-takeover Days (1,80) 17.17 23.99
Change -0.013*** -0.0084 -0.0046*** Panel C. Successful takeovers – related (1) compared to unrelated (2)
Related Unrelated Difference Pre-announcement Days (-80,-1) 22.38 22.00
Post-takeover Days (1,80) 21.59 21.71 Difference -0.0098*** -0.0058 -0.004***
Panel D. Unsuccessful takeovers – public (1) compared to private (2) Public Private Difference
Pre-announcement Days (-80,-1) 19.79 22.17 Post-takeover Days (1,80) 19.12 24.45
Difference -0.11 1.20*** 1.31*** Panel E. Unsuccessful takeovers – related (1) compared to unrelated (2)
Related Unrelated Difference Pre-announcement Days (-80,-1) 21.29 20.74
Post-takeover Days (1,80) 20.31 21.35 Difference 0.283 0.603* -0.32***
* significant at the 0.1 level; ** significant at the 0.05 level; *** significant at the 0.01 level

49
decreases for successful bidders supports the firm characteristics hypothesis but does not support
the information production hypothesis.
2.5.4 Tests of Information Production Hypothesis and Firm Characteristics Hypothesis
Table 12 provides the summary statistics of the number of news stories of the successful and
unsuccessful bidders. The number of news stories produced during the takeover process is used
to measure the information produced during the takeover process.
Successful bidders have an average of 23 news stories produced during the takeover process,
and unsuccessful bidders have an average of 46 news stories. The number of news stories
produced for unsuccessful bidders is significantly greater than the number of news stories
produced for successful bidders during the takeover process. Actually, the unsuccessful bidders
have almost twice the number of news stories produced as the successful bidders. Table 12 also
shows that the unsuccessful bidders have a median of 10 news stories produced during the
takeover process, significantly greater than the median of 6 news stories produced for the
successful bidders. The number of news stories is a proxy for the level of public information
produced during the takeover process. Therefore, results shown in Table 11 suggest that during
the takeover process, the unsuccessful bidders have more public information produced than the
successful bidders.
Table 13 examines and compares changes in the number of analysts’ following, analysts’
forecast accuracy and dispersion of analysts’ forecasts between the successful and unsuccessful
bidders around the takeovers. Panel A of Table 13 examines and compares these changes
between “before the takeover” and “during the takeover process” (from the first announcement
date to the effective/withdrawal date of the takeover).

50
Table 12. Summary Statistics of the Number of News Produced during the Takeover Process
This table examines and compares the number of news during the takeover process between successful and unsuccessful takeovers. The takeover process is defined as the time between the announcement date and effective/withdrawal date of the takeovers. The number of news is defined as the number of news found on the News Wires from the Lexis/Nexis database.
Success Unsuccess Diff Mean 23 46 -23***
Median 6 10 -4*** Max 3114 2431 / Min 0 0 /
Standard Deviation 100 161 / *significant at the 0.1 level; ** significant at the 0.05 level; *** significant at the 0.01 level Table 13. Changes in Analysts’ Following, Forecast Accuracy and Dispersion of Forecasts
This table examines and compares changes in the number of analysts’ following, analysts’ forecast accuracy, and dispersion of analysts’ forecasts, between the successful and unsuccessful bidders around the takeovers. Panel A compares these changes between “before the takeover” and “during the takeover process” (from the first announcement date to the effective/withdrawal date of the takeover”. Panel B compares these changes between “before the takeover” and “after the effective/withdrawal date of the takeover”. Analysts’ coverage is defined as the number of analysts that provide the fiscal year 1 estimate each month. Forecast accuracy is defined as the deviation of fiscal year 1 earnings estimates from the real values divided by the real values. Dispersion of analysts’ forecast is defined as the standard deviation of the fiscal year 1 earnings estimate divided by the mean estimate.
Panel A. Changes during the takeover process Success Unsuccess Before During Change Before During Change
Diff in change
Analysts’ Coverage 7.19 7.28 0.09 7.77 7.96 0.19* -0.10 Forecast Accuracy 0.014 0.032 -0.0003 0.047 0.119 -0.00012 -0.00018
Dispersion of Forecasts 0.125 0.129 0.0039 0.191 0.180 -0.011 0.015 Panel B. Changes after the takeover
Success Unsuccess Before After Change Before After Change
Diff in change
Analysts’ Coverage 6.54 6.91 0.37*** 7.67 7.58 -0.09 0.46*** Forecast Accuracy 0.0184 0.024 0.0005*** 0.048 0.066 0.0002 0.0003
Dispersion of Forecasts 0.052 0.031 -0.021 0.075 0.053 -0.022 0.001** * significant at the 0.1 level; ** significant at the 0.05 level; *** significant at the 0.01 level

51
Panel A of Table 13 shows that the successful bidders have similar number of analysts’
following during the takeover process compared to their pre-takeover level, but the unsuccessful
bidders have significantly more analysts’ following during the takeover process. Since the
number of analysts’ following is a proxy for the level of public information produced, an
increase in the number of analysts’ following for the unsuccessful bidders suggests that they
have more public information produced during the takeover process.
The information production hypothesis suggests that the public information produced during
the takeover process is a driving factor of liquidity improvements for bidders. If this information
production hypothesis holds, given that the unsuccessful bidders have more public information
produced during the takeover process than the successful bidders, it is reasonable to expect the
unsuccessful bidders to exhibit some improvements in liquidity. However, the evidence from my
analysis above indicates that the unsuccessful bidders do not have improvements in liquidity at
all. Therefore, my results do not support the information production hypothesis.
Panel B of Table 13 compares changes in analysts’ following between “before the takeover”
to “after the effective/withdrawal date of the takeover”. As I discuss above, I classify changes in
the analyst coverage after successful acquisitions as changes related to firm characteristics since
the change in coverage occurs after the completed acquisition. To examine the relationship
between these changes with changes in liquidity sheds light on the firm characteristics
hypothesis. Panel B shows that the successful bidders have significant more analysts’ following
after they complete their takeovers, while the unsuccessful bidders do not have significant
increases in analysts’ following. Extant literature suggests that more analysts’ following of a firm
produces more public information for the firm and makes the firm more liquid. Therefore, it is
reasonable to expect successful bidders to enjoy liquidity improvements after the takeovers while

52
unsuccessful bidders not, which is exactly what I find. Therefore, evidences produced in Panel B
of Table 13 lend support to the firm characteristics hypothesis.
Table 14 compares liquidity changes of paired bidders that compete to acquire the same
target firm. Panel A compares the changes in relative quoted spreads and relative effective
spreads. Panel B compares the changes in absolute quoted spreads and depth. As I have
discussed in detail in the methods part, these paired bidders are likely to produce a similar
amount of information during the takeover process, but in the end only the successful bidder
incurs changes in firm characteristics. To compare liquidity changes between them could
distinguish between the information production hypotheses and firm characteristics hypothesis.
That is, if the information produced during the takeover process does not drive the liquidity
changes, then only the successful bidders of the paired bidders experience liquidity changes;
otherwise, the unsuccessful bidders will also incur liquidity changes.
Panel A of Table 14 shows that both the successful and unsuccessful bidders of the paired
sample have decreases in the relative quoted and effective spreads and there is no significant
difference between these two groups. This result appears inconsistent with the results shown in
the previous tables. However, given that there are only 27 paired sample in this test, the results
may not be as strong as the results shown in the whole sample.
2.5.5 Other Tests
To examine whether different market structures influence liquidity changes of bidders, I
compare liquidity changes of bidders that list in different exchanges.
Panel A of Table 15 examines liquidity changes of successful bidders that list in different
exchanges. It shows that successful bidders that list in NYSE and NASDAQ have significant
improvements in liquidity after the takeovers. However, successful bidders that list in AMEX do

53
Table 14. Liquidity Changes for Multiple Bidders
This table examines and compares the liquidity changes of a group of paired bidders. These paired bidders compete to acquire the same target firm, while in the end one completes the takeover successfully and the other withdraws its takeover attempt. Panel A shows the changes in the time-weighted relative quoted spreads and the relative effective spreads. Panel B shows the changes in the time-weighted quoted absolute spreads, the absolute effective spreads and the time-weighted depth. The absolute quoted spread is the difference between the ask price and the bid price of a quote. The absolute effective spread is twice the absolute value of the difference between the trade price and the prevailing quote midpoint. The depth is the average of ask and bid size for a quote. The relative quoted spread is the absolute quoted spread divided by the quoted midpoint. The relative effective spread is the absolute effective spread divided by the prevailing quote midpoint. The time-weighted absolute quoted spread (relative quoted spread, depth) is the absolute quoted spread (relative quoted spread, depth) weighted by the length of time over which each quote is valid. The numbers reported are medians.
Panel A: Changes in Relative Spreads (%) Relative Quoted Spreads Relative Effective Spreads Success Unsuccess Difference Success Unsuccess Difference
Days (-80,-21) 0.768 0.873 1.00 1.24 Days (+1, +2) 0.602 0.806 0.91 0.90
Change -0.045 -0.09** 0.045 -0.028 -0.061* 0.033 Days (+1,+4) 0.65 0.74 0.904 0.890
Change -0.014 -0.130*** 0.116 0.016 -0.071** 0.087* Days (+1, +20) 0.644 0.705 0.922 0.920
Change -0.024 -0.063* 0.039 -0.001 -0.035 0.025 Days(+21, +40) 0.700 0.993 0.918 0.937
Change -0.007 -0.126** 0.119 -0.029 -0.022 -0.007 Days(+41, +60) 0.761 0.82 0.912 0.912
Change -0.088 -0.15** 0.062 -0.001* -0.0005 -0.0005 Days(+61, +80) 0.782 0.790 0.908 0.856
Change -0.062 -0.131** 0.069 -0.0014 -0.0003 -0.0011

54
(Table 14 cont.)
* significant at the 0.1 level; ** significant at 0.05 level; *** significant at the 0.01 level
Panel B: Changes in Absolute Spreads and Depth Quoted Spreads Effective Spreads Depth Success Unsuccess Difference Success Unsuccess Difference Success Unsuccess Difference
Days (-80,-21) 0.175 0.175 0.074 0.062 50.24 58.39 Days (+1, +2) 0.161 0.135 0.069 0.054 50.35 51.11
Change -0.0072 -0.01*** 0.0028 -0.002 -0.004*** 0.002 0.092 6.71 -6.62 Days (+1,+4) 0.172 0.141 0.070 0.054 34.95 62.38
Change -0.0065 -0.022*** -0.0002 -0.004*** 0.0038* 0.092 5.78 -5.69 Days (+1, +20) 0.169 0.154 0.071 0.053 36.29 74.96
Change -0.0065 -0.017*** 0.011 0.0026 -0.004*** 0.0030** 1.47 6.44 -4.97 Days(+21, +40) 0.172 0.148 0.071 0.054 50.25 79.97
Change -0.014* -0.025** 0.011 -0.0008 -0.0052*** 0.0044 -0.45 9.96* 10.41 Days(+41, +60) 0.154 0.150 0.068 0.053 50.91 81.72
Change -0.029*** -0.026*** -0.003 -0.002 -0.0057*** 0.0037* -2.47 4.02 6.49 Days(+61, +80) 0.166 0.141 0.068 0.051 37.91 57.38
Change -0.031*** -0.026 -0.005 -0.002 -0.007*** 0.005* -1.80 2.156 3.956

55
Table 15. Liquidity Changes for Bidders in Different Exchanges This table shows and compares liquidity changes for bidders that list in different exchanges. Panel A shows and compares the liquidity changes for successful bidders that list in different exchanges, while panel B shows and compares liquidity changes for unsuccessful bidders that list in different exchanges. The absolute quoted spread is the difference between the ask price and the bid price of a quote. The absolute effective spread is twice the absolute value of the difference between the trade price and the prevailing quote midpoint. The depth is the average of ask and bid size for a quote. The relative quoted spread is the absolute quoted spread divided by the quoted midpoint. The relative effective spread is the absolute effective spread divided by the prevailing quote midpoint. The time-weighted absolute quoted spread (relative quoted spread, depth) is the absolute quoted spread (relative quoted spread, depth) weighted by the length of time over which each quote is valid. The numbers reported are medians.

56
(Table 15 cont.)
Panel A: Successful bidders listed in different exchanges Relative Quoted Spreads (%) Relative Effective Spreads (%) Nyse Nasdaq Amex Nyse Nasdaq Amex
Days (-80,-21) 0.71 2.25 1.78 0.447 1.71 1.168 Days (+1, +2) 0.604 1.88 1.681 0.40 1.39 1.28
Change -0.044*** -0.192*** -0.037 -0.034*** -0.16*** 0.000 Days (+1,+4) 0.638 1.96 1.686 0.405 1.460 1.20
Change -0.042*** -0.175*** -0.003 -0.028*** -0.153*** -0.033 Days (+1, +20) 0.643 2.00 1.63 0.409 1.52 1.162
Change -0.048*** -0.168*** -0.050 -0.028*** -0.145*** -0.049 Days(+21, +40) 0.649 1.978 1.609 0.413 1.51 1.174
Change -0.041*** -0.162*** -0.033 -0.029*** -0.145*** -0.052 Days(+41, +60) 0.638 2.03 1.587 0.415 1.52 1.156
Change -0.058*** -0.167*** -0.062 -0.031*** -0.151*** -0.074 Days(+61, +80) 0.623 1.93 1.656 0.407 1.49 1.12
Change -0.062*** -0.165*** -0.060 -0.033*** -0.157*** -0.025 Quoted Spreads Effective Spreads Depth Nyse Nasdaq Amex Nyse Nasdaq Amex Nyse Nasdaq Amex
Days (-80,-21) 0.174 0.296 0.206 0.056 0.1147 0.071 49.95 19.90 33.81 Days (+1, +2) 0.165 0.262 0.218 0.052 0.099 0.071 49.12 19.79 27.98
Change -0.0068*** -0.024*** 0.0074 -0.003*** -0.011*** 0.000 -3.92 -0.00*** -5.49 Days (+1,+4) 0.167 0.262 0.212 0.053 0.103 0.071 47.80 19.79 32.21
Change -0.0087*** -0.021*** 0.0086 -0.002*** -0.010*** 0.002 -3.01 -0.00*** -2.25 Days (+1, +20) 0.168 0.267 0.204 0.053 0.102 0.070 51.52 19.71 32.96
Change -0.0070*** -0.017*** 0.0047 -0.002*** -0.008*** -0.001 0.371 -0.053*** -0.55 Days(+21, +40) 0.167 0.260 0.208 0.053 0.103 0.070 50.70 19.71 35.12
Change -0.0090*** -0.018*** 0.0008 -0.003*** -0.009*** -0.0010 -0.579 -0.055*** -3.33 Days(+41, +60) 0.165 0.257 0.200 0.052 0.100 0.068 50.80 19.46 35.97
Change -0.012*** -0.025*** 0.0097 -0.003*** -0.010*** -0.0039 -0.874 -0.047*** -1.526 Days(+61, +80) 0.160 0.250 0.200 0.051 0.098 0.068 51.39 19.40 33.76
Change -0.015*** -0.032*** -0.00012 -0.0034*** -0.013*** 0.0011 -0.246 -0.056*** -2.149 No. of observations 594 866 92 594 866 92 594 866 92
57
(Table 15 cont.)
Panel B: Unsuccessful bidders listed in different exchanges Relative Quoted Spreads (%) Relative Effective Spreads (%) Nyse Nasdaq Amex Nyse Nasdaq Amex
Days (-80,-21) 0.632 2.81 3.90 0.392 2.30 2.78 Days (+1, +2) 0.558 2.99 4.51 0.374 2.33 2.78
Change -0.004 0.06*** 0.238** -0.016 0.045*** 0.043* Days (+1,+4) 0.566 3.05 4.31 0.360 2.25 2.78
Change -0.031 0.075*** 0.064 -0.000 0.001*** 0.19 Days (+1, +20) 0.576 3.15 0.50 0.364 2.36 3.41
Change -0.028 0.135*** 0.132** -0.024 0.094*** 0.263*** Days(+21, +40) 0.575 3.04 5.01 0.392 2.42 2.93
Change -0.03 0.154*** 0.44*** -0.012 0.072*** 0.169** Days(+41, +60) 0.561 2.97 4.58 0.380 2.44 2.75
Change -0.032** 0.057*** 0.0037** -0.017 0.08*** 0.505*** Days(+61, +80) 0.60 2.93 4.76 0.388 2.26 2.67
Change -0.029* 0.02*** 0.48** -0.021 0.024 0.444*** Quoted Spreads Effective Spreads Depth Nyse Nasdaq Amex Nyse Nasdaq Amex Nyse Nasdaq Amex
Days (-80,-21) 0.165 0.201 0.174 0.053 0.080 0.058 71.07 19.43 55.00 Days (+1, +2) 0.144 0.152 0.163 0.044 0.063 0.057 73.33 20 59.75
Change -0.0124*** -0.043*** 0.001 -0.0045*** -0.016 -0.0035 1.396 0.278*** -2.32 Days (+1,+4) 0.147 0.154 0.172 0.048 0.065 0.056 72.27 19.97 66.40
Change -0.013*** -0.037*** -0.002 -0.005*** -0.014*** -0.004* -2.70 0.095*** -1.93 Days (+1, +20) 0.146 0.155 0.146 0.047 0.064 0.052 71.55 19.71 74.06
Change -0.009*** -0.030*** -0.008** -0.004*** -0.015*** -0.004*** -3.03 0.642*** 10.63* Days(+21, +40) 0.145 0.161 0.151 0.048 0.065 0.055 69.00 19.71 80.83
Change -0.015*** -0.036*** -0.005* -0.004*** -0.016*** -0.028*** -2.70 0.538*** 5.712 Days(+41, +60) 0.144 0.148 0.141 0.049 0.062 0.051 57.70 20 74.78
Change -0.016*** -0.042*** -0.016*** -0.0046*** -0.019*** -0.006*** -4.89 0.816*** 7.635 Days(+61, +80) 0.145 0.149 0.155 0.048 0.062 0.051 60 20 76.33
-0.019*** -0.048*** -0.012*** -0.0056*** -0.02*** -0.005*** -4.53 0.763*** 3.73 No. of obs 313 159 43 313 159 43 313 159 43
* significant at the 0.1 level; ** significant at the 0.05 level; *** significant at the 0.01 level

58
Table 16. Changes in Price, Number of Market Makers, Number of Trades Per Day, Daily Trading Volume and Daily Dollar Volume between Successful and Unsuccessful Bidders
This tables shows and compares changes in price, number of market makers, number of trades per day, daily trading volume and daily dollar volume between successful and unsuccessful bidders before and after the takeover. The pre-takeover window goes from 80 to 21 days before the initial announcement of the takeover, and the post-takeover window goes from 21 to 80 days after the effective/withdrawal date of the takeovers. Numbers reported are the means.
Success Unsuccess Before After Changes Before After Change Diff in changes
Price 22.63 22.33 -0.3 19.73 16.98 -2.75*** 2.45*** Market Maker 16.19 17.49 1.294*** 18.91 19.84 0.934*** 0.360*
Number of trades per day 168 240 72.02*** 402 401 -0.74 72.76*** Daily Dollar Volume 9195940 12075197 2879257*** 21585325 20065835 -1519490 4398747***
* significant at the 0.1 level; ** significant at the 0.05 level; *** significant at the 0.01 level

59
not have any significant changes in liquidity after the takeovers. Panel B of Table 15 examines
liquidity changes of unsuccessful bidders that list in different exchanges. Unsuccessful bidders
that list in AMEX and NASDAQ have significant decreases in liquidity after they withdraw their
takeovers, but unsuccessful bidders that list in NYSE have similar liquidity as their pre-takeover
level after they withdraw their takeovers.
Table 16 examines and compares changes in price, number of market makers, number of
trades per day, daily dollar trading volume between successful and unsuccessful bidders.
The price does not change significantly for successful bidders after they complete their
takeovers. However, the price decreases significantly for unsuccessful bidders after they
withdraw their takeovers.
Both successful and unsuccessful bidders have more market makers after the takeovers.
However, successful bidders have more increases in market makers than unsuccessful bidders.
For the trading activities, successful bidders have significantly more trades and more dollar
trading volume per day after they complete their takeovers while unsuccessful bidders have
decreases (though insignificant) in dollar trading volume and trades per day. Changes in number
of market makers and trading activities could be classified as changes related to firm
characteristics. 5 More market makers and more active trading improve a firm’s liquidity.
Therefore, evidence in Table 16 also supports the firm characteristics hypothesis.
2.5.6 Multivariate Test
To examine whether the relations found in the univariate analysis also hold in a multivariate
analysis, I examine a group of regressions as:
5 As discussed in the methods part: The information production hypothesis only refers to the effect of the information produced during the takeover process on bidders’ liquidity. It does not consider the information produced after the takeover process. In contrast, all changes after the takeovers, including changes in the level of information produced for the bidders, are classified as changes in firm characteristics or changes related to firm characteristics.

60
VariablesGroupVariablesGrouphangesliquidityc 21 ++=α
where group1 variables are proxies for the information produced during the takeover process and
group2 variables are proxies for the changes in firm characteristics. Group1 variables include
changes in the number of analysts during the takeover process and the time a takeover takes from
announcement to completion/withdrawal. Group 2 Variables include the dummy of success, the
dummy of public, changes in the number of analysts after the takeover, changes in the number of
market makers (this only refers to Nasdaq firm), changes in the dollar trading volume, deal value
and changes in price. The dummy of success equals to 1 when the takeover is successful and 0
otherwise; the dummy of public equals to 1 when the bidder acquires or tries to acquire a public
target and 0 otherwise; the dummy of cash equals to 1 when the bidder is successful and uses
cash as the medium of exchange. Because the dependent variables are highly skewed, I
winsorized the dependent variables at the 1 percent and 99 percent level. That is, if the dependent
variable is greater(smaller) than its 99 (1) percent value, I set it to its 99 (1) percent value. Table
17 reports the regression results and Table 18 reports the correlation coefficients of the
independent variables.
In the multivariate analysis, I examine the determinants of changes in relative quoted
spreads, changes in relative effective spreads and changes in probability of information-based
trading. To each dependent variable, I run two separate regressions6. The regression results show
that most of the relations found in the univariate analysis also hold in the multivariate analysis.
In particular, almost none of the independent variables that proxy for information produced
in the takeover process play a significant role in explaining changes in liquidity. The only
exception is in regression (6). In regression (6), when explaining the changes in PIN, the variable
6 I have run a lot other combinations, and results are similar.

61
Table 17. Regression Results
This table presents the results of the regression: VariablesGroupVariablesroupangesiquidityCh 2 1GL ++= α where group1 Variables refer to the variables proxied for information produced during the takeover process and group2 Variables refer to the variables proxied for the changes in firm characteristics. Particularly, variable success, public and cash are dummy variables. Success equals to 1 if the takeover is successful and 0 otherwise, public equals to 1 if the takeover is a public takeover and 0 otherwise, and cash equals to 1 if the takeover uses cash as a medium of exchange. The dependent variables are winsorized at the 1 percent and 99 percent levels. The numbers reported in the parentheses are t-values.
Log Δ Quoted
Spreads (1) Log Δ Quoted
Spreads (2) Log Δ Relative
Spreads (3) Log Δ Relative
Spreads (4 ) Log Δ PIN (5) Log Δ PIN (6)
Intercept 0.074** 0.013 0.066* 0.024 0.017 0.023 (1.941 ) (0.278 ) (1.774 ) (0.523 ) (1.360 ) (1.209 )
Group1 Variables: Information Produced during the takeover Log Δ # Analysts -0.074 -0.031 0.042
(-1.099 ) (-0.458 ) (1.547 ) Time to completion/withdraw 0.000 0.000 0.000 0.000 0.000 0.000
(0.371 ) (-0.956 ) (0.242 ) (-1.622 ) (-0.295 ) (2.087** ) Group2 Variables: Changes in firm characteristics
Success -0.094*** -0.011 -0.085*** -0.004 -0.012 0.004 (-3.639 ) (-0.374 ) (-3.375 ) (-0.151* ) (-1.298 ) (0.329 )
Public -0.058** -0.085*** -0.035 -0.051 -0.012 0.004 (-2.208 ) (-3.016 ) (-1.369 ) (-1.796 ) (-1.438 ) (0.389 )
Cash -0.024 0.050* -0.013 0.064** 0.007 0.000 (-1.087 ) (1.836 ) (-0.601 ) (2.311 ) (1.014 ) (0.034 )
Log Δ # Analysts -0.257*** 0.021 -0.284*** -0.048 -0.006 -0.022 (-7.766 ) (0.446 ) (-8.786 ) (-1.005 ) (-0.524 ) (-1.092 )
Log Δ # Market Makers -0.284*** -0.265*** -0.017 (-8.048 ) (-7.490 ) (-1.098 )
Log Δ Trading Volume -0.108*** -0.074*** -0.005 (-5.405 ) (-3.696 ) (-0.661 )
Log deal value -0.008 -0.016** -0.009 -0.022*** -0.003 -0.012*** (-1.252 ) (-1.884 ) (-1.368 ) (-2.518 ) (-1.237 ) (-2.745 )
Log Δ Price -0.391*** -0.408*** 0.014 (-10.003 ) (-10.395 ) (0.770 )
Adjusted R-square 0.07 0.52 0.07 0.48 0.004 0.022 Number of Observations 1140 539 1138 538 843 326
* significant at the 0.1 level; ** significant at the 0.05 level; *** significant at the 0.01 level

62
Table 18. Correlation Coefficients This table presents the correlation coefficient of the dependent variables used in the regression shown in table 17. Log Δ #
Analysts_1 Time to completion
Success Public Cash Log Δ # Analysts_2
Log Δ # Market Makers
Log Δ Trading Volume
Log deal value
Log Δ Price
Log Δ # Analysts_1 1
Time to completion -0.042 1
Success -0.021 -0.175 1 Public -0.052 -0.106 0.082 1 Cash -0.052 0.216 -0.220 -0.179 0.073 1 Log Δ # Analysts_2 0.650 -0.083 0.099 -0.065 0.046 -0.073 1
Log Δ # Market Makers
0.081 -0.075 0.031 -0.042 0.048 -0.019 0.154 1
Log Δ Trading Volume
0.064 -0.044 0.168 0.027 0.044 0.021 0.211 0.299 1
Log deal value -0.032 0.206 0.032 -0.067 0.101 0.360 -0.021 0.014 0.120 1
Log Δ Price 0.068 -0.159 0.181 0.132 0.000 -0.102 0.249 0.082 0.604 -0.095

63
“time to completion” is significant at the 0.05 level. The results in Table 16 thus suggest that the
information produced during the takeover process does not drive the liquidity improvements for
successful bidders.
In contrast, variables that proxy for the changes in firm characteristics play a significant role
in explaining changes in liquidity or changes in PIN. Specifically, the dummy of success is
significant in regression (1) and (3), implying that if a takeover is completed, the bidder will
enjoy significant improvements in liquidity. However, the dummy of success is not significant in
regression (2) and (4) when I add four more independent variables that proxy for changes in firm
characteristics. This evidence suggests that the driving factor of liquidity improvements is
changes in firm characteristics. In addition, Table 17 also shows that the size in deal value
influences the improvements in liquidity positively; increases in market makers also contributes
to the improvements in liquidity.
On the whole, the multivariate analysis supports the results of the univariate analysis. That is,
the information generated during the takeover process does not drive the liquidity improvements;
changes in firm characteristics, as the increase in firm size and/or the effect of bundling claims
together, appear to be the driving factor of liquidity improvements for the bidders.
I also do some analysis on the determinants of liquidity and examine whether the
determinants have any structural change after the takeover. I do not find any significant
structural change in the determinants.
2.6 Conclusions
I find that liquidity improves following successful acquisitions. Broadly speaking, two
factors could drive the liquidity improvement for successful bidders: information generated
during the takeover process and changes in bidders’ firm characteristics (changes in firm size or

64
Table 19. Chow Test of Structural Changes in the Determinants of Liquidity This table presents the chow-test results of structural changes in the determinants of liquidity for successful bidders before and after the takeovers. The independent variable is logarithm of quoted relative spreads. The dependent variables are analysts’ coverage, logarithm of dollar trading volume, logarithm of number of trades, logarithm of firm size, and number of market makers.
* significant at the 0.1 level; ** significant at the 0.05 level; *** significant at the 0.01 level
Log(Quoted Spreads) Intercept -1.400***
(-8.46) Analyst Coverage 0.005**
(2.07) Log(Dollar Trading) -0.016
(-0.74) Log(Number of Trades) -0.208***
(-9.65) Log(Firm Size) -0.075***
(-4.53) Log(Stock Price) -0.313***
(-11.56) Number of Market Makers -0.018***
(-8.68) Obs. 1028
Chow-Test p_value 0.257

65
the effect of bundling two claims together). To distinguish between these two factors, I study the
liquidity/information asymmetry changes for unsuccessful bidders. I find that unsuccessful
bidders do not have liquidity improvement after they withdraw the takeovers. Since unsuccessful
takeovers also generate public information during the process, my findings suggest that changes
in firm characteristics, and not information produced during the takeover process, provide the
primary impetus for liquidity improvement.
Secondly, I find that bidders that acquire public firms enjoy similar liquidity improvements
as bidders that acquire private firms, but bidders that acquire public firms enjoy more reductions
in information asymmetry than bidders that acquire private firms. This finding is consistent with
the firm-characteristics hypothesis (in this case, increases in firm size), since in my sample
bidders that acquire public targets increases significantly more in firm-size (in both absolute and
relative terms) than bidders that acquire private firms. Furthermore, this evidence suggests that
liquidity, as a source of gain for the bidder, could influence a bidder’s takeover decision between
a private target and a public target.
Third, this essay documents that successful bidders that use stock as the method of payment
enjoy more liquidity improvements than those that use cash as the method of payment. I also find
that for private bidders, the difference in liquidity changes between stock and cash takeovers is
great. This evidence lends support to the bundling claim hypothesis and Merton (1987) investor
base hypothesis. My findings also support the adverse selection hypothesis that informed
investors lose their information advantage when facing a basket of securities.

66
Chapter 3 Liquidity and Market Monitoring: An Examination of Changes in Market Monitoring for Successful Bidders
3.1 Introduction
The purpose of this article is to examine the effect of a firm’s liquidity, measured as the
firm’s bid-ask spread, on its external monitoring. I study two research questions - Does the
change in liquidity influence the information content of the bidder’s price? Does the change in
liquidity influence the post-takeover performance of the bidder? The arguments of Holmstrom
and Tirole (1993) suggest that improvements in liquidity lead to improvements in external
monitoring. Since greater market monitoring improves a company’s performance, it is
reasonable to expect the firm’s performance to improve as its liquidity improves. In essay one, I
find that corporate takeovers influence the liquidity of a firm. To gain insight into how liquidity
changes affect the incentives to monitor, I use corporate takeovers as liquidity-changing events
and examine how changes in liquidity affect (i) the information content of the stock price (ii) the
subsequent operating performance of the firm and (iii) changes in firm value.
Based on a sample of 1,362 acquisitions from 1995 to 2001, I form two groups of successful
bidders, one with liquidity improvement (LI group) and one with a liquidity decrease (LD group).
Hasbrouck (1993) argues that low pricing errors indicate that the stock price is more informative.
Consistent with the proposition that liquidity improves the information content of the stock price,
I find that the pricing errors for the LI group decrease significantly after the takeover but the
pricing errors for the LD group increase significantly. The number of institutional investors (a
proxy for external monitoring) and the percentage of shares they hold increases significantly
more for the LI group than for the LD group.
I then compare changes in stock price performance, operating performance and firm value
(as measured by Tobin’s Q) for the LI and the LD groups. I find that LI group has relatively

67
better operating performance/firm value than LD group in all scenarios. That is, to a particular
performance measure (for example, industry-controlled return on assets, or
industry-and-performance controlled return on asset, etc), LI group either has more improvement
over its pre-takeover level or has less decrease over its pre-takeover level than the LD group.
These results support the argument that the LI group has better monitoring and thus has better
performance than the LD group. I do not find any significant difference on stock performances
between the LI and LD bidders, possibly because the market capitalizes the operating
performance changes at the time of the acquisition.
My results add to the understanding of the relations between liquidity, institutional
ownership, monitoring, and the governance of publicly held firms. Agency problems arise within
a firm when managers have incentives to pursue their own interests at shareholder expenses.
External monitoring is one of many mechanisms used to control this manager-shareholder
agency problem. Different from internal monitoring that is decided within the firm, firms do not
have direct control on its external monitoring. Kyle (1985) argues that greater liquidity enables
informed parties to disguise their private information and make profits on it. Building on Kyle’s
work, Holmstrom and Tirole (1993) show that as liquidity increases, the marginal value of
information goes up and the informed investors have stronger incentives to gather information
and to monitor the firm since they are better able to profit from their actions. Cremers and Nair
(2005) find that firms with strong shareholder rights and high ownership by activist institutions
outperform firms without both attributes. My study adds to this literature by examining
empirically the relation between stock liquidity and external monitoring.
To examine the relation between liquidity and external monitoring helps understand better
how public trading of a firm’s stock influences the firm’s external monitoring and its managerial

68
incentives. As Holmstrom and Tirole (1993) argue, public trading of a firm’s stock influences its
external monitoring/managerial incentive in two ways:
“First, a poorly performing firm may become a target for a takeover. If it is assumed that
managers will be fired if a takeover succeeds, this threat will help curb managerial misbehavior
(though it may also have less desirable effects, such as managerial myopia). Less dramatically,
public trading allows managerial incentives to be provided according to the continuing
performance of the firm's share price.”
Though public trading influences a firm’s managerial incentive in two ways, the extant literature
has focused the attention only on the first way - the corporate control aspect. For example,
Martin and McConnell (1991) document that after successful completion of the takeover, the
turnover for the top manager of the poor-performing target firm increases significantly.
Scharfstein (1988) presents a model showing that the takeover threat mitigates the agency
problem of the potential target firm. Mitchell and Lehn (1990) show that the bidders that make
value-decreasing takeovers are more likely to become takeover targets themselves. This essay
seeks to fill in the void by shedding light on how public trading influences a firm’s managerial
incentive via the second way –continuously align the manager’s interests with shareholders
through a more informative stock price.
3.2 Data
I collect from the Securities Data Corporation’s (SDC) Mergers and Acquisitions (M&A)
Database a list of successful mergers and tender offers for domestic targets, with the initial bid
announced between April 1st, 1995 and December 31st, 2001. To be included in the analysis, an
acquisition must meet the following criteria. (1) The announcement date and the effective date of
the takeover can be verified through the Lexis/Nexis; (2) The bidder is a U.S. firm listed on the

69
NYSE, AMEX or Nasdaq; (3) The bidder has 300 days of return data on CRSP and 60 days of
transaction data in the NYSE Trade and Quote Database (TAQ) before and after the
announcement and effective date of the takeover; (4) The successful bidder acquires more than
fifty percent and owns one hundred percent of the target firm’s shares after the takeover; (5). For
a successful takeover, its deal value is over 10 percent of the bidder’s market value two weeks
before the takeover announcement; (6). The firm does not attempt another takeover between its
pre- and post- takeover event window; (7). The bidder’s stock price is above three dollars;
(8).The takeover does not have such confounding events as stock split, addition into and deletion
from the market index.
The accounting data comes from the Compustat database, blockholder data from Wharton
Research Database7, institutional shareholding data from Compact Disclosure and Fama-French
factor and Carhart momentum factor from Kenneth French’s website
(http://mba.tuck.dartmouth.edu/pages/faculty/ken.french/index.html). The final sample consists
of 1,362 successful bidders.
I divide the 1362 successful bidders into the liquidity improved (LI) group, the liquidity
decrease (LD) group and the liquidity unchanged (LU) group. The LI group consists of the
bidders whose relative effective spreads decrease significantly at the 1 percent, 5 percent or 10
percent level after the takeover, the LD group includes bidders whose relative effective spreads
increase significantly at the 1 percent, 5 percent or 10 percent level, and the LU group consists of
bidders whose relative effective spreads do not change significantly. Table 20 presents the
summary statistics for these three groups. As a robustness check, I divide the sample by changes
in the quoted relative spreads, and all the empirical results are qualitatively similar.
7 The blockholder data is provided by Dlugosz, Fahlenbrach, Gompers and Metrick (2004)
70
Table 20. Summary Statistics
I obtain the liquidity improved (LI) group, the liquidity decrease (LD) group and the liquidity unchanged (LU) group from the successful takeover sample8. LI group consists of the bidders whose relative effective spreads decrease significantly at the 1%, 5% or 10% level after the takeover, LD group includes bidders whose relative effective spreads increase significantly at the 1%, 5% or 10% level, and LU group includes bidders whose relative effective spreads do not change significantly. If the target firm is a private firm, I classify this takeover as a private takeover. If the target firm has the same first two-digit SIC code as the bidder, I classify this takeover as a related takeover. If the medium of exchange in the takeover is cash, I classify this takeover as a cash takeover. The market value and transaction value are in millions.
Panel A: Sample Distribution LI Group LD Group LU Group No. Percent No. Percent No. Percent
Private Takeover 267 38 171 36 106 44 Related Takeover 434 62 247 52 153 63
Cash Takeover 319 46 198 42 138 57 Total Takeover 700 100 406 100 256 100
Panel B: Sample Characteristics Mean Median Mean Median Mean Median
∆ in effective Spreads -0.0041 -0.0023 0.0037 0.0023 0.0000 0.0000 Bidder Size 1154.05 281.84 1549.62 226.4 846 188
Transaction Value 581.74 95.14 805.2 83.4 261 64 % Transaction Value 0.63 0.32 0.67 0.25 0.56 0.27
8 The successful takeover sample is taken from Essay 1 of my dissertation. The sample description can be found in the “Data and Methods” part in Essay 1.

71
Panel A of Table 20 presents the distributions of the LI group, the LD group and the LU
group across different types of takeovers. If the target firm is a private firm, I classify this
takeover as a private takeover. If the target firm has the same first two-digit SIC code as the
bidder, I classify this takeover as a related takeover. If the medium of exchange in the takeover is
cash, I classify this takeover as a cash takeover. LI group has 700 observations, LD group has
406 and LU group has 256 observations respectively. Panel A shows that LI and LD groups have
similar distribution across different types of takeovers. Panel B shows that on average, the LD
group has the greatest bidder size and transaction value, while the LU group has the smallest.
Still, the relative size of the transaction ((transaction value)/(bidder size)) is comparable in all
three groups.
3.3 Methods
3.3.1 Price Informativeness
Kyle (1985), and Holmstrom and Tirole (1993) suggest that the informativeness of a stock
price reflects the level of market monitoring of a company. Therefore, as a test of the changes in
the level of market monitoring for each bidder, I examine the changes in the price
informativeness for each bidder.
I apply the Hasbrouck (1993) pricing error standard deviation to measure the price
informativeness of each bidder before and after the takeover. Compared with other
microstructure measures (e.g. PIN) that consider only private information, the Hasbrouck (1993)
pricing error standard deviation considers both private and public information and provides a
measure of the total information content of a stock price more.
Hasbrouck (1993) decomposes the transaction price into an implicit efficient price and a
pricing error. ttt smp += , where tm is the efficient price conditioned on both public and

72
private information, and ts is the pricing error. The efficient price tm follows a random
walk: ttt wmm += −1 . The standard deviation of ts , pricing error standard deviation, is a
summary measure of market quality, or a measure of information content of the stock. Following
Hasbrouck (1993), I apply the vector autoregressive model (VAR) to estimate pricing error
standard deviation for each bidder before and after the takeover. The variables I use in the vector
autoregressive model include: the return of each transaction, trade direction (I classify the trade
direction following Lee and Ready 1991, that is, if it is a buy, trade direction equals 1; if it is a
sell, trade direction equals -1), signed trading volume of each transaction (signed by the trade
direction), and signed square root of trading volume of each transaction (signed by the trade
direction). I assume that there are 5 lags in the vector autoregressive model. My results are robust
if I use 3 or 6 lags in the vector autoregressive model.
3.3.2 Stock Price Performance
I examine the long-term stock returns of the bidders to see how changes in liquidity
influence the bidders’ stock performance. If greater liquidity increases the level of a firm’s
external monitoring and greater external monitoring improves a company’s performance, I
expect to observe a positive impact of liquidity on a firm’s stock performance. It is possible that
this impact is capitalized into the price at the time of the takeover. If this is the case, I will not be
able to find any significant impact of liquidity changes on a firm’s long term stock performance.
There has been a lot of debate surrounding the existence/methods of long-term abnormal
stock returns. For example, Fama (1998) argues that most long-term abnormal stock return
results are vulnerable to the mismeasurement of risks (bad model problem). One way to deal
with this bad-model problem is to examine the robustness of the results using different methods.

73
In this essay, I apply three different methods to examine bidders’ long-term abnormal stock
returns.
First, I examine the annual industry-adjusted return for the bidders. As in Clark and Ofek
(1994), I subtract the median/mean return of all firms with the same first two-digit9 SIC code
from the bidder’s return, and get the mean and median for the LI and the LD groups. The
industry-adjusted returns indicate the bidders’ performance relative to their industries before and
after the takeovers. I further examine changes in industry-adjusted returns for bidders that make
public takeovers. For these bidders, I calculate their pre-takeover stock return as the return of the
bidder and the target before the takeover weighted by their firm sizes.
Second, I apply the Fama-French (1993) three-factor model to detect the long-term
abnormal return of bidders before and after the takeovers. The Fama-French three-factor model
is:
ptttftmtftit hHMLsSMBRRbRR εα +++−+=− )(
Where itR is the return of firm i in month t, ftR is the one-month T-Bill return in month t,
mtR is the CRSP market return, tSMB is the return of a portfolio of large firms minus the return
of a portfolio of small firms, tHML is the return of a portfolio of stocks with high
book-to-market ratios minus the return of a portfolio of stocks with low book-to-market ratios. I
regress each bidder’s return on these Fama-French factors, obtain the abnormal return (alpha) for
each bidder and calculate the average abnormal return for the LI and LD groups respectively. I
use monthly return to detect the abnormal return. For robustness, I examine the abnormal returns
9 As a robustness check, I also subtract the median/mean return of all firms with the same three-digit SIC code from the bidders’ return. The results are quantitatively and qualitatively similar.

74
using both the value-weighted and equal-weighted market return. I correct the standard errors in
the above equation for heteroskedasticity and autocorrelation.
My third measure is built on Fama-French three factor model. Following Carhart (1997), I
add a momentum factor to the Fama-French three factors:
pttttftmtftit mUMDhHMLsSMBRRbRR εα ++++−+=− )(
where tUMD is the return of high momentum stocks minus the return of low momentum stocks.
Carhart (1997) includes a momentum factor in the analysis to make up for the three-factor
model’s inability to explain cross-sectional variation in momentum-sorted portfolio returns.
3.3.3 Operating Performance
To directly measure the operating efficiency, I examine the changes in operating
performance for each group. One advantage of examining operating performance is that it can
avoid the debate over market efficiency and long run methodology. To be comprehensive, I
examine six different operating performance measures in this essay: operating income before
depreciation scaled by sales; operating income before depreciation scaled by assets; operating
income after depreciation scaled by sales; operating income after depreciation scaled by assets;
net income scaled by sales and net income scaled by assets. Among these six different measures,
operating income before depreciation scaled by sales is not vulnerable to the mechanical effects
of the accounting method (pooling or purchase accounting) and the financing method (cash or
equity) of the merger (Heron and Lie, 2002).
I examine these six measures using three different methods. First, I examine their raw
performance. Second, to control for changing industry and economy-wide conditions, I compute
the industry-adjusted performance by comparing the operating performance of the sample to the
median operating performance of firms in the same first two-digit SIC code. Third, to control for

75
possible mean-reverting characteristics of accounting numbers, I compute the industry and
pre-performance adjusted performance by comparing the operating performance of the sample
firms to that of a control firm in a similar industry with similar pre-event performance (Barber
and Lyon, 1996). To construct this control sample, I first identify firms that has the first
two-digit SIC code as the sample firm. Among these firms, I select the firms whose
pre-performance lies within 10% of the sample firm, and then choose among these firms one
control firm that has the closest operating performance as the sample firm. If no control firm can
be obtained using this method, I use one digit SIC code to identify firms that are in the same
industry, select the firms whose pre-performance lies within 10% of the sample firm, and choose
one control firm with the most similar pre-performance. If still no control firm can be obtained, I
choose the control firm as the one that has the same first two-digit SIC code as the sample firm
and has the closest operating performance. In this way, I find for each sample firm one control
firm. 10
3.3.4 Firm Value, Blockholder and Institutional Investor
I examine changes in firm value, as measured by Tobin’s Q, for the LI group and the LD
group. Tobin’s Q is measured as the market value of assets divided by the book value of assets.
The market value of assets is the sum of the book value of assets and the market value of stocks,
minus the book value of common stock and deferred taxes. I measure for each bidder its raw
Tobin’s Q, and its industry-adjusted Tobin’s Q. The industry-adjusted Tobin’s Q is calculated as
the firm’s raw Tobin’s Q minus the median Tobin’s Q of a group of firms that have the same
first two-digit SIC code as the bidder.
10 I also find for each bidder a group of firms that have the same first two-digit SIC code and similar pre-performance (within a 10 percent range) and use the median of this group of firms as a control. The results are similar.

76
Blockholders and institutional investors are both used in literature as proxy for external
monitoring. I examine changes in number of blockholders/institutional investors and changes in
percentage of shares held by blockholders/institutional investors for the LI and LD groups
respectively.
3.4 Empirical Results
3.4.1 Comparison of Changes in Price Informativeness for LI and LD Groups
Table 21 presents the changes in Hasbrouck (1993)’s pricing error standard deviations for
the LI and LD groups respectively.
The pricing error standard deviation is 0.0039 for the LI group before the takeover. It
decreases to 0.0026 after the takeover, and the paired difference -0.0008 is significantly smaller
than zero. For the LD group, however, the result is just the opposite. The paired pricing error
standard deviation increases 0.0004 after the takeover, which is significantly greater than zero.
Furthermore, the difference in the change of pricing error standard deviation between the LI and
the LD groups is significantly different from zero. This evidence suggests that the price becomes
more informative for the LI group but becomes less informative for the LD group. If, as
proposed by Holmstrom and Tirole (1993), the informativeness of a stock price reflects the level
of market monitoring of a company, this evidence implies that the LI group has a higher level of
market monitoring after the takeover while the LD group has a lower level market monitoring
after the takeover.
3.4.2 Comparison of Changes in Equity Returns for LI and LD Groups
The results in Table 21 suggest that the price becomes more informative for the LI group but
becomes less informative for the LD group. Holmstrom and Tirole (1993) argue that the
informativeness of a firm’s stock price reflects the level of external monitoring on this firm. My

77
Table 21. Pricing Error Standard Deviation of Bidders Hasbrouck (1993) decomposes the transaction price into an implicit efficient price and a pricing error.
ttt smp += , where tm is the efficient price conditioned on both public and private information, and
ts is the pricing error. The efficient price tm follows a random walk: ttt wmm += −1 . The standard deviation of ts is a measure of information content of the stock. Following Hasbrouck (1993), I apply the vector autoregressive model (VAR) to estimate pricing error standard deviation for each bidder before and after the takeover. The variables I use in the vector autoregressive model include: the return of each transaction, trade direction (if it is a buy, trade direction equals 1; if it is a sell, trade direction equals -1), signed trading volume of each transaction (signed by the trade direction), and signed square root of trading volume of each transaction (signed by the trade direction). I assume that there are 5 lags in the vector autoregressive model. I report medians in the table.
LI Group LD Group Difference
Pre-announcement Days (-80,-1) 0.0039 0.0032 Post-takeover Days (1,80) 0.0026 0.0036
Change -0.0008*** 0.0004*** -0.0012*** (p-value) (<0.0001) (<0.0001) (<0.0001)
* significant at the 0.1 level ** significant at the 0.05 level *** significant at the 0.01 level

78
result so far thus suggests that LI group has more informative prices after the takeover than the
LD group, which should encourage more external monitoring. External monitoring helps reduce
the agency problem between managers and shareholders and thus should improve the firm’s
performance.
Table 22 presents and compares the industry-adjusted stock returns of the LI and LD groups
respectively. Panel A of Table 22 presents the result when the control return is the industry mean
return while panel B displays the result when I use the industry median return as the benchmark.
In Table 22 I classify firms into a same industry based on their first two-digit SIC code. Though I
examine the equity returns from one to three years after the takeovers, I focus my analysis on the
one year after the takeovers.
If simply looking at the changes in the industry-adjusted stock returns, Table 22 shows that
LI group has a relatively smaller decrease in the industry-adjusted stock returns than the LD
group. However, the differences in changes between these two groups are not significantly
different. For example, Panel A shows that the median industry-adjusted stock return (adjusted
for industry mean return) of the LI group goes from 0.86 percent to -6.9 percent one year after
the takeover, a drop of 10.8 percent. The median industry-adjusted stock return for the LD group
has a comparable decrease of 12.3 percent, which is greater but not significantly greater than the
decrease of stock equity returns for the LI group. Panel B has the qualitatively similar results as
Panel A if I examine and compare changes in industry-adjusted stock returns between these two
groups.
Table 23 presents and compares the industry-adjusted stock returns for bidders that acquire
public targets. Overall, results in Table 23 show no significant difference in changes of the
industry-adjusted stock returns between the LI and LD groups. Different from the whole sample,

79
Table 22. Industry Adjusted Stock Returns
This table presents the annual industry-adjusted return for the bidders around the takeovers. Following Clark and Ofek (1994), I subtract the median/mean return of all firms with the same two-digit SIC11 code from the bidder’s return, and report the mean and median for the LI and the LD groups. Year –1 is the year before the takeover announcement, and year 1 is the year after the takeover effective date. The difference test tests the significance of the difference in changes in mean/median industry-adjusted annual returns.
LI Group LD Group Difference Year Mean Median %Positive Obs Mean Median %Positive Obs Mean Median
Panel A. Adjusted for industry mean return -1 0.167 0.0086 51.57 700 0.082 -0.014 48.77 406 1 0.0048 -0.069 42.02 664 -0.056 -0.113 39.40 368 -0.168*** -0.108*** -0.176*** -0.123*** 0.008 0.015
2 -0.106 -0.162 35.05 602 -0.067 -0.138 39.27 331 -0.285*** -0.186*** -0.216*** -0.130*** -0.069 -0.056
3 -0.011 -0.121 39.15 539 0.038 -0.127 40.86 301 -0.195*** -0.162*** -0.120 -0.088*** -0.075 -0.074
Panel B. Adjusted for industry median return -1 0.360 0.163 67.14 700 0.312 0.164 65.02 406 1 0.216 0.093 58.43 664 0.166 0.033 53.53 368 -0.149*** -0.071*** -0.178*** -0.138*** 0.029 0.067
2 0.120 0.017 52.16 602 0.168 0.034 53.17 331 -0.255*** -0.124*** -0.199*** -0.160*** -0.056 0.036
3 0.214 0.050 55.66 539 0.261 0.046 55.48 301 -0.165*** -0.129*** -0.120*** -0.125*** -0.045 -0.004
* significant at the 0.1 level ** significant at the 0.05 level *** significant at the 0.01 level
11 I also classify firms into different industrial categories by their first three-digit SIC code, and the results are statistically similar.

80
Table 23. Industry-Adjusted Stock Returns for Public Takeovers
This table presents the annual industry-adjusted return for the bidders that make public takeovers around the takeovers. Following Clark and Ofek (1994), I subtract the median/mean return of all firms with the same two-digit SIC code from the bidder’s return, and report the mean and median for the LI and the LD groups. Year –1 is the year before the takeover announcement, and year -1 return is calculated as the return of the bidder and the target of the year before the takeover announcement weighted by their size. Year 1 is the year after the takeover effective date. The difference test tests the significance of the difference in changes in mean/median industry-adjusted annual returns.
LI Group LD Group Difference Year Mean Median %Positive Obs Mean Median %Positive Obs Mean Median
Panel A: Adjusted for industry mean return -1 0.157 0.027 53.8 184 -0.014 -0.039 45.7 92 1 -0.069 -0.070 39.09 197 -0.045 -0.060 41.7 96 -0.228*** -0.114*** -0.047 -0.074 -0.181 -0.040
2 -0.082 -0.093 40.66 182 -0.105 -0.175 35.6 87 -0.228*** -0.104** -0.130 -0.158 -0.098 0.054
3 -0.030 -0.089 36.90 168 -0.143 -0.130 37.0 81 -0.188 -0.115 -0.153* -0.118 -0.035 0.003
Panel B: Adjusted for industry median return -1 0.357 0.181 71.2 184 0.208 0.155 65.2 92 1 0.158 0.079 55.8 197 0.185 0.068 57.3 96 -0.205*** -0.124*** -0.033 -0.039 -0.172 -0.085
2 0.129 0.076 56.0 182 0.082 -0.001 50.6 87 -0.226*** -0.085*** -0.161** -0.202*** -0.064 0.118
3 0.201 0.060 57.1 168 0.095 -0.007 49.4 81 -0.170** -0.102*** -0.139** -0.171*** -0.031 0.070
* significant at the 0.1 level ** significant at the 0.05 level *** significant at the 0.01 level

81
Table 24. Long-term Abnormal Stock Returns
This table provides long-term abnormal stock returns of the liquidity-improved and liquidity-decreased bidders. The models used to detect long-term abnormal stock returns is the Fama-French (1993) three-Factor Model,
ptttftmtftit hHMLsSMBRRbRR εα +++−+=− )(
where itR is the return of firm i, ftR is the one-month T-Bill return, mtR is the CRSP market return, tSMB is the return of a portfolio of large
firms minus the return of a portfolio of small firms, tHML is the return of a portfolio of stocks with high book-to-market ratios minus the return of a portfolio of stocks with low book-to-market ratios. I also estimate the abnormal stock returns with a momentum factor (Carhart, 1997)
pttttftmtftit mUMDhHMLsSMBRRbRR εα ++++−+=− )(
where tUMD is the return of high momentum stocks minus the return of low momentum stocks. Following Andrew (1991), I correct the standard errors in the above equations for heteroskedasticity and autocorrelation. Panel A presents the results where the market return is the CRSP equally-weighted market return and Panel B presents the results where the market return is the CRSP value-weighted market return.

82
(Table 24 cont.)
Panel A. Results using equally-weighted market index Fama-French Three Factor Model
Year LI Group LD Group Intercept b s h Intercept b s h
-2 -0.380*** 0.008*** 0.009*** 0.001 -0.374*** 0.012*** 0.010*** 0.005 (-36.640) (3.359) (3.788) (0.267) (-33.457) (4.656) (3.564) (1.160)
-1 -0.391*** 0.011*** 0.007*** 0.001 -0.402*** 0.009*** 0.007*** 0.000 (-43.134) (3.853) (3.387) (0.282) (-43.873) (3.792) (3.564) (0.132)
1 -0.359*** 0.008** 0.010*** 0.000 -0.367*** 0.015** 0.010* 0.005 (-22.222) (2.356) (3.158) (0.047) (-14.864) (2.038) (1.802) (0.688)
2 -0.331*** 0.013*** 0.013*** 0.006 -0.332*** 0.011** 0.014*** 0.007 (-16.010) (3.120) (3.036) (0.940) (-15.563) (2.358) (3.113) (1.042)
3 -0.277*** 0.016*** 0.012*** 0.007 -0.277*** 0.015*** 0.012** 0.010 (-12.308) (3.995) (2.830) (1.130) (-11.666) (3.515) (2.455) (1.467) Carhart Four-Factor Model
Year LI Group LD Group Intercept b s h m Intercept b s h m
-2 -0.375*** 0.008*** 0.010*** -0.002 -0.004 -0.370*** 0.011*** 0.011*** 0.003 -0.003 (-33.566) (3.300) (4.645) (-0.411) (-1.583) (-29.993) (4.318) (4.068) (0.513) (-0.998)
-1 -0.389*** 0.011*** 0.007*** 0.001 -0.001 -0.406*** 0.010*** 0.006*** 0.001 0.002 (-35.284) (4.001) (3.224) (0.171) (-0.373) (-47.568) (4.405) (3.132) (0.364) (1.254)
1 -0.358*** 0.008** 0.010*** 0.000 -0.001 -0.346*** 0.009* 0.012** 0.000 -0.014 (-19.941) (2.313) (3.155) (0.003) (-0.208) (-10.024) (1.953) (2.062) (0.067) -(1.464)
2 -0.324*** 0.010** 0.013*** 0.004 -0.005* -0.325*** 0.008* 0.014*** 0.005 -0.005* (-15.119) (2.534) (3.433) (0.660) (-1.748) (-14.729) (1.821) (3.493) (0.788) -(1.708)
3 -0.272*** 0.013*** 0.013*** 0.006 -0.005 -0.272*** 0.013*** 0.013*** 0.009 -0.004 (-11.923) (3.105) (3.182) (0.947) (-1.415) (-11.405) (2.779) (2.839) (1.316) -(1.272)

83
(Table 24 cont.)
Panel B. Results using value-weighted market index Fama-French Three Factor Model
Year LI Group LD Group Intercept b s h Intercept b s h
-2 -0.376*** 0.007*** 0.005** -0.002 -0.373*** 0.013*** 0.003 0.005 (-38.455) (3.308) (2.250) (-0.492) (-31.527) (4.287) (1.026) (0.972)
-1 -0.383*** 0.009*** 0.003 -0.003 -0.388*** 0.008*** 0.004* -0.003 (-41.143) (3.044) (1.589) (-0.866) (-40.975) (3.315) (1.733) -(0.849)
1 -0.347*** 0.007* 0.006* -0.004 -0.355*** 0.014* 0.007 0.006 (-21.716) (2.035) (1.899) (-0.846) (-14.995) (1.900) (1.230) (0.901)
2 -0.310*** 0.011*** 0.009** 0.001 -0.315*** 0.009* 0.006 0.003 (-15.225) (2.873) (2.220) (0.150) (-15.464) (1.889) (1.493) (0.472)
3 -0.265*** 0.014*** 0.009*** 0.002 -0.269*** 0.015*** 0.004 0.005 (-12.575) (4.097) (2.706) (0.405) (-11.242) (3.482) (0.850) (0.776)
Carhart Four-Factor Model Year LI Group LD Group
Intercept b s h m Intercept b s h m -2 -0.371*** 0.006*** 0.005*** -0.004 -0.004 -0.370*** 0.013*** 0.004 0.003 -0.002 (-34.310) (3.202) (2.814) (-1.022) (-1.456) (-29.168) (4.118) (1.168) (0.535) (-0.771)
-1 -0.384*** 0.009*** 0.003 -0.003 0.001 -0.396*** 0.009*** 0.003 -0.002 0.005 (-33.881) (3.266) (1.425) (-0.778) (0.231) (-43.533) (4.199) (1.334) -(0.447) (2.278)
1 -0.348*** 0.007** 0.006* -0.003 0.001 -0.338*** 0.009** 0.009 0.003 -0.011 (-19.748) (2.181) (1.771) (-0.737) (0.326) (-9.957) (1.960) (1.359) (0.453) -(1.128)
2 -0.306*** 0.010** 0.009* 0.000 -0.003 -0.315*** 0.008* 0.006 0.003 0.000 (-14.404) (2.475) (2.359) (-0.025) -(0.928) -(14.609) (1.815) (1.475) (0.447) -(0.072)
3 -0.263*** 0.013*** 0.010*** 0.002 -0.002 -0.265*** 0.013*** 0.005 0.004 -0.004 (-12.060) (3.368) (2.648) (0.291) -(0.607) -(11.196) (2.792) (1.120) (0.623) -(1.336)
* significant at the 0.1 level ** significant at the 0.05 level *** significant at the 0.01 level

84
LD bidders that make public takeovers do not have significantly decrease in their
industry-adjusted stock returns one year after the completion of the takeovers. This result is
puzzling.
Table 24 shows the long-term abnormal stock return tests for the LI and LD groups. In Panel
A, I show the results using the Fama-French three factor model and Carhart four factor model
with equally-weighted market index. In Panel B, I display the results using the Fama-French
three factor model and Carhart four factor model with value-weighted market index.
In both Panel A and Panel B, I find that the alphas are significantly negative for both the LI
and LD groups before and after the takeovers. And there are no significant differences in changes
of alphas between the LI and the LD groups. This result is very similar to the results displayed in
Table 22. In summary, I do not document any significant difference in stock returns between the
LI and the LD groups. The negative alphas documented here are consistent with the findings of
Moeller, Schlingemann and Stulz (2005). A large majority of the acquisitions in my sample are
announced between 1998 and 2001. Moeller, Schlingemann and Stulz find that acquisitions
announced in 1998-2001 destroy shareholders’ wealth on a massive scale and bidders that make
these deals have significant underperformance in the long run.
3.4.3 Comparison of Changes in Operating Performance for LI and LD Groups
I report the results of operating performance tests in Table 25. Researchers have used
different operating performance measures so far. For robustness, I examine six different
measures of operating performances in this essay and report the result of each measure in a
different panel. Panel A (Panel B) reports the results of operating income before depreciation
scaled by assets (sales), Panel C (Panel D) reports the results of operating income after
depreciation scaled by assets (sales) and Panel E (Panel F) reports the results of net income

85
scaled by assets (sales). As explained previously operating income before depreciation scaled by
sales is the most appropriate measure since it is immune to the mechanical effects of the
accounting method (pooling or purchase accounting) and the financing method (cash or equity)
of the merger (Heron and Lie, 2002). So, I will focus my analysis in this ROS reported in Panel
B (operating performance before depreciation scaled by sales).
Panel B reports the raw, industry-adjusted and industry and pre-performance adjusted ROS
(return on sales, measured as the operating income before depreciation scaled by sales) for the LI
and LD groups before and after the takeovers. Overall, the results indicate that the LI group has
relatively better operating performance than the LD group. Take the industry and
pre-performance adjusted measure for example. The ROS is zero to the LI group one year before
the takeover. It increases to 0.008 one year after the takeover, with the paired 0.008 increase
significantly different from zero. The ROS is also zero to the LD group one year before the
takeover. However, it decreases to -0.002 one year after the takeover, with a paired though
insignificant -0.003 decrease. The difference in changes between the LI and LD groups are
significantly different from zero at the 0.05 level. For the second and third year after the takeover
completion, the LI group still has relatively better ROS than the LD group.
The results shown in the other five panels are very similar to the results displayed in Panel B.
That is, the LI group has relatively better operating performance than the LD group after the
takeovers. For all six different operating performance measures, if we focus on the industry and
pre-performance metric, we can see LI group has increases in operating performance one year
after the takeover (most of the increases are significantly different from zero), and LD group has
decreases in operating performance, and the difference in changes between these two groups are
significantly different from zero in most scenarios.

86
Table 25. Operating Performance
This table presents the raw, the industry adjusted (Clark and Ofek, 1994) and the industry and pre-performance adjusted (Barber and Lyon, 1996) operating performances. For the industry adjusted operating performance, I subtract the median operating performance of all firms with the same first-two-digit SIC codes as the bidder from the bidder’s operating performance, and get the medians for each group. For the industry and pre-performance adjusted performance, I find for each bidder a matched firm that has the same first two-digit SIC code as the bidder and has the most similar pre-performance as the bidder. Year –1 is the year before the takeover announcement, and year 1 is the year after the takeover effective date. Panel A presents the raw, industry-adjusted and industry and pre-performance adjusted return on assets, which is defined as the operating income before depreciation divided by ending assets. Panel B presents the return on sales, which is operating income before depreciation divided by sales. Panel C presents return on assets, which is the operating income after depreciation divided by ending assets. Panel D presents return on sales, which is the operating income after depreciation divided by sales. Panel E presents return on assets, which is net income divided by ending assets. Panel F presents return on sales, which is net income divided by sales.
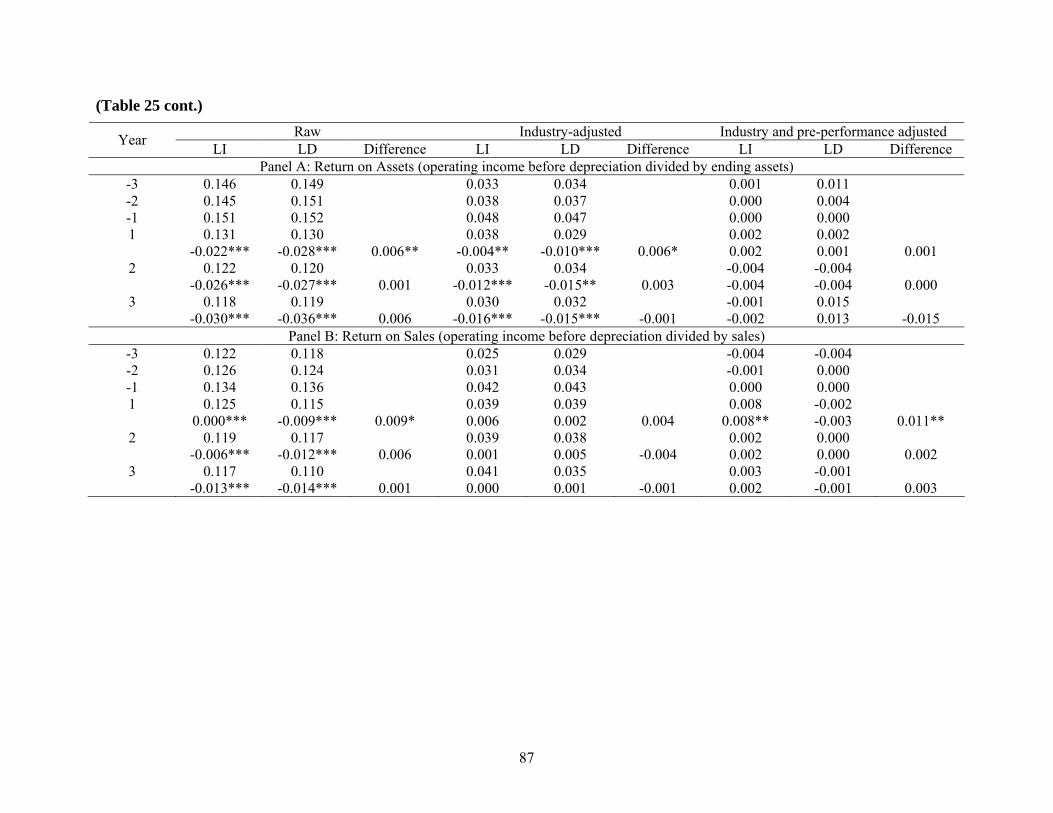
87
(Table 25 cont.)
Raw Industry-adjusted Industry and pre-performance adjusted Year LI LD Difference LI LD Difference LI LD Difference Panel A: Return on Assets (operating income before depreciation divided by ending assets)
-3 0.146 0.149 0.033 0.034 0.001 0.011 -2 0.145 0.151 0.038 0.037 0.000 0.004 -1 0.151 0.152 0.048 0.047 0.000 0.000 1 0.131 0.130 0.038 0.029 0.002 0.002 -0.022*** -0.028*** 0.006** -0.004** -0.010*** 0.006* 0.002 0.001 0.001
2 0.122 0.120 0.033 0.034 -0.004 -0.004 -0.026*** -0.027*** 0.001 -0.012*** -0.015** 0.003 -0.004 -0.004 0.000
3 0.118 0.119 0.030 0.032 -0.001 0.015 -0.030*** -0.036*** 0.006 -0.016*** -0.015*** -0.001 -0.002 0.013 -0.015
Panel B: Return on Sales (operating income before depreciation divided by sales) -3 0.122 0.118 0.025 0.029 -0.004 -0.004 -2 0.126 0.124 0.031 0.034 -0.001 0.000 -1 0.134 0.136 0.042 0.043 0.000 0.000 1 0.125 0.115 0.039 0.039 0.008 -0.002 0.000*** -0.009*** 0.009* 0.006 0.002 0.004 0.008** -0.003 0.011**
2 0.119 0.117 0.039 0.038 0.002 0.000 -0.006*** -0.012*** 0.006 0.001 0.005 -0.004 0.002 0.000 0.002
3 0.117 0.110 0.041 0.035 0.003 -0.001 -0.013*** -0.014*** 0.001 0.000 0.001 -0.001 0.002 -0.001 0.003

88
(Table 25 cont.)
Raw Industry-adjusted Industry and pre-performance adjusted Year LI LD Difference LI LD Difference LI LD Difference Panel C: Return on Assets (Operating income after depreciation divided by assets)
-3 0.100 0.101 0.032 0.030 0.003 0.000 -2 0.099 0.100 0.037 0.038 0.001 -0.003 -1 0.106 0.102 0.048 0.040 0.000 0.000 1 0.089 0.075 0.037 0.027 0.004 -0.005 -0.020*** -0.031*** 0.011*** -0.003** -0.013*** 0.01** 0.006 -0.007 0.013*
2 0.077 0.072 0.035 0.027 -0.001 -0.003 -0.029*** -0.030*** 0.001 -0.013*** -0.009*** -0.004 0.000 -0.002 0.002
3 0.073 0.074 0.034 0.031 0.003 0.000 -0.031*** -0.032*** 0.001 -0.014*** -0.016*** 0.002 0.003 0.001 0.002
Panel D: Return on Sales (Operating income after depreciation divided by sales) -3 0.081 0.082 0.025 0.025 -0.002 0.002 -2 0.083 0.085 0.030 0.034 -0.002 0.001 -1 0.091 0.092 0.039 0.039 0.000 0.000 1 0.080 0.066 0.036 0.034 0.006 -0.001 -0.005*** -0.017*** 0.012** 0.003 0.000 0.003 0.006** -0.002 0.008**
2 0.073 0.067 0.032 0.031 0.001 -0.007 -0.012*** -0.018*** 0.006 0.000 0.005 -0.005 0.000 -0.007* 0.007***
3 0.072 0.066 0.042 0.034 -0.003 -0.001 -0.014*** -0.015*** 0.001 0.002 -0.001 0.003 -0.002 -0.002 0.000

89
(Table 25 cont.)
Panel E: Return on Assets (Net income divided by assets) -3 0.052 0.049 0.023 0.023 0.002 -0.001 -2 0.053 0.054 0.029 0.028 0.003 0.001 -1 0.056 0.054 0.035 0.038 0.000 0.000 1 0.037 0.027 0.026 0.017 0.002 -0.010 -0.022*** -0.035*** 0.013*** -0.006*** -0.024*** 0.018*** 0.001 -0.009** 0.010**
2 0.029 0.026 0.021 0.018 -0.001 0.000 -0.024*** -0.038*** 0.014* -0.011*** -0.012*** 0.001 -0.001 0.000 -0.001
3 0.029 0.024 0.025 0.019 0.002 -0.008 -0.028*** -0.034*** 0.006* -0.010*** -0.019*** 0.009 0.001 -0.010 0.011
Panel F: Return on Sales (Net income divided by sales) -3 0.042 0.037 0.016 0.015 0.001 0.000 -2 0.045 0.045 0.021 0.019 -0.001 0.002 -1 0.049 0.049 0.027 0.032 0.000 0.000 1 0.031 0.022 0.021 0.014 0.001 -0.001 -0.009*** -0.024*** 0.015*** 0.001 -0.010*** 0.011** 0.001 -0.002 0.003
2 0.028 0.021 0.020 0.017 0.002 0.001 -0.015*** -0.023*** 0.008 -0.001 -0.005* 0.004 0.002 0.000 0.002
3 0.028 0.022 0.027 0.019 0.001 -0.010 -0.017*** -0.024*** 0.007* 0.000 -0.009* 0.009 -0.001 -0.010*** 0.009**
* significant at the 0.10 level ** significant at the 0.05 level *** significant at the 0.01 level

90
Results in Table 25 suggest that after the takeovers, the LI group has relatively better
operating performance than the LD group in all scenarios. This implies that the LI group enjoys
relative more improvement in external monitoring than the LD group, which supports the
argument of Holmstrom and Tirole (1993).
3.4.4 Comparison of Changes in Bidders’ Tobin’s Q, Blockholder/Institutional Holdings
I present the results of changes in Tobin’s Q between the LI and the LD groups in Table 26.
The industry-adjusted Tobin’s Q for the LI group goes from 0.103 one year before the
takeover to -0.032 one year after the takeover. The industry-adjusted Tobin’s Q for the LD group
changes from 0.088 to -0.191 in the corresponding period, with a significant decrease of -0.259.
The test further shows that the LD group has significantly greater decrease in Tobin’s Q than the
LI group. If I examine the raw Tobin’s Q, results are very similar. Similar to the negative alphas
I documented when examining the long-term performance of the LI and the LD groups, the
negative industry-adjusted Tobin’s Q are also consistent with the findings of Moeller,
Schlingemann and Stulz (2005). In short, my results suggest that the LD group has significantly
more decreases in Tobin’s Q than the LI group. This finding is consistent with the Holmstrom
and Tirole (1993) prediction that liquidity has a positive impact on external monitoring.
I report changes in institutional holdings/block holdings of the LI and the LD groups in
Table 27. Concentrated shareholdings by institutions or by blockholders can increase managerial
monitoring and are treated as two different external monitoring mechanisms (For example,
Agrawal and Knoeber, 1996). Holmstrom and Tirole (1993) argue that liquidity improves
external monitoring, and thus it is reasonable to expect that the LI group will have more
concentrated shareholdings by institutions/large blockholders than the LD group.

91
Table 26. Tobin’s Q
This table presents the raw and the industry adjusted Tobin’s Q for the liquidity-improved and the liquidity-decreased bidders. Tobin s Q is measured as the market value of assets divided by the book value of assets. The market value of assets is the sum of the book value of assets at each fiscal year end and the market value of common stocks at the corresponding calendar year end, subtracting the book value of common stock and deferred taxes. The numbers reported are medians or medians of paired differences.
* significant at the 0.10 level ** significant at the 0.05 level *** significant at the 0.01 level
Raw Industry-adjusted Year LI LD Difference LI LD Difference -3 1.607 1.582 0.053 0.012 -2 1.613 1.613 0.064 0.046 -1 1.665 1.615 0.103 0.088 1 1.422 1.260 -0.032 -0.191 -0.152*** -0.287*** 0.135*** -0.111*** -0.259*** 0.148***
2 1.324 1.236 -0.104 -0.129 -0.232*** -0.277*** 0.045 -0.186*** -0.229*** 0.043
3 1.323 1.274 -0.138 -0.135 -0.267*** -0.257*** -0.01 -0.207*** -0.229*** 0.022

92
Table 27. Changes in Bidders’ Blockholders around the Takeover
This table presents the changes in bidders’ block holders /institutional investors around the takeovers. Numbers reported are medians.
Year LI LD Difference LI LD Difference Panel A: All institutional investors
No. of institutional investors Percentage held by institutional investors -1 50 45 46.0 43.3 +1 70 43.5 55.8 44.7
Change 13*** 2*** 11*** 0.040*** -0.000 0.040*** Panel B: All blockholders
No. of block holders Percentage held by all blockholders -1 2 2 22.15 23.2 +1 2 3 21.35 26.1
Change 0 0 0 0 0 0 Panel C: Outside Blockholders
No. of outside blockholders Percentage held by outside blockholders -1 2 2 18.5 16.27 +1 2 2 18.9 19.94
Change 0 0 0 0.035 2.45** 2.10 * significant at the 0.10 level ** significant at the 0.05 level *** significant at the 0.01 level

93
Panel A of Table 27 shows that both the LI group and the LD group has more number of
institutional investors after the takeover, but the LI group has significantly more increase in the
number of institutional investors than the LD group. Furthermore, the institutional holdings of
the LI group increases from 46 percent to 55.8 percent after the takeover, while the institutional
holdings of the LD group stays unchanged after the takeovers. This finding suggests that the
external monitoring, as measured by the institutional holdings, increases as the liquidity of the
firm improves.
I do not find any significant changes in the number of blockholders (blockholdings) for the
LI and LD groups. Panel C shows that LD group has significantly more concentrated shares held
by outside blockholders after the takeover, but its change is not significantly different from the
corresponding change for the LI group. In short, I do not find any significant difference in
change of blockholdings between the LI and the LD group12.
3.4.5 Check for Business Cycle
One puzzling phenomenon in finance is that merger activities are plentiful in some periods
and low in others. (Harford 2005, for example). To rule out the possibility that my findings
might be driven by merger waves, in Table 28, I divide my sample years into active and inactive
merger- activity-year and re-examine the changes in pricing errors and in ROS (operating
income before depreciation scaled by sales) in each year respectively.
I obtain the number of mergers and acquisitions that involve a U.S target firm from SDC,
and rank the years 1995 to 2001 by the merger activity. The year 1998 is the year that has the
most plentiful merger activity while the year 2001 is the year whose merger activity is the
lowest.
12 The availability of blockholder data from WRD limits the number of observations for these tests.

94
Table 28. Changes in Pricing Errors/Operating Performance in Different Levels of Merger Activity This table presents changes in pricing errors/1-R2/operating performance for the liquidity-improved and the liquidity-decreased bidders based on various levels of merger activity. I divide the sample by low/high merger activity. I obtain from SDC the number of mergers each year for 1995 to 2001 respectively, examine the changes in each year, and report them year by year from the year of high merger activity to the year of low merger activity13. The changes in operating performance refer to the changes in operating income before depreciation divided by sales from year -1 to year 1.
Year Changes in Pricing Errors Changes in Operating Performance
LI LD LI LD 1 1998 -0.001*** 0.0006*** 0.008 -0.004 2 1997 -0.001*** 0.0001 0.007 -0.012 3 1999 -0.001*** 0.0001 0.013 -0.007 4 1996 -0.001*** 0.0011*** 0.014* -0.018 5 2000 -0.001*** 0.0002** 0.009 0.004 6 1995 -0.001*** 0.0004** 0.000 -0.001 7 2001 -0.000*** -0.0002 0.000 -0.002
* significant at the 0.10 level ** significant at the 0.05 level *** significant at the 0.01 level
13 I obtain the number of mergers from SDC, with one restriction: the target is a US target firm. The result is: 1998- 15012; 1997-13235; 1999-13139; 1996-12538; 2000-12468; 1995-10923; 2001-8663

95
I do not find any evidence suggesting that my findings in this essay are driven by merger
wave. Actually, I cannot detect any relations between the changes in pricing errors/ROS and the
activeness of mergers and acquisitions.
3.4.6 Endogeneity and Causality Issues
Overall, my findings suggest that liquidity improves external monitoring, as shown in the
changes in Hasbrouck (1993) pricing errors, and changes in institutional holdings. I also show
that the LI group has significantly better operating performance than the LD group, suggesting a
positive impact of the improvements in liquidity and in external monitoring on firms’ operating
performance. Still there are two concerns that need to be addressed.
First, I find a positive relationship between liquidity and external monitoring or operating
performance. Holmstrom and Tirole (1993) suggest that the causality runs from liquidity to
external monitoring/operating performance. However, it is possible that the causality runs the
opposite, though the theory underlying this opposite prediction is weak. One way to distinguish
these two opposing predictions is to see whether the changes in liquidity lead the changes in
external monitoring/operating performance. The research design and results in this essay
suggests that the causality runs from operating performance to liquidity. The changes in liquidity
detected are in the window (1, 80) after the effective date of the takeover, but the changes in
operating performance are in the first three fiscal years after the effective date of the takeover.
The changes in liquidity precede the changes in operating performance.
Another concern is the possibility that the same factors which lead to the changes in
liquidity also lead to the changes in external monitoring and operating performance. I examine
this problem in Table 29.

96
Table 29. Determinants of Changes in Pricing Errors and Changes in Operating Performances This table presents of the results of examining the determinants of changes in pricing errors and changes in operating performances. In particular, I use 2sls to examine the following regression
liquidityiablescontrolorspricingerreperformanc Δ+=Δ var/ where )min(det antserfliquidity =Δ
The control variables include bidder size change and a dummy of whether the acquisition is related. The determinants or the instrumental variables for changes in liquidity include method of payment (1 if it is cash takeover, and 0 otherwise), whether the target is a public listed firm (1 if the target is public listed and 0 otherwise), changes in trading volume, changes in analysts’ coverage, changes in number of market makers, changes in price and deal value. Changes in operating performance are the changes in operating income before depreciation divided by sales from year -1 to year 1.
Changes in Pricing Errors Changes in Operating Performance
Intercept -0.013*** -0.245* (-3.69) (-1.63)
Changes in Relative Spreads 0.0065** -0.372*** (2.34) (-2.68)
Bidder Size 0.002*** 0.033 (3.43) (1.33)
Same Industry -0.001 0.197*** (-0.36) (2.62)
Public -0.066** -0.090** (-2.14) (-2.23)
Method of Payment_Cash 0.022 0.042 (0.80) (1.17)
Log Δ # Analysts -0.075* -0.05 (-1.93) (-0.98)
Log Δ # Market Makers -0.288*** -0.239*** (-7.47) (-4.31)
Log Δ Trading Volume -0.109*** -0.130*** (-5.10) (-4.21)
Log deal value -0.020** -0.022* (-2.15) (-1.84)
Log Δ Price -0.406*** -0.341*** (-9.98) (-6.22)
Adjusted R-square 0.027 0.043 Number of Observations 545 325
* significant at the 0.10 level ** significant at the 0.05 level *** significant at the 0.01 level

97
In essay one, I find that the improvements in liquidity is driven by changes in firm
characteristics for successful bidders after they complete their takeovers, such as changes in
number of market makers, changes in number of analysts etc. In Table 29, I include these
variables as instrumental variables for changes in liquidity, and examine cross-sectionally the
relation between changes in operating performance (in pricing errors) and changes in liquidity
using 2SLS. In particular, the 2SLS is designed as:
liquidityiablescontrolorspricingerreperformanc Δ+=Δ var/
where )min(det antserfliquidity =Δ
The control variables include change in bidder size and a dummy of whether the acquisition
is related. The determinants or the instrumental variables for changes in liquidity include method
of payment, whether the target is a public listed firm, changes in trading volume, changes in
analysts’ coverage, changes in number of market makers, changes in price and deal value.
shows that cross-sectionally, changes in liquidity have a significant impact on both changes
in pricing errors and changes in operating performance. Particularly, changes in pricing errors
are significantly positively related with changes in liquidity. The more improvements in liquidity,
the lower the pricing errors. Changes in operating performance are also significantly related with
changes in liquidity. Improvements in liquidity significantly improve bidders’ operating
performances. Furthermore, results in Table 10 are also consistent with my findings in essay one
of the determinants of changes in liquidity.
In summary, the results shown in Table 29 support the prediction of Holmstrom and Tirole
(1993) that improvements in liquidity lead to improvements in external monitoring, as measured
by changes in Hasbrouck (1993) pricing errors, and improvements in operating performance.

98
3.5 Conclusions
Though theories (Holmstrom and Tirole, 1993) suggest that greater liquidity leads to more
active market monitoring, to my knowledge, no one has empirically test these predictions yet. I
seek to fill in this void in this essay. In particular, I examine empirically the relation between
changes in liquidity and changes in stock price informativeness, and the relation between
changes in liquidity and changes in operating performances/firm value/institutional holdings. I
find that improvements in liquidity lead to improvements in the firm’s price informativeness and
the firm’s operating performances. In addition, I also find that liquidity has a positive impact on
institutional holdings, which is another proxy for external monitoring. My findings are not
influenced by the business cycle/merger waves. In sum, results in this essay support the
predictions of Holmstrom and Tirole that liquidity improves external monitoring.
Second, extant literature has examined the discipline effect of corporate control on the
bidder mainly from the management turnover perspective. This essay examines the discipline
effect of corporate control on the bidder from a different perspective - monitoring from the stock
market.
Third, evidences from this essay could also shed light on the mixed results of post-takeover
performance. Not all takeovers have improvements in liquidity, and if liquidity influences a
firm’s performances through market monitoring, then the effect of takeovers on the bidder’s
post-takeover performance will naturally differ.

99
Chapter 4 Liquidity and Corporate Governance: An Examination of Changes in Corporate Governance for Successful
Bidders
4.1 Introduction
In this essay, I examine the relation between liquidity and corporate governance. My
analysis is motivated by competing theoretical predictions. Bhide (1993) argues that liquidity
hinders effective corporate governance and discourages internal monitoring because unhappy
shareholders can more easily sell their shares. His argument suggests that a less liquid stock
forces large unhappy shareholders to hold on to their investments and to take actions to improve
the company’s performance. In contrast, Maug (1998) derives an equilibrium, in which a large
shareholder does not have enough initial stake (in the sense that the capital gain on this initial
stake does not cover his cost of monitoring) and part of his incentive to monitor depends on his
ability to purchase more shares at a price that does not yet reflect the large shareholder’s
improvements. Additionally, based on Holmstrom and Tirole (1993), liquidity could influence a
company’s internal monitoring mechanisms by improving the information content of the stock
price.14 A more informative price enables the firm to design more efficient compensation
contracts.
I examine two research questions: (1) Does improvement in liquidity lead to more efficient
managerial contracts for the company, implying a better internal monitoring? (2) Does
improvement in liquidity lead to a more efficient corporate board, which also implies better
corporate internal governance? To shed light on these questions, I study changes in governance
characteristics and executite compensation for two samples of bidders in successful acquisitions,
14 In essay two, I find that liquidity improves the information content of a company’s stock price.

100
one in which liquidity improves after the acquisition (LI group) and another in which liquidity
decreases (LD group).
Examining 332 acquisitions from April 1, 1995 to December 31, 2001, I find that the
absolute cash compensation increases significantly for the LI eroup. For the percentage of each
form of compensation to the total compensation, I find that the LI group has significantly greater
cash compensation and significantly smaller equity-based compensation. I also find that the
pay-for-performance sensitivities of executive compensation, measured as the incentive-intensity
of stock options awards and mix of stock option award to cash compensation, decline
significantly for the LI group after the acquisitions. These findings support the proposition that
liquidity improves the information content of the firm’s stock price, which enables the firm to
design more efficient compensation contracts (Holmstrom and Tirole, 1993). As liquidity
improves, the stock price becomes more informative and reflects the manager’s actions more
quickly, which makes the firm more transparent. Thus, the findings that LI executives receive
more cash and lower PPS appear to support the notion that the need to tie compensation to stock
price performance relates inversely to the ability to observe the manager’s actions (e.g.,
Holmstrom, 1979; Shavell, 1979). These results also seem to be compatible with an equilibrium
that results from a bargaining framework. Presumably, as a firm becomes more transparent,
managers can consume fewer perquisites. In this case, they will bargain for more cash.
Additionally, Hermalin (2005) suggests that CEOs who are monitored more intensely will
bargain for higher compensation.
For the LD group, I find that their absolute cash, stock and total compensation all decrease
significantly after the takeovers. The changes in pay-for-performance sensitivity measures are
mixed. The pay-for-performance sensitivity measured as the incentive-intensity of stock option

101
awards decrease significantly while the pay performance sensitivity measured as the mix of stock
option award to cash compensation increases significantly.
I do not find significant differences between changes in board characteristics of the LI and
the LD groups. I do not find many significant changes in the compensation packages for
directors of the LI and the LD groups either. In sum, although the results of my study suggest
that liquidity improve contracting, I do not find support for the premise that it influences internal
monitoring.
The subject of corporate governance has attracted much attention recently. Most researchers
examine corporate governance from an agency perspective –the separation of ownership and
management. Effective corporate governance is believed to be able to align the incentives of the
managers to those of the shareholders, and incentive contracts and board of directors are two
important mechanisms in building effective corporate governance. Researchers have extensively
examined the factors that influence the efficacy of incentive contracts and board of directors.
However, I am not aware of any empirical examination of the impact of liquidity on corporate
governance. My paper seeks to fill in this void.
In addition to providing evidence on the relation between liquidity and corporate governance,
my findings improve our understanding of the characteristics of evolving corporate governance.
Kini, Kracaw and Mian (2004) find that internal control mechanisms become more prominent
and more effective in the recent years, and the takeover market plays a reduced role in
disciplining management. Holderness, Kroszner and Sheehan (1999) find that managerial
ownership of publicly traded firms in 1995 is higher than that in 1935. They argue that lower
volatility and greater hedging opportunities are two important factors in explaining the increase
in managerial ownership. This essay suggests that the improvement in liquidity associated with

102
the development of the U.S. financial markets (e.g., changes in tick size, requirements on more
disclosure, etc) could also be a factor.
The remaining of this essay is organized as follows. Section 2 describes the methods.
Section 3 discusses the empirical results and section 4 concludes.
4.2 Data
I obtain the LI and the LD groups from my dissertation essay 2. I obtain executive
compensation data and board compensation data from the Standard & Poor’s ExecComp
database. I collect data on each executive’s salary, bonus, the value/number of stock options
granted, the value of restricted stocks granted, market price of the company’s stock on the date
the option was granted, and the executive’s ranking within the company by his salary and bonus.
I collect data on the annual cash retainer to each director, the fee paid for each meeting attended,
the number of meeting, the number of stocks granted and the number of options granted.
I obtain the director characteristics data from the Investor Responsibility Research Center
(IRRC) director data. For the firms that are not covered by the IRRC, I collect its board
information from the company’s proxy statements. In addition, I collect the governance-index
data (Gompers, Ishii and Metrick, 2003) from the IRRC governance data.
4.3 Methods
4.3.1 Executive Compensation
4.3.1-1 Compensation Compositions
I examine and compare the compensation compositions for the LI and the LD groups. I
examine and compare changes in cash, restricted stocks, stock options, equity-based
compensation and total compensation between the LI and the LD groups. I examine these

103
changes in both the absolute level and the relative level. In addition, to be comprehensive, I
study the compensation packages for both the CEOs and other top executives of each company.
My sample includes takeovers from 1995 to 2001, a period when the use of equity-based
compensation for US CEOs/executives increased significantly. To control for the trend effect, I
identify an industry- and size- matched control firm for each firm in the sample. To construct this
control sample, I first identify firms that have the first two-digit SIC code as the sample firm.
Among these firms, I mark the firms whose size lies within 30% of the sample firm, and then
choose among these firms one control firm with the most similar size. If no control firm can be
obtained using this method, I use one digit SIC code to identify firms that are in the same
industry as the sample firm, mark the firms whose size lies within 30% of the sample firm, and
choose one control firm with the most similar size. If still no control firm can be obtained, I
choose the control firm as the one that has the same first two-digit SIC code as the sample firm
and is closest in size as the sample firm15.
In examining the compensation compositions of CEOs and other top executives, I examine
the restricted stocks and stock options awards separately because though both awards are
equity-based, there are important differences between these two instruments. Stock option
awards do not affect earnings (since they are almost all granted at the money), but restricted
stock awards result in compensation expenses. Stock options are typically not dividend protected,
while restricted stock provides CEOs with dividend rights (Kole, 1997). More importantly, since
the value of stock options is convex in stock price and the value of restricted stocks is linear in
stock price, these two instruments influence the behaviors of risk-averse managers differently.
15 Johnson, Ryan and Tian (2004) examine the potential problems with using matches that are outside the 30% bounds and find that results are qualitatively similar if they use only matches that are inside the 30% bounds.

104
As Ryan and Wiggins (2001) point out, with restricted stock awards, CEOs are likely to give up
value-increasing risky projects and therefore lead to an underinvestment problem.
4.3.1-2 Pay-for-Performance Sensitivity: Stock Options and Restricted Stocks
I apply the methods of Bryan, Hwang and Lilien (2000) and calculate the
pay-for-performance sensitivity measures of new stock option awards and new restricted stock
awards of the LI and the LD groups. These pay-for-performance sensitivity measures are
calculated using the equity awards data for the particular year only (flow data). I estimate the
incentive-intensity of stock options awards, the mix of stock option awards, the
incentive-intensity of restricted stock awards, and the mix of restricted stock awards of the top
executives/CEOs. I control for industry and size when examining these pay-for-performance
sensitivity measures.
Bryan, Hwang and Lilien (2000) measure the incentive intensities provided by annual CEO
stock option awards as the change in stock option awards per $1,000 change in market value of
equity.
Incentive-Intensity of Stock Option Awards=
000,1$)gOutstandin Shares ofNumber
Granted Options ofNumber ()P
Option( share ××
∂∂
When calculating the partial derivative of stock options, I assume that the option has a
7-year time to maturity. Most options have a stated life of 10 years, but executives seldom wait
till the expiration date to exercise their options. So, following the method described in
ExecComp, I reduce the stated life of 10 years by 30% and assume that the executive option has
a 7-year time to maturity.
Mix of Stock Option Awards=Bonus plusSalary
Granted) Options ofNumber Option( share ×

105
This measure calculates the relative use of stock option awards to cash compensation. Cash
compensation is calculated as the sum of salary and bonus. Option value is the Black-Scholes’
option value.
For restricted stocks, following Bryan et al. (2000), I measure the Incentive-Intensity as
000,1$)gOutstandin Shares ofNumber
Granted Options ofNumber ()P
R( share ××
∂∂ tockestrictedS
.
Since the restricted stock is always granted at the stock price on the grant date, therefore, the
partial derivative of restricted stock price to stock price equals to 1. As a result,
Incentive-Intensity of Restricted Stock Grants
= 000,1$gOutstandin Shares ofNumber
Granted Stocks Restricted ofNumber ×
Finally, I calculate the relative use of restricted stock awards to cash compensation as: Mix
of Restricted Stock Awards= Bonus plusSalary
Awarded Stocks Restricted of ValueFair
Similar to the reasons expressed above, I calculate the pay-for-performance sensitivity
measures for stock options and restricted stocks separately because their monitoring or incentive
effects are not exactly the same, especially to companies with greater investment opportunities.
To calculate them separately can help us understand the relation between liquidity and
compensation better.
As I mentioned above, I calculate the pay-for-performance sensitivities using the flow data,
that is, I only use the equity awards data for the particular year to estimate the
pay-for-performance sensitivities. I do not use the executive’s total stock and option portfolio
data to estimate these pay-for-performance sensitivities. In this essay, I examine the effect of the
change in liquidity on executives’ pay-for-performance sensitivities. What I am interested in is

106
how changes in liquidity influence bidders’ behavior/methods in awarding their executives.
Therefore, to examine the flow data is more suitable
4.3.2 Board Characteristics
4.3.2-1 Board Characteristics
I examine the changes in the board characteristics for the LI and LD groups to see whether
liquidity has an impact on the effective board governance. The characteristics I examine include:
board size, percentage of insider directors on the board, the number of board meetings, the
number of board committees, and whether the CEO is also the chairman of the board and. It has
been argued that small boards of directors are more effective. Lipson and Lorsch (1992) argue
that as board size increases, directors become more reluctant to criticize top managers’ policies
and to carry candidate discussions. Jensen (1993) argues that “when boards go beyond seven or
eight people they are less likely to function effectively and are easier for CEO to control”.
Yermack (1996) document an inverse relation between board size and firm value. It is also
believed that a board with more independent directors performs more effectively16. Weisbach
(1988) reports that CEO turnover is more closely related with firm performance when outside
directors dominate the firm’s board. Hermalin and Weisbach (1989) find that after a firm
performs poorly, an outside director is more likely to join the board. Rosenstein and Wyatt (1990)
find significant positive share price reactions surrounding outside director appointments.
Furthermore, Vafeas (1999) finds that board activity, measured by board meeting frequency, also
measures the board efficiency. In addition, the number of board committees/whether the CEO
chairs the board also influence the board effectiveness, though their net effect is still an empirical
question.
16 Some extant literature document that a board with fewer insider director actually has lower value than those that have more insider directors.

107
4.3.2-2 Compensation Packages of Board of Directors
Ryan and Wiggins (2004) examine the relations between director compensation and
board-of-director independence. They find that directors’ compensations are more closely tied
with shareholders’ interests when the board is more independent. They also find that an
independent board is associated with weaker manager power. From Ryan and Wiggins, it is
reasonable to argue that the structure of director compensation could reflect the level of internal
monitoring, though it is also influenced by other firm characteristics factors, as market-to-book
ratio. Therefore, in addition to examining the board characteristics of the LI and the LD groups, I
also examine the director compensation package for the bidders.
I examine and compare changes in annual cash retainer to each director, fee paid per
meeting to each director, value of stocks grants to all directors and value of option grants to all
directors for the LI and the LD groups. I control for industry and size when examining these
changes.
4.3.3 Other Measures
I examine and compare changes in director stock holdings of the LI and the LD groups. I
examine and compare changes in the Governance-index (Gompers, Ishii and Metrick 2003) for
the LI and the LD groups. Gompers, Ishii and Metrick use the incidence of 24 governance rules
and construct a “Governance-Index” to proxy for shareholder rights. The 24 governance rules
include the governance provisions as golden parachutes, poison pills, cumulative voting etc.
Gompers et al. argue that the higher the Governance-Index, the lower the protection shareholders
of that company obtain.

108
4.4 Empirical Results
4.4.1 CEO/Top Executives’ Compensation Packages
Table 30 exhibits industry and size adjusted (in the following, I use adjusted to represent for
industry and size adjusted) changes in CEO compensation compositions between the LI and the
LD groups. Panel A presents changes in absolute dollar value of each form of compensation for
CEOs and Panel B presents changes in the percentage of each form of compensation. I report
both medians and means in Table 30. The values reported in the parenthesis are means. For ease
of exposition, I discuss medians but the results of the means are actually similar.
For the LI group, Panel A shows that its adjusted cash compensation is $89,448 before the
takeover. It increases significantly to $174,087 after the takeover. For the absolute restricted
stock, option and total compensation, the LI group has increases, though not significant, in all of
them. In results not reported, I examine changes in the unadjusted compensations for the LI
group. I find that the LI group has significant increases in all forms of compensations. For
example, it has a significant increase of $355,962 in its total compensation. Panel B shows that
as a percentage of total compensation, the cash compensation for the LI group increases
significantly (a significant increase of 1.899%) after the takeover while the equity-based
compensation decreases significantly (a significant decrease of 1.899%).
The findings for the LI group support Holmstrom and Tirole (1993). Holmstrom and Tirole
(1993) argue that liquidity improves the information content of the stock price, and a more
informative price system enables the firm to design more efficient compensation contracts. I find
that price becomes more informative for the LI group after the acquisitions, therefore its price
becomes more sensitive to mangers’ behaviors. Holmstrom (1979) and Shavell (1979) show that

109
Table 30. Changes in CEO Compensation Package
This table exhibits industry and size adjusted changes in CEO compensation compositions between the LI and the LD groups. Panel A presents changes in absolute dollar value of each form of compensation for CEOs while Panel B presents changes in the percentage of each form of compensation. I report both median and mean in this table. The values reported in the parenthesis are means.
LI Group LD Group Before After Change Before After Change
Difference in Change
Panel A: Absolute dollar value of each form of compensation (thousand)
Cash compensation 89.448 174.087 139.665*** 61.139 -53.558 -136.561** 276.226*** (79.154) (318.493) (239.339**) (9.495) (-141.994) (-151.488) (390.827***)
Restricted stock awards 0.000 0.000 0.000 0.000 0.000 0.000 0.000 (37.833) (-16.520) (-54.353) (4629.821) (-187.951) (-4817.771) (4763.418)
Stock option awards 96.579 51.365 31.615 479.221 86.198 -915.843*** 947.458*** (964.385) (1408.552) (436.653) (2092.733) (-112.696) (-2205.429***) (2642.082***)
Equity-based compensation 183.340 180.829 31.615 500.971 257.801 -987.962*** 1019.577*** (1002.218) (1381.322) (374.215) (6722.554) (-300.646) (-7023.201*) (7397.416***)
Total compensation 288.639 372.015 58.329 594.926 106.647 -1168.820*** 1227.149*** (1081.372) (1696.874) (613.744) (6732.049) (-442.640) (-7174.689*) (7788.433***)
Number of Observations 215 215 215 117 117 117

110
(Table 30 cont.)
LI Group LD Group Before After Change Before After Change
Difference in Change
Panel B: Percentage of each form of compensation to total compensation (%
Cash compensation/total compensation -9.774 0.000 1.899* -17.452 -3.310 6.092*** -4.193** (-6.256) (0.873) (7.143***) (-14.357) (-3.297) (10.786***) (-3.644**)
Restricted stock awards/total compensation 0.000 0.000 0.000 0.000 0.000 0.000 0.000
(0.282) (-2.071) (-2.215*) (2.442) (0.375) (-2.064) (-0.151)
Stock option awards/total compensation 4.341 0.551 -0.541* 12.386 4.267 -6.092*** 5.551** (5.974) (1.198) (-4.927) (11.914) (2.922) (-8.722***) (3.795**)
Equity-based compensation/total compensation 9.774 0.000 -1.899* 17.452 3.310 -6.092*** 4.193*
(6.256) (-0.873) (-7.143***) (14.357) (3.297) (-10.786***) (3.644*) Number of Observations 215 215 215 117 117 117
* significant at the 0.1 level ** significant at the 0.05 level *** significant at the 0.01 level

111
in this case (when the agent’s actions are more observable), the optimal contract is to pay with
cash.
For the LD group, its adjusted absolute cash compensation decreases significantly of
$136,561, and this change is significantly different from the change in the LI group. The LD
group also has significant decreases in other forms of compensation. Its total adjusted
compensation decreases at $1,168,820. As a percentage of total compensation, the LD group has
significant increases in cash and significant decrease in equity. These findings are puzzling.
Table 31 displays industry and size adjusted changes in top executives’ compensation
packages between the LI and the LD groups. Top executives here refer to the Top 5 executives in
terms of total cash compensation in each company (salary plus bonus). Therefore, for firms with
fewer than 5 executives’ compensation data available in ExecComp, I include all of them in
analysis; for firms with more than 5 executives’ compensation data available, I only include the
data of the top 5. In addition, I include in analysis those executives whose rank in terms of cash
compensation is not disclosed in ExecComp. Panel A presents changes in the absolute dollar
value of each form of compensation while panel B presents changes in the relative level of each
form of compensation.
Overall, results of changes in top executives’ compensation tell a similar story as changes in
CEO’s compensations. At the level of absolute compensation, LI group has significantly
increases in the cash compensation but the LD group does not. The equity-based compensation
of LI group, on average, stays similar, while the equity-based compensation of LD group
decreases significantly after the takeovers. At the percentage level of each form of compensation,
the LI group has no significant change after the takeovers, but the LD group has a significant

112
Table 31. Changes in Top Executives’ Compensation Package
This table displays industry and size adjusted changes in top executives’ compensation packages between the LI and the LD groups. Top executives here refer to the Top 5 executives in terms of total cash compensation in each company (salary plus bonus). Therefore, for firms with fewer than 5 executives’ compensation data available in ExecComp, I include all of them in analysis; for firms with more than 5 executives’ compensation data available, I only include the data of the top 5. In addition, I include in analysis those executives whose rank in terms of cash compensation is not disclosed in ExecComp Panel A presents changes in the absolute dollar value of each form of compensation while panel B presents changes in the relative level of each form of compensation. The values reported in the parenthesis are means.
LI Group LD Group Before After Change Before After Change
Difference in Change
Panel A: Absolute dollar value of each form of compensation (thousand)
Cash compensation 46.274 101.335 22.073** 12.427 -15.255 -64.450 86.523*** (81.101 ) (154.235 ) (73.134** ) (-1.153 ) (-33.283 ) (-32.130 ) (105.264*** )
Restricted stock awards 0.000 0.000 0.000 0.000 0.000 0.000 0.000 (36.771 ) (8.106 ) (-28.665 ) (824.853 ) (-109.533 ) (-934.385 ) (905.720 )
Stock option awards 46.895 94.140 6.246 174.340 71.882 -302.392*** 308.638*** (219.687 ) (494.945 ) (276.244 ) (742.194 ) (-310.985 ) (-1053.179*** ) (1329.423*** )
Equity-based compensation 81.485 96.346 18.298 214.889 75.099 -418.265*** 436.563*** (255.726 ) (510.043 ) (252.265 ) (1864.068 ) (-427.222 ) (-2291.290** ) (2543.555*** )
Total compensation 110.432 167.305 31.855 206.980 130.115 -466.430*** 498.285*** (333.230 ) (668.096 ) (336.114 ) (1864.125 ) (-458.641 ) (-2322.766** ) (2658.881*** )
Number of Observations 1927 1927 1927 1060 1060 1060

113
(Table 31 cont.)
LI Group LD Group Before After Change Before After Change
Difference in Change
Panel B: Percentage of each form of compensation to total compensation (%)
Cash compensation/total compensation -4.969 0.486 4.940 -13.753 -4.168 3.834*** 1.106 (-3.543 ) (-0.727 ) (3.133 ) (-10.260 ) (-3.140 ) (7.121*** ) (-3.987 )
Restricted stock awards/total compensation 0.000 0.000 0.000 0.000 0.000 0.000 0.000
(0.350 ) (-1.559 ) (-2.003** ) (1.393 ) (0.252 ) (-1.140 ) (-0.862 )
Stock option awards/total compensation 4.050 6.022 0.608 9.467 4.679 -1.081** 1.689* (3.193 ) (2.286 ) (-1.131 ) (8.868 ) (2.887 ) (-5.980** ) (4.849* )
Equity-based compensation/total compensation 4.969 -0.486 -4.940 13.753 4.168 -3.834*** -1.106
(3.543 ) (0.727 ) (-3.133 ) (10.260 ) (3.140 ) (-7.121*** ) (3.987 )Number of Observations 1927 1927 1927 1060 1060 1060
* significant at the 0.1 level ** significant at the 0.05 level *** significant at the 0.01 level

114
increase in the percentage of cash compensation (a significant increase of 3.834) and a
significant decrease in percentage of stock option awards percentage.
Table 32 displays the adjusted changes in executives’ pay-for-performance sensitivities for
the LI and the LD groups after the acquisitions. Panel A presents the results for the CEO’s
pay-for-performance sensitivities while Panel B presents the results for the top executives’
pay-for-performance sensitivities.
Panel A of Table 32 shows that after the acquisitions, the pay-for-performance sensitivity,
measured as the incentive-intensity of stock option awards and the mix of stock option award to
cash compensation, decreases significantly for the LI group. The Incentive-Intensity of Stock
Option Award decreases from 0.707 to 0.045 and the Mix of Stock Option Award to Cash
Compensation decreases from 0.324 to 0.115. The changes of the pay-for-performance
sensitivity measures for the LD group are mixed. Its incentive-intensity of stock option awards
decreases significantly but its mix of stock option award to cash compensation increases
significantly. I do not observe many significant differences in changes between the LI and the
LD groups except for the Mix of Stock Option Award to Cash Compensation. The LI group has a
significant decrease of -0.181 while the LD group has a significant 0.202 increase after the
acquisition. Furthermore, the 0.202 increase for the LD group is significantly different from the
-0.181 decrease for the LI group.
4.4.2 Board Characteristics and Board Compensation
Table 33 exhibits changes in board characteristics, director stock holdings and
governance-index (Gompers, Ishii and Metrick 2003) of the LI and the LD groups from one year
before the announcement date of the takeover to one year after the effective date of the takeover.
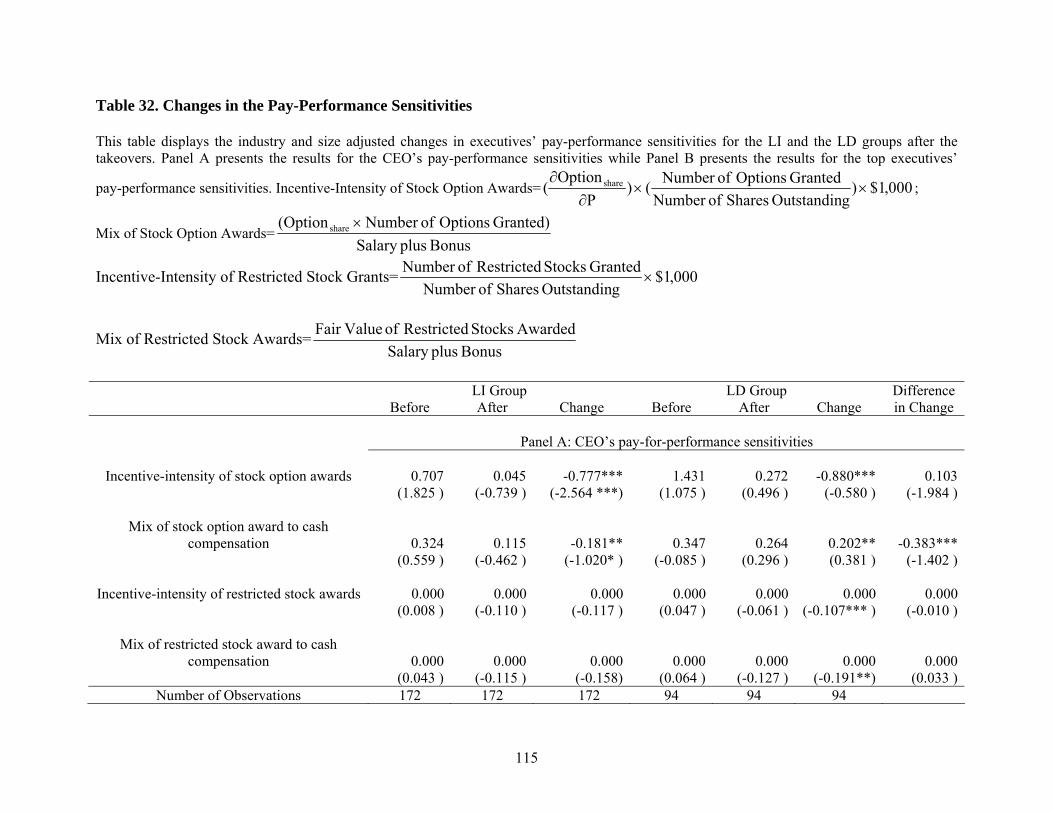
115
Table 32. Changes in the Pay-Performance Sensitivities This table displays the industry and size adjusted changes in executives’ pay-performance sensitivities for the LI and the LD groups after the takeovers. Panel A presents the results for the CEO’s pay-performance sensitivities while Panel B presents the results for the top executives’
pay-performance sensitivities. Incentive-Intensity of Stock Option Awards= 000,1$)gOutstandin Shares ofNumber
Granted Options ofNumber ()P
Option( share ××
∂∂
;
Mix of Stock Option Awards=Bonus plusSalary
Granted) Options ofNumber Option( share ×
Incentive-Intensity of Restricted Stock Grants= 000,1$gOutstandin Shares ofNumber
Granted Stocks Restricted ofNumber ×
Mix of Restricted Stock Awards=Bonus plusSalary
Awarded Stocks Restricted of ValueFair
LI Group LD Group Before After Change Before After Change
Difference in Change
Panel A: CEO’s pay-for-performance sensitivities
Incentive-intensity of stock option awards 0.707 0.045 -0.777*** 1.431 0.272 -0.880*** 0.103 (1.825 ) (-0.739 ) (-2.564 ***) (1.075 ) (0.496 ) (-0.580 ) (-1.984 )
Mix of stock option award to cash compensation 0.324 0.115 -0.181** 0.347 0.264 0.202** -0.383***
(0.559 ) (-0.462 ) (-1.020* ) (-0.085 ) (0.296 ) (0.381 ) (-1.402 )
Incentive-intensity of restricted stock awards 0.000 0.000 0.000 0.000 0.000 0.000 0.000 (0.008 ) (-0.110 ) (-0.117 ) (0.047 ) (-0.061 ) (-0.107*** ) (-0.010 )
Mix of restricted stock award to cash compensation 0.000 0.000 0.000 0.000 0.000 0.000 0.000
(0.043 ) (-0.115 ) (-0.158) (0.064 ) (-0.127 ) (-0.191**) (0.033 )Number of Observations 172 172 172 94 94 94
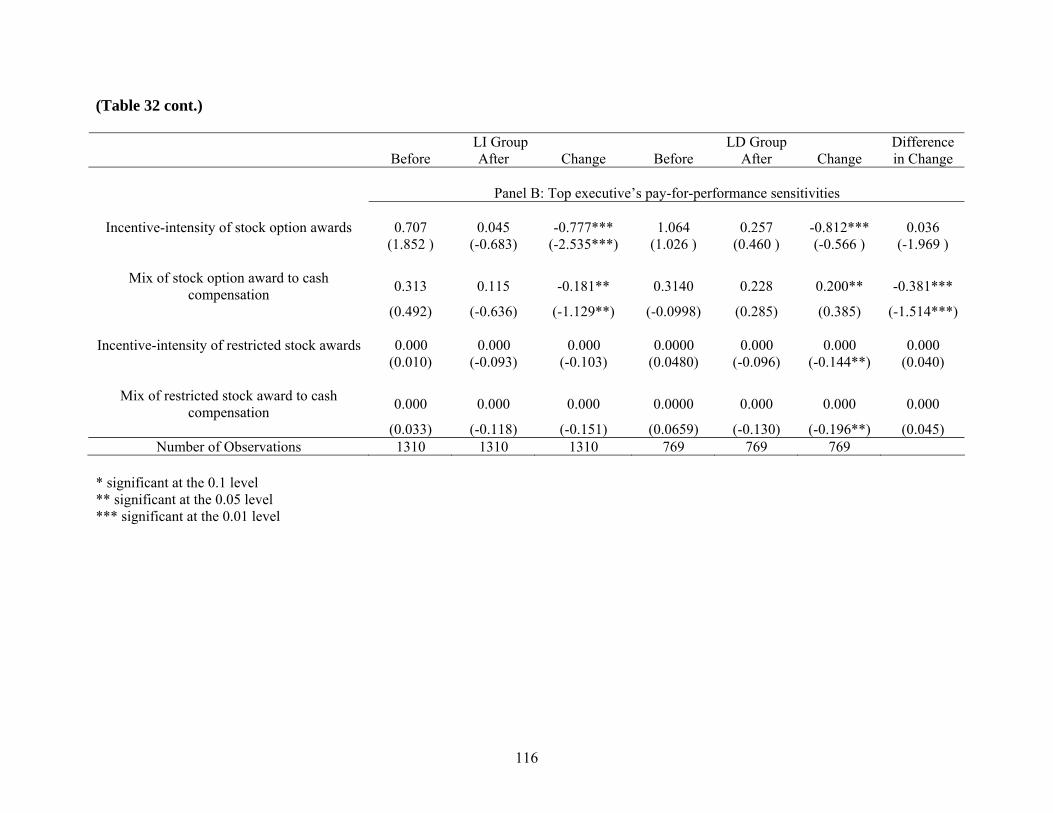
116
(Table 32 cont.)
LI Group LD Group Before After Change Before After Change
Difference in Change
Panel B: Top executive’s pay-for-performance sensitivities
Incentive-intensity of stock option awards 0.707 0.045 -0.777*** 1.064 0.257 -0.812*** 0.036 (1.852 ) (-0.683) (-2.535***) (1.026 ) (0.460 ) (-0.566 ) (-1.969 )
Mix of stock option award to cash compensation 0.313 0.115 -0.181** 0.3140 0.228 0.200** -0.381***
(0.492) (-0.636) (-1.129**) (-0.0998) (0.285) (0.385) (-1.514***)
Incentive-intensity of restricted stock awards 0.000 0.000 0.000 0.0000 0.000 0.000 0.000 (0.010) (-0.093) (-0.103) (0.0480) (-0.096) (-0.144**) (0.040)
Mix of restricted stock award to cash compensation 0.000 0.000 0.000 0.0000 0.000 0.000 0.000
(0.033) (-0.118) (-0.151) (0.0659) (-0.130) (-0.196**) (0.045) Number of Observations 1310 1310 1310 769 769 769
* significant at the 0.1 level ** significant at the 0.05 level *** significant at the 0.01 level

117
Table 33. Changes in Board Characteristics, Director Holdings and Governance-Index This table exhibits changes in board characteristics, as board size, percentage of inside directors, dual CEO/Board Chair, number of committees, number of meetings, and direct stock holdings, of the LI and the LD groups. It also exhibits changes in Governance-Index for the LI and the LD groups. The governance-index is constructed by Gompers, Ishii and Metrick (2003), who use the incidence of 24 governance rules and construct a “Governance-Index” to proxy for shareholder rights.
LI Group LD Group Before After Change Before After Change
Difference in Change
Panel A. Changes in board characteristics
Board Size 9.000 9.000 0.000*** 9.000 9.000 0.000 0.000 (8.724) (9.034) (0.310***) (9.493) (9.746) (0.254) (0.056)
Inside directors 0.200 0.200 0.000 0.226 0.218 0.000 0.000 (0.255) (0.242) (-0.013) (0.263) (0.235) (-0.028***) (0.015)
Dual CEO/chair 1.000 1.000 0.000 1.000 1.000 0.000 0.000 (0.663) (0.694) (0.031) (0.755) (0.623) (-0.132***) (0.163)
Committees 3.000 3.000 0.000 3.000 3.000 0.000 0.000 (3.197) (3.263) (0.066**) (3.321) (3.346) (0.025) (0.041)
Number of meetings 6.000 6.000 0.000 7.000 7.000 0.000 0.000 (6.635) (6.833) (0.197) (7.262) (7.786) (0.524) (-0.327)
Obs 145 145 145 71 71 71

118
(Table 33 cont.)
LI Group LD Group Before After Change Before After Change
Difference in Change
Panel B. Changes in director holdings
Direct Holdings 1053179.000 896183.000 266931.000* 1495429 3058788 385784** -118853 (6271871.809) (5061389.787) (-1210482.021) (3388938.33) (8047701.17) (4658762.8*) (-5869244.82)
Obs 47 47 47 18 18 18
Panel C. Changes in Governance-Index
G-Score 8.50 9.00 0.000 11 11 0.000 0.000 (8.55) (9.39) (0.839***) (10.45) (10.79) (0.345**) (0.494)
Obs. 56 56 56 29 29 29 * significant at the 0.1 level ** significant at the 0.05 level *** significant at the 0.01 level

119
The median board size of the LI group is 9 before the takeover and stays the same after the
takeover, though the mean board size increases significantly of 0.310. The LD group does not
have any significant changes in board size. The difference in changes in board size between these
two groups is not significantly different from zero. The percentage of insider directors of the LI
group does not change significantly after the takeovers, but it decreases significantly for the LD
group in the means. Still, the differences between changes are insignificant. In addition, the mean
number of committees of the LI group increases significantly by 0.066 after the takeover. Panel
B of Table 33 shows that both the LI group and the LD group have significantly increases in
direct stock holdings after the takeover, while the differences in changes between these two
groups are not significantly different from each other. When I examine the Governance-Index for
these two groups in Panel C, I find that there is no significant difference in changes between the
LI and the LD groups.
Overall, I do not observe any significant differences in changes of board characteristics
between the LI and the LD groups after the takeovers.
Table 34 presents industry and size adjusted changes in director compensation for the LI and
the LD groups.
Panel A shows that the annual cash retainer does not change significantly for the LI and the
LD groups after the takeovers. Directors of the LI group get significantly higher pay for their
attendance in board meetings, but directors of the LD group receive statistically similar amount
of payment for their attendance in board meetings. For example, the adjusted cash from meeting
increases from $0 to $600 for the LI group after the takeover, with an increase that is
significantly different from zero. Similarly, the total cash compensation increases significantly

120
Table 34. Board of Director Compensation
This table presents the industry and size adjusted changes in board of director compensation for the LI and the LD groups. Cash from meetings is the produce of fee paid/meeting and meetings of each year. In Panel B, the percentage level of board composition is calculated as the absolute value of each composition divided by the total compensation.
LI Group LD Group Before After Change Before After Change
Difference in Change
Panel A: Absolute level of board compensation (thousand)
Annual Cash Retainer -2.000 -1.000 0.000 -1.000 0.000 0.000 0.000 (-2.062 ) (-1.405 ) (0.657 ) (-2.464 ) (-2.317 ) (0.147 ) (0.510* )
Fee Paid/Meeting 0.000 0.000 0.000 0.000 0.150 0.000 0.000 (0.088 ) (0.157 ) (0.069 ) (-0.037 ) (0.000 ) (0.037 ) (0.032 )
Cash from Meeting 0.000 0.600 1.000*** 0.900 -0.600 -1.000 2.000*** (0.754 ) (1.872 ) (1.136*** ) (-0.461 ) (-0.193 ) (-0.397 ) (1.533*** )
Total Cash Compensation -2.000 0.600 1.500 -2.026 -2.875 -2.000 3.500*** (-1.013 ) (0.818 ) (2.028** ) (-2.867 ) (-3.256 ) (-0.697 ) (2.725*** )
Value of Stock Grants 0.000 0.000 0.000 0.000 0.000 0.000 0.000 (406.156 ) (1297.206 ) (891.049* ) (455.855 ) (7904.954 ) (7449.099** ) (-6558.049 )
Value of Option Grants 0.000 4.697 4.158* 8.527 5.244 0.000 4.158 (-25.744 ) (13.593 ) (50.400 ) (16.726 ) (4.905 ) (-16.659 ) (67.059 )
Total Equity-based Compensation 7.798 25.268 14.985 20.296 29.472 -9.673 24.659 (360.210 ) (1355.377 ) (1004.407* ) (507.948 ) (8189.514 ) (8059.819** ) (-7055.412 )
Total Compensation 11.625 24.085 12.230 24.700 65.275 -14.173 26.403 (344.287 ) (1365.841 ) (958.330 ) (510.658 ) (9231.235 ) (9044.406** ) (-8086.076 )
Number of Observations 198 198 198 92 92 92 92

121
(Table 34 cont.)
LI Group LD Group Before After Change Before After Change
Difference in Change
Panel B. Percentage level of board compensation (%)
Annual Cash Retainer -2.185 -5.348 0.012 -0.226 -0.295 -0.069 0.082 (-8.385 ) (-9.611 ) (-1.226 ) (-5.344 ) (0.465 ) (5.809 ) (-7.035 )
Fee Paid/Meeting -0.274 -0.014 0.009 -0.002 -0.001 0.001 0.007 (-0.912 ) (-0.672 ) (0.240 ) (-0.411 ) (-0.243 ) (0.169 ) (0.072 )
Cash from Meeting -1.264 0.000 0.013 -0.027 -0.032 0.000 0.013 (-4.832 ) (-2.992 ) (1.840 ) (-1.503 ) (-1.550 ) (-0.047 ) (1.887 )
Total Cash Compensation -2.749 -1.265 -0.805 -0.253 -0.327 -0.074 -0.731 (-13.218 ) (-12.603 ) (0.614 ) (-6.847 ) (-1.085 ) (5.762 ) (-5.148 )
Value of Stock Grants 0.000 0.000 0.000 0.000 0.000 0.000 0.000 (7.625 ) (4.954 ) (-2.671 ) (3.479 ) (6.949 ) (3.470 ) (-6.142 )
Value of Option Grants 0.000 0.502 1.028 0.280 0.505 0.000* 1.028*** (5.593 ) (7.650 ) (2.057 ) (3.368 ) (-5.864 ) (-9.233* ) (11.290*** )
Total Equity-based Compensation 2.749 1.265 0.805 0.253 0.327 0.074 0.731* (13.218 ) (12.603 ) (-0.614 ) (6.847 ) (1.085 ) (-5.762 ) (5.148* )
Number of Observations 181 181 181 88 88 88 * significant at the 0.1 level ** significant at the 0.05 level *** significant at the 0.01 level

122
for the LI group, but stays similar for the LD group, and the difference in changes between these
two groups are significantly different from zero.
Panel B shows that for the LI group, the percentage total equity-based compensation
increases insignificantly after the takeover. Still, this increase is significantly greater than the
increase in the LD group.
In summary, Table 34 shows that the board of directors of the LI group receives more
increases in cash payment than the LD group. It also shows that the LI group has relatively more
increases in the percentage of equity-based compensation than the LD group.
4.4.3 Multivariate Analysis
Table 35 presents the results of my multivariate analysis of the adjusted changes in CEO’s
compensation/pay-for-performance sensitivity measures and changes in liquidity. Panel A
presents the results of changes in CEO’s compensations. The dependent variables in Panel A
include adjusted changes in absolute total compensation, adjusted changes in absolute total
equity, adjusted changes in percentage option compensation and adjusted changes in percentage
equity compensation. Panel B presents the regression results of adjusted changes in CEO’s
pay-for-performance sensitivity measures. The dependent variables in Panel B include adjusted
changes in incentive-intensity of stock option awards, adjusted changes in mix of stock option
award to cash compensation, adjusted changes in incentive-intensity of restricted stock awards
and adjusted changes in mix of restricted stock to cash compensation. All the dependent
variables are winsorized at the 1% and 99% levels. The liquidity change dummy equals to 1
when the bidder’s liquidity improves following the acquisition and 0 otherwise. The same
industry equals 1 if the bidder makes a related takeover (the bidder has the same first 2-digit SIC
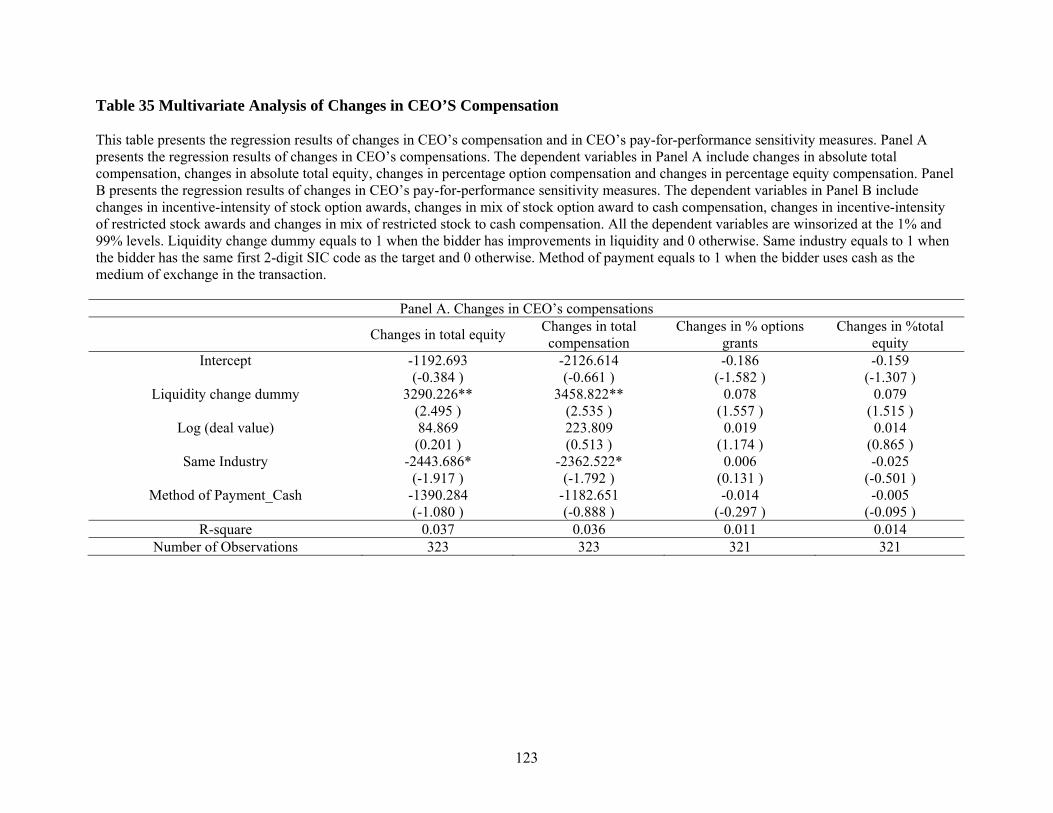
123
Table 35 Multivariate Analysis of Changes in CEO’S Compensation This table presents the regression results of changes in CEO’s compensation and in CEO’s pay-for-performance sensitivity measures. Panel A presents the regression results of changes in CEO’s compensations. The dependent variables in Panel A include changes in absolute total compensation, changes in absolute total equity, changes in percentage option compensation and changes in percentage equity compensation. Panel B presents the regression results of changes in CEO’s pay-for-performance sensitivity measures. The dependent variables in Panel B include changes in incentive-intensity of stock option awards, changes in mix of stock option award to cash compensation, changes in incentive-intensity of restricted stock awards and changes in mix of restricted stock to cash compensation. All the dependent variables are winsorized at the 1% and 99% levels. Liquidity change dummy equals to 1 when the bidder has improvements in liquidity and 0 otherwise. Same industry equals to 1 when the bidder has the same first 2-digit SIC code as the target and 0 otherwise. Method of payment equals to 1 when the bidder uses cash as the medium of exchange in the transaction.
Panel A. Changes in CEO’s compensations
Changes in total equity Changes in total compensation
Changes in % options grants
Changes in %total equity
Intercept -1192.693 -2126.614 -0.186 -0.159 (-0.384 ) (-0.661 ) (-1.582 ) (-1.307 )
Liquidity change dummy 3290.226** 3458.822** 0.078 0.079 (2.495 ) (2.535 ) (1.557 ) (1.515 )
Log (deal value) 84.869 223.809 0.019 0.014 (0.201 ) (0.513 ) (1.174 ) (0.865 )
Same Industry -2443.686* -2362.522* 0.006 -0.025 (-1.917 ) (-1.792 ) (0.131 ) (-0.501 )
Method of Payment_Cash -1390.284 -1182.651 -0.014 -0.005 (-1.080 ) (-0.888 ) (-0.297 ) (-0.095 )
R-square 0.037 0.036 0.011 0.014 Number of Observations 323 323 321 321

124
(Table 35 cont.)
Panel B. Changes in CEO’s pay-for-performance sensitivity measures
Changes in
incentive-intensity of stock option awards
Changes in mix of stock option to cash
compensation
Changes in incentive-intensity of
restricted stock awards
Changes in mix of restricted stock to cash
compensation Intercept -2.914 3.677* -0.245 0.588**
(-1.559 ) (1.889 ) (-1.374 ) (2.383 ) Liquidity change dummy -1.367 -2.109** 0.117 0.036
(-1.573 ) (-2.330 ) (1.413 ) (0.315 ) Log (deal value) 0.247 -0.525** 0.034 -0.100***
(0.993 ) (-2.025 ) (1.441 ) (-3.039 ) Same Industry 0.188 0.297 -0.202** -0.115
(0.216 ) (0.327 ) (-2.417 ) (-1.000 ) Method of Payment_Cash 1.020 0.609 0.080 -0.091
(1.145 ) (0.656 ) (0.935 ) (-0.770 ) R-square 0.027 0.045 0.042 0.070
Number of Observations 206 206 206 206 * significant at the 0.1 level ** significant at the 0.05 level *** significant at the 0.01 level

125
code as the target) and 0 if unrelated. The method of payment equals 1 when the bidder uses cash
as the medium of exchange in the transaction and 0 otherwise.
Panel A of Table 35 suggests that improvement in liquidity has a positive and significant
impact on CEO’s total equity compensation and total compensation. A liquidity-improved bidder
has $3,459,000 ($3,290,000) more increase in total (total equity) compensation than a
liquidity-decreased bidder. Panel A also shows that the improvement in liquidity does not have a
significant impact on the percentage of equity based compensation. Results of Panel B are
consistent with my findings in the univariate analysis. After controlling for other factors, the
improvement in liquidity has a significant but negative impact on changes of mix of stock option
award to cash compensation. In results not reported, I examine the relation between changes in
total cash compensation and liquidity dummy. I find a positive impact of liquidity dummy on
cash compensation with a p-value of 0.11.
To check for the robustness of the multivariate results, I replace the “liquidity dummy”
variable with the “changes in liquidity” and obtain qualitatively similar results. I also do the
regression by replacing the dependent variable with its percentile ranks, and the results are also
qualitatively similar.
In sum, results in Table 35 suggest that improvement in liquidity increases the CEO’s total
compensation, while at the same time reduces the pay-for-performance sensitivities of the CEO’s
compensation.
4.5 Conclusions
Theoretical results of the liquidity impact on corporate governance are by far ambiguous.
This essay examines empirically the influence of liquidity on a company’s corporate governance.
Particularly, it examines the impact of liquidity on the company’s executives’ compensation

126
packages, on the board characteristics of the company and on the compensation packages of the
board’s directors. Examining 332 acquisitions from April 1, 1995 to December 31, 2001, I find
that the absolute cash compensation increases significantly for the LI group. For the percentage
of each form of compensation to the total compensation, I find that the LI group has significantly
greater cash compensation and significantly smaller equity-based compensation. I also find that
the pay-performance sensitivities, measured as the incentive-intensity of stock options awards
and mix of stock option award to cash compensation, decline significantly for the LI group after
the takeovers. These findings support Holmstrom and Tirole (1993) that liquidity improves
efficient contracting and allows the firm to design more efficient compensation contracts.
Holmstrom (1979) and Shavell (1979) show that if the agent’s actions are perfectly observable,
the optimal contract is to pay with cash. When they are not observable, the second best solution
is to make the payout sensitive to performance. I find that the stock price of the LI group
becomes more informative after the takeovers. The firm’s stock price will thus reflect managers’
actions more quickly. As a result, for the LI groups, their managers’ actions become more
observable, and their compensation package consists of more cash.
Second, some recent literature documents that the internal corporate governance has
improved over time. For example, Kini, Kracaw and Mian (2004) find that internal control
mechanisms become more prominent and more effective in the recent years. Holderness,
Kroszner and Sheehan (1999) find that managerial ownership of publicly traded firms in 1995
(21 percent) is higher than that in 1935 (13 percent). What is the reason behind the improvement
in the internal corporate governance? This essay suggests that the improvement in liquidity
associated with the development of financial markets could also be a factor.

127
Chapter 5 Conclusions
My dissertation examines the relation between corporate acquisitions, bidders’ liquidity and
monitoring. It consists of three essays. Essay one examines the effect of corporate acquisitions
on bidders’ liquidity. I find that on average bidders’ liquidity improves after successful takeovers,
but stays stable or becomes worse if their takeover attempts fail. Takeovers of public firms result
in similar liquidity improvements as do takeovers of private firms, but takeovers of public firms
have greater reduction in information asymmetry than takeovers of private firms. Takeovers that
use stock as the method of payment have significantly more improvement in liquidity than
takeovers that use cash in the transaction. Essay two examines the effect of changes in liquidity
on bidders’ market monitoring. I find that the price for liquidity-improved bidders becomes more
informative after the takeover but the price for liquidity-decreased group becomes less
informative. Furthermore, liquidity- improved bidders have relatively better operating
performance and higher firm value than liquidity-decreased bidders. Essay three examines the
effect of changes in liquidity on bidders’ corporate governance. I find that compared to the
liquidity-decreased bidders, executives for the liquidity-improved bidders have significantly
larger size- and industry-adjusted increases in cash and total compensation after the acquisitions.
The pay-for-performance sensitivity of executive compensation decrease significantly for the
liquidity-improved bidders.
My results suggest that completed acquisitions improve bidders’ liquidity and that changes
in firm characteristics associated with acquisitions completion provide the primary impetus for
liquidity improvements of bidders. My findings also lend support to Holmstrom and Tirole (1993)
that liquidity improves a firm’s external monitoring. Furthermore, my results also support the

128
proposition that an improvement in liquidity results in a more informative stock price that
enables a firm to write more efficient contracts.

129
References
Agrawal, A., Knoeber, C.R., 1996, Firm performance and mechanisms to control agency problems between managers and shareholders, Journal mf Financial and Quantitative Analysis 31, 377-397
Ang, J., Kohers, N. 2001. The takeover market for privately-held firms: The US experience.
Cambridge Journal of Economics
Amihud, Y., Mendeson, H., 1986. Asset pricing and the bid-ask spread. Journal of Financial Economics 17, 223-249
Barber, B., Lyon, J.D., 1996, Detecting abnormal operating performance: the empirical power
and specification of test statistics, Journal of Financial Economics 41, 359-399 Bhide, A., 1993, The hidden costs of stock market liquidity, Journal of Financial Economics 34,
31-51 Brau, J., Francis, B., Kohers, N., 2003. The choice of IPO versus Takeover: Empirical Evidence,
Journal of Business 76, 583-612 Brav, A., Gompers, P.A., 1997, Myth or reality? The long-run underperformance of initial public
offerings: evidence from venture and nonventure capital-backed companies, Journal of Finance 52, 1791-1821
Brennan, M.J., Subrahmanyam, A., 1996. Market microstructure and asset pricing on the
compensations for illiquidity in stock returns. Journal of Financial Economics 41, 441-464 Bryan, S., Hwang, L.S., Lilien, S., 2000. CEO stock-based compensation: an empirical analysis
of incentive intensity, relative mix and economic determinants. Journal of Business 73, 661-693
Carhart, M., 1997, On persistence in mutual fund performance, Journal of Finance, 52, 57-82 Chang, S., 1998, Takeovers of privately held targets, methods of payment, and bidder returns.
Journal of Finance 53, 773-784 Clark, K., Ofek, E., 1994, Mergers as a means of restructuring distressed firms: an empirical
investigation, Journal of Financial and Quantitative Analysis 29, 541-565 Copeland, T E., Galai, D., 1983, Information effects on the bid-ask spread, Journal of Finance 38,
1457-1469 Cremers, K.J., Nair, V.B., 2005, Governance Mechanisms and Equity Prices, Journal of Finance
60: 2859-2894

130
Diamond, D.W., 1985, Optimal release of information by firms, Journal of Finance 40, 1071-1094
Dlugosz, J., Fahlenbrach, R., Gompers, P., Metrick, A., 2004, Large block of stock: prevalence,
size and measurement, working paper Easley, D., Hvidkjaer S., O’Hara M., 2002, Is information risk a determinant of asset returns,
Journal of Finance 57, 2185-2221 Easley, D., O’Hara M., 2004, Information and the cost of capital Journal of Finance 59,
1553-1583 Ederington, L.H., Lee, J.H., 1993. How markets process information: news releases and
volatility. Journal of Finance 48, 1161-1191 Fama, E., French, K., 1993, Common risk factors in the returns of stocks and bonds, Journal of
Financial Economics 33, 3-55 Fama, E.F., 1998, Market efficiency, long-term returns, and behavioral finance, Journal of
Financial Economics 49, 283-306 Fan, J.P.H., Lang L.H.P, 2000, The measurement of relatedness: an application to corporate
diversification. Journal of Business 73, 629-660 Fuller, K., Netter, J., Stegemoller, M., 2002. What do returns to acquiring firms tell us? Evidence
from firms that make many acquisitions. Journal of Finance 57, 1763-1793 Glosten, L.R., Milgrom P.R., 1985, Bid, ask and transaction prices in a specialist market with
heterogeneously informed traders, Journal of Financial Economics 14, 71-100 Gompers, P., Ishii, J., Metrick, A., 2003. Corporate Governance and Equity Prices. Quarterly
Journal of Economics 118: 107-155 Gorton, G.B., Pennacchi, G.G., 1993. Security baskets and index-linked securities. Journal of
Business 66, 1-27 Habib, M.A., Johnsen, D.B., Naik, N.Y., 1997. Spinoffs and information. Journal of Financial
Intermediation 6, 153-176 Hansen, R.G., 1987. A theory of the choice of exchange medium in mergers and acquisitions.
Journal of Business 60, 75-95 Harford, J., 2005, What drives merger waves, Journal of Financial Economics 77: 529-560 Hasbrouck, J., 1993, Assessing the quality of a security market: a new approach to
transaction-cost measurement, Review of Financial Studies 6, 191-212

131
Hasbrouck, J., 1991. Measuring the information content of stock trades. Journal of Finance 46, 179-207
Hermalin, B., 2005. Trends in corporate governance. Journal of Finance 92: 2351-2384 Hermalin, B., Weisbach, M.,1998. Endogenously chosen boards of directors and their monitoring
of the CEO. American Economic Review 88, 96–118. Hedge, S.P., McDermott, J.B., 2003. The liquidity effects of revisions to the S&P 500 index: an
empirical analysis. Journal of Financial Markets 6, 413-459 Heron, R., Lie, E., 2002, Operating performance and the method of payment in takeovers,
Journal of Financial and Quantitative Analysis 37, 137-155 Holderness, C., Kroszner, R., Sheehan, D., 1999, Were the good old days that good? Changes in
managerial stock ownership since the great depression. Journal of Finance, 435-469 Holmstrom, B., 1979 , Moral Hazard and Observability Bell Journal of Economics 10: 55-73 Holmstrom, B., Tirole, J. 1993. Market liquidity and performance monitoring. Journal of
political economy 101, 678-709 Huson, M.R., MacKinnon, G., 2003. Corporate spinoffs and information asymmetry between
investors. Journal of Corporate Finance 9, 481-503 Huang, R.D., Stoll, H.R., 1996. Dealer versus auction markets: A paired comparison of
execution costs on Nasdaq and the NYSE. Journal of Financial Economics 41, 313-357 Huang, R.D., Stoll, H.R., 1997. The components of the bid-ask spread: a general approach.
Review of Financial Studies 10, 995-1034 Jensen, M., 1993. The modern industrial revolution, exit and the failure of internal control
systems, Journal of Finance 80, 831-880 Johnson, S.A., Ryan, H.E., Tian, Y.S., 2004. Executive compensation and corporate fraud.
Working paper Jones, C.M, Lipson, M.L., 1999. Price impacts and quote adjustment on the Nasdaq and
NYSE/AMEX, Working paper Kini, O., Kracaw, W., Mian, S., 2004, The nature of discipline by corporate takeovers. Journal of
Finance 59, 1511-1552 Kole, S., 1997, The complexity of compensation contracts. Journal of Financial Economics 43:
79-104

132
Kyle, A.S., 1985. Continuous auctions and insider trading. Econometrica 53, 1315-1335 Lee, C.M, Ready, M.J., 1991. Inferring trade direction from intraday data. Journal of Finance 46,
733-746 Lin, J.C., Sanger, G.C., Booth, G.G., 1995. Trade size and components of the bid-ask spread.
Review of Financial Studies 8, 1153-1183 Lipson, M., Lotch, J.W., 1992, A modest proposal for improved corporate governance. Business
Lawyer 48, no.1., 59-77 Lipson, M. Mortal, S., 2003. Liquidity and firm characteristics: evidence from mergers and
acquisitions, working paper Martin, K.J. and J. J. McConnell, 1991, Corporate performance, corporate takeovers, and
management turnover, Journal of Finance 46, 671-687. Maug, E., 1998, Large shareholders as monitors: is there a trade-off between liquidity and
control. Journal of Finance 53, 65-98 Merton, R.C., 1987, A simple model of capital market equilibrium with incomplete information,
Journal of Finance 42, 483-510 Mitchell, M. L., Lehn K., 1990, Do bad bidders become good targets? Journal of Political
Economy 98, 372-398. Moeller, S.B., Schlingemann, F.P., Stulz, R.M., 2005, Wealth destruction in a massive scale? A
study of acquiring firm return in the recent merger wave, Journal of Finance 60, 757-782 Patell, J.M., Wolfson, M.A., 1984, The Intraday Speed of Adjustment of Stock Prices to
Earnings and Dividend Announcements, Journal of Financial Economics 13, 223-252. Peterson, M., Sirri E., 2003, Evaluation of the biases in execution cost estimation using trade and
quote data, Journal of Financial Markets 6, 259-280 Ritter, J., 1991, The long-run performance of initial public offerings, Journal of Finance 42, 3-27 Rosenstein, S., Wyatt, J., 1990, Outside directors, board independence, and shareholder wealth,
Journal of Financial Economics 26: 175-191 Ross, R., 1989. Information and volatility: the no-arbitrage martingale approach to timing and
resolution irrelevancy. Journal of Finance 44, 1-18 Ryan, H.E., Wiggins, R.A., 2001, The influence of firm- and manager- specific characteristics on
the structure of executive compensation. Journal of Corporate Finance 7: 102-123

133
Ryan, H.E., Wiggins, R.A., 2004. Who is in whose pocket? Director compensation, board independence, and barriers to effective monitoring. Journal of Financial Economics 73, 497-524
Scharfstein, D. 1988, The discipline role of takeovers, Review of Economic Studies 15. 185-199 Shavell, S., 1979 Risk sharing and incentives in the principal and agent relationship. Bell Journal
of Economics 10: 55-73 Smith, C. W., and Stulz, R. M. 1985. The determinants of firms' hedging policies. Journal of
Financial and Quantitative Analysis 20: 391-405. Subrahmanyam, A., 1991. A theory of trading in stock index futures. Review of Financial
Studies 4: 17-51 Vafeas, N., 1999, Board meeting frequency and firm performance. Journal of Financial
Economics 53: 113-142 Weisbach, M., 1988, Outside directors and CEO turnover, Journal of Financial Economics 20:
431-460 Yermack, D., 1996. Higher market valuation of companies with a small board of directors.
Journal of Financial Economics 40. 185-211

134
Vita
Huihua Li obtained her Bachelor of Economics degree in 1997 from FuDan University in
China. She obtained her Master of Economics degree from FuDan University in 2000. In 2004,
she got her Master of Science degree in Finance from Louisiana State University. She expects to
obtain her Doctor of Philosophy degree in Business Administration with a concentration in
Finance from Louisiana State University in August of 2006. During her graduate study at
Louisiana State University, Huihua Li taught business finance and investments at the
undergraduate level. Her working paper, “Acquisitions and Bidders’ Liquidity: Evidence from
Successful and Unsuccessful Takeovers”, was presented at the Financial Management
Association International (FMA) 2005. Her working paper, “Liquidity and Market Monitoring:
an Examination of Changes in Market Monitoring for Successful Bidders”, is accepted for
presentation at the FMA 2006.