three-dimensional roughness of stylolites in...
TRANSCRIPT

Three-dimensional roughness of stylolites in limestones
Francois Renard,1,2 Jean Schmittbuhl,3 Jean-Pierre Gratier,1 Paul Meakin,2,4
and Enrique Merino5
Received 25 April 2003; revised 28 January 2004; accepted 5 February 2004; published 27 March 2004.
[1] Stylolites are dynamic roughly planar surfaces formed by pressure solution of blocksof rocks into each other. The three-dimensional geometry of 12 bedding-parallel stylolitesin several limestones was measured using laser and mechanical profilometers, andstatistical characteristics of the surfaces were calculated. All the stylolites analyzed turnout to have self-affine fractal roughness with a well-characterized crossover lengthscale separating two self-affine regimes. Strikingly, this characteristic length scale fallswithin a very narrow range for all the stylolites studied, regardless of the microstructuresizes. To explain the data, we propose a continuous phenomenological model thataccounts for the development of the measured roughness from an initially flat surface. Themodel postulates that the complex interface morphology is the result of competitionbetween the long-range elastic redistribution of local stress fluctuations, which roughenthe surface, and surface tension forces along the interface, which smooth it. The modelaccounts for the geometrical variability of stylolite surfaces and predicts the dependenceof the crossover length scale on the mechanical properties of the rock. INDEX TERMS:
3902 Mineral Physics: Creep and deformation; 3909 Mineral Physics: Elasticity and anelasticity; 3947 Mineral
Physics: Surfaces and interfaces; 3675 Mineralogy and Petrology: Sedimentary petrology; 5112 Physical
Properties of Rocks: Microstructure; KEYWORDS: stylolite, surface roughness, elasticity, surface tension
Citation: Renard, F., J. Schmittbuhl, J.-P. Gratier, P. Meakin, and E. Merino (2004), Three-dimensional roughness of stylolites in
limestones, J. Geophys. Res., 109, B03209, doi:10.1029/2003JB002555.
1. Introduction
[2] Stylolites are partings between blocks of rock whichexhibit complex mutual column-and-socket interdigitation[see Dunnington, 1967, p. 340]. They are planar, extendlaterally for up to tens of meters, may cut across bedding,and often occur in sets, in carbonate and other essentiallymonomineralic rocks. They play an important role incompaction and creep processes [Bathurst, 1971], andtherefore in the rheological properties of the upper crust.[3] The works of Stockdale [1922], Dunnington [1954,
1967], Heald [1959], Park and Schot [1968], Arthaud andMattauer [1969], Guzzetta [1984], Dewers and Ortoleva[1990], Carrio-Schaffhauser et al. [1990], and many moreleave little doubt that stylolites are the planar, disk-likeseams left by self-localized pressure solution that Fletcherand Pollard [1981] viewed as ‘‘anticracks’’. So much rockmay be pressure-dissolved during stylolites formation thatstylolitization may considerably change the shape andreduce the thickness of a sedimentary body [Dunnington,
1967; Bathurst, 1971]. Stylolites seams are often highlightedby a thin concentration of darker material, usually assumedto be insoluble material but at least in some cases shown tobe authigenic [Merino et al., 1983; Thomas et al., 1993].Cataclastic deformation and microtransform faulting con-tribute to the specific shape of the column and socketsinterdigitations [Deelman, 1976; Dickinson and Milliken,1995; Merino and Wang, 2001].[4] Bayly [1986] attempted to account for the topography
of stylolites by invoking a non-uniform distribution of clayparticles in the carbonate rock and water flow parallel to thestylolitic plane, but the stylolitic surfaces he predicted appar-ently have a ridge-and-groove morphology rather than theobserved column-and-socket form. Gal et al. [1998] carriedout a stability analysis for a stressed pressure-solution sur-face, which was assumed to be free, on which a sinusoidalperturbation is imposed. They concluded that the competitionbetween surface tension and elastic strain energy may renderthe surface unstable to the growth of perturbations of certainwavelengths and may account for the formation of theroughness of stylolites. This is a stress-dissolution instability,known to physicists as the Asaro-Tiller-Grinfeld instability[Asaro and Tiller, 1972; Grinfeld, 1986; Nozieres, 1995;Kassner et al., 2001]. In another paper [Gal and Nur, 1998],they explained why stylolites form by dissolvingmore on oneside than on the other. The local variations in elastic strainenergy can induce a small asymmetry of the dissolution frontthat tends to grow with time.[5] The usual way of studying stylolites is by examining
them in two-dimensional polished cross-sections perpendic-
JOURNAL OF GEOPHYSICAL RESEARCH, VOL. 109, B03209, doi:10.1029/2003JB002555, 2004
1Laboratoire de Geophysique Interne et Tectonophysique, UniversiteJoseph Fourier, Grenoble, France.
2Physics of Geological Processes, University of Oslo, Oslo, Norway.3Ecole Normale Superieure, Laboratoire de Geologie, Paris, France.4Idaho National Engineering and Environmental Laboratory, Idaho
Falls, Idaho, USA.5Department of Geological Sciences, Indiana University, Bloomington,
Indiana, USA.
Copyright 2004 by the American Geophysical Union.0148-0227/04/2003JB002555$09.00
B03209 1 of 12

ular to the plane of the stylolite [Smith, 2000; Karcz andScholz, 2003]. Smith [2000] has studied a three-dimensionalimage of a stylolite using a series of parallel cross-sectionsperpendicular to the plane of the stylolite. However, only20 cross-sections spaced by about 0.5 mm were used, andthis is not sufficient to construct a high resolution three-dimensional ‘‘map’’ of the surface.[6] The objective of the work described in this paper is to
quantify the intricate three-dimensional topography of suchstylolites. For this purpose we collected twelve sedimentarybed-parallel stylolites in limestones. For all of them, wemanaged to separate the two interdigitated rock bodieswithout damaging the peaks, from carefully sawed 20 �20 � 10 cm blocks of limestones. Thus the full three-dimensional structure of the stylolite interface was revealed,and we quantified their exposed topography using opticaland mechanical profilometers. In addition we propose aphenomenological model for surface growth and roughen-ing that reproduces the statistical properties of stylolitesurfaces.
2. Analysis of the Stylolites
2.1. Origin and Chemical Characterization of theStylolites
[7] Decimeter-scale limestone samples from the Char-treuse, Vercors, and Jura mountains and the Burgundy area(France) that have undergone stylolitization were collected innewly open quarries (see Table 1). The age of the limestonesvaried between Jurassic and Miocene. We selected stylolitesthat could be separated to reveal the two complementaryrough surfaces; see Figures 1 and 2.[8] Thin sections show that the limestones are recrystal-
lized and that the grain size is below the resolution of theoptical microscope. For each stylolite we analyzed two kindsof sample by X-ray fluorescence; the rock itself and theinsoluble particles (mainly clays) trapped within the inter-face. The stylolite interfaces were washed with distilled waterand the clay suspensions were collected directly from thesolution after filtration, evaporation and drying at 70�C. Asmall volume in each sample was cut and these rock sampleswere crushed and sieved. Then all the samples were heated at1200�C, to remove organic matter, before lithium boratepellets were produced for X-ray fluorescence analysis.[9] The analysis indicated that the stylolites are enriched
in aluminum, iron, titanium, and phosphorus compared with
the bulk rock (see Table 2), whereas the interface is depletedin calcium indicating preferential dissolution along thestylolite. However, the concentration ratios between ele-ments are not conserved in the stylolite and in the rock. Thismay have several explanations, including the following:[10] 1. The analyzed elements may be shared by a number
minerals that have different solubilities. This is commonlyassociated with pressure solution cleavage differentiation[Gratier et al., 2003].[11] 2. The stylolites may have nucleated on preexisting
surfaces, e.g., a clay seam, that had a different compositionfrom the ambient.[12] 3. A fluid may have percolated along the stylolites
and removed some elements as dissolved or colloidal solids.This is consistent with the analysis of authigenic muscovitein stylolites by Thomas et al. [1993].[13] To estimate the extent of dissolution, we selected the
elements associated with minerals that have the smallestsolubilities, and were therefore least influenced by thecirculating fluid. The concentration ratios of such elementsbetween the stylolite interfacial material and the bulk rockprovides a qualitative indication of the amount of dissolutionthat has occurred. The stylolite interface residues are 5 to20 times more concentrated in Ti, Fe, and P than the bulklimestone (see Figure 3). Since the interface is 0.5 to 5 mmthick, the thickness of the layer of limestone that hasdissolved is estimated to lie in the range 2.5 to 100 mm.This value is comparable with the maximum height of thestylolite peaks [Delair and Leroux, 1978]. Because therecould have been contamination by a fluid, this analysis givesonly a qualitative estimate of the amount of dissolution.[14] In the following we assume that fluid circulation is a
late event during stylolite formation and that fluids-rockinteractions associated with this circulation did not modifythe statistical properties of the stylolite surfaces. Thisassumption is relevant in the sense that we show belowthat all the stylolites have the same statistical properties,independent of their geological history and geographicorigin.
2.2. Statistical Properties of Stylolite Topography
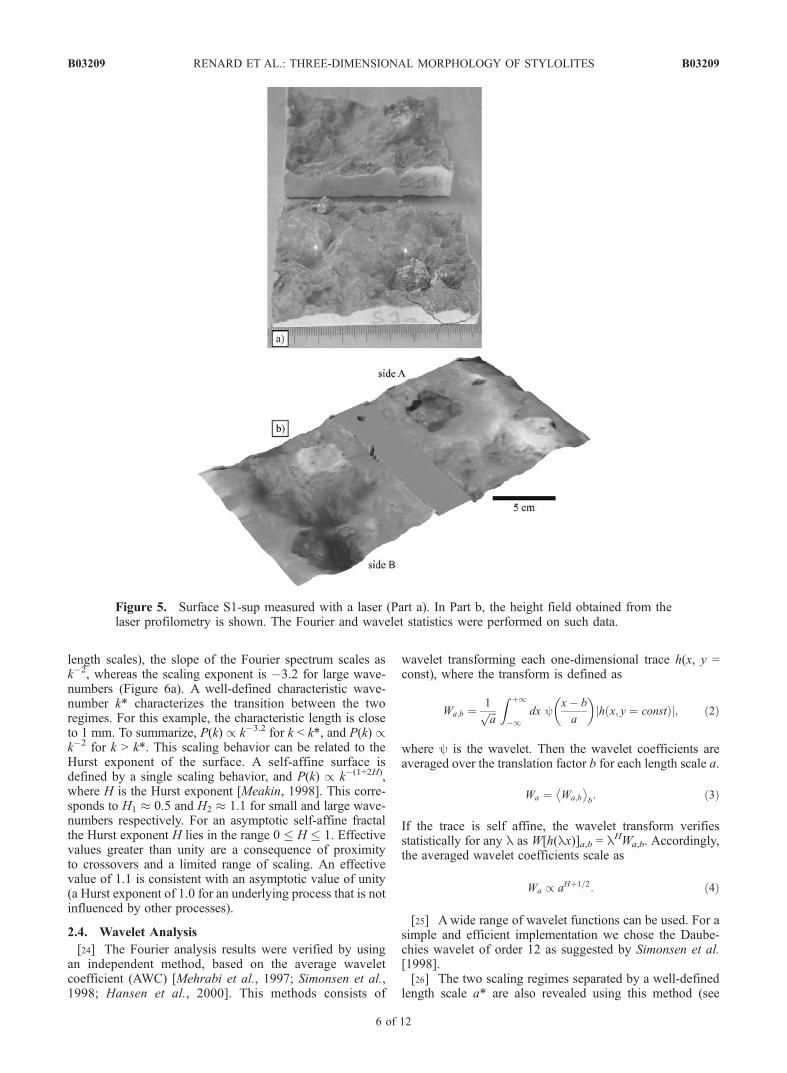
[15] We have determined the scaling behavior of thevarious stylolites with optical and mechanical profilometers(Table 1 and Figure 4). Topographic height fields (seeFigure 5) were measured with two different laser profilom-eters (one at Rennes University, France, with a horizontal
Table 1. Stylolite Surfaces Analyzeda
Stylolite Origin Rock dx, mm Arms, mm Length Scale a*, mm
S0-8 Jura mountains light yellow limestone 125 0.54 0.77S1sup Chartreuse mountains gray limestone 125 1.48 *S32 Chartreuse mountains yellow limestone 125 0.87 *S3B Chartreuse mountains yellow limestone 125 2.32 0.18S6 Chartreuse mountains gray limestone 125 1.56 *S11B Burgungy clastic limestone 30 2.49 0.62S11C Burgungy clastic limestone 30 1.68 0.6S12A Vercors Mountains light gray limestone 80 2.86 2.24S13A Burgundy pink-red limestone 30 0.26 0.47S15A Burgundy yellow-red limestone 60 0.61 0.43S10A Burgundy limestone 30 0.83 0.43Sjuras1 Jura mountains light yellow limestone 60 0.90 0.96
aThe resolution in the plane of the stylolite dx, the root mean square roughness (Arms), and the characteristic length a* are given. An asterisk in the right-hand column indicates a surface with noisy laser data, which was not quantitatively analyzed.
B03209 RENARD ET AL.: THREE-DIMENSIONAL MORPHOLOGY OF STYLOLITES
2 of 12
B03209

resolution of 125 mm, one at Ecole Normale Superieure deParis, France (ENS) with a resolution down to 30 mm) andone mechanical profilometer (ENS) with a resolution of25 mm. Between 4 and 600 � 600 parallel profilometertransects were conducted on each surface. These profiles arethen used to create topographic maps of each surface.[16] The mechanical profilometer measurements were
performed with a sapphire needle with a 25 mm tip radius,which moves up and down and stops when it touches thesurface of the stylolite. Between successive measurements,the stylolite surface is displaced laterally according to a
prescribed pattern so that the height of the surface can bemeasured at an array of lateral positions in the plane of thestylolite. The vertical resolution of this device is 3 mm. Thetime required for a single measurement is approximately2 seconds, several times longer than for laser measurement.Consequently, we performed only four mechanical profi-lometer measurements along linear profiles, for the purposeof comparison with laser profilometer data.[17] The laser measurements were performed by directing
a laser beam onto the surface. The distance between thelaser and the stylolite is measured via the time of flight of
Figure 1. Examples of stylolites at different scales in limestones showing the variety of morphologiesand peaks amplitudes. top) Sample S12A, with a roughness of up to 5 millimeters. Sample S0-8 with aroughness of up to 2 millimeters. bottom) Measured profiles of four representative stylolites we haveanalyzed. These stylolites are ordered according to increasing roughness from bottom to top.
B03209 RENARD ET AL.: THREE-DIMENSIONAL MORPHOLOGY OF STYLOLITES
3 of 12
B03209

the reflected beam (Rennes University) or by triangulation(ENS). The former has a vertical precision of 30 mm andthe latter of 3 mm. The surface height field was constructedby displacing the sample by horizontal increments of 30 to125 mm along horizontal parallel profiles. Each profile wasseparated by the same 30 to 125 mm increments. Theprecision of the horizontal motions is 12 mm for the Rennesinstrument and below 1 mm for the ENS instrument.[18] If a stylolite is approximated by a rough surface that
fluctuates spatially about a plane, then the amplitude of theroughness can be defined as the rms (root-mean-square)distance between the rough surface and the average planedefined from a least square fit. This quantity characterizesthe mean amplitude of the peaks. It might depend on thesize of the sampled area and it is defined as
Arms Sð Þ ¼
ffiffiffiffiffiffiffiffiffiffiffiffiffiffiffiffiffiffiffiffiffiffiffiffiffiffiffiffiffiffi1
N
XNi¼1
zi � �zð Þ2vuut ; ð1Þ
where S is the sampled area of the stylolite surface, zi is theheight of the ith point on the area and �z is the mean height ofthe surface, which is discretized at N points.[19] Two types of statistical properties were calculated to
characterize the roughness of the stylolites: the rms rough-ness amplitude Arms of each surface for a given sampledarea and the roughness exponent (or Hurst exponent) H ofthe topographic profiles which characterizes the sensitivityof the roughness amplitude with respect to the size of thesampled area: Arms / SH/2. The Hurst exponent, H, could bedetermined from the dependence of Arms on S; however, wedetermined H using the Fourier power spectrum (FS)[Meakin, 1998] and the average wavelet coefficient tech-nique (AWC) [Mehrabi et al., 1997; Simonsen et al., 1998;Hansen et al., 2000].[20] Once the topography of a surface was acquired we
carried out a pre-treatment of the raw data before calculatingstatistical properties of the profiles and the surfaces. Themean plane of each surface was first calculated by two-dimensional mean-squared regression and subtracted from
Figure 2. Scanning electron microscope image of a stylolite surface from the Jura area on differentscales (sample SJuras1). a) View of the rough surface. b) View of an individual peak on a scale that isabout ten times smaller. c–d) Small scale roughness on a scale that is about 20 times smaller than that inpart a).
B03209 RENARD ET AL.: THREE-DIMENSIONAL MORPHOLOGY OF STYLOLITES
4 of 12
B03209

the initial data. This removes any planar tilt of the surfaceand sets the mean height to zero.
2.3. Fourier Analysis
[21] The aim is to quantify the scaling behavior anddemonstrate that the surface remains unchanged under thetransformation Dx! lDx, Dz! lHDz. The Hurst exponentH can be estimated from the Fourier power spectrum whichhas a power law form with an exponent of (�1–2H) for a1-dimensional self-affine profile [Barabasi and Stanley,1995; Meakin, 1998].[22] A set of parallel cuts was taken through the digitized
surface in a plane perpendicular to the plane of the styloliteto obtain a series of parallel profiles. For each profile, theFourier power spectrum P(k), i.e., the square of the modulusof the Fourier transform, was calculated as a function of thewave-number k. Then the spectrum of the whole surfacewas calculated by stacking all the 1D Fourier transforms toreduce the noise associated with individual profiles. Foreach profile of length L containing N increments, the spatialfrequencies range between 1/L and the Nyquist frequencyN/2L (i.e., the reciprocal of the interval between datapoints). In this range of frequencies, fall-of problemsat short wavelengths are avoided. This method wasapplied to both the laser and mechanical profilometer dataobtained from the same stylolite (Figure 6a). For both datasets, the Fourier analysis give the same results, the
only difference is that the mechanical data (4 profiles onthe surface Sjuras1) are more noisy than the laser data (up to1024 profiles on the same surface). These results indicatethat the roughness statistics are independent of the mea-surement device.[23] The Fourier spectra show that the roughness of
the stylolite surfaces can be described in terms of twoself-affine regimes. For small wave-numbers k (or large
Table 2. X-Ray Fluorescence Analysis of the Whole Rock and the Content of the Stylolite Interfaces
Stylolite Sample Fe2O3, % TiO2, % P205, % CaO, % SiO2, % Al2O3, %
S3B whole rock 0.78 0.07 0.05 83.2 3.89 1.53S3B interface 3.33 0.73 0.27 23.7 53.6 9.77S1sup whole rock 0.74 0.10 0.06 82.5 8.03 1.41S1sup interface 2.05 0.61 0.21 16.5 67.9 7.13S13A whole rock 0.46 0.04 0.04 92.6 0.01 0.08S13A interface 2.87 0.31 0.23 68.6 18.57 4.81S11 whole rock 0.61 0.04 0.01 92.1 0 1.17S11 interface 12.69 0.89 0.12 26.2 39.2 13.13
Figure 3. X-ray fluorescence analysis of the bulk rock andthe stylolite interface for four different samples.
Figure 4. Measurements of the stylolites surfaces with alaser profilometer. Two different lasers were used. One inRennes University (a), with a step increment of 125 mm(surface S6) and one at the Ecole Normale Superieure Paris(b), with increments of 30 mm (surface S10A). (See Table 1.)
B03209 RENARD ET AL.: THREE-DIMENSIONAL MORPHOLOGY OF STYLOLITES
5 of 12
B03209
length scales), the slope of the Fourier spectrum scales ask�2, whereas the scaling exponent is �3.2 for large wave-numbers (Figure 6a). A well-defined characteristic wave-number k* characterizes the transition between the tworegimes. For this example, the characteristic length is closeto 1 mm. To summarize, P(k) / k�3.2 for k < k*, and P(k) /k�2 for k > k*. This scaling behavior can be related to theHurst exponent of the surface. A self-affine surface isdefined by a single scaling behavior, and P(k) / k�(1+2H),where H is the Hurst exponent [Meakin, 1998]. This corre-sponds to H1 � 0.5 and H2 � 1.1 for small and large wave-numbers respectively. For an asymptotic self-affine fractalthe Hurst exponent H lies in the range 0 H 1. Effectivevalues greater than unity are a consequence of proximityto crossovers and a limited range of scaling. An effectivevalue of 1.1 is consistent with an asymptotic value of unity(a Hurst exponent of 1.0 for an underlying process that is notinfluenced by other processes).
2.4. Wavelet Analysis
[24] The Fourier analysis results were verified by usingan independent method, based on the average waveletcoefficient (AWC) [Mehrabi et al., 1997; Simonsen et al.,1998; Hansen et al., 2000]. This methods consists of
wavelet transforming each one-dimensional trace h(x, y =const), where the transform is defined as
Wa;b ¼1ffiffiffia
pZ þ1
�1dx y
x� b
a
� �h x; y ¼ constð Þj j; ð2Þ
where y is the wavelet. Then the wavelet coefficients areaveraged over the translation factor b for each length scale a.
Wa ¼ Wa;b
b: ð3Þ
If the trace is self affine, the wavelet transform verifiesstatistically for any l as W[h(lx)]a,b = lHWa,b. Accordingly,the averaged wavelet coefficients scale as
Wa / aHþ1=2: ð4Þ
[25] Awide range of wavelet functions can be used. For asimple and efficient implementation we chose the Daube-chies wavelet of order 12 as suggested by Simonsen et al.[1998].[26] The two scaling regimes separated by a well-defined
length scale a* are also revealed using this method (see
Figure 5. Surface S1-sup measured with a laser (Part a). In Part b, the height field obtained from thelaser profilometry is shown. The Fourier and wavelet statistics were performed on such data.
B03209 RENARD ET AL.: THREE-DIMENSIONAL MORPHOLOGY OF STYLOLITES
6 of 12
B03209
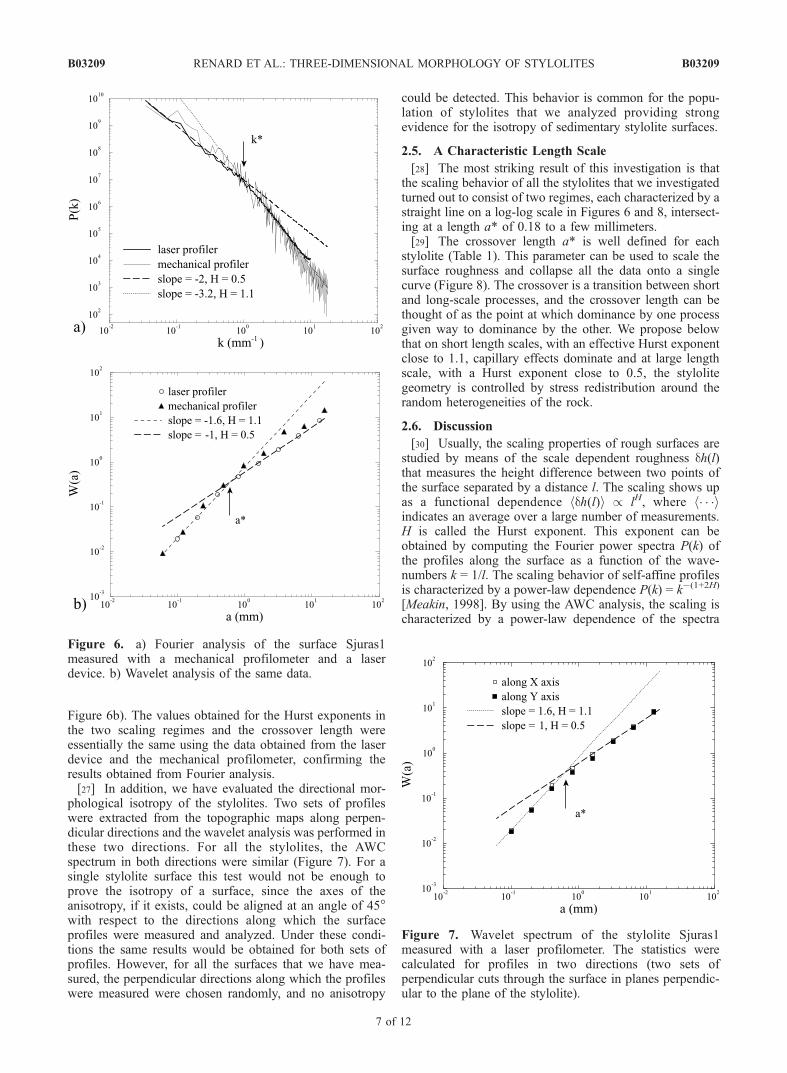
Figure 6b). The values obtained for the Hurst exponents inthe two scaling regimes and the crossover length wereessentially the same using the data obtained from the laserdevice and the mechanical profilometer, confirming theresults obtained from Fourier analysis.[27] In addition, we have evaluated the directional mor-
phological isotropy of the stylolites. Two sets of profileswere extracted from the topographic maps along perpen-dicular directions and the wavelet analysis was performed inthese two directions. For all the stylolites, the AWCspectrum in both directions were similar (Figure 7). For asingle stylolite surface this test would not be enough toprove the isotropy of a surface, since the axes of theanisotropy, if it exists, could be aligned at an angle of 45�with respect to the directions along which the surfaceprofiles were measured and analyzed. Under these condi-tions the same results would be obtained for both sets ofprofiles. However, for all the surfaces that we have mea-sured, the perpendicular directions along which the profileswere measured were chosen randomly, and no anisotropy
could be detected. This behavior is common for the popu-lation of stylolites that we analyzed providing strongevidence for the isotropy of sedimentary stylolite surfaces.
2.5. A Characteristic Length Scale
[28] The most striking result of this investigation is thatthe scaling behavior of all the stylolites that we investigatedturned out to consist of two regimes, each characterized by astraight line on a log-log scale in Figures 6 and 8, intersect-ing at a length a* of 0.18 to a few millimeters.[29] The crossover length a* is well defined for each
stylolite (Table 1). This parameter can be used to scale thesurface roughness and collapse all the data onto a singlecurve (Figure 8). The crossover is a transition between shortand long-scale processes, and the crossover length can bethought of as the point at which dominance by one processgiven way to dominance by the other. We propose belowthat on short length scales, with an effective Hurst exponentclose to 1.1, capillary effects dominate and at large lengthscale, with a Hurst exponent close to 0.5, the stylolitegeometry is controlled by stress redistribution around therandom heterogeneities of the rock.
2.6. Discussion
[30] Usually, the scaling properties of rough surfaces arestudied by means of the scale dependent roughness dh(l)that measures the height difference between two points ofthe surface separated by a distance l. The scaling shows upas a functional dependence hdh(l)i / lH, where h� � �iindicates an average over a large number of measurements.H is called the Hurst exponent. This exponent can beobtained by computing the Fourier power spectra P(k) ofthe profiles along the surface as a function of the wave-numbers k = 1/l. The scaling behavior of self-affine profilesis characterized by a power-law dependence P(k) = k�(1+2H)
[Meakin, 1998]. By using the AWC analysis, the scaling ischaracterized by a power-law dependence of the spectra
Figure 6. a) Fourier analysis of the surface Sjuras1measured with a mechanical profilometer and a laserdevice. b) Wavelet analysis of the same data.
Figure 7. Wavelet spectrum of the stylolite Sjuras1measured with a laser profilometer. The statistics werecalculated for profiles in two directions (two sets ofperpendicular cuts through the surface in planes perpendic-ular to the plane of the stylolite).
B03209 RENARD ET AL.: THREE-DIMENSIONAL MORPHOLOGY OF STYLOLITES
7 of 12
B03209

P(k) = kH+1/2. These two methods are independent, andtogether they provide a measure of the consistency of thestatistical methods used to calculate the Hurst exponent.Our analysis indicates that stylolites are characterized bytwo self-affine regimes separated by a well-defined charac-teristic length scale a*. For small wave-numbers (i.e., largelength scales) the Hurst exponent H1 � 0.5 and for largewave-numbers (i.e., small length scales), H2 � 1.1. Thelatter value is similar to that obtained for experimentalmicrostylolites by Gratier et al. [2004]. All the stylolitesthat we analyzed showed this universal behavior.[31] There is other evidence that stylolites have a self-
affine fractal structure. For example, Drumond and Sexton[1998] measured a Hurst exponent of 0.65 using a cutthrough a limestone stylolite. The Hurst exponent wasdetermined by using the Fourier power spectrum. Althoughthe power spectrum was quite noisy, it could be representedby a power law, corresponding to H � 0.65 over almost twowave-number decades corresponding to a two decade rangeof length scales. On 1D profiles, Karcz and Scholz [2003]obtained a Hurst exponent close to 0.55 over 4.5 orders of
magnitude for a stylolite from Calcare Massiccio, Italy, and0.74 and 0.57 for two other lithologies. However, they didnot observe a cross-over length-scale.[32] The values that we obtained for the Hurst exponent
are significantly different from the quasi-universal value ofabout 0.75 measured for fracture surfaces in a wide varietyof brittle materials [Mandelbrot et al., 1984; Power et al.,1987; Maloy, 1992; Schmittbuhl et al., 1993; Kim et al.,1997] except for that obtained for sandstone fractures [Boffaet al., 1998]. However, it is also clear that stylolite surfacesdiffer substantially from fractures in brittle materials inhaving a far greater surface area relative to the area of theflat surface about which the stylolite surfaces fluctuate. Thisdifference can be described through the magnitude of thetopothesy, which is defined as the length scale over whichthe slope of the topography is equal to unity [Simonsen etal., 2000]. Stylolites have a topothesy that is much largerthan that of fractures.[33] A qualitative correlation was observed between the
amplitude of the roughness and the characteristic crossoverlength a*. In Figure 8, top, the surfaces are sorted accordingto the amplitude of the peaks: black curves correspond tosmooth stylolites, with a low Arms roughness, gray curvescorrespond to stylolites with well-defined peaks, and darkcurves with open symbols are intermediate. The stylolitesthat have, visually, the highest peaks have a characteristiclength a* of the order of 1–3 mm, whereas ‘smooth’stylolites have a characteristic length a* that is less than1 mm (Table 1).
3. Modeling Stylolite Surface Growth
[34] A stylolitic surface can be regarded as the currentdynamic interface during the mutual pressure solution of twoblocks of rock. It is a 2+1-dimensional object that hasdeveloped through time. The 2+1-dimensional notation isused for a surface that fluctuates in a third dimension about atwo-dimensional plane. Stylolites can be described in termsof the propagation of a growth front that leaves behind astructure that does not change, or the growth of fluctuationsabout a stationary plane. These two scenarios are equivalentif the propagation of a growth front is described in acoordinate system that moves with the front. We study thisdevelopment through a phenomenological approach usedwidely in physics to quantify various rough surface growthprocesses. We propose a simple 1+1-dimensional model thataccounts for capillary and elastic forces and provides someinsights into the roughening of an isolated stylolite.
3.1. Driving Forces and Transport Mechanism
[35] Previous works on stylolites indicate that three mainingredients must be included in a realistic model of styloliteformation [Merino et al., 1983; Ortoleva, 1994; Gal et al.,1998]: the first is the effect of stress that enhances dissolu-tion in regions of the rock in which the stress is higher; thesecond is the transport of solutes via a fluid phase; and thethird ingredient is a surface smoothing process driven byvariation of the curvature related to chemical potentialvariations along the stylolite surface.[36] A local increase of stress increases the free energy
and also the solubility of the solid. This is the well-knownGibbs effect of stress on free-energy [Kamb, 1959; Weyl,
Figure 8. a) Wavelet analysis of all the stylolite surfacesstudied. b) A data collapse illustrating that W(a) = W(a*)f (a/a*), where f (x) is a scaling function common to all ofthe stylolites.
B03209 RENARD ET AL.: THREE-DIMENSIONAL MORPHOLOGY OF STYLOLITES
8 of 12
B03209

1959]. The Gibbs effect is used to explain pressure solutionpatterns [Rutter, 1976]. The relative rates of dissolution ofthe two solid surfaces drives the interface evolution. Thisprocess depends on the relationship between the chemicalpotential and the energy [Kassner et al., 2001]:
Dm x; tð Þ ¼ W ue þ gkð Þ; ð5Þ
where Dm is the local chemical potential difference betweenthe solid and the fluid phase along the interface, W is themolecular volume of the dissolving solid, ue is the elasticenergy per unit volume in the solid, g is the interfacialenergy, and k is the local curvature of the interface. A morecomplete approach to the mechanical modeling would takeinto account the full complexity of the normal andtangential stresses effects, including elastic and plasticstrain, cataclastic deformation etc. Because of the lack ofdetailed information and understanding of the complete roleplayed by stress in stylolite formation, we consider that theterm ue, the elastic energy, represents a simplified descrip-tion of the effects of stress in the model. It is a strongassumption; however, we consider that the long-rangeelastic distribution of local stress fluctuations can beapproximated by this single parameter.[37] The evolution of the interface is mediated by the
diffusion process. Once material has dissolved, solutes aretransported in a fluid phase. If the diffusion is in the bulk,the interface velocity vn is directly proportional to thechemical potential difference: vn = mDm where m is amobility. In the case of diffusion that is confined to aninterface, the interface velocity is given by vn = Dir2
Dm,where Di is an interfacial diffusion coefficient [Kassner etal., 2001]. Gal et al. [1998] proposed that in a stylolitediffusion occurs along the solid-fluid interface. However, astudy of thin sections of North Sea sandstones indicated thatdissolved silica precipitates locally in the bulk rock aroundthe stylolite [Oelkers et al., 1996]. In this case, transport bydiffusion occurs in the volume of rock surrounding thestylolite. We assume this second scenario.[38] Gal et al. [1998] have developed a linear stability
analysis of stylolite formation. Along the stylolite, the differ-ences in solubility induces heterogeneities in the rates ofdissolution. This effect modifies the stress along the surface.The net result of this feedback between stress and dissolutionis the amplification of stress heterogeneities and the forma-tion of wavy structures on the dissolving surface. The non-hydrostatically stressed solid can partially release its energyby a morphological instability at the interface [Muller andGrant, 1999]. This process is known for homogeneousmaterials as theAsaro-Tiller-Grinfeld instability (seeKassneret al. [2001] for a complete review of the process), and it leadsto the amplification of perturbations on an initial noisysurface. When the surface roughness develops, the localcurvature varies. This modifies the chemical potential for agiven half-space below the stylolitic surface: ‘‘bumps’’ havehigher chemical potential whereas ‘‘valleys’’ have a lowerchemical potentials. This produces a smoothing of thesurface, which competes with the amplification due to stresseffects modeled as variations of elastic energy.
3.2. Langevin Model for Stylolite Growth
[39] For many processes in which an initially flat surfaceor interface evolves into a rough surface, the evolution of
the surface can be described by a stochastic differentialequation, or Langevin equation, of the form
@z x; tð Þ=@t ¼ n x; tð Þ þ f z x; tð Þð Þ: ð6Þ
Here, z(x, t) is the height of the surface, at lateral position x(the position along a line in a 1+1-dimensional model orposition in a plane in a 2+1-dimensional model) at time t.The height is measured in a moving coordinate system withrespect to a plane that is parallel to the initially flat surface.[40] The term n(x, t) represents the effects of stochastic
processes, which may have a variety of origins. The essenceof this equation is that the growth rate @z/@t at any pointdepends only on the local properties of the surface and theeffects of fluctuations (noise). The function f (z(x, t))depends on the local slope and curvature of the surfaceand it describes the physics of the growth process.[41] In many surface growth equations, the noise is
‘‘annealed’’ noise and this noise drives the evolution ofthe interface [Meakin, 1998]. The simplest model for thenoise n(x, t) is a spatially uncorrelated Gaussian distributionwith
n x; tð Þh i ¼ 0 ð7Þ
and
n x; tð Þn x0; t0ð Þh i ¼ 2Dd x� x0ð Þd t � t0ð Þ; ð8Þ
where D is a diffusion coefficient. For this annealed noisethe fluctuations n(x, t) have no time correlations.[42] In the case of stylolite growth, the dominant contri-
bution to the noise n(x, t) is directly related to the spatialheterogeneities in the material, which can be considered aslocal variations of the chemical or mechanical properties ofthe solid. Under these conditions, the growth equation can bewritten in the form of equation (6), where n(x, z(x, t)) is thetime independent quenched noise. This quenched noise is nota consequence of the noisy dynamics of the system. Instead,the noise is a consequence of the essentially time indepen-dent heterogeneities embedded in the system, and the timedependence of this noise is a consequence of the propagationof the interface through the heterogeneous medium. Theaddition of material heterogeneities introduces a significantdifference from the Asaro-Tiller-Grinfeld instability.[43] To develop a model for stylolite evolution, we take
into account two competing processes: the effects of thestress through the elastic energy, which amplifies perturba-tions, and the effects of the interfacial energy, which tendsto smooth the surface. We shall consider the situation afterlocalization of the strain along an interface. Dissolution issupposed to take place along an existing flat discontinuity.The general equation for surface growth driven by quenchednoise (equation (6)) is replaced by
1
m
dz
dt¼ W
2 1� n2ð ÞE
s20 1þ 1
pPV
Z 1
�1
�z x0ð Þ � z xð Þx0 � xð Þ2
dx0
!
þ Wgd2z
dx2þ h x; z xð Þð Þ; ð9Þ
where s0 is the average effective external stress, which canalso take into account the effects of fluid pressure, E is the
B03209 RENARD ET AL.: THREE-DIMENSIONAL MORPHOLOGY OF STYLOLITES
9 of 12
B03209

effective Young’s modulus, n is an effective Poissoncoefficient. PV stands for the Principal Value. This is theintegration between �1 and +1 without the contributionat 0, where the integral diverges. Equation (9) includes threedriving forces: the long-range elastic interactions, the localcapillary effects, which have a stabilizing influence, and thequenched noise fluctuations. The Wgd2z
dx2term arises because
there is a greater density of active zone sites in concaveparts of the surface than there are in convex parts ofthe surface, this accounts for surface tension effects. The
non-linear term W2 1�n2ð Þ
Es02(1 + 1
pPVR1�1
z x0ð Þ�z xð Þx0�xð Þ2 dx
0) arises
because the height of the stylolite depends on the stressevaluated over the entire surface. This is a non-local term,which takes into account long-range stress effects. This termcan be calculated using the mathematics of Green’sfunctions [Bilby and Eshelby, 1968; Gao and Rice, 1989].[44] We have solved numerically equation (9) for the
1+1-dimensional case using an event driven algorithm[Schmittbuhl et al., 1995; Schmittbuhl and Vilotte, 1999].This model consists of a sequence of ‘‘growth events’’ butthe number of events is not necessarily linearly related toelapsed time in the physical system. The periodic interfaceis discretized in 2048 elements. At the start of a simulation,the interface is flat. At each step, the cell that exhibits themaximum speed dz/dt according to equation (9) is located.This cell is then advanced by a random amount dh uni-formly sampled from the range [0, 1]. The local fluctuationof the chemical potential h(x, z(x)) is updated from aprescribed distribution chosen to be uniform over the range[0, 1]. In this model the interface always advances into themost unstable cell. After a transient regime, we observedthat the width of a rough interface approaches a stationaryvalue. The result is a rough profile that can be comparedwith that measured on a real stylolite (Figure 9).[45] The profiles were analyzed and the results were
averaged over 500 simulations. A well-defined crossoverlength, which is controlled by the balance between the
magnitude of the elastic and capillary effects separatestwo self-affine regimes (Figure 10).
3.3. Discussion
[46] As expected, the mechanical regime with an expo-nent H1 � 0.4, is dominant at small wave-numbers (largelength scales). At large wave-numbers (small length scales),the capillary regime dominates with an effective Hurstexponent close to H2 � 1.2. The Hurst exponents obtainedfrom the model are slightly different from the valuesobtained by analyzing real stylolites.[47] This might be explained by the dimension difference:
The natural surfaces are 2+1-dimensional interfaces, but themodel is 1+1-dimensional. This is a fundamental difference,and in most cases, for most growth models, the character-istic exponents depend on the dimensionality of the growingsurface and the dimensionality of the space in which thesurface is growing.[48] The main success of the model is its reproduction
of two self-affine scaling regimes separated by a rapidcrossover. It gives some physical understanding of thecrossover and a possible link with physical parameters.[49] Kassner et al. [2001] performed a linear stability
analysis of the competition between mechanical and capil-lary forces in the case of a stressed solid in equilibrium withits melt and showed that there is a characteristic length scalelc for which the effects of elastic stress and surface tensioncancel. This specific length scale can be extracted fromequation (9) and is equal to
lc ¼ Eg=2s20 1� n2 �
; ð10Þ
where E is the Young’s modulus of the solid, s0 is thenormal stress, g is the solid-fluid interfacial energy, and n isthe Poisson coefficient of the solid. Typical values for
Figure 9. Lower curve: Measured profile in the Xdirection on the stylolite S12. Upper curve: Result of onesimulation according to equation (9).
Figure 10. Wavelet analysis of 1D surface rougheningaccording to equation (9). The competition between stresseffects and surface tension leads to two scaling regimes. Forsmall wavelengths, H1 = 1.2, whereas for large wavelengthsH2 = 0.4.
B03209 RENARD ET AL.: THREE-DIMENSIONAL MORPHOLOGY OF STYLOLITES
10 of 12
B03209

limestones are E = 8 � 1010 N/m2, n = 0.25, and g = 0.27 J/m2
for a water-calcite surface. As we obtain lc � 1 mm, we canevaluate the required stress: s0� 4.8MPa. This is consistentwith the values of differential stresses in the first twokilometers of the crust.[50] The crossover length scale lc is controlled by
the balance between the elastic forces on the interface andthe ‘‘capillary’’forces. We propose that lc corresponds to thecharacteristic length a* measured on the stylolites. Since lcdepends on the stress s0 at which the stylolite developed, itprovides a way to estimate the value of a ‘‘fossil’’ stress inthe solid. However, the stress effects would have to beintegrated with all its complexity to quantify this fossilstress. This is a challenging problem.[51] On small length scales, the Hurst exponent is close to
1.1. This value is similar that obtained from simulations ofquasi-static pinning of fluid interfaces [Roux and Hansen,1994]. In their model, the front of a propagating interfacecan be pinned by impurities with random strengths. Thepropagation front is shown to develop a self-affine profile,with an effective Hurst exponent close to 1.2. In theircalculations, this exponent is characteristic of a processdominated by capillary effects.
4. Conclusions
[52] We have studied sedimentary stylolites in limestonesthat can be separated to reveal the delicate three-dimen-sional geometry of their two sides. Laser and mechanicaltopographical measurements indicate that stylolite surfaceshave two scaling regimes separated by a well-definedcharacteristic length scale: at small wavelengths, the effec-tive Hurst exponent is equal to 1.1 m, whereas at longwavelengths it is close to 0.5. The crossover between thetwo scaling behaviors defines the characteristic scale a* ofthe surface. We propose that a* characterizes the competi-tion between two effects: capillary forces that tend tosmooth the surface and stress perturbations related to theheterogeneity of the rock that amplify instabilities. Wepropose that the crossover length a* provides a measureof a fossil stress along the interface. To proceed further inthis analysis would require additional measurements ofproperties that might influence the growth of stylolitesincluding the grain size, temperature, age, mineral content,porosity, and permeability. The effects of these variables onthe crossover length a* and other aspects of the stylolitemorphology would need to be determined. This would be achallenging task because these quantities cannot be inde-pendently varied. A combination of physical and geologicalunderstanding may lead the idea that one or more of theseparameters have a dominant influence on stylolite forma-tion. It would be necessary to study a large number ofstylolite surfaces collected from a variety of geologicalsettings to test such an idea.[53] We have proposed a simple 1+1-dimensional phe-
nomenological model of surface growth based on the twomain ingredients of stylolite formation: strain energy andinterface energetics. By propagation of a surface under theinfluence of these two components in a noisy (heteroge-neous) solid, we can reproduce the crossover between twoscaling behaviors with power-law exponents similar tothose measured using stylolites. This is a promising
approach, and the next step will be to solve the problemin three-dimensions, i.e., the propagation of a 2+1-dimen-sional interface in three-dimensional space.[54] Another characteristics of stylolites is the collective
behavior of an ensemble of stylolites in a rock. They tend toanastomose and cut across each other. We did not investi-gate this problem in this study. However, it poses anadditional challenge that must be met to develop a compre-hensive understanding of the formation of stylolite patterns.
[55] Acknowledgments. P. Meakin, E. Merino, and F. Renard wouldlike to thank the Center for Advanced Studies at the Norwegian Academyof Science and Letters for its support during the early stages of this project.This project was supported by the Centre National de la RechercheScientifique (ATI and GDR Corinthe to F. Renard) and the French Ministryof Education (ACI to J. Schmittbuhl). We would like to thank C. Pequegnatand D. Tisserand for their technical help. We acknowledge A. Crave,D. Rothman, J. Rice, A. Lobkovsky, B. Evans, M. Bruneton, Y. Bernabe,H. Perfettini, Z. K. Karcz, and B. Goffe for very fruitful discussions, andS. Hickman, A. Revil, and R. Fletcher for helpful reviews.
ReferencesArthaud, F., and M. Mattauer (1969), Exemples de stylolites d’originetectonique dans le Languedoc, leur relation avec la tectonique cassante,Bull. Soc. Geol. Fr., 11, 738–744.
Asaro, R., and W. Tiller (1972), Interface morphology development duringstress corrosion cracking: Part 1, Via surface diffusion, Metall. Trans.,1789–1796.
Barabasi, A. L., and E. H. Stanley (1995), Fractal Concepts in SurfaceGrowth, Cambridge Univ. Press, New York.
Bathurst, R. (1971), Carbonate Sediments and Their Diagenesis, ElsevierSci., New York.
Bayly, B. (1986), A mechanism for development of stylolites, J. Geol., 94,431–435.
Bilby, B. A., and J. D. Eshelby (1968), Dislocations and theory of fracture,in Fracture: An Advanced Treatise, vol. 1, edited by H. Liebowitz,pp. 99–182, Academic, San Diego, Calif.
Boffa, J., C. Allain, and J.-P. Hulin (1998), Experimental analysis of frac-ture rugosity in granular and compact rocks, Eur. Phys. J. Appl. Phys., 2,281–289.
Carrio-Schaffhauser, E., S. Raynaud, H. Latiere, and F. Mazerolles (1990),Propagation and localization of stylolites in limestones, in DeformationMechanisms: Rheology and Tectonics, edited by M. Jones and R. Preston,Geol. Soc. Spec. Publ., 54, 193–199.
Deelman, J. (1976), Lithification analysis: Experimental observations,Geol. Rundsch., 65, 1055–1078.
Delair, J., and C. Leroux (1978), Mthode de quantification de la disparitionde matire au niveau de stylolites tectoniques et mcanismes de la dforma-tion cassante des calcaires, Bull. Soc. Geol. Fr., 20, 137–144.
Dewers, T., and P. Ortoleva (1990), A coupled reaction/transport/mechan-ical model for intergranular pressure solution stylolites, and differentialcompaction and cementation in clean sandstones, Geochim. Cosmochim.Acta, 54, 1609–1625.
Dickinson, W., and K. Milliken (1995), The diagenetic role of brittledeformation in compaction and pressure solution, Etjo sandstone,Namibia, J. Geol., 103, 339–347.
Drumond, C. N., and D. Sexton (1998), Fractal structure of stylolites,J. Sediment. Res., 1, 8–10.
Dunnington, H. (1954), Stylolites development post-date rock induration,J. Sediment. Petrol., 24, 27–49.
Dunnington, H. (1967), Aspects of diagenesis and shape change in styloliticlimestone reservoirs, in 7th World Petroleum Congress, vol. 2, pp. 339–352, The Congress, Mexico City.
Fletcher, R. A., and D. D. Pollard (1981), Anticrack model for pressuresolution surfaces, Geology, 9, 419–424.
Gal, D., and A. Nur (1998), Elastic strain energy as a control in theevolution of asymmetric pressure-solution contacts, Geology, 26, 663–665.
Gal, D., A. Nur, and E. Aharonov (1998), Stability analysis of a pressure-solution surface, Geophys. Res. Lett., 25, 1237–1240.
Gao, H., and J. R. Rice (1989), A first-order perturbation analysis of cracktrapping by arrays of obstacles, J. Appl. Mech., 56, 828–836.
Gratier, J.-P., P. Favreau, and F. Renard (2003), Modeling fluid transferalong California faults when integrating pressure solution crack sealingand compaction processes, J. Geophys. Res., 108(B2), 2104, doi:10.1029/2001JB000380.
B03209 RENARD ET AL.: THREE-DIMENSIONAL MORPHOLOGY OF STYLOLITES
11 of 12
B03209

Gratier, J., L. Muquet, R. Hassani, and F. Renard (2004), Experimentalmicrostylolites in quartz and modeled application to natural structures,J. Struct. Geol., in press.
Grinfeld, M. (1986), Instability of the separation boundary between a non-hydrostatically stressed solid and a melt, Sov. Phys. Dokl., Engl. Transl.,31, 831–835.
Guzzetta, G. (1984), Kinematics of stylolite formation and physics of thepressure-solution process, Tectonophysics, 101, 383–394.
Hansen, A., J. Schmittbuhl, G. Batrouni, and F. D. Oliveira (2000), Normalstress distribution of rough surfaces in contact, Geophys. Res. Lett., 27,3639–3643.
Heald, M. (1959), Stylolites in sandstones, J. Geol., 63, 101–114.Kamb, W. B. (1959), Theory of preferred crystal orientations developed bycrystallization under stress, J. Geophys. Res., 67, 153–170.
Karcz, Z., and C. H. Scholz (2003), The fractal geometry of some stylolitesfrom the Calcare Massiccio Formation, Italy, J. Struct. Geol., 25, 1301–1316.
Kassner, K., C. Misbah, J. Muller, J. Kappey, and P. Kohlert (2001), Phase-field modeling of stress-induced instabilities, Phys. Rev. E, 63,doi:10.1103/PhysRevE.63.036117. (Available at http://link.aps.org/abstract/PRE/v63/e036117)
Kim, S., Z. H. Yoon, and T. H. Kwon (1997), Scaling behavior of aself-affine fractal interface in a cement fracture experiment, Phys. A,246, 320–328.
Maloy, K. J. (1992), Experimental measurements of the roughness of brittlecracks, Phys. Rev. Lett., 68, 213–215.
Mandelbrot, B., D. E. Passoja, and A. J. Paullay (1984), Fractal character offracture surfaces of metals, Nature, 308, 721–722.
Meakin, P. (1998), Fractals: Scaling and Growth Far From Equilibrium,Cambridge Univ. Press, New York.
Mehrabi, A. R., H. Rassamdana, and M. Sahimi (1997), Characterization oflong-range correlations in complex distributions and profiles, Phys. Rev.E, 56, 712–722.
Merino, E., and Y. Wang (2001), Geochemical self-organization in rocks:Occurrences, observations, modeling, testing—With emphasis on agategenesis, in Yearbook Self-Organization, vol. 11, Non-equilibrium Pro-cesses and Dissipative Structures in Geosciences, pp. 13–45, Dunckerand Humblot, Berlin.
Merino, E., P. Ortoleva, and P. Strickholm (1983), Generation of evenlyspaced pressure solution seems during late diagenesis: A kinetics theory,Contrib. Mineral. Petrol., 82, 360–370.
Muller, J., and M. Grant (1999), Model of surface instabilities induced bystress, Phys. Rev. Lett., 82, 1736–1739.
Nozieres, P. (1995), The Grinfeld instability of stressed crystals, in Spatio-Temporal Patterns in Nonequilibrium Complex Systems: NATOAdvanced Research Workshop, vol. 21, edited by P. E. Cladis andP. Palffy-Muhoray, p. 65, Addison-Wesley-Longman, Reading, Mass.
Oelkers, E. H., P. A. Bjørkum, and W. M. Murphy (1996), A petrographicand computational investigation of quartz cementation and porosityreduction in North Sea sandstones, Am. J. Sci., 296, 420–452.
Ortoleva, P. (1994), Geochemical self-organization, Oxford Univ. Press,New York.
Park, W., and E. Schot (1968), Stylolites: Their nature and origin, J. Sedi-ment. Petrol., 38, 175–191.
Power, W. L., W. B. Durham, S. R. Brown, G. N. Boitnott, and C. H.Scholz (1987), Roughness of natural fault surfaces, Geophys. Res. Lett.,14, 29–32.
Roux, S., and A. Hansen (1994), Interface roughening and pining, J. Phys.I, 4, 515–538.
Rutter, E. (1976), The kinetics of rock deformation by pressure solution,Philos. Trans. R. Soc. London, Ser. A, 283, 203–219.
Schmittbuhl, J., and J. Vilotte (1999), Interfacial crack front wandering:Influence of correlated quenched noise, Phys. A, 270, 42–56.
Schmittbuhl, J., S. Gentier, and S. Roux (1993), Field-measurements ofthe roughness of fault surfaces, Geophys. Res. Lett., 20, 639–641.
Schmittbuhl, J., S. Roux, J. Vilotte, and K. Maløy (1995), Interfacial crackpinning: Effect of non local interactions, Phys. Rev. Lett., 74, 1787–1790.
Simonsen, I., A. Hansen, and O. M. Nes (1998), Using wavelet transformsfor Hurst exponent determination, Phys. Rev. E, 58, 2779–2787.
Simonsen, I., D. Vandembrouck, and S. Roux (2000), Wave scattering forself-affine surfaces, Phys. Rev. E, 61, 5914–5917.
Smith, J. V. (2000), Three-dimensional morphology and connectivity ofstylolites hyperactivated during veining, J. Struct. Geol., 22, 59–64.
Stockdale, P. (1922), Stylolites: Their nature and origin, Ph.D. thesis,Indiana Univ. Stud., Bloomington.
Thomas, R., W. M. Dahl, C. M. Hall, and D. York (1993), Ar40/Ar39
analyses of authigenic muscovite, timing of stylolitization, and implica-tions for pressure solution mechanisms—Jurassic norphlet formation,offshore Alabama, Clays Clay Miner., 41, 269–279.
Weyl, P. (1959), Pressure-solution and the force of crystallization: Aphenomenological theory, J. Geophys. Res., 64, 2001–2025.
�����������������������J.-P. Gratier and F. Renard, Laboratoire de Geophysique Interne et
Tectonophysique, Universite Joseph Fourier, BP 53, 38041 Grenoble,France. ([email protected]; [email protected])P. Meakin, Idaho National Engineering and Environmental Laboratory,
P.O. Box 1625, Mail Stop 2025, Idaho Falls, ID 83415-2025, USA.([email protected])E. Merino, Department of Geology, Indiana University, Bloomington, IN
47405, USA. ([email protected])J. Schmittbuhl, Ecole Normale Superieure, 24 rue Lhomond, 75231 Paris,
France. ([email protected])
B03209 RENARD ET AL.: THREE-DIMENSIONAL MORPHOLOGY OF STYLOLITES
12 of 12
B03209