three-dimensional morphological evaluation of the hard ... · palatal soft tissue, but is not...
TRANSCRIPT

Three-dimensional morphological evaluation of the hard palate in Korean adults with mild-to-moderate obstructive sleep apnea
Objective: The purpose of this study was to evaluate differences in three-dimensional (3D) morphology of the hard palate between Korean adults with and without mild-to-moderate obstructive sleep apnea (OSA) using cone-beam computed tomographic (CBCT) data. Methods: The protocol for the two-dimensional (2D) and 3D mathematical modeling was established by analyzing CBCT images of 30 adults with OSA and 30 matched controls without OSA, using MIMICS software. The linear and angular measurements were also determined using this software. The measurements were repeated for 30 palates, by the same operator, to assess reliability. Results: The palates of OSA patients were higher in the posterior part and narrower in the anterior-superior part than those of the control group (p < 0.05). The nasal cavities of patients with OSA were narrower (p < 0.05) than those of controls. The increasing angle of the first molar palatal root is a compensation of the upper dental arch to improve occlusion. However, for most palatal measurements, there were no significant differences between the OSA and control groups (p > 0.05). The results of 2D and 3D mathematical models were consistent for linear and angular measurements, indicating that 2D and 3D mathematical modeling of the palate is a reliable methodology. Conclusions: OSA is a multifactorial disease; the palates of adults with mild-to-moderate OSA do not have specific morphological features distinct from those of healthy controls.[Korean J Orthod 2018;48(3):133-142]
Key words: Cone-beam computed tomography, Hard palate, Morphology, Obs-tructive sleep apnea
Chen Yua Hyo-Won Ahnb Seong-Hun Kimb
aDepartment of Orthodontics, Medical College of Xiamen University, Xiamen, ChinabDepartment of Orthodontics, Graduate School, Kyung Hee University, Seoul, Korea
Received July 3, 2017; Revised September 20, 2017; Accepted October 1, 2017.
Corresponding author: Seong-Hun Kim.Professor and Head, Department of Orthodontics, School of Dentistry, Kyung Hee University, 26 Kyungheedae-ro, Dongdaemun-gu, Seoul 02447, KoreaTel +82-2-958-9392 e-mail [email protected]
This research was partly from the PhD thesis of Chen Yu at Kyung Hee University Gra-duate School, Seoul, Korea.
133
© 2018 The Korean Association of Orthodontists.
The authors report no commercial, proprietary, or financial interest in the products or companies described in this article.
This is an Open Access article distributed under the terms of the Creative Commons Attribution Non-Commercial License (http://creativecommons.org/licenses/by-nc/4.0) which permits unrestricted non-commercial use, distribution, and reproduction in any medium, provided the original work is properly cited.
THE KOREAN JOURNAL of ORTHODONTICSOriginal Article
pISSN 2234-7518 • eISSN 2005-372Xhttps://doi.org/10.4041/kjod.2018.48.3.133
Yu et al • 3D-palatal shape of OSA-patients
www.e-kjo.org134 https://doi.org/10.4041/kjod.2018.48.3.133
INTRODUCTION
Obstructive sleep apnea (OSA) is sleep disordered breathing that is characterized by prolonged partial and/or intermittent collapse of the airway during sleep, which interrupts normal ventilation and normal sleep patterns. Its prevalence is 4% in men and 2% in women between 30 and 60 years of age; the incidence is higher in elderly individuals.1 The airway obstruction results in hypopnea and apnea, despite persisting respiratory efforts. As a result, hypoxia and hypercapnia develop, ventilation is stimulated, and arousal from sleep is often required in response to respiratory activation in order to reestablish airway patency to allow a recovery of ventilation. Thus, upper airway collapse is the key factor in OSA.2
The nose is the first anatomic boundary of the upper airway, which cannot collapse due to supportive bone and cartilage, but increased nasal resistance may generate a downward upper airway suction force, and the consequent collapse contributes to OSA.3 In addition, since nasal obstruction is associated with a greater proportion of mouth breathing at night, lack of nasal afferent stimulus by airflow results in decreased activity of the pharyngeal dilator muscles, which also contributes to OSA.4 Some studies have shown the interaction between nasal obstruction and pharyngeal narrowing in the pathophysiology of OSA, and have suggested that nasal obstruction is a possible independent factor in the pathophysiology of OSA.5
Since the maxillary bones form half of the nasal cavity’s structures, the size of the nasal cavity is closely related to the nasomaxillary complex. Patients with Marfan syndrome have a high prevalence of OSA, because of maxillary dysplasia that is characterized by a narrow nasal cavity and high-arched palate.6 A previous study about the influence of maxillary constriction on nasal resistance in patients with Marfan syndrome found an association between maxillary constriction
with a relatively high hard palate and high nasal airway resistance, suggesting an important interrelationship between maxillary morphology and the nasal cavity.7 However, OSA is a multifactorial disease, and whether all patients with OSA have narrow and high palates remains to be established.
The morphology of the palate is usually assessed by measuring the distance between landmarks on study casts or on three-dimensional (3D) models constructed by 3D laser scanning data, which yields incomplete information about the 3D morphology of the palatal vault.8 A recent study involving 3D analysis of palatal morphology in OSA patients used only intercanine width, intermolar width, and palatal volume as measurement indexes to describe the morphology of the palate, which is insufficient.9 Although 3D visual data are readily available with cone-beam computed tomography (CBCT), the most relevant method of palatal analysis with CBCT data to date involves obtaining linear and angular measurements of the palate, or setting up two-dimensional (2D) mathematical models of the shape of some specific parts of the palate.10,11 However, they used a parabolic equation, which can be used for smooth palatal soft tissue, but is not applicable to the relatively irregular palatal bone surface.
The aim of the study was to evaluate the 3D morphology of hard palate differences in Korean adults with and without OSA, using CBCT, and to visualize the differences between these two groups by 2D and 3D mathematical modeling of the palate.
MATERIALS AND METHODS
Patient selection Patients between 30 and 60 years of age, who had
been referred to Department of Orthodontics in Kyung Hee University Dental Hospital (Seoul, Korea) and who satisfied the following inclusion criteria were included: signs and symptoms of OSA (including habitual snoring,
Table 1. Demographic data of samples included in the study
Obstructive sleep apnea Control p-value
Age (yr) 54.17 ± 6.80 55.23 ± 6.95 0.212
Body mass index (kg/m2) 26.92 ± 3.01 – –
Apnea hypopnea index 17.21 ± 5.34 – –
Upper pharynx width (mm) – 17.55 ± 2.10 –
Lower pharynx width (mm) – 14.48 ± 4.89 –
ANB 3.98 ± 2.02 3.75 ± 2.35 0.173
FMA 26.14 ± 4.69 26.54 ± 5.81 0.112
Values are presented as mean ± standard deviation.Refer to Figure 1 for the definitions of measurements.
Yu et al • 3D-palatal shape of OSA-patients
www.e-kjo.org 135https://doi.org/10.4041/kjod.2018.48.3.133
apnea, and restless sleep, as witnessed by family members), 5 < apnea hypopnea index (AHI) < 30 as defined by a laboratory polysomnography recording, and the presence of at least 12 teeth in the maxillary arch. The average age of the 21 men and 9 women included in the study was 54.17 ± 6.80 years (mean ± standard deviation); the average body mass index (BMI, kg/m2) was 25.54 ± 2.46, and the mean AHI was 24.12 ± 14.58. For the control group, patients without signs and symptoms of OSA, as established by checking personal history at their first visit and their pharynx width on lateral cephalometric radiographs, who had undergone CBCT for other treatments, such as prosthodontic treatment, implantation, and temporomandibular joint disease treatment, were recruited from Kyung Hee University Dental Hospital. They were paired with patients in the OSA group by sex, age, and skeletal classification with OSA group (Table 1). Patients were excluded from both groups if they had any of the following conditions: a history of previous treatment for OSA and orthodontic treatment, obesity (BMI ≥ 30),12 acute or chronic cardiorespiratory or neuromuscular diseases, or dysmorphism or associated chromosomal syndromes.
All participants provided written informed consent for participation in the study. The study procedures were approved by the hospital ethics committee (KHD IRB 1604-1).
CBCT protocolCBCT scans were performed with a 0.2-mm voxel
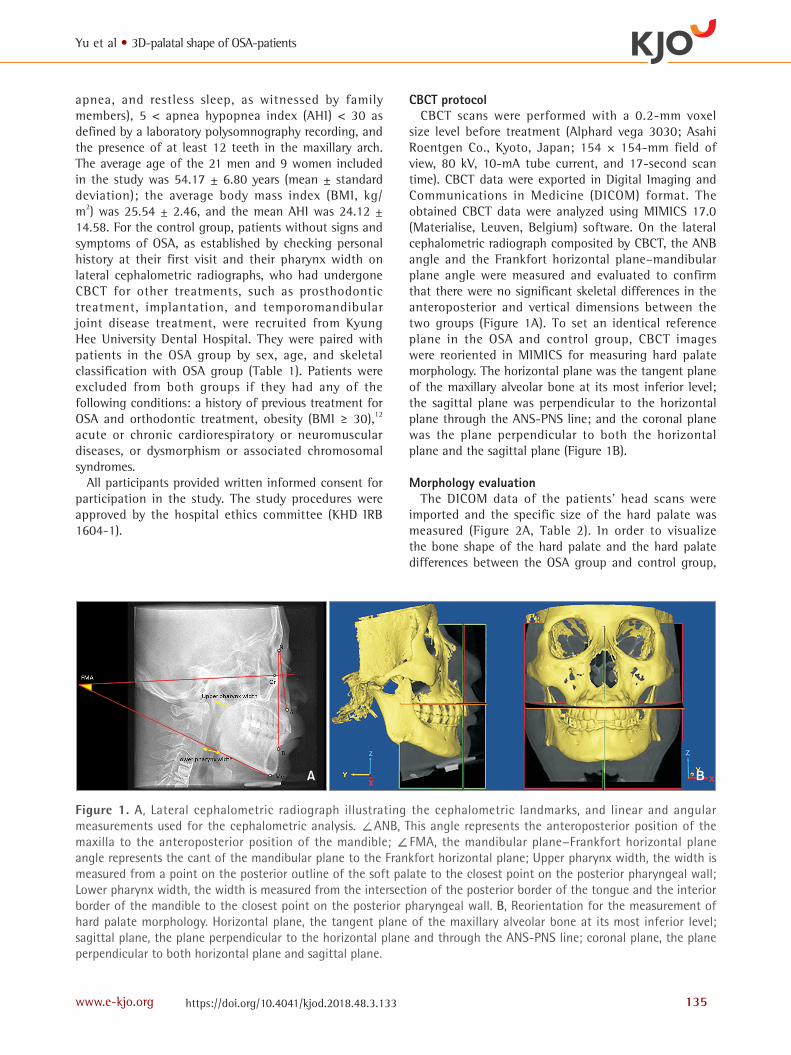
size level before treatment (Alphard vega 3030; Asahi Roentgen Co., Kyoto, Japan; 154 × 154-mm field of view, 80 kV, 10-mA tube current, and 17-second scan time). CBCT data were exported in Digital Imaging and Communications in Medicine (DICOM) format. The obtained CBCT data were analyzed using MIMICS 17.0 (Materialise, Leuven, Belgium) software. On the lateral cephalometric radiograph composited by CBCT, the ANB angle and the Frankfort horizontal plane–mandibular plane angle were measured and evaluated to confirm that there were no significant skeletal differences in the anteroposterior and vertical dimensions between the two groups (Figure 1A). To set an identical reference plane in the OSA and control group, CBCT images were reoriented in MIMICS for measuring hard palate morphology. The horizontal plane was the tangent plane of the maxillary alveolar bone at its most inferior level; the sagittal plane was perpendicular to the horizontal plane through the ANS-PNS line; and the coronal plane was the plane perpendicular to both the horizontal plane and the sagittal plane (Figure 1B).
Morphology evaluationThe DICOM data of the patients’ head scans were
imported and the specific size of the hard palate was measured (Figure 2A, Table 2). In order to visualize the bone shape of the hard palate and the hard palate differences between the OSA group and control group,
A B
Figure 1. A, Lateral cephalometric radiograph illustrating the cephalometric landmarks, and linear and angular measurements used for the cephalometric analysis. ∠ANB, This angle represents the anteroposterior position of the maxilla to the anteroposterior position of the mandible; ∠FMA, the mandibular plane−Frankfort horizontal plane angle represents the cant of the mandibular plane to the Frankfort horizontal plane; Upper pharynx width, the width is measured from a point on the posterior outline of the soft palate to the closest point on the posterior pharyngeal wall; Lower pharynx width, the width is measured from the intersection of the posterior border of the tongue and the interior border of the mandible to the closest point on the posterior pharyngeal wall. B, Reorientation for the measurement of hard palate morphology. Horizontal plane, the tangent plane of the maxillary alveolar bone at its most inferior level; sagittal plane, the plane perpendicular to the horizontal plane and through the ANS-PNS line; coronal plane, the plane perpendicular to both horizontal plane and sagittal plane.

Yu et al • 3D-palatal shape of OSA-patients
www.e-kjo.org136 https://doi.org/10.4041/kjod.2018.48.3.133
the hard palate was isolated for further mathematical modeling, as shown in Figure 2B. The ANS-PNS was divided into 14 pieces in the sagittal section (‘1’ in Figure 2B), and then in each coronal section that corresponded with these 14 pieces. Along the contour line of the palatal bone, 8 points were chosen (‘2’ in Figure 2B). In total, there were 113 points for establishing the 3D surface of the palatal bone (‘3’ in Figure 2B). The 3D landmark coordinates were obtained and the
anatomical locations determined. By standardizing the points on the surfaces, the relative location of the 113 points had a one-to-one correspondence between samples, without losing size information about the hard palate. The coordinates of landmarks were used to record the relative positions of morphological points, boundary curves, and surfaces as the basis of shape quantification. We then calculated the average position of each point for the OSA and control groups, in order
Figure 2. A, Linear and angular measurement for hard palate morphology and the first molar. 1 and 2, Measurement of palatal length, width, and height; 3, the width of the nasal cavity and the angle of the first molar palatal root on the first molar coronal plane; 4, the palatal slope inclination and the width of the palate roof (upper width) on the first premolar and first molar coronal plane. B, The three-dimensonal (3D) surface set up using generalized additive models with integrated smoothness estimation based on the cone-beam computed tomography (CBCT) data set. 1, ANS-PNS was divided into 14 pieces in the sagittal section; 2, in each coronal section corresponding to these 14 pieces, along the contour line of the palatal bone, 8 points were chosen; 3, in total, 113 points were chosen for establishing the 3D surface of palatal bone; 4 and 5, 3D surface of palatal bone. C, A nonlinear curve approximation model of the palatal bone contour line in the first premolar (1), first molar (2), palatal suture (3), and palatal undersurface section (4) were set up based on the CBCT data set.
A
B C
1 2
3 4
1 2
3 4
1 2
3 4 5
Yu et al • 3D-palatal shape of OSA-patients
www.e-kjo.org 137https://doi.org/10.4041/kjod.2018.48.3.133
to establish the average 3D surface for each group using generalized additive models, with integrated smoothness estimation based on the average points (‘4’ and ‘5’ in Figure 2B). In order to validate the accuracy of the 3D surface and the differences in details between the OSA and control groups in some important anatomical
sections, the nonlinear curve approximation model of the palatal bone contour line in the first premolar, first molar, palatal suture, and palatal undersurface section was constructed (Figure 2C).
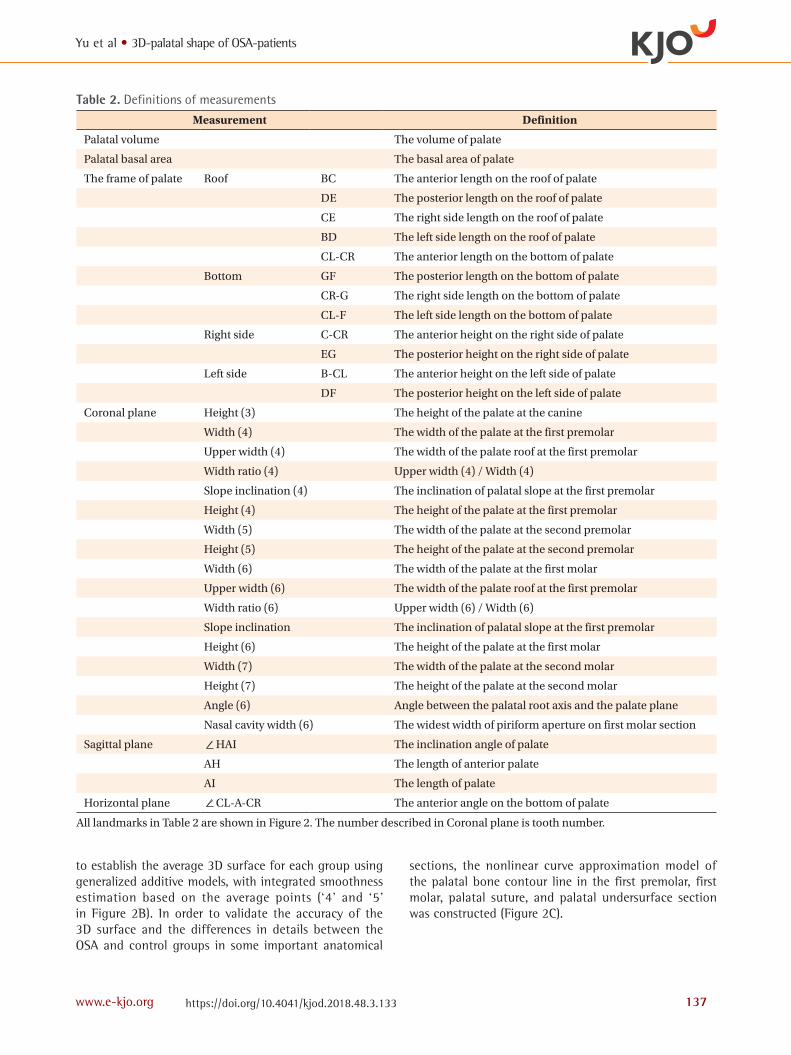
Table 2. Definitions of measurements
Measurement Definition
Palatal volume The volume of palate
Palatal basal area The basal area of palate
The frame of palate Roof BC The anterior length on the roof of palate
DE The posterior length on the roof of palate
CE The right side length on the roof of palate
BD The left side length on the roof of palate
CL-CR The anterior length on the bottom of palate
Bottom GF The posterior length on the bottom of palate
CR-G The right side length on the bottom of palate
CL-F The left side length on the bottom of palate
Right side C-CR The anterior height on the right side of palate
EG The posterior height on the right side of palate
Left side B-CL The anterior height on the left side of palate
DF The posterior height on the left side of palate
Coronal plane Height (3) The height of the palate at the canine
Width (4) The width of the palate at the first premolar
Upper width (4) The width of the palate roof at the first premolar
Width ratio (4) Upper width (4) / Width (4)
Slope inclination (4) The inclination of palatal slope at the first premolar
Height (4) The height of the palate at the first premolar
Width (5) The width of the palate at the second premolar
Height (5) The height of the palate at the second premolar
Width (6) The width of the palate at the first molar
Upper width (6) The width of the palate roof at the first premolar
Width ratio (6) Upper width (6) / Width (6)
Slope inclination The inclination of palatal slope at the first premolar
Height (6) The height of the palate at the first molar
Width (7) The width of the palate at the second molar
Height (7) The height of the palate at the second molar
Angle (6) Angle between the palatal root axis and the palate plane
Nasal cavity width (6) The widest width of piriform aperture on first molar section
Sagittal plane ∠HAI The inclination angle of palate
AH The length of anterior palate
AI The length of palate
Horizontal plane ∠CL-A-CR The anterior angle on the bottom of palate
All landmarks in Table 2 are shown in Figure 2. The number described in Coronal plane is tooth number.

Yu et al • 3D-palatal shape of OSA-patients
www.e-kjo.org138 https://doi.org/10.4041/kjod.2018.48.3.133
Statistical analysis and mathematical modelingAll statistical analyses and mathematical modeling
were performed using R (R programming language, 3.2.2 version; R Development Core Team, http://www.r-project.org) and SPSS software ver. 21.0 (IBM Co., Armonk, NY, USA). For every variable measured on the 3D models, the mean and the standard deviation (SD) were calculated. Normality of the data distribution was confirmed using the Shapiro–Wilk test. In order to assess intra-examiner reliability, repeated 3D measurements were performed by the same operator (C.Y.) for 30 randomly selected CBCT data sets at a 1-month interval. The error of the method was calculated according to Dahlberg’s formula as follows: s = S √∑ (d)2 / 2n (where d indicates deviations between the two measurements and n indicates the number of paired objects).13 The statistical differences between the two measurements and landmark placements were assessed using the independent t-test. Hard palate measurements were compared between the two groups using the paired t-test. For all analyses, statistical significance was set at the 0.05 level. For the palatal bone morphology evaluation, average palatal surfaces of the OSA and control groups were set up by generalized additive models with integrated smoothness estimation based on the CBCT data set, and the differences between these two groups were shown by superimposition on a colored map. Mean squared error (MSE) is an evaluation criterion for the representativeness of mathematical models. A nonlinear curve approximation model was carried out for the measured points in the first premolar, first molar, palatal suture, and palatal undersurface section. That is,
y = b0 + b1c + b2c2 + b3c
3 + b4c4
where b0 denotes the intercept, b1 to b4 all called coe-fficients. The values of b i (i = 0, 1, 2, 3, 4) were ob-tained by least square approximation, based on the measured points (Table 3). The pros and cons of curve approximation can be shown by the squared correlation coefficient between the actual y and its approximation value, which is R2, R2 ∈ [0, 1]. A larger R2 value indi-cates that the model is more representative. In our study, R2 was about 0.9 and the MSE was less than 0.3 mm, indicating that the 2D and 3D models were representative mathematical models.
RESULTS
There was no statistically significant difference between the two measurements and landmark place-ment according to the paired t-test. The error of the method was 0.23 mm (SD of d was 0.11 mm) for 3D linear measurements, 13.53 mm2 (SD of d was 6.07
Tabl
e 3.
Val
ues
of b
i (i =
0, 1
, 2, 3
, 4) a
nd R
2 for
the
obs
truc
tive
sle
ep a
pnea
(OSA
) gro
up a
nd t
he c
ontr
ol g
roup
Coe
ffic
ien
tsb 0
b 1b 2
b 3b 4
R2
OSA
Con
trol
OSA
Con
trol
OSA
Con
trol
OSA
Con
trol
OSA
Con
trol
OSA
Con
trol
1st p
rem
olar
7.53
16.
682
2.53
9e −
02
−1.3
52e
− 02
−1.9
54e
− 03
−5.5
03e
− 03
−1.3
64e
− 04
1.62
9e −
04
−1.0
89e
− 04
−7.0
42e
− 05
0.88
40.
884
1st m
olar
1.18
2e +
01
1.15
9e +
01
9.79
0e −
03
−1.5
81e
− 02
8.49
7e −
04
−1.7
69e
− 03
−2.4
26e
− 05
1.54
9e −
04
−9.4
49e
− 05
−7.5
19e
− 05
0.93
70.
936
Mid
pal
atal
su
ture
7.65
6e −
02
5.30
4e −
02
7.65
6e −
01
7.20
9e −
01
−1.0
25e
− 02
−4.0
99e
− 03
−1.6
33e
− 04
−4.8
42e
− 04
3.02
3e −
06
7.43
7e −
06
0.96
00.
959
Un
der
surf
ace
−3.2
68−4
.412
−1.0
95e
− 01
−1.1
40e
− 01
8.26
6e −
02
1.03
1e −
01
1.71
3e −
04
1.01
6e −
04
4.24
2e −
05
−1.1
89e
− 05
0.93
70.
911
A no
nlin
ear
curv
e ap
prox
imat
ion
mod
el f
or t
he m
easu
red
poin
ts in
the
firs
t pr
emol
ar, f
irst
mol
ar, p
alat
al s
utur
e, a
nd p
alat
al u
nder
surf
ace
sect
ion.
b0
deno
tes
the
inte
rcep
t, b 1
to b 4
repr
esen
t co
effi
cien
ts a
nd R
-squ
are
mea
ns C
oeff
icie
nt o
f D
eter
min
atio
n.

Yu et al • 3D-palatal shape of OSA-patients
www.e-kjo.org 139https://doi.org/10.4041/kjod.2018.48.3.133
Table 4. Inter-group comparison of measurements of the hard palate
Variable Obstructive sleep apnea Control p-value
Palatal volume (mm3) 13,335.30 ± 2,390.57 13,223.24 ± 2,639.85 0.864
Palatal basal area (mm2) 1,506.42 ± 178.22 1,574.16 ± 184.50 0.153
The frame of palate
Roof (mm) The anterior width of palate (BC) 19.86 ± 2.36 21.67 ± 4.27 0.047*
The posterior width of palate (DE) 27.22 ± 2.04 26.38 ± 1.89 0.105
The right side length of palate (CE) 24.34 ± 2.39 23.44 ± 3.18 0.220
The left side length of palate (BD) 24.45 ± 2.37 23.54 ± 2.82 0.219
Bottom (mm) The anterior width of palate (CL-CR) 24.01 ± 1.65 24.79 ± 2.11 0.513
The posterior width of palate (GF) 42.26 ± 2.76 40.69 ± 3.92 0.079
The right side length of palate (CR-G) 41.56 ± 3.25 40.81 ± 2.39 0.313
The left side length of palate (CL-F) 41.72 ± 3.37 40.84 ± 2.31 0.244
Right side (mm) The anterior height of palate (C-CR) 15.85 ± 2.55 15.67 ± 2.09 0.770
The posterior height of palate (EG) 16.03 ± 1.98 14.79 ± 2.41 0.033*
Left side (mm) The anterior height of palate (B-CL) 15.81 ± 2.50 15.79 ± 2.08 0.971
The posterior height of palate (DF) 16.04 ± 1.95 15.28 ± 2.55 0.020*
Coronal plane
Height (3) (mm) 4.60 ± 1.26 4.51 ± 1.36 0.781
Width (4) (mm) 29.54 ± 1.84 31.57 ± 2.18 0.061
Upper width (4) (mm) 20.10 ± 1.62 21.64 ± 2.59 0.059
Width ratio (4) 0.69 ± 0.42 0.67 ± 0.61 0.832
Slope inclination (4) (o) 55.32 ± 6.73 55.65 ± 8.80 0.694
Height (4) (mm) 7.51 ± 2.29 7.06 ± 1.91 0.415
Width (5) (mm) 34.45 ± 2.00 35.88 ± 2.79 0.096
Height (5) (mm) 10.47 ± 2.24 9.93 ± 1.77 0.305
Width (6) (mm) 36.57 ± 2.11 37.80 ± 3.14 0.082
Upper width (6) 23.86 ± 2.49 24.75 ± 3.21 0.074
Width ratio (6) 0.66 ± 0.64 0.65 ± 0.62 0.876
Slope inclination (6) (o) 61.45 ± 5.15 60.88 ± 5.91 0.653
Height (6) (mm) 11.99 ± 2.07 11.04 ± 1.93 0.071
Width (7) (mm) 38.09 ± 2.76 38.12 ± 3.33 0.564
Height (7) (mm) 12.51 ± 4.64 10.71 ± 2.30 0.062
Angle (6) (o) 102.67 ± 4.41 97.80 ± 2.77 0.035*
Nasal cavity width (6) (mm) 32.45 ± 2.84 34.20 ± 4.65 0.046*
Sagittal plane
The inclination angle of palate (∠HAI) (o) 31.23 ± 6.08 29.63 ± 4.96 0.270
The length of anterior palate (AH) (mm) 20.28 ± 2.82 20.89 ± 2.28 0.366
The length of palate (AI) (mm) 46.73 ± 4.09 46.23 ± 2.97 0.590
Horizontal plane
The anterior angle of palate (∠CL-A-CR) (o) 126.21 ± 11.01 124.06 ± 6.17 0.358
Values are presented as mean ± standard deviation.Independent t-test was performed; *p < 0.05.Refer to Table 2 for the definitions of measurements.
Yu et al • 3D-palatal shape of OSA-patients
www.e-kjo.org140 https://doi.org/10.4041/kjod.2018.48.3.133
mm2) for measurement of the palatal basal area, 80.75 mm3 (SD of d was 15.14 mm3) for measurement of the palatal volume, and 3.5o (SD of d was 2.07o) for angular measurement, which was within an acceptable limit.
When comparing the OSA and control groups, only the measurements related to the width of the palatal anterior-superior part and the height at the end of the posterior part (BC, EG, and DF; ‘2’ in Figure 2A) of the hard palate showed statistically significant differences (p < 0.05). The first molar palatal root angle of the OSA group was larger than that of the control group, and the nasal cavity width of the OSA group was smaller than that of the control group (p < 0.05) (Table 4). These results demonstrated that OSA patients have a narrow nasal cavity, and that the palate is narrowed in the anterior-superior part and the lower posterior part. Although the palate width of the posterior part was not statistically significantly different between the two groups, the compensatory buccal tipping of the upper first molar implied transverse deficiency of the maxilla as compared to the mandible.
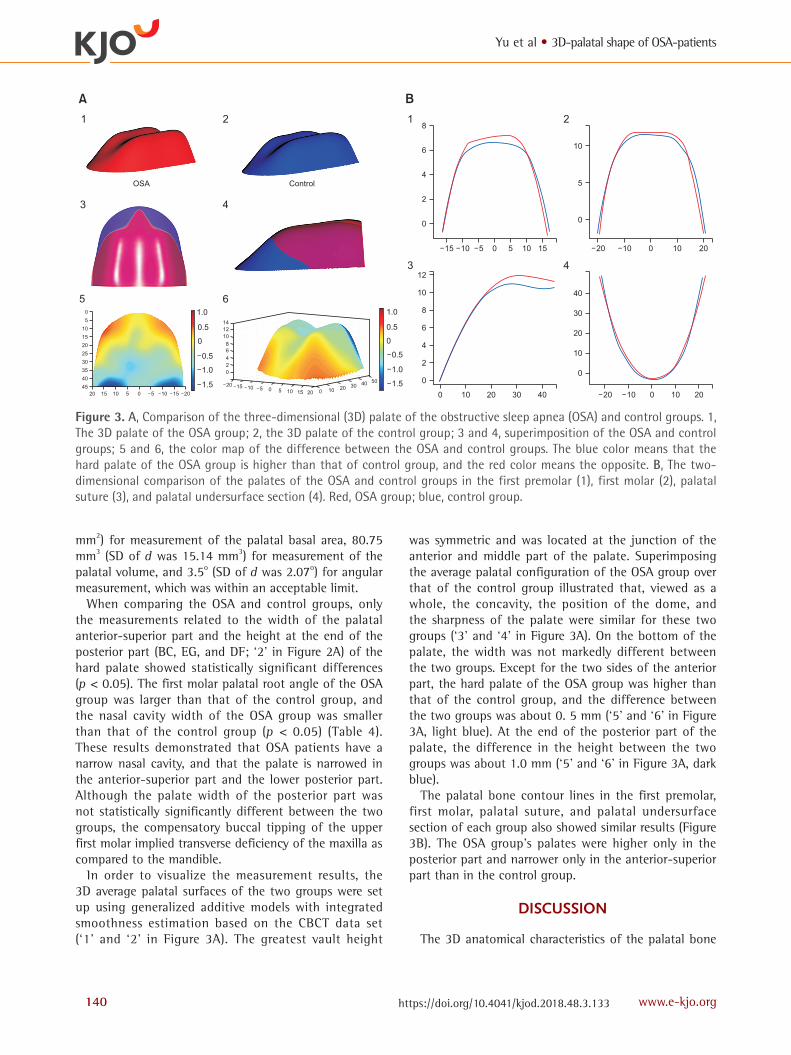
In order to visualize the measurement results, the 3D average palatal surfaces of the two groups were set up using generalized additive models with integrated smoothness estimation based on the CBCT data set (‘1’ and ‘2’ in Figure 3A). The greatest vault height
was symmetric and was located at the junction of the anterior and middle part of the palate. Superimposing the average palatal configuration of the OSA group over that of the control group illustrated that, viewed as a whole, the concavity, the position of the dome, and the sharpness of the palate were similar for these two groups (‘3’ and ‘4’ in Figure 3A). On the bottom of the palate, the width was not markedly different between the two groups. Except for the two sides of the anterior part, the hard palate of the OSA group was higher than that of the control group, and the difference between the two groups was about 0. 5 mm (‘5’ and ‘6’ in Figure 3A, light blue). At the end of the posterior part of the palate, the difference in the height between the two groups was about 1.0 mm (‘5’ and ‘6’ in Figure 3A, dark blue).
The palatal bone contour lines in the first premolar, first molar, palatal suture, and palatal undersurface section of each group also showed similar results (Figure 3B). The OSA group’s palates were higher only in the posterior part and narrower only in the anterior-superior part than in the control group.
DISCUSSION
The 3D anatomical characteristics of the palatal bone
Figure 3. A, Comparison of the three-dimensional (3D) palate of the obstructive sleep apnea (OSA) and control groups. 1, The 3D palate of the OSA group; 2, the 3D palate of the control group; 3 and 4, superimposition of the OSA and control groups; 5 and 6, the color map of the difference between the OSA and control groups. The blue color means that the hard palate of the OSA group is higher than that of control group, and the red color means the opposite. B, The two-dimensional comparison of the palates of the OSA and control groups in the first premolar (1), first molar (2), palatal suture (3), and palatal undersurface section (4). Red, OSA group; blue, control group.
5 6
20 15 10 5 0 5 10 15 20
45
40
35
30
25
20
15
5
0 1.0
0.5
0
0.5
1.0
1.5
OSA
3 4
A
1
Control
2
0
15 10 5 0 5 10 15 20
20
0
2
4
6
8
10
12
14
1.0
0.5
0
0.5
1.0
1.5
B
2
0
8
4
6
15 10 5 0 5 10 15
1
0
10
5
20 10 0 10 20
20 10 0 10 20
2
4
2
6
8
0 10 20 30 40
3
10
0
20
30
412
0
10 40
10
1020
3040
50

Yu et al • 3D-palatal shape of OSA-patients
www.e-kjo.org 141https://doi.org/10.4041/kjod.2018.48.3.133
morphology in adult subjects with mild to moderate OSA have not been reported to date. To describe the morphology of the palate, 2D linear and angular measurements are typically used, even though CBCT/magnetic resonance imaging/laser scanning can provide 3D information and allow construction of a 3D model. The 3D model only contains one patient’s information, which is difficult to represent the features as a group. Thus, in this study, we used a generalized additive model with integrated smoothness estimation and nonlinear curve approximation model to construct the average surface and average contour line to allow evaluation and comparison of the palatal bone 3D morphology in the two groups. Superimposition of the reconstructed palatal surface of the OSA and control groups combined with color-mapping techniques made it possible to visualize the difference between these two groups in 3D. In addition, the linear and angular measurements of the palate and 2D mathematical models showed a consistent difference in the palate between these two groups, implying adequate accuracy of the 3D surface model.
For most measurements of the palate, there were no significant differences between the OSA and control groups. Although there was a significant difference in the angle of the first molar palatal root and the width of the nasal cavity between the OSA and control group, the p-value was borderline statistically significant. Therefore, even though the increased angle of the first molar palatal root (crown buccal tipping) represented a compensation of the upper dental arch to fit the occlusion (suggesting that the palate of OSA patients was narrower than the width of the mandible), as a whole, the palatal morphological differences between the OSA and control group were not marked. Our study findings were in agreement with those of a previous Japanese study, which concluded that dental arch constriction in the maxilla could be associated with the development of OSA, but was not a typical feature of their sample of Japanese OSA patients, and that the upper dental arch showed a narrowing tendency simply because the mandible was positioned more rearward relative to the maxilla.14
However, our study results were not in accordance with those of numerous studies that emphasized that there is a vicious cycle between maxilla constriction and OSA. Hershey et al.15 reported that patients suffe-ring from mild OSA commonly present with airway obstruction related to inadequate nasal patency, asso-ciated with maxillary dysplasia. OSA patients with a deficit in nasal patency usually demonstrate mouth breathing, with the tongue in a low position, which frequently diminishes the lateral expansive forces on the upper jaw. This can lead to maxillary transverse deficiency, especially during certain stages of dentition
development. Maxillary constriction is also associated with a low tongue posture, which could result in retroglossal airway narrowing, and thereby lead to OSA.16
One of the possible reasons for these discrepant findings is the different populations included in the studies. The second is that our OSA group comprised only patients with mild-to-moderate OSA (5 ≤ AHI ≤ 30), while other studies comprised patients with various levels of OSA (AHI ≥ 5).9 Third, the onset of OSA and the duration of OSA in the patients can also greatly affect the features of the palate. As OSA occurring in adults does not affect growth and development, the effect of OSA on the morphology of the hard palate is not obvious.
CONCLUSION
The hard palates of adult patients with mild-to-moderate OSA do not have specific morphological features that are distinct from those of healthy controls, if the anterior-posterior skeletal relationship is similar. The generalized additive model with integrated smoothness estimation, which was used in our study, is an appropriate method for evaluation and comparison of palatal bone 3D morphology, and the superimpositions combined with color-mapping techniques allowed 3D visualization of differences between these two groups.
CONFLICTS OF INTEREST
No potential conflict of interest relevant to this article was reported.
ACKNOWLEDGEMENTS
This research was partly from the PhD thesis of Chen Yu at Kyung Hee University Graduate School, Seoul, Korea. The authors want to show special thanks to Professor Su-Jung Kim, Associate Professor of the Department of Orthodontics, Kyung Hee University Graduate School for manuscript preparation.
REFERENCES
1. Strollo PJ Jr, Rogers RM. Obstructive sleep apnea. N Engl J Med 1996;334:99-104.
2. Hudgel DW. Mechanisms of obstructive sleep apnea. Chest 1992;101:541-9.
3. Susarla SM, Thomas RJ, Abramson ZR, Kaban LB. Biomechanics of the upper airway: Changing con-cepts in the pathogenesis of obstructive sleep apnea. Int J Oral Maxillofac Surg 2010;39:1149-59.
4. Basner RC, Simon PM, Schwartzstein RM, Wein-berger SE, Weiss JW. Breathing route influences up-
Yu et al • 3D-palatal shape of OSA-patients
www.e-kjo.org142 https://doi.org/10.4041/kjod.2018.48.3.133
per airway muscle activity in awake normal adults. J Appl Physiol (1985) 1989;66:1766-71.
5. Morris LG, Burschtin O, Lebowitz RA, Jacobs JB, Lee KC. Nasal obstruction and sleep-disordered bre-athing: a study using acoustic rhinometry. Am J Rhinol 2005;19:33-9.
6. Cistulli PA, Sullivan CE. Sleep-disordered breathing in Marfan's syndrome. Am Rev Respir Dis 1993;147: 645-8.
7. Cistulli PA, Richards GN, Palmisano RG, Unger G, Berthon-Jones M, Sullivan CE. Influence of maxill-ary constriction on nasal resistance and sleep apnea severity in patients with Marfan's syndrome. Chest 1996;110:1184-8.
8. Lione R, Franchi L, Huanca Ghislanzoni LT, Primozic J, Buongiorno M, Cozza P. Palatal surface and volume in mouth-breathing subjects evaluated with three-dimensional analysis of digital dental casts-a con-trolled study. Eur J Orthod 2015;37:101-4.
9. Kecik D. Three-dimensional analyses of palatal mor-phology and its relation to upper airway area in obs-tructive sleep apnea. Angle Orthod 2017;87:300-6.
10. Ferrario VF, Sforza C, Miani A Jr, Tartaglia G. Mathe-
matical definition of the shape of dental arches in human permanent healthy dentitions. Eur J Orthod 1994;16:287-94.
11. Brunner J, Fuchs S, Perrier P. On the relationship between palate shape and articulatory behavior. J Acoust Soc Am 2009;125:3936-49.
12. Kuczmarski RJ, Flegal KM. Criteria for definition of overweight in transition: background and recom-mendations for the United States. Am J Clin Nutr 2000;72:1074-81.
13. Houston WJ. The analysis of errors in orthodontic measurements. Am J Orthod 1983;83:382-90.
14. Maeda K, Tsuiki S, Fukuda T, Takise Y, Inoue Y. Is maxillary dental arch constriction common in Ja-panese male adult patients with obstructive sleep apnoea? Eur J Orthod 2014;36:403-8.
15. Hershey HG, Stewart BL, Warren DW. Changes in nasal airway resistance associated with rapid maxi-llary expansion. Am J Orthod 1976;69:274-84.
16. Cistulli PA. Craniofacial abnormalities in obstructive sleep apnoea: implications for treatment. Respiro-logy 1996;1:167-74.