three coal mine ventilation studies using sulfur … of investigations 8142 three coal mine...
TRANSCRIPT

Bureau of Mines Report of Investigations/1976
Three Coal Mine Ventilation Studies Using Sulfur Hexafluoride Tracer Gas
UNITED STATES DEPARTMENT OF THE INTERIOR

Report of Investigations 8142
Three Coal Mine Ventilation Studies Using Sulfur Hexafluoride Tracer Gas
By Robert P. Vinson and Fred N . Kissell Pittsburgh Mining and Safety Research Center, Pittsburgh, Pa.
UNITED STATES DEPARTMENT OF THE INTERIOR Thomas S. Kleppe, Secretary
BUREAU OF MINES Thomas V. Falkie, Director

T h i s publ icat ion has been cataloged as fo l l ows :
L
Vinson, Rober t P Three c o a l mine vent i la t ion s t u d i e s us ing sulfur hexa-
fluoride t racer g a s , by Robert P.Vins on and Fred N. S i s s e l l . [Washington] U.S. Bureau of Mines [I9761
19 p. illus., table. (U,S. Bureau of hlines, Report of inves t i - g a t i o n s 8 1 4 2 )
Inc ludes bibl iography.
1. Mine venti lat ion. 2. Sulphur hexafluoride, I. K i s s e l l , F r e d N., jt. auth. 11. U.S. Bureau of Mines. 111. T i t l e . (Ser ies )
TN23.U7 no. 8142 622.06173
U.S. D e p t . of t h e In t , L i b r a r y
i

CONTENTS Page
................................................................. Abs t r ac t 1 I n t r o d u c t i o n ............................................................. 1
............................... F i r s t s tudy: A i r movement i n a s ea l ed a r e a 2 A i r movement-- zone A . . . . . . . . . . . . . . . . . . . . . . . . . . . . . . . . . . . . . . . . . . . . . 2
.......................... Leakage from upper seam i n t o zones A and B 8 ................. Second s tudy : Airf low t e s t i n a p i l l a red-and-caved a r e a 13
........................................... Third s t udy : Stopping leakage 16 ............................................................... Conclusion 17 ............................................................... References 19
ILLUSTRATIONS
Sealed zone A ....................................................... 2 Sealed zone B . ...................................................... 3 Double s e a l s ........................................................ 5 S u l f u r hexa f luo r ide c o n c e n t r a t i o n a s a f u n c t i o n of t ime a t each
................................................. sampling l o c a t i o n 6 S u l f u r hexa f luo r ide concen t r a t i on i n a simple enclosed a r e a .
A , Simple enclosed a r e a ; E3, SF, concen t r a t i on a t S, and S, due - t o d i f f u s i o n ; C, SF, concen t r a t i on a t S1 and S, due t o a i r
............................................ movement from S1 t o S, 7 S u l f u r hexa f luo r ide c o n c e n t r a t i o n a s a f u n c t i o n of time a t
...................................... sampling l o c a t i o n s i n zone A 8 S u l f u r hexa f luo r ide c o n c e n t r a t i o n as a f u n c t i o n of t ime a t
...................................... sampling l o c a t i o n s i n zone B 8 ........... A i r p r e s su re ac ros s s e a l s a s a f u n c t i o n of time i n zone A 9 ........... A i r p r e s s u r e ac ros s s e a l s a s a f u n c t i o n of t ime i n zone B 9
....... Carbon monoxide concen t r a t i on a s a f u n c t i o n of t ime i n zone A 10
....... Carbon monoxide concen t r a t i on as a f u n c t i o n of t ime i n zone B 10 ............. Methane concen t r a t i on a s a f u n c t i o n of CO c o n c e n t r a t i o n 11
................ Methane concen t r a t i on as a func t i on of s e a l p r e s su re 11 .... Su l fu r hexa f luo r ide concen t r a t i on a s a f u n c t i o n of s e a l p r e s s u r e 12
........ Carbon monoxide concen t r a t i on a s a f u n c t i o n of s e a l p r e s s u r e 13 ...................................................... Ven t i l a t ed gob 14
.................................................. Four-en t ry heading 16 S u l f u r hexa f luo r ide c o n c e n t r a t i o n a t S1 and S, a s a f u n c t i o n of t ime 17
TABLE
1 . A i r movement t e s t i n zone A . . . . . . . . . . . . . . . . . . . . . . . . . . . . . . . . . . . . . . . 4

THREE COAL MINE VENTILATION STUDIES USING SULFUR HEXAFLUORIDE TRACER GAS
by
Rober t Pa V i n s o n and F r e d N. K i sse l l
AB STRAC T
This r e p o r t de sc r ibes t h r e e c o a l mine v e n t i l a t i o n s t u d i e s by t h e Bureau of Mines i n which s u l f u r hexaf l uo r ide (SFG) was used a s a t r a c e r gas. One of t he se s t u d i e s was conducted t o determine a i r movement and leakage i n a s ea l ed a r ea . Another was run t o determine t h e v e n t i l a t i o n e f f i c i e n c y of a b l eede r system. F i n a l l y , a s tudy was made of a i r leakage ac ros s permanent s toppings of p a r a l l e l i n t ake airways. These s t u d i e s proved s u l f u r hexaf luor ide t o be a u s e f u l a d d i t i o n t o t he equipment commonly used i n c o a l mine v e n t i l a t i o n a n a l y s i s .
INTRODUCTION
Su l fu r hexa f luo r ide has been used t o analyze v e n t i l a t i o n i n l a r g e b u i l d - i n g s , f o r meteoro logica l s t u d i e s , i n gas r e s e r v o i r a n a l y s i s , e t c . (2, 4, 6 ) . 3 I t i s an i d e a l gas f o r t h i s type of work because i t i s o d o r l e s s , c o l o r l e s s , chemical ly and thermal ly s t a b l e , and s a f e t o b rea the a t high concen t r a t i ons ( I ) . I n a d d i t i o n , s u l f u r hexa f luo r ide can be de t ec t ed a t low concen t r a t i ons by gas - so l id chromatography us ing e l e c t ron-capture d e t e c t i o n (1, 9-10).
Recent ly , t he Bureau of Mines has developed procedures f o r using SF, a s a t r a c e r gas f o r mine v e n t i l a t i o n s t u d i e s i n ca se s where convent iona l equipment cannot be used (11-12). Except f o r some pre l iminary work, t h e s e s t u d i e s were conducted i n noncoal mines. Because c o a l mines have many d i f f e r e n t kinds of v e n t i l a t i o n problems, p a r t i c u l a r l y a s soc i a t ed w i th v e n t i l a t i o n of and/or l eak - age through abandoned a r e a s , w e f e l t i t worthwhile t o do a s e p a r a t e s e r i e s of c o a l mine s t u d i e s wi th SF,.
This r e p o r t d i s cus se s t h r e e t r a c e r gas v e n t i l a t i o n s t u d i e s conducted i n underground c o a l mines. The f i r s t s tudy was conducted t o i n v e s t i g a t e a i r movement and leakage i n a sea led a r e a . A second s tudy was made t o determine the e f f e c t i v e n e s s of a b leeder system. The t h i r d s tudy was used t o e v a l u a t e
l p h y s i c i s t . 2 ~ h y ~ i c a l r e sea rch s c i e n t i s t . 3 Underlined numbers i n paren theses r e f e r t o i tems i n t h e l i s t of r e f e r ences a t
t he end of t h i s r e p o r t .

Match line to sealed zone B
t h e s e a l i n g e f f i c i e n c y of a s e r i e s of permanent s top - pings between p a r a l l e l i n t a k e airways.
FIRST STUDY : A I R MOVEMENT I N A SEALED AREA
i This s tudy was con- ducted i n a mine working t h e
i B and C coa l seams of t h e Somerset c o a l f i e l d i n west- e r n Colorado. A i r leakage
i and a i r mwement were inves - t i g a t e d i n a p a r t i a l l y p i l -
i l a r ed sea led -off a r e a , sub - divided i n t o zones A and B ( f i g s . 1-2) by a fou r -en t ry
i heading. The coalbed i n t h i s reg ion d i p s toward t h e
i nor theas t . Zone A i s par -
Possible t i a l l y flooded ( f i g . l), bu t
ater levels t h e exact water l e v e l i s
i unknown. Approximately 60 f t above zones A and B a r e
i old workings of C seam. These o l d workings a r e con- nected t o t he su r f ace by a 10-in-diam borehole. An a i r s h a f t and two tunne l s , which
FIGURE 1. - Sealed zone A. forme~. ly gave access t o t h e upper seam from the lower,
have been sea l ed . These s e a l s and the s e a l s enc los ing zones A and B were con- s t r u c t e d of cemented concre te block t h a t was then sprayed wi th ure thane foam. Adjacent r i b s and roof were a l s o sprayed. A pipe wi th va lve was i n s e r t e d i n t o each s e a l f o r gas sampling.
A i r Movement --Zone A
Zone A contained a h igh concen t r a t ion of carbon monoxide. Because o f t h e s e l f - h e a t i n g na tu re of t h e coalbed, e f f o r t s were made t o con ta in and reduce t h e CO t o prevent leakage i n t o the mine atmosphere. The carbon monoxide con- c e n t r a t i o n was g r e a t e s t on the e a s t s i d e behind the s e a l s a t l o c a t i o n 1A ( f i g . 1 ) An "intake" a i r p ressure d i f f e r e n t i a l was maintained ac ros s 1 A s e a l s . This means t h a t the a i r p re s su re on the a c t i v e mine s i d e of t h e s e a l i s g r e a t e r than the a i r press.ure on the sealed-zone s i d e . This would tend t o keep CO-contaminated a i r from migrat ing i n t o t h e mine atmosphere i n the innne- d i a t e v i c i n i t y . In t ake pressure was sus ta ined by channeling high-pressure i n t ake a i r d i r e c t l y across 1A s e a l s .
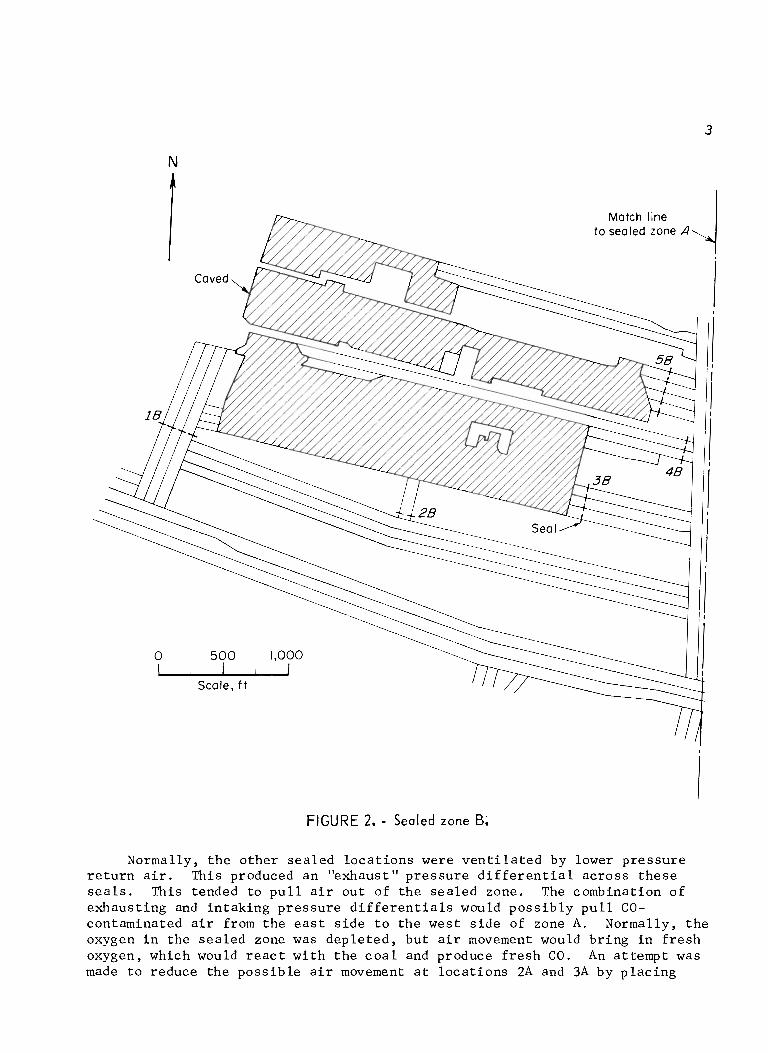
FIGURE 2. - Sealed zone B.
Normally, t h e o the r s ea l ed l o c a t i o n s were v e n t i l a t e d by lower p re s su re r e t u r n a i r . This produced an "exhaust" p r e s su re d i f f e r e n t i a l a c ros s t h e s e s e a l s . This tended t o p u l l a i r ou t of t h e s ea l ed zone. The combination of exhaust ing and in t ak ing p re s su re d i f f e r e n t i a l s would p o s s i b l y p u l l CO- contaminated a i r from t h e e a s t s i d e t o t h e west s i d e of zone A. Normally, t h e oxygen i n t h e s ea l ed zone was dep le t ed , but a i r movement would b r ing i n f r e s h oxygen, which would r e a c t w i th t h e c o a l and produce f r e s h C O . An at tempt was made t o reduce t he pos s ib l e a i r mwement a t l oca t ions 2A and 3A by p l ac ing

t he se s e a l s on i n t a k e a i r p r e s su re . This was done by bu i ld ing a second s e t of s e a l s outby t he f i r s t and connec t ing t he a i r space between t o i n t a k e a i r p r e s - s u r e by running tub ing from an i n t a k e airway t o t he a i r space, as shown i n f i g u r e 3 ( 3 ) . These changes r educed the s e a l p r e s su re d i f f e r e n t i a l s . Table 1 shows t h a t exhaust p r e s su re s a t 2A and 3A were lower t han exhaust p r e s s u r e s a t 4A, 5A, and 6A, which were no t connected t o i n t a k e a i r .
TABLE 1. - A i r movement t e s t i n zone A , s e a l p r e s su re i n inches water gage
- - -- -
Sta t ic - -No d i f f e r e n t i a l p r e s su re . I - - In tak ing p re s su re d i f f e r e n t i a l . E --Exhaus t i n g p r e s su re d i f f e r e n t i a l . X--No p r e s s u r e measurements taken.
- - - -- - --
Locat ion
Another f a c t o r r e l a t i n g t o a i r movement w i t h i n zone A was t h e p o s i t i o n of t h e wate r l e v e l . I f t h i s l e v e l was maintained high enough, t he e n t r i e s behind 1 A s e a l s would be blocked o f f from the o t h e r sea led-of f e n t r i e s . This would prevent a i r movement i n t he s ea l ed a r e a , t he i npu t of f r e s h oxygen would be reduced , and h igh CO concen t r a t i ons might be confined t o t he e n t r i e s imrnedi- a t e l y behind s e a l s a t 1 A . However, t h e r e was no d e f i n i t e way of knowing where t h e water l e v e l was, o r whether i n f a c t , i t was blocking t h e e n t r i e s behind 1 A s e a l s .
Center 1 A X X I 0.02 I 0.03 I 0.07 I 0.05 X
Tracer gas was used t o determine i f t h e f looding was blocking a i r i n 1 A and i f n o t , whether t h e a i r was moving from e a s t t o west as shown i n f i g u r e 1. For t h i s purpose, 3 .9 cu f t of SF, was i n j e c t e d through a p ipe i n t h e c e n t e r s e a l of l o c a t i o n 1 A . Gas samples were then c o l l e c t e d a t va r ious l oca t i ons surrounding t he enclosed a r e a on day ze ro ( t h e day SF6 was i n j e c t e d ) and 1, 3 , 4 , 8 , 36, and 70 days a f t e r SF, i n j e c t i o n . The sampling schedule was r a t h e r e r r a t i c because t h e r e were no e s t a b l i s h e d g u i d e l i n e s s i n c e t h i s was t h e f i r s t t e s t of t h i s type . When SF, was d e t e c t e d , t h e l o c a t i o n , d a t e of sample, and measured concen t r a t i on were p l o t t e d ( f i g . 4 ) . Lines connect ing t h e same l o c a t i o n from day t o day g ive t h e gene ra l h i s t o r y of t h e t r a c e r gas a t each measured l o c a t i o n .
On day z e r o , SF, was de t ec t ed only a t t h e l e f t and r i g h t s e a l s of l A , w i th t h e r i g h t s e a l showing i t s h i g h e s t SF, concen t r a t i on . I n t h e fol lowing days , t h e SF, concen t r a t i on dec l ined a s t he ga s moved away from t h e r i g h t s e a l .
L e f t 1 A I 0.06 E 0.02 I 0.02 I 0.02 I 0.07 I 0.10 I 0.04
2A S t a t i c E 0.01 E 0 .01 S t a t i c S t a t i c S t a t i c E 0 .01
3A E 0,30 E 0.12 E 0.05 E 0.14 E 0.10 I 0.02 S t a t i c
4A E 0 = 3 9 E 0.34 E 0.15 E 0.31 E 0.29 E 0.12 E 0.12
5A E 0 .20 E 0.24 E 0.19 E 0.36 E 0.22 E 0.10 E 0 .10
6A E 0.18 E 0.34 E 0 .21 E 0.34 E 0.20 E 0.15 E 0 .08
Concrete block. ,Ureothane foam
24-in-diam tubing
Return air
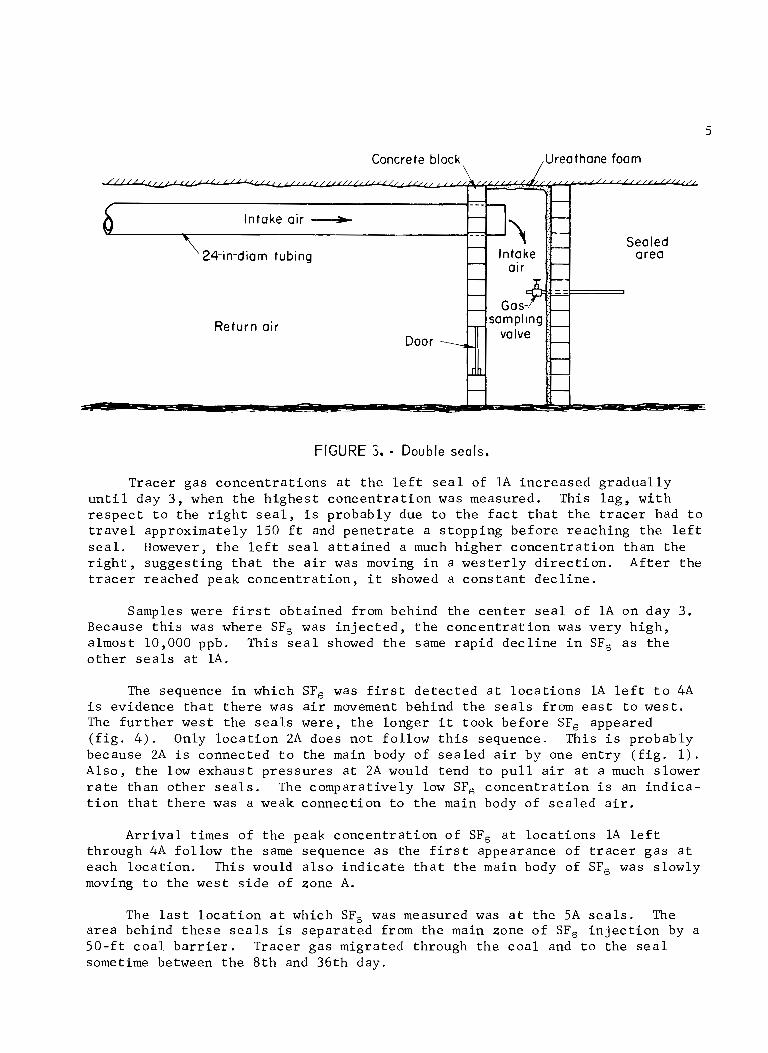
FIGURE 5. - Double seals,
Tracer gas concent ra t ions a t t h e l e f t s e a l of 1A increased g radua l ly u n t i l day 3 , when t h e h ighes t concen t r a t ion was measured. This lag , w i t h r e s p e c t t o t h e r i g h t s e a l , i s probably due t o t h e f a c t t h a t t he t r a c e r had t o t r a v e l approximately 150 f t and pene t r a t e a s topping before reaching the l e f t s e a l . However, t h e l e f t s e a l a t t a i n e d a much higher concen t r a t ion than the r i g h t , suggest ing t h a t the a i r was moving i n a wes t e r ly d i r e c t i o n . A f t e r t he t r a c e r reached peak concen t r a t ion , it showed a cons tan t dec l ine .
Samples were f i r s t obtained from behind the c e n t e r s e a l of 1A on day 3 . Because t h i s was where SF, was i n j e c t e d , t h e concent ra t ion was ve ry h igh , almost 10,000 ppb. This s e a l showed t h e same r ap id dec l ine i n SF, a s t h e o t h e r s e a l s a t 1 A .
The sequence i n which SF, was f i r s t de t ec t ed a t l o c a t i o n s 1A l e f t t o 4A i s evidence t h a t t h e r e was a i r movement behind t h e s e a l s from e a s t t o west . The f u r t h e r west the s e a l s were, t h e longer i t took before SF, appeared ( f i g . 4 ) . Only l o c a t i o n 2A does not fol low t h i s sequence. This i s probably because 2A i s connected t o t he main body of s ea l ed a i r by one e n t r y ( f i g . 1 ) . Also, t h e low exhaust p re s su re s a t 2A would tend t o p u l l a i r a t a much slower r a t e than o ther s e a l s . The comparatively low SF, concen t r a t ion i s an i n d i c a - t i o n t h a t t h e r e was a weak connect ion t o the main body of sea led a i r .
A r r i v a l t imes of t h e peak concent ra t ion of SF, a t l o c a t i o n s 1A l e f t through 4A fo l low t h e same sequence a s the f i r s t appearance of t r a c e r gas a t each loca t ion . This would a l s o i n d i c a t e t h a t t h e main body of SF, was slowly moving t o the west s i d e of zone A.
The l a s t l o c a t i o n a t which SF, was measured was a t t h e 5A s e a l s . The a rea behind these s e a l s i s separated from the main zone of SF, i n j e c t i o n by a 5 0 - f t c o a l b a r r i e r . Tracer gas migrated through the coa l and t o the s e a l sometime between the 8 t h and 36th day.

TIME, days
FIGURE 4. - Sulfur hexafluoride concentration as a function of time at each sampling
location,
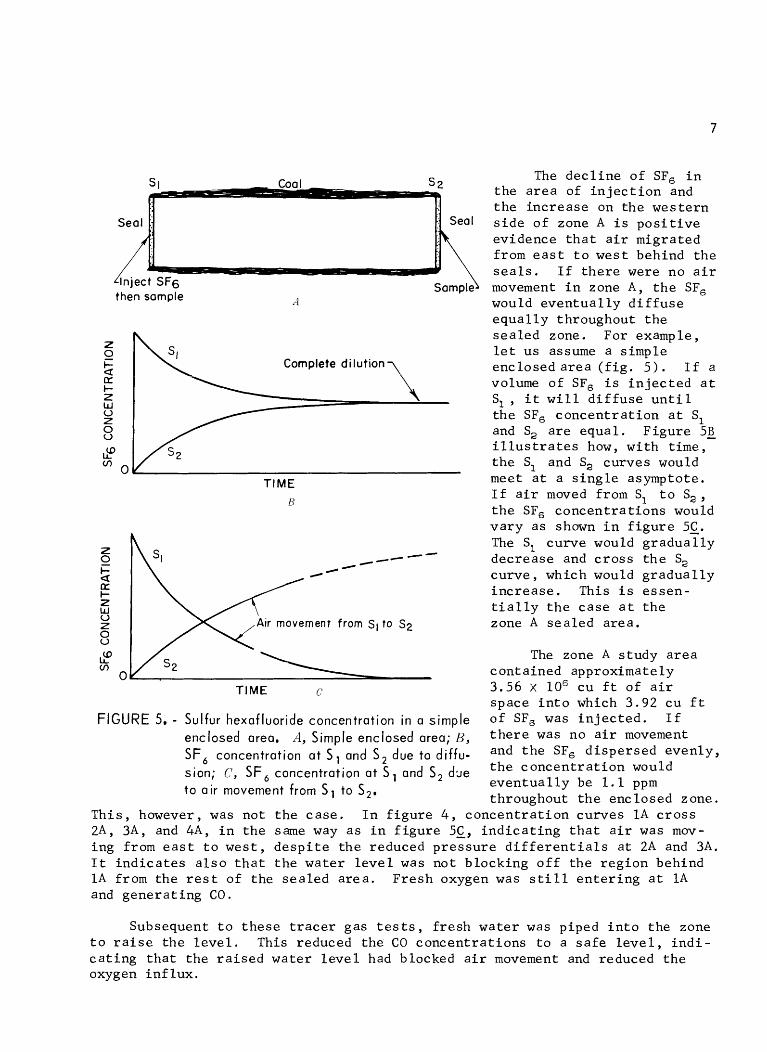
The d e c l i n e of SF, i n t h e a r e a of i n j e c t i o n and t h e i nc r ea se on t h e wes te rn
eal s i d e of zone A i s p o s i t i v e evidence t h a t a i r migrated from e a s t t o west behind t h e s e a l s . I f t h e r e were no a i r movement i n zone A , t h e SF,
then sample A would e v e n t u a l l y d i f f u s e e q u a l l y throughout t h e s ea l ed zone. For example,
z 0 l e t us assume a s imple I- Complete dilution \ a enclosed a r e a ( f i g . 5 ) . I f a tx t- volume of SF, i s i n j e c t e d a t z W
S1, i t w i l l d i f f u s e u n t i l 0 Z t h e SF, concen t r a t i on a t S1
E and S, a r e equa l . F igure 5g d! i l l u s t r a t e s how, w i th t ime, V)
0 t h e S1 and S2 curves would
TIME meet a t a s i n g l e asymptote. I f a i r moved from S, t o S,,
r2 U
t h e SF, concent ra t i b n s would v a r y a s shown i n f i g u r e 5 s . The S1 curve would g r a d u a l l y z
#-
0 - -#+ decrease and c r o s s t h e S2 t- a curve , which would g r a d u a l l y lx t- i n c r e a s e . This i s e s sen - z w t i a l l y t h e ca se a t t h e 0 z Air movement from Sl to S2 zone A s ea l ed a r ea . E 2 The zone A s tudy a r e a V)
0 conta ined approximately TIME C 3.56 x l o 6 cu f t of a i r
space i n t o which 3.92 cu f t FIGURE 5. - Sulfur hexafluoride concentration in a simple of SF6 was i n j e c t e d . I f
enclosed area. A, Simple enclosed area; B, t h e r e was air movement SF6 concentration a t S, and S 2 due to di f fu- and t h e SF, d i spe r sed evenly ,
sion; C, SF6 concentration at S l and s2 d3e t h e concen t r a t i on would e v e n t u a l l y be 1.1 ppm
to air movement from s1 to S2. throughout t h e enclosed zone.
Th i s , however, was not t h e ca se . I n f i g u r e 4 , concen t r a t i on curves 1 A c r o s s 2A, 3A, and 4A, i n t h e same way a s i n f i g u r e 5C, i n d i c a t i n g t h a t a i r was mov- ing from e a s t t o wes t , d e s p i t e t h e reduced p r e s s u r e d i f f e r e n t i a l s a t 2A and 3A. I t i n d i c a t e s a l s o t h a t t h e water l e v e l was no t b lock ing o f f t h e r eg ion behind 1 A from t h e r e s t of t he s ea l ed a r e a . Fresh oxygen was s t i l l e n t e r i n g a t 1 A and gene ra t i ng CO.
Subsequent t o t h e s e t r a c e r gas t e s t s , f r e s h wate r was piped i n t o t h e zone t o r a i s e t h e l e v e l . This reduced t h e CO concen t r a t i ons t o a s a f e l e v e l , i n d i - c a t i n g t h a t t h e r a i s e d wate r l e v e l had blocked a i r movement and reduced t h e oxygen i n f l u x .

Leakage From Upper Seam I n t o Zones A and B
The o b j e c t i v e of t h i s p a r t of t h e s t u d y was t o de te rmine i f a i r from t h e o l d workings o f t h e upper seam was l e a k i n g i n t o s e a l e d zones A and B of t h e lower seam. There was r e a s o n t o b e l i e v e leakage was o c c u r r i n g . The upper seam was known t o have methane g a s . Methane was measured a t s e a l s 1 B and 2B i n t h e lower seam (zone B , f i g . 2 ) . To de te rmine i f t h e r e was a i r l eakage between seams and i f t h i s was c a r r y i n g t h e methane, SF, was i n j e c t e d i n t o t h e upper seam through t h e s u r f a c e boreho le . Gas samples were t h e n taken a t s e a l s e n c l o s i n g zones A and B i n t h e lower seam. These samples were t h e n analyzed f o r SF,, methane, and ca rbon monoxide. A i r p r e s s u r e d i f f e r e n t i a l s a c r o s s t h e s e a l s were a l s o measured a t each sampling l o c a t i o n . A r e c o r d i n g microbaro- graph l o c a t e d o u t s i d e t h e mine was used t o keep t r a c k of a tmospher ic p r e s s u r e changes d u r i n g t h e t e s t p e r i o d .
0 1 2 3 4 5 6 7 8 9 1 0 TIME, days
FIGURE 6, - Sulfur hexaf luor ide concentra- t ion as a funct ion of t ime at
0 1 2 3 4 5 6 7 8 9 1 0
TIME, days
FIGURE 7, - Sulfur hexafluor ide concentra-
t i on as a function of t ime at
sampl ing locations in zone A, sampling locat ions in zone B.

Within 3 hours a f t e r i n j e c t i o n , SF, was de t ec t ed a t seven sampling l oca - t i o n s showing t h a t a i r from t h e upper seam was, i n f a c t , l eak ing i n t o bo th s ea l ed zones A and B i n t he lower seam. L a t e r , SF, appeared a t t h r e e more l o c a t i o n s .
The manner i n which SF, v a r i e d a t t he s e a l s i s shown i n f i g u r e s 6 and 7 . Most s e a l s have a s i g n i f i c a n t d ip i n concen t r a t i on on day 2. On day 10 , t h e r e was a r i s e i n SF, concen t r a t i on a t f i v e of t h e s e a l s . This may be r e l a t e d t o baromet r ic p r e s su re v a r i a t i o n s . As atmospheric p r e s s u r e changes, t h e r e i s a corresponding change i n t h e mine a i r p r e s su re . However, i n t h e enclosed a r e a , a i r p r e s s u r e changes l a g behind atmospheric changes. This i n t u r n produces f l u c t u a t i o n s i n t he p r e s su re d i f f e r e n t i a l s a c ros s t h e s e a l s . A s t h e mine a i r ---- pLcaaure -.. r i s e s , t h e s e a l s wi th exhaust p r e s s u r e decrease and t h e s e a l s w i t h
i n t a k e p r e s su re i n c r e a s e . The oppos i te t akes p l a c e with a drop i n mine a i r p r e s su re . Barometric p r e s s u r e was dropping on days ze ro and 10, bu t was r i s - ing on day 2. F igu re s 8 and 9 show how t h e s e a l p r e s s u r e s v a r i e d dur ing t h e t e s t per iod . S e a l s 1 B and 2B had unusua l ly high exhaust p r e s s u r e s because t hey were i n c l o s e prox imi ty t o one of t h e exhaus t v e n t i l a t i n g f ans . With t h e except ion of 4B, a l l s e a l s having exhaus t ing p r e s s u r e showed a drop i n p r e s su re on day 2.
Exhaust
.2 I- Intake
TIME, days
FIGURE 8. - A i r pressure across seals as a function o f time in zone A.
-
7
Exhaust
. 3 0 1 2 3 4 5 6 7 6 9 1 0
TIME, days
FIGURE 9. - A i r pressure across seals as a function of t ime in zone B.

Pres su re v a r i a t i o n a t s e a l 3A was most d ramat ic , changing from exhaus t ing p r e s s u r e t o i n t a k i n g p re s su re from day ze ro t o day 2 and then back t o an exhaus t ing p r e s su re on day 10. S e a l s wi th i n t a k i n g p re s su re s (1A and 3 B ) showed h igher i n t a k i n g p r e s s u r e s on day 2. These changes f i t i n with the baromet r ic p r e s s u r e r i s e on day 2. The on ly except ion i s 2A, which remained s t a t i c because of i t s weak connect ion t o t h e main body of s ea l ed a i r .
Following i n j e c t i o n i n t o t he bo reho l e , t r a c e r gas was de t ec t ed a t a l l s e a l s w i t h exhaus t p r e s su re d i f f e r e n t i a l s on day z e r o o r day 1 ( f i g s . 6 and 7 ) . On day 2, t h e t r a c e r dec l ined o r disappeared completely a t t he se same s e a l s fo l lowing t h e barometr ic p r e s s u r e r i s e . The r e l a t i o n s h i p between s e a l p r e s - s u r e and SF, concen t r a t i on was no t s o apparen t on t he 10th day. However, t h e r e was evidence t o show t h a t t h e r e l a t i o n s h i p was s t i l l ho ld ing because t h e r e was an i n c r e a s e i n SF, a t f ou r ou t of s i x s e a l s t h a t had h igher exhaus t p r e s s u r e s . This i s another i n d i c a t i o n t h a t a i r leakage ac ros s s e a l s i s i n f l u - enced by atmospheric p r e s su re changes.
Gas samples were a l s o analyzed f o r CO and CH4. The CO concen t r a t i ons a r e shown i n f i g u r e s 10 and 11. Note t h a t l o c a t i o n 1 A has by f a r t h e h i g h e s t CO d e s p i t e t h e f a c t t h a t i t was always i n t a k i n g . This i n d i c a t e s t h a t t h e CO source i s c l o s e t o t h e s e a l s a t t h i s l o c a t i o n because of t h e f r e s h a i r l eak ing i n h e r e .
F igu re 12 shows CO v e r s u s CH4 concen t r a t i ons f o r a l l measurements on a l l s e a l s . There seems t o be l i t t l e c o r r e l a t i o n a s i d e from t h e f a c t t h a t t h e very
TIME, days TIME, days
FIGURE 10, - Carbon monoxide concentra- FIGURE 11, - Carbon monoxide concentra- t ion as a function of time in t ion as a function of time in zone A, zone B,

Rea
d ln
gs h
ere
mea
n ze
ro C
O
Il
l I
II
I
I I
1
00
05
0001
0.0
5
001
05
01
5
CO
, pc
t
FIG
UR
E 1
2. -
Me
tha
ne
co
nc
en
tra
tio
n a
s a
fu
nc
tio
n o
f C
O
con
cen
tra
tio
n.
Exh
aust
SE
AL
PR
ES
SU
RE
, ~
nch
es w
ater
gag
e
FIG
UR
E 1
3; - M
eth
an
e c
on
ce
ntr
ati
on
as
a f
un
cti
on
of
se
al
pre
ssu
re.

h i g h e s t methane concen t r a t i ons corresponded t o ze ro C O concen t r a t i ons . This confi rms t h a t CO and CH4 o r i g i n a t e i n d i f f e r e n t l o c a t i o n s .
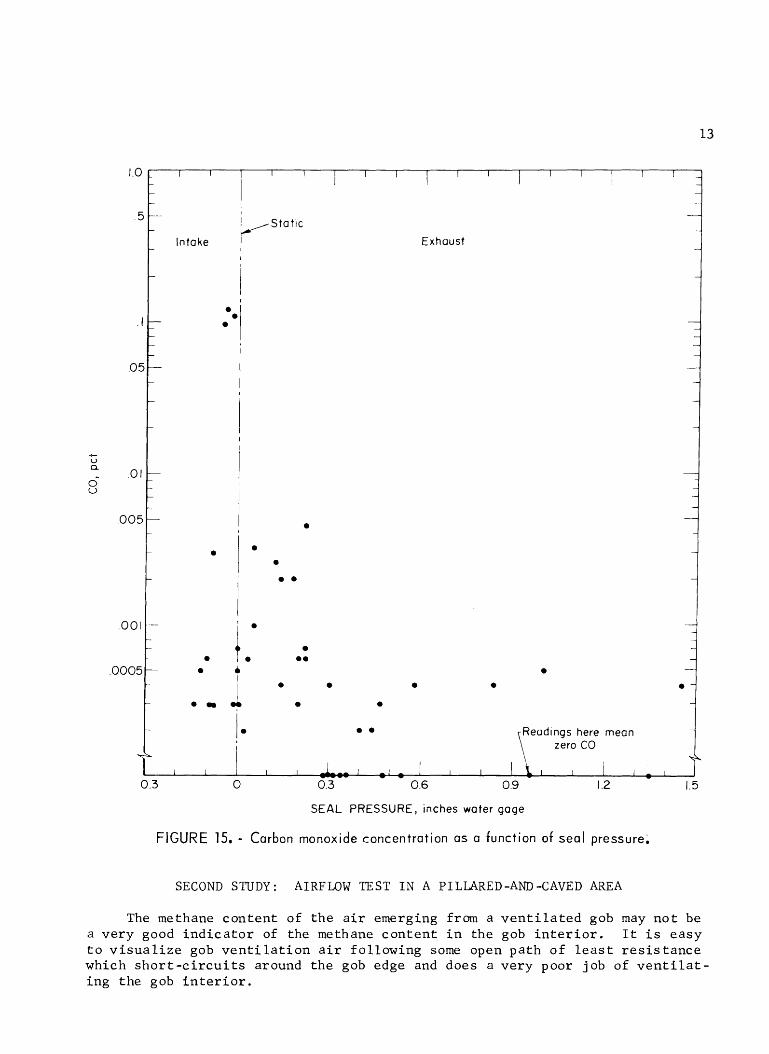
F igures 13, 14 , and 15 show CH, , SF, , and CO c o n c e n t r a t i o n s , r e s p e c t i v e l y , ve r sus s e a l p r e s s u r e f o r a l l measurements on a l l s e a l s . F igures 13 and 14 i n d i c a t e t h a t when t he s e a l s were exhaus t ing , t he CH, and SF, l e v e l s were gen- e r a l l y h igher than when the s e a l s were i n t a k i n g . However, i n f i g u r e 15, CO l e v e l s a r e lower when the s e a l s a r e exhaus t ing , which lends s t r e n g t h t o t h e no t i on t h a t t h e SF, and CH, a r e n o t genera ted i n the lower s2am ( t h i s i s c e r - t a i n l y t r u e f o r t h e SF,), and t h a t t h e C O comes from r e a c t i o n s wi th oxygen t h a t l e a k s i n through the lower seam s e a l s when t h e s e a l s a r e i n t ak ing .
SEAL PRESSURE, inches water gage
FIGURE 14. - Sulfur hexaf luor ide concentrat ion as a funct ion of seal pressure.
I,OOC
500
I00 P a a
G 50 - IL v,
10
- i I I I I I _ I - I l ' ' I ' 4
-
- a - -
- 1 a - +
-
-
5- - -
- -
- i rReod~ngs here mean -
1 - I - I - A I -
- Intake c S f a t i ~ a Exhaust - - a - - -
- i -
- -
I l a a
- -
- -
- - - a -
- I ; - - -
-
- l e a . . : -
- i -
\L
0.3 0 0.3 0.6 0.9 1.2 1.5

S h o r t - c i r c u i t pa ths , i f they do e x i s t , should reduce t h e p re s su re drop across t h e gob. The a i r v e l o c i t y along these pa ths would probably be r e l a - t i v e l y h igh , i f they c a r r y most of the a i r intended f o r t h e gob. The pressure drop ac ros s t he gob can be measured i n t h e convent ional way us ing a l t i m e t e r s . However, t h e only way t o measure a i r v e l o c i t y w i t h i n a gob i s t o u se a t r a c e r gas .
A v e n t i l a t e d gob i n v e s t i g a t e d with SF, t r a c e r gas i s shown i n f i g u r e 16. The mine i s loca ted i n no r the rn West V i rg in i a and works t h e P i t t sbu rgh coalbed. The s e c t i o n s tudied was advanced by the room-and-pillar method, and then i m e - d i a t e l y r e t r e a t e d and caved by mining t h e p i l l a r s . To t r a c e t h e a i r f l o w , 1.6 cu f t of SF, was r e l ea sed a t l oca t ion A. A i r samples were taken a t 2-min i n t e r v a l s ae l o c a t i o n B , a r e g u l a t c r where t h e gob a i r emerged i n t o a bleeder system. The a i r q u a n t i t y pass ing through t h e gob measured a t B was 4,050 cu f t /min . A convent ional a l t i m e t e r survey ind ica t ed t h a t t h e pressure drop between A and B was 0.69 i n w.g. The gob was about 1,200 f t long and 350 f t wide. The SF, t r a c e r gas was de t ec t ed a t B , 60 min a f t e r i t was r e l ea sed a t A .
Since the t r a c e r gas t r a v e l e d only 1,200 f t i n 60 min, t h e a i r v e l o c i t y i n t h e gob was r e l a t i v e l y low (20 f t l m i n ) . This low v e l o c i t y , coupled wi th a moderately high p re s su re drop of 0.69 i n w.g., i n d i c a t e s t h a t t h e r e was no major s h o r t - c i r c u i t path through t h e gob. This can be v e r i f i e d by the fol low- ing example: Suppose the gob had a major s h o r t - c i r c u i t pa th t h a t c a r r i e d
Sampling 4 0 5 0 c f r n ~ \ stat ion
LEGEND - Intake air =tR= Stopping with regulator
W Return air * Curtain 0 2 0 0 400 ?t= Permanent stopping Overcast - =Kk Stopping with door Scale, f t
FIGURE 16. - Vent i la ted

t h r e e - q u a r t e r s of t he gob a i r (3,000 cu f t / m i n ) . Suppose f u r t h e r t h a t t h i s p a t h i s a square passage 1,200 f t long and width D , and t h a t i t has a f r i c t i o n f a c t o r of 250 X 10 l o . The Atkinson equa t ion i s a s fo l lows (I):
where HF = f r i c t i o n l o s s , inches of wa t e r ,
V = v e l o c i t y , f t l m i n ,
A = a r e a , f t 2 ,
P = passage pe r ime te r , f t ,
K = f r i c t i o n f a c t o r f o r a i r of s tandard d e n s i t y (0.075 l b / f t 3 ) ,
and L = l eng th , f t .
I f t h e width i s D , t h e per imete r i s 4D and t h e a r e a i s D ~ . I f t he Atkinson equa t i on i s solved s imul taneous ly w i th t he r e l a t i o n Q = AV, where Q i s t h e a i r q u a n t i t y i n cub i c f e e t pe r minute , t hen D ? 3 f t and V ? 300 f t /m in . A t t h i s v e l o c i t y , t he SF, t r a c e r would have t r ave r sed t he gob i n 4 min, b u t t h e a c t u a l time was 60 min. The same d i s p a r i t y between t h e c a l c u l a t e d and a c t u a l v e l o c i t i e s e x i s t s even w i t h a t en fo ld i n c r e a s e i n t h e f r i c t i o n f a c t o r o r even assuming m u l t i p l e s h o r t - c i r c u i t p a t h s , each c a r r y i n g sma l l e r a i r q u a n t i t i e s . From t h i s , i t may be i n f e r r e d t h a t an SF6 a r r i v a l time of 60 min and a p r e s su re drop of 0.69 i n w.g. a r e n o t c o n s i s t e n t w i t h t h e concept of a few major passages around the gob edge. Thus, a d i f f e r e n t s o r t of approach i s i n d i c a t e d .
A b e t t e r s o l u t i o n might be t o v i s u a l i z e t he gob a s having a permeable and an impermeable r eg ion and t o e s t i m a t e t h e r e l a t i v e s i z e of t he two r eg ions a s fo l lows: I f t he SF6 t r a v e l e d 1,200 f t i n 60 min, t he a i r v e l o c i t y was 20 f t /m in . Since t h e a i r volume was 4 ,050 cu f t / m i n , t he open a r e a f o r flow was
= 4 9 0 5 0 ? 200 f t 2 . I f t h i s open a r e a i s i n t h e permeable r e g i o n , t h e s i z e v 20 of t h a t r eg ion can be c a l c u l a t e d , based on an assumed vo id volume.
M i l e t i c h (8) has g iven vo id volumes ( p o r o s i t i e s ) f o r longwall gobs i n t h e Sov ie t Union. A t a d i s t a n c e of 2,000 f t from the working f a c e , t y p i c a l va lue s range i s from 34% t o 48%. I f 40% i s assumed, t h e n t he a r e a of t h e permeable r e g i o n i s
Although t h e s e numbers a r e v e r y approximate, they do i n d i c a t e t h a t no s h o r t - c i r c u i t p a t h e x i s t e d i n t h i s gob and t h a t the permeable r eg ion occupied a f a i r percen tage of t h e t o t a l c r o s s - s e c t i o n a l a r e a .

THIRD STUDY: STOPPING
R2 Air volurne,cubic fee t per minute RI -58,300 R2 - 28,400
A and 4 -37,900
Tracer gas, liters
SI -3.6 s2 - 0.24
A and 4-2.46
LEGEND C- lntoke air
Return oir =il= Permanent stopping =#= Stopping with door
FIGURE 17. - Four-entry heading.
mometer measurements, 44% of t he i n t a k e a i r , and should have been d ive r t ed . However, a d i f f e r e n c a i r measurements i s not s i g n i f i c a n t .
LEAKAGE
A mine working t h e C seam of t h e Somerset c o a l - f i e l d was the l o c a t i o n of t h i s study. The purpose was t o determine t h e d i r e c t i o n and amount of a i r leakage across a row of permanent s toppings sepa ra t ing two in t ake airways of a f o u r - e n t r y system. No p re s su re d i f f e r e n c e between t h e s e two i n t a k e airways could be de tec ted with a manometer. Outside e n t r i e s 1 and 4 were r e t u r n airways ( f i g . 17). Tracer gas was r e l ea sed i n e n t r y 3 a t s t a t i o n and gas samples were c o l l e c t e d a t S1 and S2 , both 1,650 f t inby the r e l e a s e s t a t i o n . Approximately 6 .3 l i t e r s was r e l ea sed and gas samples a t
S, and S, accounted f o r 3 .6 and 0.24 l i t e r s , r e spec - t i v e l y ( f i g . 18) . This was 61% of t h e amount r e l ea sed .
Unmeasured SF,, 39% of t h e amount r e l e a s e d , was d ive r t ed i n t o two o rher e n t r i e s a t l o c a t i o n A and e n t r y 4. According t o ane-
t h e r e f o r e 44% of the SF,, e of 5% between t r a c e r gas and
Measured a i r volume r e s u l t s a l s o show t h a t e n t r y 2 l o s t 7,700 cu f t / m i n of a i r between the r e l e a s e and sampling s t a t i o n s , so the n e t leakage was from e n t r y 2 i n t o e n t r y 3. Despite t h i s , some a i r d i d l eak the o the r way from e n t r y 3 i n t o e n t r y 2 because t h e c o a l t r a i n t r a v e l i n g i n and out of e n t r y 3
0.24 c r e a t e d a temporary backflow i n t o e n t r y 2. This backflow forced - = 3.8%
6.3 of t h e SF, from e n t r y 3 i n t o e n t r y 2 , even though the n e t flow was t h e o t h e r way.
The f i r s t 12 s toppings were cons t ruc ted of cemented concre te b lock , and t h e l a s t 8 were cons t ruc ted of t h i n s h e e t metal on wooden frames. The s h e e t

TIME, min
FIGURE 18, - Sul fu r hexafluoride concentration at S T and S, as a function of time.
meta l s toppings had l e a k s , and they f lexed with the a i r p re s su re change caused by passage of t h e t r a i n . Thus, t r a i n movement caused a small amount of a i r leakage around the metal s toppings i n t o the ad jacent e n t r y .
CONCLUSION
I n the f i r s t s tudy , SF, showed t h a t a i r movement was taking p l ace w i t h i n a s ea l ed a rea . The d i r e c t i o n of t h i s a i r movement was found by analyzing the SF, concen t r a t ion curves a t each sampled loca t ion . I n t h e second p a r t of t h i s s tudy , t he t r a c e r gas was used t o confirm t h a t a i r leakage was tak ing p l ace from old workings of another seam. I t was a l s o found t h a t atmospheric p r e s - s u r e changes s t r o n g l y a f f e c t both s e a l leakage and t h e measured concen t r a t ion of gas samples taken from s h o r t sample p ipes cemented i n t o s e a l s .
The purpose of t h e second s tudy was t o determine i f a pi l lared-and-caved a r e a was being proper ly v e n t i l a t e d . By us ing t r a c e r gas , i t was p o s s i b l e t o f i nd the a i r v e l o c i t y ac ros s t h e i n a c c e s s i b l e a rea . With t h i s information and an a l t i m e t e r survey of t he a r e a , i t was shown t h a t t h e gob was proper ly

v e n t i l a t e d and t h a t t h e r e was no s h o r t - c i r c u i t p a t h through t h e p i l l a r e d -and - caved a r ea .
A t h i r d s tudy us ing SF, showed t h a t p r e s su re pu l s e s caused by a moving t r a i n were causing a smal l r e v e r s e leakage from t h e i n t a k e airway wi th t h e t r a i n t o t h e ad j acen t airway.
The s u c c e s s f u l use of SF, i n t he se t h r e e s t u d i e s i n d i c a t e s t h a t SF, i s p o t e n t i a l l y capable of he lp ing t o so lve v e n t i l a t i o n problems t h a t do no t respond t o convent iona l methods of v e n t i l a t i o n a n a l y s i s . I t s a p p l i c a t i o n should be cons idered when such problems a r e encountered.
REFERENCES
Clemens , C . S . , and A. P. A l t s h u l l e r . Response of Electron-Capture Detector t o Halogenated Substances. Anal. Chem., v . 38, 1966, pp. 133-136.
Clemens, C . A . , A . I. Coleman, and B . E . Saltzman. Concentrat ion and U l t r a s e n s i t i v e Chromatographic Determination of S u l f u r Hexafluoride f o r Appl ica t ion i n Meteorological Tracing. Environ. Sc i . Technol. , v. 2, No. 7, 1968, pp. 551-556.
Dawson, A. B . The Control of t h e Atmosphere i n Sealed-Off Areas by Pres- s u r e Chambers. Trans. I n s t . Min. Eng., v . 115, 1955-56, pp. 156-173.
Drivas, P. J . , P. G . Simmonds, and F. H. Sha i r . Experimental Cha rac t e r i - z a t i o n of V e n t i l a t i o n Systems i n Buildings. Environ. Sc i . Technol., v . 6, No. 7, 1972, pp. 609-614.
Hartman, H . L. Mine V e n t i l a t i o n and A i r Condit ioning. Ronald P res s Co., New York, 1 s t ed. , 1961, 398 pp.
Hunt, A . E . , and H. A . W. Moore. P r i v a t e Communication, 1971. Avai lab le upon r eques t from A . E. Hunt, Bureau of Mines, Morgantown, W . Va.
L e s t e r , D . , and L . A . Greenberg. The Toxic i ty of Su l fu r Hexafluoride. Arch. Ind. Hyg. and Occupational Med., v. 2 , 1950, pp. 348-349.
Mi l e t i ch , A. F. A i r Leakage Calcula t ions i n Mine Ven t i l a t i on . Nedra Publishing House, Moscow, 1968, 146 pp.
Niemeyer, L . E . , and R. A . McCormick. Some Resul t s of Mult iple-Tracer Di f fus ion Experiments a t Cinc inna t i . J . A i r P o l l u t i o n Control Assoc., v . 10, 1968, pp. 403-405.
Saltzman, B . E . , A . E . Coleman, and C . A . Clemens. Halogenated Compounds a s Gaseous Meteorological Tracers . Anal. Chem., v . 38, 1966, pp. 753-758.
Thimons, E . D . , R . J . B i e l i c k i , and F. N. K i s s e l l . Using Su l fu r Hexa- f l u o r i d e as a Gaseous Tracer To Study V e n t i l a t i o n Systems i n Mines. BuMines R I 7916, 1974, 22 pp.
Thimons, E . D . , and F . N . K i s s e l l . Tracer Gas a s an Aid i n Mine Vent i - l a t i o n Analysis . BuMines R I 7917, 1974, 17 pp.
' U S . GOVERNMENT PRINTING OFFICE i I ' -663-755 113