three-axis distributed fiber optic strain measurement in
TRANSCRIPT

Three-Axis Distributed Fiber Optic Strain Measurement in 3D Woven Composite Structures
Matt Castellucci*a, Sandra Klutea, Evan M. Lallya, Mark E. Froggatta, David Lowryb
aLuna Innovations Inc., 3157 State St, Blacksburg, VA, USA 24060; bNASA Johnson Space Center, 2101 NASA Pkwy, Houston, TX 77058
ABSTRACT
Recent advancements in composite materials technologies have broken further from traditional designs and require advanced instrumentation and analysis capabilities. Success or failure is highly dependent on design analysis and manufacturing processes. By monitoring smart structures throughout manufacturing and service life, residual and operational stresses can be assessed and structural integrity maintained. Composite smart structures can be manufactured by integrating fiber optic sensors into existing composite materials processes such as ply layup, filament winding and three-dimensional weaving. In this work optical fiber was integrated into 3D woven composite parts at a commercial woven products manufacturing facility. The fiber was then used to monitor the structures during a VARTM manufacturing process, and subsequent static and dynamic testing. Low cost telecommunications-grade optical fiber acts as the sensor using a high resolution commercial Optical Frequency Domain Reflectometer (OFDR) system providing distributed strain measurement at spatial resolutions as low as 2mm. Strain measurements using the optical fiber sensors are correlated to resistive strain gage measurements during static structural loading. Keywords: fiber optic, distributed strain sensing, Rayleigh scatter, optical frequency domain reflectometry
INTRODUCTION
Fiber-reinforced polymer composite materials are increasingly being utilized in many industries due to their unique properties including high specific strength and specific modulus. These characteristics and others enable innovative products and solutions not practical or even possible with traditional materials. However, composite materials also introduce unique design and manufacturing challenges, especially when applied in new designs or as replacement for traditionally accepted materials. Modeling and damage mechanisms are more complex and less developed than with traditional isotropic materials; manufacturing processes can also have a significant impact on finished part properties. Elevated cure temperatures coupled with contrasting matrix and reinforcement thermal expansion ratios can lead to residual stress states. One way to combat these challenges is by monitoring structural response through manufacturing stages and application testing. Advancements in embedded and surface-mounted sensors enable measurement of properties and performance and help demonstrate confidence, or aid in diagnosing problems. Most of the manufacturing processes used with fiber-reinforced polymer (FRP) composites facilitate installation of embedded sensors. These can be used to monitor throughout manufacturing, cure, and subsequent testing and application service. One particular technology within the broad composites world that can offer unique solutions is three-dimensional weaving. In this process reinforcement is added in the out-of-plane direction, expanding on traditional two dimensional or planar types of woven stock typically used in layup processes. Specialty woven preforms are created for each application. Three-dimensional preforms have several advantages including reduced labor in manufacturing thick sections and reinforcement in the third dimension; resulting in increased through-thickness strength and stiffness. Reinforcement in the through-thickness direction also inhibits delamination and increases damage tolerance. Three dimensional weaving extends the typical planar anisotropy characteristic of more traditional FRP designs into the third dimension, enabling designers to create structures with optimized three-dimensional properties. Fiber optic sensors are a leading technology for embedded and surface-mounted measurements in composite materials. Very low in mass, a single sensing fiber can be 155 μm or less in diameter (on the order of a human hair) yet yield many thousands of measurements over meters of length. In addition, sensors may be configured to measure either strain or temperature. Several fiber optic distributed sensing technologies have been developed, including multiplexed Fiber Bragg Gratings, Brillouin scattering, and Raman scatter [1,2]. Froggatt et al [3] demonstrated that the intrinsic Rayleigh scatter signal reflected from a fiber can be used as a fully distributed strain sensor using Optical Frequency Domain Reflectometry (OFDR). Sensing techniques based on backscatter make possible the use of off-the-shelf

telecom-grade optical fiber as the sensor, lowering measurement cost and enabling very high spatial resolution. Recent OFDR-based sensing work has demonstrated distributed strain measurements with spatial resolution as low as a few millimeters [4-7]. Fiber optic sensors have previously been embedded within FRP structures for the purposes of detecting impact damage and delaminations and to measure complex strain profiles [7-12]. In one application OFDR was used to detect and track local regions of high strain prior to visual crack formation as a 9-meter CX-100 wind turbine blade was cycled to failure [12]. Fiber optic sensors embedded in coupons have been shown to be an effective tool for monitoring the vacuum assisted resin transfer molding (VARTM) cure processes using commercially available OFDR instruments [13]. This work demonstrated resin flow detection and mapping as a function of time throughout the part. High-resolution fiber optic sensing technology can result in a smart structure and play a key role in establishing fully distributed sensing networks within critical manufactured parts, enabling structures that can be monitored throughout manufacture, transport and service life. In the present application optical fiber for distributed sensing was embedded on a commercial weaving loom and used for three-axis strain measurement and subsequent spatial frequency analysis.
SENSING TECHNIQUE
The strain sensor is formed by standard telecom-grade optical fiber composed of a monolithic fused silica core and cladding and a polyimide coating with an outer diameter of 155 μm. An individual sensing fiber can be many meters in length yet provide thousands of strain measurements at points distributed along its length. Measurements are made using the Rayleigh scatter in the fiber, a random but stable pattern of reflections inherent to each fiber as a result of small-scale non-homogeneities in the fiber, such as glass composition fluctuations. This random pattern of reflections is unique to each fiber and constant for the life of the fiber, forming a reflection ‘fingerprint’. Straining the fiber along its axis also stretches the spatial frequency of these reflections, which causes a shift in the frequency spectrum reflected from a particular portion of the fiber.
Sensors are interrogated using optical frequency domain reflectometry (OFDR), an interferometric technique which can distinguish sensors or scattering points at different locations along the fiber. Figure 1 describes the basic OFDR network in which light from a swept-tunable laser is split between the measurement path and a reference path by a fiber optic coupler. Light in the reference path is sent to the sensing fiber through the input path of an optical coupler or circulator. Light reflected from the sensing fiber returns through the coupler or circulator. This light is recombined with light from the reference path. This combined signal then passes through a polarization beam splitter, which is used to control polarization such that reference light is split evenly between the beam splitter outputs. As the laser is swept through a wavelength range, the interference pattern between reference and measurement signals is recorded on the S and P detectors. A Fourier transform yields the phase and amplitude of the reflected light as a function of delay along the fiber length. Another interferometer, with a known delay, is used to compensate for laser tuning nonlinearities.
To calculate strain, a measurement of the fiber’s intrinsic Rayleigh scatter pattern is compared to the fiber’s fingerprint in an unstrained reference state. Complex Fourier transform data is windowed around each desired measurement location. This window length forms the gage length of the strain measurement, which can be as small as a few millimeters. An inverse Fourier transform of the windowed data gives the reflected spectrum from a particular gage in the sensing fiber, which is cross-correlated with the spectrum from the same gage length of fiber in a baseline state. Baseline measurements can be recorded and stored when the sensing fiber is installed but unloaded, and at points of interest during the manufacturing process in order to measure residual strains within a structure. Finally, the cross-correlated shift is converted to strain or temperature change using a calibration coefficient. This process is repeated along the length of the sensing region forming a distributed measurement with selectable gage length and sensor spacing.

Figure 1: Basic OFDR network.
EXPERIMENTAL SETUP
A composite cantilever beam with three-dimensional carbon fiber reinforcement was fabricated with embedded optical sensing fibers for this experiment. The carbon fiber preform was woven with warp, fill, and Z-axis reinforcing fiber at Bally Ribbon Mills in Bally, PA. During the preform weaving process, optical fiber bobbins were added to the weaving loom in order to integrate fiber optic strain sensors into the weave. The sensors consisted of polyimide-coated, low bend loss optical fiber with 155μm diameter. Strain sensors were embedded in the warp, fill, and Z directions as shown in Figure 2. Warp- and fill- direction sensors were located at a depth of about 1mm below the surface of the beam. Fill direction fiber turn-around regions were located on the preform surface. Z-axis sensing fiber ran from one surface of the preform to the other.
Figure 2: Optical fiber sensors embedded within the preform, showing warp, fill, and Z-directions relative to structure overall dimensions.
After preform weaving was completed, the embedded sensing fiber was inspected for continuity and the part was prepared for resin infusion. Three independent warp-direction sensing fibers were embedded during the weaving process. These were all intact and were spliced together forming a single warp-direction sensor with three passes down the length of the beam. A single fill-direction sensing fiber was embedded during weaving and was fully intact, making 15 passes across the width of the beam. Two individual fibers were woven into the z-direction. One was broken during the weaving process but was recovered by splicing. Sensing fiber leads were protected by housing in 650µm PTFE tubing from the egress point to the connector. Prior to resin infusion and cure, sensing regions along the length of the fiber were selected and located with respect to the structure. The preform was infused with resin using a VARTM process and cured in an autoclave at 50psi and 350oF. Because the autoclave did not have feedthroughs to accommodate optical fiber, measurements were made before and after the cure but not during the autoclave process. Following completion of the cure the test article was instrumented with surface-bonded optical sensing fiber and a foil strain gage. Surface optical fiber was positioned in the same

orientation as the embedded warp-axis sensing fiber. The foil strain gage was positioned along the centerline of the beam and located adjacent to the optical fiber. The beam was statically loaded in two different configurations, as a cantilever and in torsion, by hanging masses at 0.9 meters from the fixture. Multiple loads were applied in each configuration. Static distributed strain measurements were recorded using the Luna OBR 4600, a commercially available OFDR instrument. Initially the cantilever beam configuration was oriented with warp- and fill-direction sensing fiber biased toward the tension side. Later the beam was flipped so the sensing fiber was on the compression side. Loading was initially applied at 10lbf, and then increased to 20, 25, and 30 lbf (4.5, 9.0, 11.3, and 13.6kg). The entire test cycle, including fixturing of the beam, was repeated 10 times in the cantilever configuration to facilitate uncertainty calculations.
(a)
(b)
Figure 3: Cantilever loading configuration (a), and torsional loading configuration (b).
RESULTS
Cantilever Load Measurement: Warp Direction (Longitudinal) Fibers Distributed strain measurements were recorded on all four optical sensing fibers and single point strain was
recorded on one resistive strain gage during static cantilever load testing. As mentioned above, in the initial configuration the beam was oriented with embedded warp, embedded fill, and surface warp-direction sensing fibers located on the tension side of the cantilever beam’s neutral axis. The strain profile measured by the center warp-direction fiber, Figure 4, is approximately linear with higher strain at the root, as predicted by analysis. The surface-mounted fiber measures a higher average strain magnitude with significantly more variation compared with the embedded fiber, as it is further from the neutral axis of the beam and bonded to the uneven, vacuum-bagged surface. Additionally, each fiber exhibits a pattern of local strain features that remains constant as load increases; strain magnitudes increase but strain profiles retain their characteristic shapes. This phenomenon is demonstrated by looking at one complete load cycle, as shown in Figure 5. The structure seen in the data is believed to correlate with the specific architecture of the coarse weave.

(a) (b)
Figure 4: Distributed strain profile in embedded warp-direction sensing fiber from beam root to tip (a) and in a surface-bonded fiber (b) at 30 lbf load. ‘Tension’ and ‘Compression’ refer to which side of the neutral axis the sensing fibers were located; the beam was initially set up with sensing fibers on the tension side, then flipped over so the sensing fibers were loaded in compression.
(a) (b)
Figure 5: Strain profile for one load cycle measured by embedded warp-direction fiber along the length of the entire beam (a), and detail view around 150mm position (b).
Comparison with Foil Strain Gage & Confidence Intervals Surface-bonded optical sensing fiber was installed adjacent to a resistive strain gage. For comparison purposes
the location on the fiber optic sensor corresponding to the center point of the strain gage was determined and data processing carried out using an equal gage length of 6.35mm (.25 inch) such that both sensors are spatially averaging over the same length of the beam. Note, however that the optical fiber averages a very small width compared to the foil gage. The strain distribution measured by the surface bonded fiber is presented in Figure 6. The correlation between the optical fiber and strain gage (Figure 6b) is excellent, giving a coefficient of determination of R2 = .999. The optical fiber sensor measures less than 5% higher than the strain gage. Given the spatial variation in the strain profile in this coarse weave, it is likely that this is due to sensitivity to location and the area over which the strain gages measure. The center-to-center distance between the fiber optic and foil gage was approximately 5mm. The strain varies by ~50over this width, or approximately 10%, as illustrated by the variation in Figure 4b. Numerical data from the two measurements including respective standard deviations over 10 load cycles are listed in Table 1.
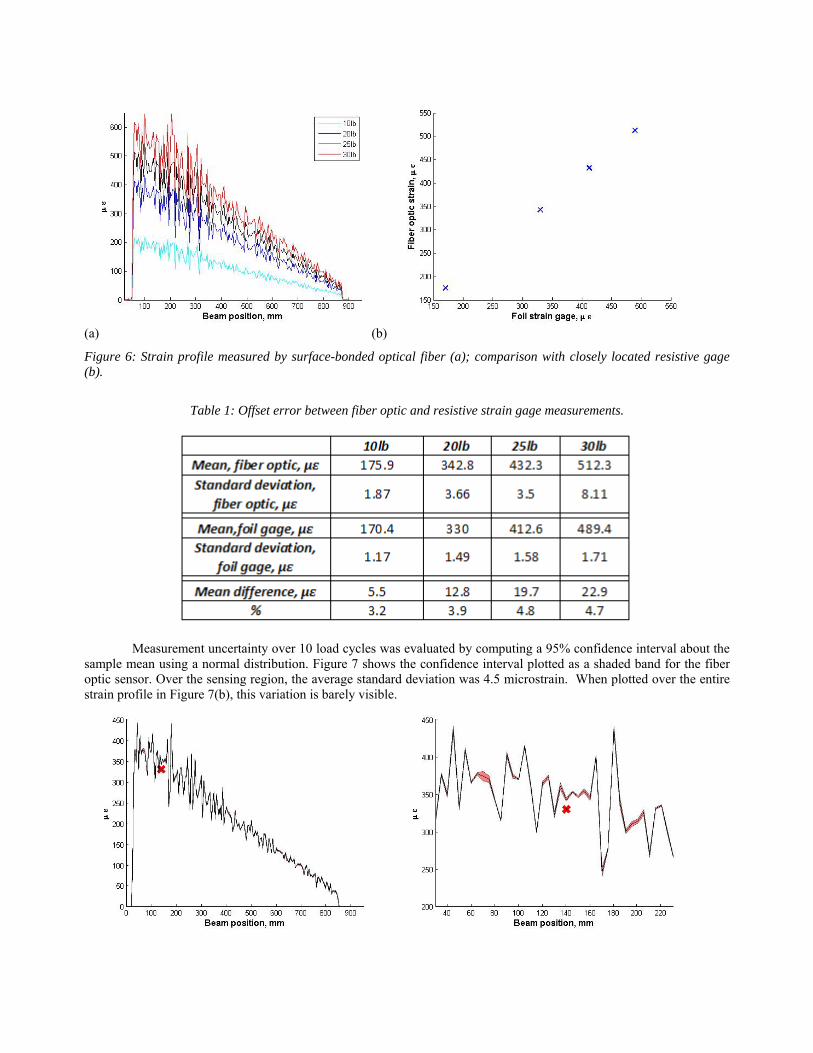
(a) (b)
Figure 6: Strain profile measured by surface-bonded optical fiber (a); comparison with closely located resistive gage (b).
Table 1: Offset error between fiber optic and resistive strain gage measurements.
Measurement uncertainty over 10 load cycles was evaluated by computing a 95% confidence interval about the sample mean using a normal distribution. Figure 7 shows the confidence interval plotted as a shaded band for the fiber optic sensor. Over the sensing region, the average standard deviation was 4.5 microstrain. When plotted over the entire strain profile in Figure 7(b), this variation is barely visible.

(a) (b)
Figure 7: Strain profile for the surface-bonded fiber (black) plotted with the 95% confidence interval shown in red over the entire sensor (a). These strains are also shown over a local region near the strain gage (b).
Cantilever Load Measurement: Fill Direction (Transverse) Fibers The fill direction embedded sensors were perpendicular to the loading direction and displayed negligible strain under cantilever loading. However, the cantilever load generates tensile strain in the ‘turn-around’ regions between sensors. Figure 8 shows the strain profile measured by the fill direction fiber, with zero strain in the fill-direction regions and tensile strain in the turn-around regions, as expected. The envelope of peak strain in the turns decays linearly towards the tip of the beam. The maximum tensile strains in those regions of the fiber oriented along the axis of the beam aligned with the warp direction fiber agree well with the strains measured by the corresponding surface-mounted warp fiber. The measured strain profile also retains its characteristic shape as load level increases, as shown in Figure 8(b). Again, the structure seen in the data is believed to correlate with the architecture of the coarse weave. In Figure 9 the strain measured by the embedded fill-direction sensing fiber is plotted on the beam, for ease in visualization.
(a) (b)
Figure 8: Strain measured with the fill-direction embedded sensor over the entire sensor length (a) and over a local region around one loop between passes in the fill direction.
Figure 9: Strain measured by the fill-direction embedded fiber plotted along the beam.
Cantilever Load Measurement: Z-Axis (Through-Direction) Fibers The embedded Z-direction sensing fiber undergoes transitions from tensile to compressive strain as the fiber passes from one face of the beam to the other. Figure 10 shows the strain profile measured by the embedded Z-direction fiber. This data shows alternating tensile and compressive regions as the sensor transitions from the tension side of the neutral axis, through the thickness to the compressive side of the neutral axis, and so on. This measurement is analogous
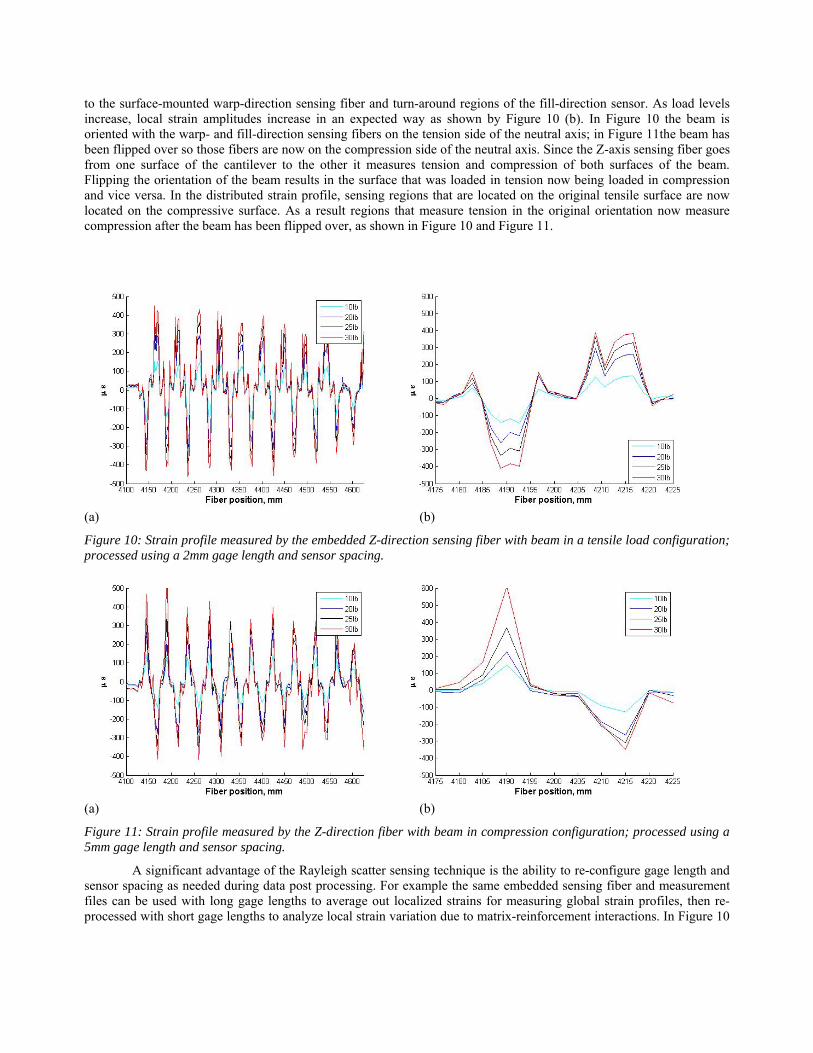
to the surface-mounted warp-direction sensing fiber and turn-around regions of the fill-direction sensor. As load levels increase, local strain amplitudes increase in an expected way as shown by Figure 10 (b). In Figure 10 the beam is oriented with the warp- and fill-direction sensing fibers on the tension side of the neutral axis; in Figure 11the beam has been flipped over so those fibers are now on the compression side of the neutral axis. Since the Z-axis sensing fiber goes from one surface of the cantilever to the other it measures tension and compression of both surfaces of the beam. Flipping the orientation of the beam results in the surface that was loaded in tension now being loaded in compression and vice versa. In the distributed strain profile, sensing regions that are located on the original tensile surface are now located on the compressive surface. As a result regions that measure tension in the original orientation now measure compression after the beam has been flipped over, as shown in Figure 10 and Figure 11.
(a) (b)
Figure 10: Strain profile measured by the embedded Z-direction sensing fiber with beam in a tensile load configuration; processed using a 2mm gage length and sensor spacing.
(a) (b)
Figure 11: Strain profile measured by the Z-direction fiber with beam in compression configuration; processed using a 5mm gage length and sensor spacing.
A significant advantage of the Rayleigh scatter sensing technique is the ability to re-configure gage length and sensor spacing as needed during data post processing. For example the same embedded sensing fiber and measurement files can be used with long gage lengths to average out localized strains for measuring global strain profiles, then re-processed with short gage lengths to analyze local strain variation due to matrix-reinforcement interactions. In Figure 10

the strain profile has been calculated with a gage length and sensor spacing of 2mm. In Figure 11 the gage length and sensor spacing are 5mm. Torsional Load Measurement In a third static test the beam was subjected to torsional loading. The beam was constrained in the same orientation as the ‘tension’ cantilever test; with embedded warp- and fill-direction sensing fibers on the top side of the beam. In this loading configuration, the warp-direction sensing fiber measures different strain profiles depending on the sensor location within the beam and relative to the neutral axis. The first warp-direction sensing region is located on the side of the beam where the upward force was applied. This region measures compression near the beam root, changing to tension near the tip as shown in Figure 12. In contrast, the third warp direction sensing region lies on the side of the beam experiencing a downward force and shows tensile strain near the root and compression near the tip. The section of warp-direction sensing fiber along the center of the beam experiences relatively neutral strain.
Figure 12: Smoothed strain profile along embedded warp-direction sensing fiber showing the global strain profile during the torsion test. Figure 13 shows the local strain profiles measured by two different regions of embedded warp-direction sensing fiber during the torsion test. For the warp-direction sensing fiber there is one fiber along the beam centerline and one fiber on each side of the centerline as shown in Figure 2. Figure 13 (a) shows the local compressive strain profile measured on one side of the beam centerline and Figure 13 (b) shows the local tensile profile measured on the opposisite side of the beam centerline.
Figure 13: Compression (a) and tensile (b) strain profiles measured at the beam root on opposite sides of the centerline.

An interesting strain profile is measured by the embedded fill-direction sensing fiber during the torsion test. Primary features are regions of tension-compression in the turn-around regions between fill-direction sensing regions. This profile is plotted in Figure 14; fill-direction regions are indicated by horizontal bars.
Figure 14: Strain profile measured by fill-direction sensing fiber during torsion test; note tension and compression measured in turn-around regions. Horizontal bars indicate fill-derection sensing regions.
Figure 15: Measured strain in fill-direction sensing fiber during torsional load takes on the characteristic tensile/compressive profile in turn-around regions.
Fine-Structure Strain Measurement The fiber optic strain measurement is computed by cross-correlating the measurement signal with a baseline reference. Within practical limits dictated by the spatial resolution of the raw acquired data, the spatial resolution of the resulting strain measurement can be increased by processing using a smaller gage length and/or sensor spacing. Figure 16Error! Reference source not found. shows a high-resolution strain profile for the surface-bonded fiber processed at 2mm gage length and 2mm sensor spacing.

(a) (b)
Figure 16: Surface fiber strain profile along one length of the beam (a), and local region around the foil gage (b); processed using 2mm gage length and sensor spacing. Also shown is data from a single foil gage (x). The disparity between fiber optic and foil gage measurements is due to difference in gage length as well as the small difference in location. The foil gage averages strain over a 6.35mm length.
Processed strain data were analyzed using Fast Fourier Transform (FFT) to identify recurring patterns due to physical structure within the part or the layout of the fiber. Repetitive features in the strain data can be a result of fiber routing, such as turn-around regions between fill-direction sensing fibers, or local strains due to complex part structure, such as warp-direction fiber repeatedly passing over and under reinforcement tows. FFT processing can be used to identify spatial frequencies of repeating patterns and correlate these frequencies with patterns in the layout or the structure in order to better understand the data. As an example to demonstrate this technique using data with known spatial periodicity, the fill-direction strain response was analyzed using an FFT. This data set was chosen because there are very obvious periodic features in the strain response during the cantilever load test resulting from the turn-around regions, as shown in Figure 8. The fiber routing pattern resulted in tensile stress peaks spaced about every 166mm along the fiber due to the presence of repeated turn-around regions. For this analysis the whole fill direction sensor, including the fill-direction regions and the turn-around regions, was analyzed. Figure 17 plots the frequency content of the fill-fiber strain response, showing a clear peak located at 6.11 samples/meter. This may be converted to spatial periodicity using a conversion analogous to converting sampling frequency in Hz to time duration between samples, then converting meters to mm. The sampling frequency 6.11 samples/meter corresponds to a periodic strain response occurring every 164mm along the sensing fiber which is the spacing of the tensile stress peaks in the turn-around regions. The second harmonic seen at 13 samples/meter is most likely due to the square-wave nature of this distributed strain response along the fiber. The data was processed using various gage lengths and sensor spacings to ensure that the features seen in the data were not a result of the widths used for processing. As can be seen in the spectral response, similar peaks are found with each choice of gage length and sensor spacing.

Figure 17: FFT of fill-direction strain shows clear peaks at spatial frequencies of 6.1 and 13 samples/meter for all sets of processing parameters.
Next the embedded warp-direction strain data, processed using 1, 2, 5, and 10mm gage length and sensor spacing, were analyzed using FFT. For this analysis data from only one length of distributed strain measurement along the beam was processed. Figure 18 shows the frequency content of the warp-direction strain, with peaks at spatial frequencies of 58.3 and 116.6 samples/meter, or a spacing of 17.2mm and 8.6mm in the strain response. This is most likely a result of interactions with the coarse reinforcement tow weave pattern. Due to Nyquist cutoff, data with a sampling frequency of 5mm and 10mm are unable to capture the higher frequency structural response.
Figure 18: FFT of warp-direction strain shows peaks in the spectral response at spatial frequencies 58.3 and 116.6 samples/meter.

CONCLUSION
High-spatial-resolution three-dimensional internal strain profiles were measured in a composite cantilever beam using embedded fiber optic distributed strain sensors woven into the preform on a commercial loom. Measured strain profiles reflect expected results and agree well with resistive strain gage measurements despite the coarse reinforcement tow weave. Distributed fiber optic sensors are able to accurately measure not only the ‘global’ strain profiles but also localized strains within the complex composite structure. Local strain variations are shown to be repeatable and increase in magnitude as load increases. This measurement, made possible by the distributed fiber optic sensor, is analogous to embedding thousands of very short gage length foil gages within the structure. However, using the fiber optic sensor the gage length, sensor spacing, and location are all re-configurable during data processing.
FUTURE WORK
Assessment of strain and temperature throughout the cure process, possibly with intentionally resulting residual internal stresses, as well as technology demonstration with 2-D woven fabric and internal seams are intended in the near future.
REFERENCES
1. A. J. Rogers, “Distributed optical‐fibre sensing,” Meas. Sci. Technol. 10, 75‐99 (1999).
2. 2. M. A. Davis, A. D. Kersey, “Simultaneous measurement of temperature and strain using fiber Bragg gratings and Brillouin scattering,” Proc. SPIE, 2838, 114‐123 (1996).
3. M. Froggatt and J. Moore, “High resolution strain measurement in optical fiber with Rayleigh scatter,” Appl. Opt., 37, 1735‐1740 (1998).
4. M. Froggatt, B. Soller, D. Gifford, and M. Wolfe, “Correlation and keying of Rayleigh scatter for loss and temperature sensing in parallel optical networks,” OFC Technical Digest, paper PDP 17 (Los Angeles, March 2004).
5. B. J. Soller, D. K. Gifford, M. S. Wolfe, M. E. Froggatt, M. H. Yu, and P. F. Wysocki, “Measurement of localized heating in fiber optic components with millimeter spatial resolution,” OFC Technical Digest, paper OFN 3, 2006.
6. S. Kreger, D. K. Gifford, M. E. Froggatt, B. J. Soller, and M. S. Wolfe, "High resolution distributed strain or temperature measurements in single‐ and multi‐mode fiber using swept‐wavelength interferometry," OFS 18 Technical Digest, Paper ThE42, 2006
7. J. Renee Pedrazzani, Matt Castellucci, Alex K. Sang, Mark E. Froggatt, Sandra M. Klute, and Dawn K. Gifford, “Fiber optic strain sensing used to investigate the strain fields in a wind turbine blade and in a test coupon with open holes”, SAMPE Tech 2012.
8. R.M. Measures, Structural Monitoring with Fiber Optic Technology, 2001, San Diego, California: Academic Press
9. L. Jinsong and A. Asundi, “Structural Health Monitoring of Smart Composite Materials by using EFPI and FBG sensors, Sensors and Actuators,” A: Physical 2003; 103(3): p. 330‐340.
10. Rodrigo Silva‐Muñoz and Roberto A. Lopez‐Anido, “Monitoring of Marine Grade Composite Doubler Plate Joints Using Embedded Fiber Optic Strain Sensors”, Journal of Advanced Materials, Volume 40, No. 4, October 2008, pp. 52‐72
11. Guemes, A. Fernandez‐Lopez, and B. Soller, Structural Health Monitoring, 9 (3), 2010, pp. 233‐245
12. Kaplan, A., Klute, S. M., Heaney, A., “Distributed Optical Fiber Sensing for Wind Blade Strain Monitoring and Defect Detection.” The 8th International Workshop on Structural Health Monitoring. Stanford, California, September 13‐15, 2011.
13. Gifford, D. K., Metry, D. R., Froggatt, M. E., Rogers, M. E., Sang, A. K., “Monitoring Strain During Composite Manufacturing Using Embedded Distributed Optical Fiber Sensing.” SAMPE Technical Conference Proceedings: 2011 ‐ State of the Industry: Advanced Materials, Applications, and Processing Technology. Long Beach, CA, May 23‐26, 2011. Society for the Advancement of Material and Process Engineering.