threading methodology: principles and practices · threading methodology: principles and practices...
TRANSCRIPT

Threading Methodology: Principles and Practices Version 2.0

Threading Methodology: Principles and Practices
© 2003 Intel Corporation Page 2 of 64
INFORMATION IN THIS DOCUMENT IS PROVIDED IN CONNECTION WITH INTEL PRODUCTS. NO LICENSE, EXPRESS OR IMPLIED, BY ESTOPPEL OR OTHERWISE, TO ANY INTELLECTUAL PROPERTY RIGHTS IS GRANTED BY THIS DOCUMENT. EXCEPT AS PROVIDED IN INTEL'S TERMS AND CONDITIONS OF SALE FOR SUCH PRODUCTS, INTEL ASSUMES NO LIABILITY WHATSOEVER, AND INTEL DISCLAIMS ANY EXPRESS OR IMPLIED WARRANTY, RELATING TO SALE AND/OR USE OF INTEL PRODUCTS INCLUDING LIABILITY OR WARRANTIES RELATING TO FITNESS FOR A PARTICULAR PURPOSE, MERCHANTABILITY, OR INFRINGEMENT OF ANY PATENT, COPYRIGHT OR OTHER INTELLECTUAL PROPERTY RIGHT. Intel products are not intended for use in medical, life saving, life sustaining applications. Intel may make changes to specifications and product descriptions at any time, without notice. Intel, the Intel logo, Pentium, Intel Xeon and VTune are trademarks or registered trademarks of Intel Corporation or its subsidiaries in the United States and other countries. *Other names and brands may be claimed as the property of others. Copyright © 2002, 2003 Intel Corporation

Threading Methodology: Principles and Practices
© 2003 Intel Corporation Page 3 of 64
Contents Abstract 5 About this Document 6 1. Introduction 7 2. Intel® Threading Tools 9
VTune™ Performance Analyzer ......................................... 9 Intel® C/C++ and Intel® Fortran Compilers ........................ 9
OpenMP Support............................................................ 10 Auto-Parallelization (Preview Feature) ........................... 10
Intel® Thread Checker ........................................................ 10 Thread Profiler .................................................................... 10
OpenMP Thread Profiler................................................. 11 Win32* Thread Profiler ................................................... 11
Intel® Performance Libraries .............................................. 12 3. Generic Development Cycle 13
Analysis Phase.................................................................... 13 Design Phase...................................................................... 13 Implementation Phase ........................................................ 14 Debug Phase ...................................................................... 14 Testing and Tuning Phase .................................................. 14
4. Approaches to Parallel Programming 15 Task-Parallel Applications................................................... 15 Data-Parallel Applications ................................................... 15 Threading Methods ............................................................. 16
Automatic Parallelization ................................................ 16 Compiler-Directed Parallelism with OpenMP* ................ 17 Expressing Concurrency with Thread Libraries.............. 18
5. Efficient Threading Practices 20 Amdahl’s Law ................................................................. 20 Granularity ...................................................................... 21 Thread Creation.............................................................. 21 Implicit and Explicit Synchronization .............................. 22
6. Methodology for Threading Applications 26 Designing a Threaded Application ...................................... 26
Video Editing Example ................................................... 26 Data Decomposition ....................................................... 27 Functional Decomposition .............................................. 31 Performance Upper Bound............................................. 32

Threading Methodology: Principles and Practices
© 2003 Intel Corporation Page 4 of 64
Serial Application to Threaded Application ......................... 33 Analysis .......................................................................... 33 Design ............................................................................ 34 Decomposition Types ..................................................... 35 Data Restructuring.......................................................... 37 Implementation ............................................................... 39
Functional Decomposition................................................... 40 Debugging & Testing ...................................................... 43 Evaluating Third Party DLLs........................................... 45 Tuning for Performance.................................................. 46
7. Architecture-Specific Tuning for Hyper-Threading technology 58
Designing ............................................................................ 58 Implementing....................................................................... 59 Debugging........................................................................... 59 Tuning ................................................................................. 60 Validation ............................................................................ 60 Known Pitfalls...................................................................... 61
Spin-waits ....................................................................... 61 Write-Combining Store Buffers....................................... 62 64K Alias Conflicts.......................................................... 62 Effective Cache Locality ................................................. 63
8. Using the VTune™ Performance Analyzer to detect Hyper-Threading technology Issues 64

Threading Methodology: Principles and Practices
© 2003 Intel Corporation Page 5 of 64
Abstract Threading serial applications has become more common with the advent of operating systems and hardware architectures that support multiple processors. In order to realize the performance potential of systems with Hyper-Threading technology enabled, applications must be threaded for performance to take maximum advantage of the new architectures. However, the process of threading an application can be difficult without the right tools. This document introduces threading concepts and provides a methodology for threading serial applications and tuning threaded applications for performance using the Intel® Threading Tools. Emphasis is placed on writing correct and efficient threaded applications. Discussion includes analysis of common coding pitfalls and their solutions. Sample implementations are also provided to highlight some of the recommended paradigms.

Threading Methodology: Principles and Practices
© 2003 Intel Corporation Page 6 of 64
About this Document
This document is organized by chapter as follows: 1. Introduction provides an overview of the threading methodology. 2. Intel® Threading Tools introduces the tools Intel provides to help you create,
analyze, check, and improve the performance of your multi-threaded application. 3. Generic Development Cycle presents an overview of a generic model you can use
to design, create, and optimize a multi-threaded application. It highlights the use of the different threading tools associated with each phase of the development cycle.
4. Approaches to Parallel Programming presents parallel computing theory by discussing various parallel models and the means to achieve these by exploring various threading techniques.
5. Efficient Threading Practices describes best practices for threading an application. 6. Methodology for Threading Applications returns to the generic development cycle
in greater detail, providing examples and specific guidelines for successfully threading an application.
7. Architecture-Specific Tuning for Technology discusses architecture-level specific considerations for improving the performance of your threaded application.
8. Using the VTune™ Performance Analyzer to detect Hyper-Threading technology Issues explains how to use different features of the VTune analyzer to your advantage.

Threading Methodology: Principles and Practices
© 2003 Intel Corporation Page 7 of 64
1. Introduction
Today’s operating systems strive to make the most efficient use of a computer’s resources. Most of this efficiency is gained by sharing machine resources among several processes (multi-processing). Such “large-grain” resource sharing is enabled by operating systems without any instructions from applications or processes. All these processes can potentially execute concurrently, with the CPU (or CPUs) multiplexed among them. Newer operating systems provide mechanisms that enable applications to control and share machine resources at a finer grain, that is, at the threads level. Just as multiprocessing OSes can perform more than one task concurrently by running more than a single process; a process can perform more than one task by running more than a single thread. This document discusses how to use threads to improve your application’s performance, responsiveness, and throughput. It also presents a methodology for threading a serial application. As with most programming techniques, the primary goal of threading is to help you take the best advantage of the system resources. Concurrency increases the complexity of the design, testing and maintenance of the code while offering increased throughput on single or multiprocessor machines. Threading represents a major step forward from the time when concurrency was implemented using inter-process communication. Overhead from inter-process communication can have a negative impact on performance. By threading an application some of this complexity can be reduced, especially with respect to inter-process communication. In addition, threading retains the ability to scale the level of parallelism with an incremental increase in system resource requirements. However, threading an application may introduce errors that are hard to detect and reproduce. A majority of the effort in threading applications falls in the design, implementation and the debug phases of the development cycle. Threading effort depends on your experience in threading applications and your knowledge of the application that is being threaded. The Intel® Threading Tools are designed to help all developers, from novice to expert, by providing tools that target various stages in the development cycle. This document discusses the Intel Threading Tools and their role in development cycles. It also presents sections on parallel computing theory, threading principles, and efficient threading practices before stepping through the proposed methodology. The objective of multiprocessing is to have some process running on the CPU at all times in order to maximize utilization. Each process is given a time-slice during which time it executes. Creation of a process involves the creation of an address space, the application’s image in memory - this includes a code section, a data section and a stack. Parallel programming using processes requires the creation of two or more processes and an inter-process communication mechanism to coordinate the parallel work during their concurrent execution. Threads are tasks that run independently of one another within the context of a process. A thread shares code and data with the parent process but has its own unique stack and architectural state that includes the instruction pointer. Threads operate in the same manner as processes and like processes, share the CPU. Each thread is a

Threading Methodology: Principles and Practices
© 2003 Intel Corporation Page 8 of 64
different stream of control that can execute its instructions independently, enabling a multithreaded process to perform numerous tasks concurrently. The main benefits of threading include the following: • Performance gains from multiprocessing hardware (parallelism) • Increased application throughput • Increased application responsiveness • More efficient use of system resources • Well structured code In some cases threading an existing serial application increases the complexity of the application. Sharing resources such as global data can introduce common programming errors such as storage conflicts and other race conditions. Debugging such problems is difficult as they are often non-deterministic and debugging probes such as print statements can mask such errors.

Threading Methodology: Principles and Practices
© 2003 Intel Corporation Page 9 of 64
2. Intel® Threading Tools
Intel® Threading Tools enable you to rapidly multithread your single-threaded applications, assist in locating errors and facilitate increased application performance on Intel® processors by enabling architectural features. This section describes the overall features and capabilities of the threading tools.
VTune™ Performance Analyzer The VTune™ Performance Environment is a performance framework that includes the VTune Performance Analyzer. The VTune analyzer enables you to tune an application for optimal performance on Intel® architectures. The key features of the VTune analyzer component include the following: • Time and event based sampling offer a non-intrusive means of collecting profile
information of your application with minimal overhead. No instrumentation or recompilation is required.
• Hotspot analysis enables you to identify regions in your application that take the most amount of time and help concentrate the tuning efforts on regions with the greatest potential for performance improvement.
• Call graph profiling presents a pictorial view of program flow. It also helps you identify critical functions and call sequences that are time consuming.
• Integrated source view provides detailed sampling information for each source code line.
• The Intel® Tuning Assistant provides valuable advice on tuning your system resources and application performance. It analyzes the data collected by the VTune™ Performance Analyzer, identifies performance issues, and provides tuning advice, using its multiple knowledge-bases.
For more information, see the Performance Analyzers website at: http://developer.intel.com/software/products/vtune/ .
Intel® C/C++ and Intel® Fortran Compilers Intel® Compilers help make your software run at top speeds on Intel® 32-bit processors, including the new Intel® Pentium® M processor based on Intel® Centrino™ mobile technology, and 64-bit Intel® Itanium® and Itanium 2 processors. Optimizations include support for Streaming SIMD Extensions 2 (SSE2) in the Intel® Pentium® 4 processor and software pipelining in the Intel® Itanium® and Itanium 2 processors. Inter-procedural optimization (IPO) and profile-guided optimization (PGO) can provide greater application performance. Intel Compilers support multi-threaded code development and optimization through the Auto-Parallelism feature and OpenMP* 2.0 support.

Threading Methodology: Principles and Practices
© 2003 Intel Corporation Page 10 of 64
OpenMP Support OpenMP is the industry standard for portable multithreaded application development, and is effective at fine grain (loop level) and large grain (function level) threading. The Intel Compilers support OpenMP API version 2.0 and perform code transformation for shared memory parallel programming. The Intel Compilers support multi-threaded application development and debugging, with support for OpenMP 2.0.
Auto-Parallelization (Preview Feature) The Intel C++ Compiler 7.1 includes an Auto-parallelization feature for automatic threading of loops. This feature provides developers with an easy way to take advantage of parallelism to improve application performance on multiprocessor systems. This option detects parallel loops capable of being executed safely in parallel and automatically generates multithreaded code for these loops. Automatic parallelization relieves you from having to deal with the low-level details of iteration partitioning, data sharing, thread scheduling and synchronizations. It also provides the benefit of the performance available from multiprocessor systems, and systems that support Hyper-Threading technology. For more information, see the Intel Compilers website at http://developer.intel.com/software/products/compilers/ .
Intel® Thread Checker The Intel® Thread Checker is one of the key components of the threading tools. It is a plug-in to the VTune Performance Environment that helps you locate hard-to-catch errors and potential errors in your threaded application. Use the Thread Checker to detect the following types of errors: • Deadlocks and potential deadlocks • Data races • Thread stalls • API violations • Failing library routines Thread Checker pinpoints errors to their actual line in the source code. The details provided for each error are dependent on the type of instrumentation that is performed on the application. The Thread Checker collects data using your choice of source or binary instrumentation, or a combination of both. Source instrumentation is done by making source code changes before (or as) your code is compiled. Binary instrumentation is done by alerting the executable files directly to insert data collection capabilities, without knowledge of the source code. For more information, see the Threading Tools website at: http://developer.intel.com/software/products/threading/
Thread Profiler Thread profiler is a plug-in to the VTune Analyzer that helps you identify performance bottlenecks in your applications that are threaded using OpenMP* and Win32* API.

Threading Methodology: Principles and Practices
© 2003 Intel Corporation Page 11 of 64
OpenMP Thread Profiler Building your application with the /Qopenmp_profile compiler flag directs the compiler to link the application with the instrumented versions of the library. Applications built with instrumented libraries can be run outside the VTune Environment to generate the runtime statistics file. The statistics file can then be viewed with the help of thread profiler within the VTune Analyzer. If the application is built without the instrumented libraries, the VTune Analyzer substitutes the OpenMP runtime DLLs with the instrumented version when run within the VTune environment. However, the application must be built to use the DLL version of the OpenMP runtime library by using /MD /Qopenmp at compile time. Thread profiler presents runtime statistics in various views so that you can see the breakdown of your application’s performance on a per-thread basis and on a per-OpenMP region basis. The profile is broken down according to time spent in serial regions, parallel regions, critical sections and various synchronization overheads. Using this information, you can determine if the threaded application performance is being affected by excessive overhead, synchronization, or thread imbalance.
Win32* Thread Profiler Win32 Thread Profiler offers features that are useful in profiling explicitly threaded software using the Microsoft* Win32 threading API to locate performance bottlenecks impacting parallel performance. This is achieved by instrumenting the application binary and inserting calls to statistics gathering functions in the Thread Profiler library. The data collected is then used to identify performance issues in multithreaded software: • Synchronization delays • Stalled threads • Time in blocking operations • System utilization (Over vs. under utilization)
Thread Profiler helps you: • Understand the threading patterns in multithreaded software • Understand the performance impact of synchronization • Compare the performance impact of different synchronization methods, different
numbers of threads, or different algorithms • Locate synchronization constructs that impact execution time • Determine the sections of code to optimize for sequential performance and for
threaded performance

Threading Methodology: Principles and Practices
© 2003 Intel Corporation Page 12 of 64
Intel® Performance Libraries The Intel® Performance Libraries reduce the cost of development and maintenance by providing a range of library functions. The Intel® Integrated Performance Primitives library is a cross-platform software library with a variety of multimedia functions to provide increased performance for audio/video codecs and image/signal processing. The Intel® Math Kernel Library provides linear algebra, Fast Fourier Transform and vector math functions enabling increased performance for financial, scientific and engineering software. The Intel® Math Kernel Library (Intel MKL) is composed of highly optimized mathematical functions for engineering, scientific and financial applications requiring high performance on Intel® platforms. The functional areas of the library include linear algebra consisting of LAPACK and BLAS, Fast Fourier Transform (FFT) and vector transcendental functions (vector math library/VML). Intel MKL is optimized for the latest features and capabilities of the Intel Pentium 4 processor, Intel Xeon™ processors and Intel Itanium architecture. The Intel MKL is compatible with Windows and Linux environments. Intel MKL enables you to exploit many of the advantages of parallelism with none of the work. It provides excellent scaling on many applications. For more information, see the Performance Libraries website at: http://developer.intel.com/software/products/perflib/.

Threading Methodology: Principles and Practices
© 2003 Intel Corporation Page 13 of 64
3. Generic Development Cycle This chapter presents an overview of a generic program development model you can use to thread your application and improve its performance. You can use appropriate components of the Intel® Threading Tools at each stage of development to improve the performance of your threaded application. Each stage of the development cycle is described in greater detail, with examples, in the chapter, Methodology for Threading Applications.
Analysis Phase Typically, the analysis stage involves profiling a serial application to determine regions of the application that can most benefit from threading. Use the VTune™ Performance Analyzer to identify critical paths using call-graph analysis and time-based sampling (TBS) to determine hotspots in the critical path. Once you determine potential candidates for threading, choose an appropriate threading model. This can be easily done by first determining the type of parallelism, (data or functional), that characterizes each threading candidate.
Figure 1: A flowchart depicting the key steps of a generic threading methodology.
Design Phase During the design phase, you examine the critical regions identified during the analysis phase to determine the design changes required to accommodate a threading paradigm. Design changes include making modifications to facilitate the use of threading models, including: • data restructuring • code restructuring During this phase, you need to address the following questions: • Which variables must be shared? • Is the current structure is a good candidate for threading?

Threading Methodology: Principles and Practices
© 2003 Intel Corporation Page 14 of 64
Implementation Phase The implementation phase involves converting design elements to actual code by selecting an appropriate threading model. In addition to its main purpose as a tool for the debug and testing phases, you can use The Intel® Thread Checker in creative ways to aid in the design and development of threaded applications. Consider implementing your program using one or more of the following threading methodologies: • Use the Intel® compilers to automatically parallelize certain loops. • Use the Thread Checker to locate syntactic or runtime errors and identify
variables that cause errors. • Specify the parallelism in your application using OpenMP pragmas or directives. • Explicitly parallelize your program using calls to the Win32 thread API or the
POSIX threads API.
Debug Phase During the debug phase, you iron out bugs; ensure the correctness of your application, and meet product requirements. Use dynamic analysis of your application to uncover issues and support interactive debugging of problem areas. Use the Intel Thread Checker during this phase to detect non-deterministic errors such as data races, deadlocks, and thread stalls.
Testing and Tuning Phase During testing, you examine the execution performance and the correctness of the threaded application as follows: 1. Use the Intel® Thread Checker to validate the correctness of your threaded
application. It is assumed that the serial run of the application results in correct values, so any errors can be assumed to be due to threading errors.
2. Compare performance of your threaded application against the serial application’s performance to estimate the scaling potential Apply parallel-program specific ideas to increase performance.
The tuning phase increases application performance incrementally where possible. Note that correct parallel design must be ensured before beginning application performance tuning. 1. Use Thread Profiler to determine if there are an high level threading related
performance issues. 2. Fix performance issue using a better choice of threading API or by redesign. Redesign of the application may require a pass through the debug and test phases as these changes may have introduced threading errors. An iterative cycle of Debug->Test->Tuning may be required to eliminate all problems.

Threading Methodology: Principles and Practices
© 2003 Intel Corporation Page 15 of 64
4. Approaches to Parallel Programming To effectively thread an application, you must choose the most appropriate threading method. While variations in threading methods may not impact performance, choosing the wrong threading method increases the amount of time spent modifying, debugging and tuning a threaded application. To choose the best threading method, characterize your application in terms of two models: task-parallel or data-parallel.
Task-Parallel Applications In task-parallel applications, independent work that is encapsulated in functions is mapped to threads which execute asynchronously as shown in Figure 2. Thread libraries such as the Win32* thread API or POSIX* threads are designed to express task-level concurrency.
Figure 2: A Personal Information Manager (PIM) is a good example of an application that contains task-level concurrency. When expressing task-level concurrency, independent functions are mapped to threads as illustrated in the pseudo-code.
Data-Parallel Applications Data parallelism implies that the same instructions or operations are applied repeatedly to different data. This model is shown in Figure 3. Compute-intensive loops are good candidates for data parallel threading methods. Typical image processing algorithms that apply a filter to a pixel or group of pixels to compute a new value for a pixel are a common example of data parallelism. As long as the pixel operations are independent, the computations to generate new pixel values can be done in parallel. Sometimes it is possible for the compiler to automatically express data parallelism. Or, you can describe the parallelism using a directive syntax called OpenMP*. The compiler is responsible for converting the directives to threaded code.

Threading Methodology: Principles and Practices
© 2003 Intel Corporation Page 16 of 64
Figure 3: A spell checker is a good example of a data-parallel operation. The same, independent operation of comparing a word in a file against a dictionary is performed repeatedly, as shown in the pseudo-code.
Note that both parallel models can exist in different parts of an application. A database is a good example of an application that exhibits both parallel models. The task of adding records to the database could be assigned to one thread, sorting to another, indexing to yet another and a pool of threads could service queries. A database query applies the same operation to different data, making it a data-parallel task.
Threading Methods The primary design goals of OpenMP and thread libraries are different. Data parallel methods such as OpenMP are designed to improve performance through multiprocessing. Explicit threading methods, though just as capable at improving parallel performance, are primarily designed to express the natural concurrency that is present in most applications. In fact, the target platform of many threaded applications is a uni-processor computer. There two reasons to use threading: to express concurrency and to improve performance. Consider these reasons in terms of word processing, which is not normally considered a performance-driven application. When a large document is printing, users may want to continue working. Many users would not tolerate a frozen interface during a long print job. If an application has multiple threads, the operating system can context switch between them, thus hiding latency. The user perceives the improved response time from the application as faster performance. This section describes different types of threading methods.
Automatic Parallelization Use the -Qparallel option of the Intel compilers to automatically parallelize some loops. When -Qparallel is enabled, the compiler attempts to identify loops that can be safely executed in parallel. The following guidelines improve the likelihood that the compiler will successfully identify a parallel loop: • Expose the trip count of the loop • Avoid references to global data or procedure calls in the loop body • Do not branch out of the loop Exposing the trip count of the loop does not mean that the trip count of a loop must be fixed at compile-time. Rather, the compiler must be able to determine whether the trip

Threading Methodology: Principles and Practices
© 2003 Intel Corporation Page 17 of 64
count varies during execution of the loop. A loop cannot be safely parallelized if the iteration count varies based on conditions within the loop. Branching from the loop has a similar effect. Failure to adhere to these recommendations does not automatically disqualify a loop from parallel execution. For example, calling a pure function such as a routine with no side-effects does not disrupt parallelism.1 However, the compiler will err on the side of caution when it cannot guarantee correct parallel execution. Use the -Qpar_report3 option to get a full report on which loops were successfully parallelized and the dependencies that prohibit parallelization of others. See the compiler documentation for more details.
Compiler-Directed Parallelism with OpenMP* The most advanced auto-parallelizing compilers are not up to the task of parallelizing hundreds or thousands of lines of code spanning multiple source files. In contrast, if you understand the underlying algorithm, you may know instinctively that the same code is free of dependencies and safe to execute in parallel. For this reason, a directive-based syntax called OpenMP* was developed to enable you to describe parallelism to the compiler.
Parallel Regions
MasterThread
Figure 4: OpenMP* is a fork/join method: every parallel region has a clearly defined beginning and end.
OpenMP* quickly became an industry standard for compiler-based threading after its introduction in 1997. Before OpenMP, several competing but similar sets of parallel compiler directives were available. The OpenMP specification unified these syntaxes and extended their capabilities to handle larger applications. The OpenMP specifications define a set of Fortran directives and C/C++ preprocessor pragmas to express data parallelism. OpenMP is a fork/join method for creating and terminating threads as shown in Figure 4. You must specify the start and end of each parallel region. Use the -Qopenmp option to tell the Intel compilers to process OpenMP directives or pragmas to produce a threaded executable. Otherwise, the OpenMP directives are ignored. This is a key advantage of OpenMP over other parallel programming methods. It is incremental and relatively non-invasive. OpenMP can parallelize
1 For this reason, Fortran 95 includes a PURE attribute to clearly identify pure functions to the compiler. It should also be noted that the Fortran 90/95 array syntax is implicitly parallel.

Threading Methodology: Principles and Practices
© 2003 Intel Corporation Page 18 of 64
specific loops or regions of the program without large-scale code modifications. The original serial code is left largely intact.
Expressing Concurrency with Thread Libraries Consider two sample codes that can be used to calculate the value of Pi by numerical integration: • Code Sample 1 uses a single OpenMP pragma, leaving the underlying serial code
intact. In this case, the code can still be compiled by a non-OpenMP compiler that would ignore the pragma.
• Code Sample 2 uses explicit threading using the Pthreads* API, which requires significant work to perform code restructuring. It requires adding explicit synchronization in order to guarantee correct results. The code of Code Sample 2 can not be used in environments where Pthreads are not supported.
Code Sample 1: A single OpenMP* pragma is used, leaving the underlying code intact.

Threading Methodology: Principles and Practices
© 2003 Intel Corporation Page 19 of 64
#include <stdio.h>#include <pthreads.h>#define INTERVALS 100000#define THREADS 4
float global_sum = 0.0;pthread_mutex_t global_lock = PTHREAD_MUTEX_INITIALIZER;
void *pi_calc (void *num);
int main (){ pthread_t tid[THREADS]; int i, t_num[THREADS]; for (i = 0; i < THREADS; i++) { t_num[i] = i; pthread_create (&tid[i], NULL, pi_calc, &t_num[i]); }
for (i = 0; i < THREADS; i++) pthread_join (tid[i], NULL);
printf ("Sum = %f\n", global_sum);}
void *pi_calc (void *num){ int i, myid, start, end; float h, x, my_sum = 0.0;
myid = *(int *)num; h = 1.0 / INTERVALS; start = (INTERVALS / THREADS) * myid; end = start + (INTERVALS / THREADS);
for (i = start; i < end; i++) { x = h * ((float)i - 0.5); my_sum += f(x); } pthread_mutex_lock (&global_lock); global_sum += my_sum; pthread_mutex_unlock (&global_lock);}
Code Sample 2: In this example, pi is calculated using POSIX* threads, a more invasive method than the calculation that uses OpenMP*.
The key differences between traditional thread libraries and OpenMP can be summarized as follows: • Thread libraries such as Pthreads* or the Win32* thread API have been around
longer and are more widely used than OpenMP. • Thread libraries are more complex than OpenMP, but also more general. Win32
threads can do anything that OpenMP can do (though not always as easily). OpenMP cannot do everything that thread libraries can do.
• Since thread libraries are not restricted to a fork/join parallel model, they can express multiple levels of concurrency.
• Thread libraries provide mechanisms for inter-process communication and synchronization.

Threading Methodology: Principles and Practices
© 2003 Intel Corporation Page 20 of 64
5. Efficient Threading Practices This chapter describes essential concepts and recommended algorithms for correctly threading an application.
Amdahl’s Law Amdahl's law is a theoretical basis by which the performance of data-parallel situations can be determined. It provides the necessary theoretical background for the performance issues discussed in this section. Use Amdahl’s Law shown in Figure 5 to gauge how sequential operations limit the scalability of a parallel process.
Figure 5: Amdahl’s Law: Break down of total time spent by a process using N processors. An amount of time, P, is spent in parallel, but it comes with an overhead cost.
Since we are looking for the theoretical limit of scalability, assume an infinite number of processors with no parallel overhead. Amdahl’s Law reduces to a simple ratio:
Parallel
Total
TT
yScalabilit =
If only half of a process is able to take advantage of parallelism, the maximum possible scalability is two – assuming an infinite number of processors and perfect efficiency. If only two processors are available, the maximum possible speedup is 1.33, assuming perfect efficiency. If T is the time needed to execute serially, then if only two processors are available, the minimum amount of time needed is T/2 (to execute the half of the code which is not parallel) plus (T/2)/2 to execute the parallel half on two processors, or a total time of 3*T/4. Dividing T by(3*T/4) results in a 4/3 or 1.33 speedup. Use Amdahl’s Law to easily assess the potential benefits of parallel processing. For example, creating multiple threads to process an image should greatly improve performance on multiprocessor systems. However, file I/O operation is inherently sequential. If it takes longer to load and save an image than it does to apply an image filter, creating threads to speed the filter operation may not be worth while. It may however be worth the effort to run the filter on a separate thread from the file I/O. Thus, data decomposition may not make sense, but functional decomposition might.

Threading Methodology: Principles and Practices
© 2003 Intel Corporation Page 21 of 64
Granularity The concept of granularity offers another useful guideline for when and when not to use parallel processing. With Amdahl’s Law, you determine whether the ratio of parallel to serial work is sufficient to merit threads. With granularity, you must decide whether the amount of work per independent task (referred to as grain size) is sufficient to merit threading. Unlike Amdahl’s Law, defined by an objective equation, granularity is more subjective. For example, consider the iterative solutions to differential equations. Each iteration depends on the previous iteration. Therefore, the iterations are strictly sequential but the work within an iteration may contain opportunities for parallelism. Consider that in every iteration, all of the computations are performed in a single function. A flat profile of such programs can be misleading. It indicates that most of the compute-time is spent in this function. The natural conclusion is that this function is a good candidate for threading. However, it is important to determine the approximate time per iteration. It is possible that this number is less than the system overhead required to create and maintain the threads, which degrades performance as the number of threads increases. In this example, the grain-size is too fine to warrant threads. Use the call-graph collector of the VTune™ Performance Analyzer to help you decide whether to thread a function or its caller.
Thread Creation To simplify Amdahl’s Law, parallel overhead was ignored. This is, of course, an unrealistic assumption. Creating a thread under Windows costs roughly the same as 1,000 integer divides. The operating system (OS) must also maintain and schedule threads. Maintaining a thread state requires system resources. Thread scheduling often requires context switching. System overhead limits scalability but good algorithm design can minimize its effects. With OpenMP it is easy to vary the number of threads for each parallel region but it is rarely beneficial to have more ready threads than processors. This simply increases system overhead without providing additional performance. Explicit threading libraries are more general than the OpenMP fork/join model. Any thread can create new threads and destroy others. Threads can pop in and out of existence throughout the life of the program. A threads-on-demand implementation is explicit and straightforward, much like dynamic memory allocation. Resources are requested from the operating system as needed. This is often the most direct route to a threaded application and often provides satisfactory performance. But it can also generate enough system overheads to limit scalability. Considering a database example, it is relatively easy to map every transaction such as adding/deleting records, querying, etc. to a thread and to let the OS handle scheduling. If transaction volume is light, this implementation could provide adequate efficiency. However, large volume could easily swamp the system with too many threads. If transaction volume is heavy, then the number of connections is higher. Instead of creating a thread for each new transaction, you can create a pool of threads at program startup to handle transactions for the life of the program. Each connection is then handled by a thread that has already been created in the thread pool.

Threading Methodology: Principles and Practices
© 2003 Intel Corporation Page 22 of 64
Tip Use re-usable threads or thread pools so the creation and deletion overheads do not add up and degrade the scaling performance of the application.
Implicit and Explicit Synchronization Synchronization is almost always necessary in threaded programs to prevent race conditions in which multiple threads are simultaneously updating the same global variable. Synchronization limits parallel efficiency even more than system overhead because it serializes parts of the program. An often-overlooked operation requiring synchronization is dynamic memory allocation, which must lock the heap to avoid corrupting memory. There are several ways to avoid heap lock contention. It is possible to allocate memory on a thread’s stack instead of the heap using the alloca function or third-party products such as SmartHeap* from MicroQuill*. OpenMP and thread libraries have mechanisms to create thread-local storage. Threads can safely access this storage without synchronization. Use the following declarations to create thread-local storage in different threading models: • In OpenMP use threadprivate • In Win32, use the TlsAlloc() function • In Pthreads, use the pthread_key_create function Concurrent programs are subject to race conditions because threads execute asynchronously. In the absence of explicit synchronization, the operating system schedules threads in whatever order it sees fit. This is fine for naturally parallel applications in which the threads do not interact or share data. However, this situation is the exception rather than the rule.
Code Sample 3: A simple function that is not thread safe.
Most threaded programs require some synchronization to avoid race conditions. Code Sample 3 shows a simple function that is not thread safe. Unless access to the static counter variable is synchronized, data loss can occur as illustrated in the interleaving shown in Table 1.

Threading Methodology: Principles and Practices
© 2003 Intel Corporation Page 23 of 64
Time Thread 0 Thread 1
T0 Enter function
T1 Enter function
T2 Load (counter = 0)
T3 Load (counter = 0)
T4 Increment (counter = 1)
T5 Store (counter = 1)
T6 Increment (counter = 1)
T7 Store (counter = 1)
T8 Return
T9 Return
Table 1: Thread instruction interleaving by time for the function UpdateCounter() in Code Sample 3 showing a data race.
To avoid race conditions, all threading methods provide synchronization constructs. The best way to correct the error in the previous example is with the interlocked functions provided by the Win32 API or the OpenMP atomic pragma. Thread safe versions of the simple function are shown in Code Sample 4.
static int counter = 0;
void updateCounter (){ InterlockedIncrement (&counter);}
static int counter = 0;
void updateCounter (){#pragma omp atomic counter++;}
Code Sample 4: Thread safe versions of the simple function
The Win32 interlocked functions (InterlockedIncrement, InterlockedDecrement, InterlockedExchange, InterlockedExchangeAdd, InterlockedCompareExchange) perform atomic updates on variables without blocking the threads. The same is true for the OpenMP atomic pragma. Simple atomic updates are significantly faster than other synchronization mechanisms. They are not generally applicable, however. When synchronization requires more than an atomic operation, critical sections are the next best option in terms of efficiency. Critical sections enforce mutual exclusion on enclosed regions of code. In other words, only one thread may enter a critical section at a time.

Threading Methodology: Principles and Practices
© 2003 Intel Corporation Page 24 of 64
The functions shown in Code Sample 5 contain data dependences that require synchronization:
static int a, d;CRITICAL_SECTION cs;
void DataDependence (b, c, e){ EnterCriticalSection (&cs); a = b + c; d = a + e; LeaveCriticalSection (&cs);}
static int a, d;
void DataDependence (b, c, e){ #pragma omp critical { a = b + c; d = a + e; }}
Code Sample 5: Simple example of a critical section synchronization construct. The left-hand code assumes that the Critical Section object was initialized before being used.
The critical section protects variables a and d. Without it, multiple threads can update variable a where a = b + c while other threads are reading it (d = a + e), and multiple threads can simultaneously update variable d. The Win32 API also provides mutual exclusion functions that enforce criticality but the similarity ends there:
Code Sample 6: Synchronization using Win32* mutex (left) and an OpenMP* lock (right). The Win32 example assumes that the mutex object has already been created prior to use.
Unlike Win32 critical sections, which are local objects, Win32 mutexes are kernel objects. The zero-contention overhead of acquiring and releasing a mutex is approximately ten times higher than for a critical section. However, Win32 mutexes have advantages over critical sections. Kernel objects are shared among processes so mutexes can synchronize access to process-shared memory. Mutexes also have safety features to prevent deadlock. If a thread exits while holding a Win32 critical section, other threads attempting to enter the critical section will deadlock. This is known as a dangling critical section. Threads attempting to acquire an abandoned mutex return an appropriate error code (WAIT_ABANDONED_0). Mutex variables can also be used in the Win32 WaitForSingleObject and WaitForMultipleObjects functions, which allow timed waits.

Threading Methodology: Principles and Practices
© 2003 Intel Corporation Page 25 of 64
OpenMP contains locking functions but they are more akin to Win32 critical sections than mutexes in Intel’s implementation. They are local rather than kernel objects so they cannot be shared across processes. Also, attempting to acquire an abandoned OpenMP lock deadlocks a thread.

Threading Methodology: Principles and Practices
© 2003 Intel Corporation Page 26 of 64
6. Methodology for Threading Applications
This chapter presents a methodology for threading applications by stepping through the generic development cycle. The goals of each phase in the development cycle are achieved by employing one or more components of the Intel Threading Tools. The methodology explores usage scenarios to help you speed the development of a threaded application.
Designing a Threaded Application The best time to account for threading is at the design phase of application development. All threading-related data restructuring and code restructuring changes that occur with serial applications being threaded can be accommodated in the design phase. This results in a reduced effort in the overall development without the need for any redesign. A majority of threaded applications first come into being as serial applications and are subsequently threaded. In some cases, the serial applications start as prototypes that eventually morph into threaded applications. In such a scenario, no time upfront is spent on designing correctly for threads, most of the threading effort is spent in restructuring and redesigning the serial application. This section discusses some of the key issues to keep in mind while designing a threaded application. A contrived problem that relates to real world applications is used as an example to illustrate the evolution of the design.
Video Editing Example Consider the design of a threaded video editing application. Initial design targets the most computationally intensive aspect of the application and further refinements are made by exploring functional parallelism that exists in the application.
Figure 6 shows a stream of uncompressed video that is read in a stream. Special effects are applied in real time to the video stream. The processed video stream is then stored onto disk. This problem can be particularly performance sensitive if the special
Frame 2Frame 1
Frame 0
. . . . . .
. . . . . .
. . . . . .
. . . . . . Special Effects Frame 2
. . . . . .
. . . . . .
. . . . . .
. . . . . .
Frame 1Frame 0
Figure 6 : Live video editing example
Threading Methodology: Principles and Practices
© 2003 Intel Corporation Page 27 of 64
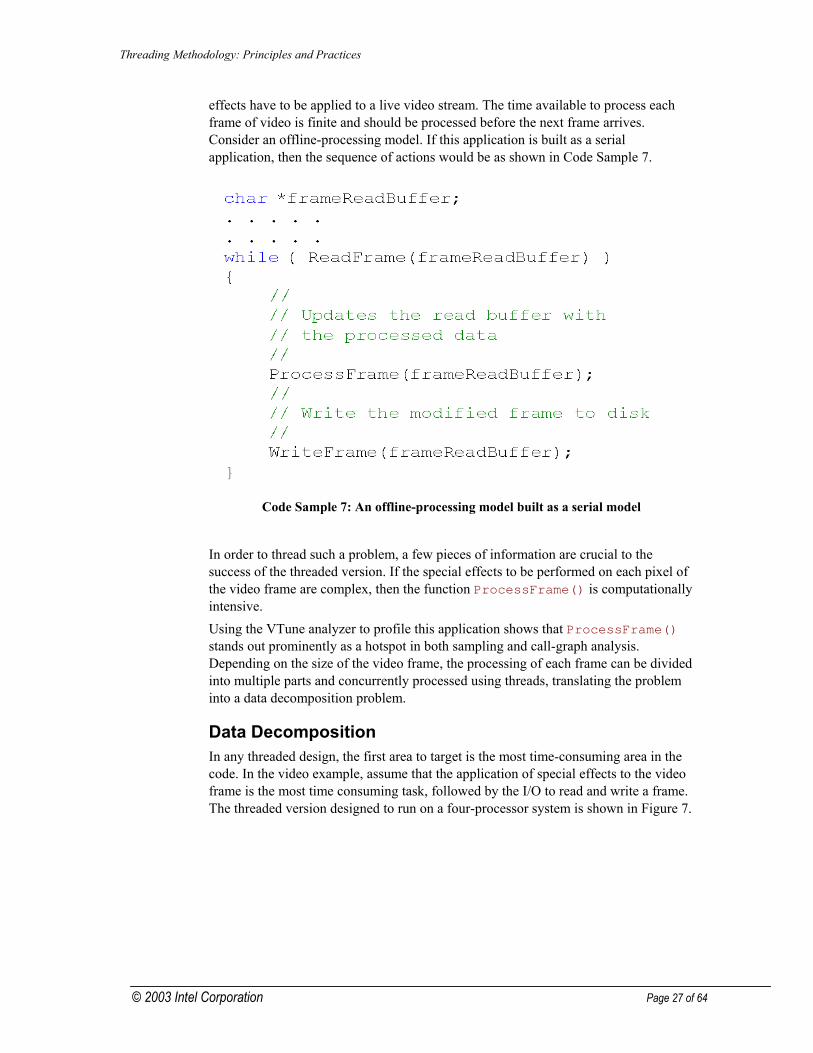
effects have to be applied to a live video stream. The time available to process each frame of video is finite and should be processed before the next frame arrives. Consider an offline-processing model. If this application is built as a serial application, then the sequence of actions would be as shown in Code Sample 7.
Code Sample 7: An offline-processing model built as a serial model
In order to thread such a problem, a few pieces of information are crucial to the success of the threaded version. If the special effects to be performed on each pixel of the video frame are complex, then the function ProcessFrame() is computationally intensive. Using the VTune analyzer to profile this application shows that ProcessFrame() stands out prominently as a hotspot in both sampling and call-graph analysis. Depending on the size of the video frame, the processing of each frame can be divided into multiple parts and concurrently processed using threads, translating the problem into a data decomposition problem.
Data Decomposition In any threaded design, the first area to target is the most time-consuming area in the code. In the video example, assume that the application of special effects to the video frame is the most time consuming task, followed by the I/O to read and write a frame. The threaded version designed to run on a four-processor system is shown in Figure 7.

Threading Methodology: Principles and Practices
© 2003 Intel Corporation Page 28 of 64
Figure 7: Threaded version that implements data parallelism.
In ProcessFrame(), shown in Code Sample 8 the main thread acts as a master thread and divides the current video frame into four parts in the setup phase as illustrated in Figure 7 (a). Once the data has been set up, the master thread wakes up the three worker threads and all four threads, including the master, operate on their unique section of the video frame. Once the threads are done processing their share of the data, they wait at a barrier for all threads to complete their sections of the frame. The master then suspends all of the worker threads and writes the processed frame to disk before reading the next available frame from the stream. The pseudo-code for the threaded version of ProcessFrame() is shown in Code Sample 8. When the master thread returns from ProcessFrame(), it has successfully completed the processing of the video frame and continues by writing the frame to disk. The caller function still remains the same as shown in Code Sample 8.

Threading Methodology: Principles and Practices
© 2003 Intel Corporation Page 29 of 64
struct { int startx, endx; int starty, endy; char *data; }ThreadData;
ProcessFrame(char *data) { ThreadData perThreadData[nThreads]; // // The master sets the limits for // the region each thread has to // process // DecomposeData(data, perThreadData, nThreads); // // Wakes the worker threads with // information about their data // Each worker thread will also // execute ProcessSection() // for(int i=1; i < nThreads; ++i) WakeWorkerThread(i, perThreadData[i]); // // Master does its share of the work // ProcessSection(perThreadData[0]); // // Master waits for all the threads // to complete processing. Each worker // thread goes to sleep after calling // ProcessSection() // WaitForAllThreads(); }
Code Sample 8: Threaded ProcessFrame() function
Assuming that there are no serious performance issues, you can estimate the performance of the threaded version. Assume that the special effects processing accounts for 80% of the time and the I/0 the remaining 20% of the time with the frame read accounting for one half the I/O time and the processed frame write the other half. Assuming perfect scaling for the threaded portion of the run, then the expected scaling performance of this type of application can never be higher than five using infinite processors as per Amdahl’s Law. Using four threads, the scaling performance can never be greater than 2.5 as the serial portion, fully contributed to by the I/O, still accounts for 20% of the serial run and the parallel portion 80%/4, i.e., 20% as shown in Figure 8. This is the upper limit for the scaling performance when four threads are used. In reality, due to system overheads introduced by threading the application, the observed performance can be expected to be lower than 2.5.

Threading Methodology: Principles and Practices
© 2003 Intel Corporation Page 30 of 64
Figure 8: The elements are executed in a loop. The I\O thread must complete the write of S1 before doing the following read into R1.
In this case, the serial portion of the application has to be reduced in order to obtain better scaling.
Figure 9: Cache line for video data streams
Data decomposition problems can be particularly sensitive to false sharing, as illustrated in Figure 9. False sharing occurs when two threads access different data elements in the same cache line for reads and writes when run on systems with multiple-processors or systems with Hyper-Threading technology. This example decomposition is only shown to illustrate how false sharing could easily be introduced in the application and not as a recommended approach for data decomposition. In order to maintain cache coherency, the cache line is invalidated when one of the threads writes to this cache line. This conflict impacts the second thread that is accessing elements from this cache line for read only, but has to fetch the cache line

Threading Methodology: Principles and Practices
© 2003 Intel Corporation Page 31 of 64
again from memory. Depending upon the pattern of usage, this particular problem could seriously degrade the performance of an application. Consider the setup phase in Figure 7 (a) and examine the Video data 0 and Video data 1. If the last element of row 1 in Video data 0 and the first element in the first row of Video data 1 belong to the same cache line, then a false sharing performance penalty occurs when these pixels are processed for write. False sharing can be avoided by carefully dividing the work among the threads to cache line boundaries.
Functional Decomposition Better scaling is achieved if additional read and write buffers are present in addition to an I/O thread in the thread pool. By overlapping the I/O with actual work, the execution time can be considerably reduced. Figure 10 illustrates the new design in the form of a flowchart. Here, most of the required I/O is overlapped with the computation. This redesign achieves functional decomposition of the I/O task. However, in the new implementation, three extra buffers must be created. This algorithm improves the performance of the previously threaded version of the application.
R0 R1 S0 S1
M
W2W1W0
I/O
Read first frame into R0
Divide data
M
W2W1W0
Barrier
I/O
Read nextframe into
R1
Write S1
I/O
Rotate BuffersR1->R0; S0->S1
Write to S0
Figure 10: Functional and data decomposition of the video editing example.

Threading Methodology: Principles and Practices
© 2003 Intel Corporation Page 32 of 64
In Figure 10, the master thread’s control flow is depicted by thick lines. A pool of threads is created (number of processors + 1) at start up and one of the threads is designated as an I/O thread and another as the master thread. All of the remaining threads are worker threads. Initially, when the application is invoked, the master thread reads in the very first frame into buffer R0. It divides the data taking false sharing into account and wakes up the I/O thread to read the next frame into the read buffer R1. While the I/O is being done, the master thread wakes up all the worker threads and points them to their share of the work. The worker threads write their part of the processing into the S0 write buffer. When all threads are done, they wait at the barrier (including the I/O thread). Once the processing of the current frame is complete, the master thread rotates the buffers by renaming R1 as R0 and R0 as R1 and the write buffers S0 as S1 and S1 as S0 and suspends all of the worker threads. Now, the next frame that has been read in by the I/O thread resides in R0 buffer and the frame that was just processed is in S1. The master thread then requests the I/O thread to write out the currently processed frame in S1 to disk and commences processing the next frame in R0 by dividing up the work. When the I/O thread is done writing, it starts reading the next frame into R1. The algorithm presented here is simplified, but for it to actually work, synchronization constructs have to be used around the buffers to prevent rotating of the buffers before they have been read into. With this approach, the apparent time spent doing I/O can be reduced to a fraction of the previous threaded version as it is done asynchronously. By assuming that the I/O can be reduced to about 5% of the time it took in the serial version of the application, the expected scaling performance from the newer algorithm is four using four worker threads on a four-processor system as shown in Figure 10. As earlier, it is assumed that perfect scaling is obtained in the special effects processing section. By accommodating both task parallelism and data parallelism, we were able to improve the scaling performance from ~2.5 to four on a four -processor system. It is crucial that all aspects are taken into account while designing a threaded application. If a person not familiar with the application were to thread the serial version of this application, they may have ended with the first threaded version of the application. However, if you are also a threading novice, some of the performance issues discussed in the section on efficient threading practices could kill the performance of any threaded application. It is therefore very important to keep in mind the potential pitfalls while designing an application and exploring both functional and data parallelism.
Performance Upper Bound Once you have a threaded version of an application, you also need to determine the upper limit for scaling in order to understand how close you are to the theoretical optimal performance. An application written to automatically spawn threads based on the number of processors present in the system may not scale very well in some situations with increased number of threads due to very little parallel work or other limiting factors. In our second version of the threaded application, the profile of the application had 5% in serial regions and 20% in parallel regions. However, we know that the background thread that does I/O takes ~10% for the read and another 10% for the write. The

Threading Methodology: Principles and Practices
© 2003 Intel Corporation Page 33 of 64
dissimilar threads (I/O and the special effects) in this scenario take identical amounts of time to process their tasks. However, by increasing the number of threads for special effects work will have a detrimental effect on the overall scaling performance as the special effects processing will require less time than the time taken to perform the read and the write in the background. Due to synchronization constructs, the worker threads and the master must wait for the I/O to be completed. If they all took approximately the same amount of time, a CRITICAL_SECTION object that implements spin-wait should be used for synchronization to avoid additional system overhead. Using spin-wait primitives for synchronization in such scenarios where the threads become unbalanced may be detrimental on systems with Hyper-Threading technology. Spin waits use up CPU resources and do not perform any useful work, thereby affecting other threads that may be running on the same physical processor. The current example shows an optimal solution with four threads and any additional threads will create a thread imbalance between the special effects and the I/O threads. When this information has been determined, the application can dynamically increase the number of threads when more processors are available, but stop once the scaling performance upper bound has been reached. The next section presents a methodology for threading existing serial applications and applying some of the principles discussed here.
Serial Application to Threaded Application The methodology described here for threading uses a generic development cycle to step through the various stages of development. Knowledge of Intel’s tools and how to effectively use them in a development cycle can be applied appropriately for the design and development of any threaded application. We have already discussed the various phases of the generic development cycle. In this section, we will examine each phase in detail and which tools aid in accomplishing the objective of the phase.
Analysis The goal of the analysis phase is to prepare a baseline measurement of the performance of the serial application and determine the regions of potential parallelism in the application. To measure the performance of a serial application, use a representative workload (or workloads) that exercises most of the code paths being analyzed. The workloads that are selected should be as small as possible to keep the memory footprint and the application runtime low. The primary tool that is used in this phase is the VTune Performance Analyzer. Figure 11 shows the analysis stage captured as a flowchart. Once a workload or workloads have been selected, the application is run on the workload as sampling and call graph statistics are collected using the VTune analyzer. The critical paths in the call graph are analyzed and the most time consuming path is selected. The selected path is then examined by looking at the call sequence and the most appropriate functions (node) for parallelism is identified.

Threading Methodology: Principles and Practices
© 2003 Intel Corporation Page 34 of 64
Figure 11: Analysis phase
Call graph analysis is recommended because sampling information may not be suitable for all types of applications. Sampling data sometimes have flat profiles and picking the right level may not be possible or the hotspots may point to the functions that results in the most number of calls, but may not be at the right level in the code path for threading. To get the right perspective, call graph data has to be used even though it perturbs the execution time due to instrumentation. Once you have identified the regions of code in your application most suitable for parallelization, you need to determine the type of parallelism to implement. Most of the important decisions that you need to make are made in this phase.
Design The design phase is where the type of parallelism being implemented is examined and necessary changes made to the design to accommodate a threading model. If the parallelism being implemented can be accomplished by threaded library functions already included in Intel MKL or the Intel IPP, then you can eliminate some of the steps involved in the design process. A majority of the effort in the design phase involves the restructuring of data and code to make it optimal for performance. In order to restructure data or code, all the global data accesses by threads have to be identified first. Without any tools, it can be a very tedious effort, especially for medium- and large-scale applications, as you must go through the call sequence of the thread and examine every memory access for a global memory access. Use the Intel threading tools to simplify the task of restructuring data for optimal threaded performance.

Threading Methodology: Principles and Practices
© 2003 Intel Corporation Page 35 of 64
Figure 12: Flowchart of the initial design methodology
The general methodology for the design phase is shown in Figure 12, and can be summarized as follows: 1. If you are already an expert in threading applications, do a brief analysis to
determine the sections of your application that are suitable for threading. If you are not an expert in threading applications, you will need to spend a considerable amount of time to understand the application and identify regions in your code that are good candidates for parallelization.
2. Inspect the code and try to determine if any of performance library functions can be used in your application. For example, if the application being developed has to solve a linear system of equations in the end, it may be beneficial to use calls from the Intel MKL that are threaded with OpenMP to immediately get the benefits of threading. However, additional work has to be done to determine the memory conflicts and design for data restructuring, if required.
3. If Intel MKL/Intel IPP functions cannot be used, do the following: a. Choose a type of decomposition. b. Use the Thread Checker and OpenMP to locate memory conflicts. See the
Thread Checker documentation for more details. c. Restructure your data according to specific performance issues, as described
in the Data Restructuring section.
Decomposition Types This section describes decomposition type issues in more detail. The decomposition type determines the type of data restructuring, if required. Functional Decomposition To identify memory conflicts for a functional decomposition problem, use OpenMP in conjunction with Intel compilers and the Thread Checker to quickly identify all of the memory conflicts in the identified code path. This section discusses shortcuts that help you catch all the global memory accesses as quickly as possible. To prepare the code path you want to thread, do the following:

Threading Methodology: Principles and Practices
© 2003 Intel Corporation Page 36 of 64
• Encompass the code path in a function • Use OpenMP pragmas around the created function, as shown in Code Sample 9.
Code Sample 9: OpenMP is used in this example to detect memory conflicts.
By surrounding the function to be threaded with #pragma omp sections, the OpenMP runtime library creates the default number of threads for the system and executes the function call FunctionThread()twice in parallel. Use the Thread Checker on this sample, to identify the memory conflicts that arise with multiple threads accessing global data. These errors can then be examined carefully for any data restructuring that may be required. The task that could take anywhere between a few hours to days can now be accomplished in a matter of minutes with the use of Intel Threading Tools. Use OpenMP pragmas to identifying the memory conflicts only. During the implementation phase, remove these pragmas and replace them by the appropriate threading calls of your choice.
Data Decomposition OpenMP is an ideal candidate for data parallel problems. Use it for both design and implementation to solve data decomposition problems. You can add OpenMP incrementally to an existing application, usually without significant recoding. With OpenMP, your original serial code is left largely intact and maintainable.

Threading Methodology: Principles and Practices
© 2003 Intel Corporation Page 37 of 64
Figure 13: A flowchart for data parallelism design
OpenMP compilers are available for most operating systems. Non-OpenMP compilers simply ignore these pragmas and compile the original serial code. The usage model for data decomposition problems is shown in Figure 13. Use an iterative approach to remove memory conflicts with help from the Thread Checker until no conflicts are found. The use of shared or private clause is shown here to highlight the usage model and not imply these are the only clauses that can or should be used for data decomposition problems.
Data Restructuring The main purpose of data restructuring is to avoid the problems of excessive synchronization and false sharing. This section describes these problems in detail and proposes solutions for dealing with them.
Excessive synchronization This section discusses the problem of excessive synchronization and suggests a way to overcome this problem with data restructuring. If global data accesses are found throughout the profile of a thread, each of these global data accesses must be protected by synchronization constructs. This could lead to the accumulation of system overhead due to excessive synchronization that could result in degraded performance.

Threading Methodology: Principles and Practices
© 2003 Intel Corporation Page 38 of 64
Figure 14: This bar illustrates the time spent by a thread. The green sections indicate time spent on parallel work. Red sections indicate time spent accessing global data, that is, on synchronization. While some overhead is expected, excessive synchronization degrades performance.
Figure 14 shows a profile of a thread with many global data accesses in red and all the parallel work in green. All shared global data access must be protected by synchronization constructs to prevent data races from occurring in the application. As shown in the figure, many global data accesses that occur close to each other can be merged into one larger synchronization point, thereby eliminating many synchronization points. If there are two global data accesses, and if the data that is accessed second is not updated between the two accesses, then the second access can be made immediately after the first. By protecting these two data accesses with synchronization, two synchronization points can be reduced to one. Also, large critical sections that occur in the code may be potential candidates for a local copy of shared data for each thread if the data dependencies allow for such an optimization. By merging global data access that occur close to each other and by making local copies of global data, you can significantly improve the scaling performance of your threaded applications. Also, those global data accesses that occur as a read-only operation do not require synchronization constructs. By observing these simple rules of data restructuring, your application can benefit with significant scaling performance boost.
False Sharing Another issue avoided by data restructuring is the problem of false sharing. Two threads can use unique data elements on the same cache line for read and write. When

Threading Methodology: Principles and Practices
© 2003 Intel Corporation Page 39 of 64
one of the threads writes to this cache line, the same cache line referenced by the other thread is invalidated. Any new references to data in this cache line by the second thread result in a cache miss and the cache line will have to be loaded again from memory. This is known as false sharing and if this type of activity is inadvertently introduced into the application, it could lead to severe performance degradation. The problem of false sharing usually manifests itself when applications use global state arrays to maintain information about each thread, as is illustrated in this section with a short code example as shown in Code Sample 10. It is best to address the problem of false sharing during the design phase. However, this problem can easily be identified during the tuning stage using the VTune Performance Analyzer. When thread functions are implemented as shown in Code Sample 10, the global variable sumLocal causes false sharing as both threads write to this array and their distinct elements lie on the same cache line. Each time thread_1 writes to its element in the cache line, the cache copy of the same line for thread_2 is invalidated. The variable thread_2 now has to reload the cache line containing the variable into cache before it can write its element into the array, which in turn invalidates the copy owned by thread 1.
Code Sample 10: An example of false sharing
This example is a particularly extreme case of false sharing resulting in severe performance degradation. In order to overcome this problem, padding can be added around the data of each thread to ensure that elements accessed by different threads all lay on separate cache lines. The other solution is to use a local copy from stack for all updates and then perform a global update that reflects these updates to the global entity.
Implementation Once all design considerations have been addressed, the application can be threaded by implementing the identified parallelism with the chosen threading model. The recommended threading model depends on the type of decomposition: • For data decomposition problems, OpenMP is recommended.
Threading Methodology: Principles and Practices
© 2003 Intel Corporation Page 40 of 64
• For functional decomposition, explicit threading is recommended since there is limited support from OpenMP.
Functional Decomposition
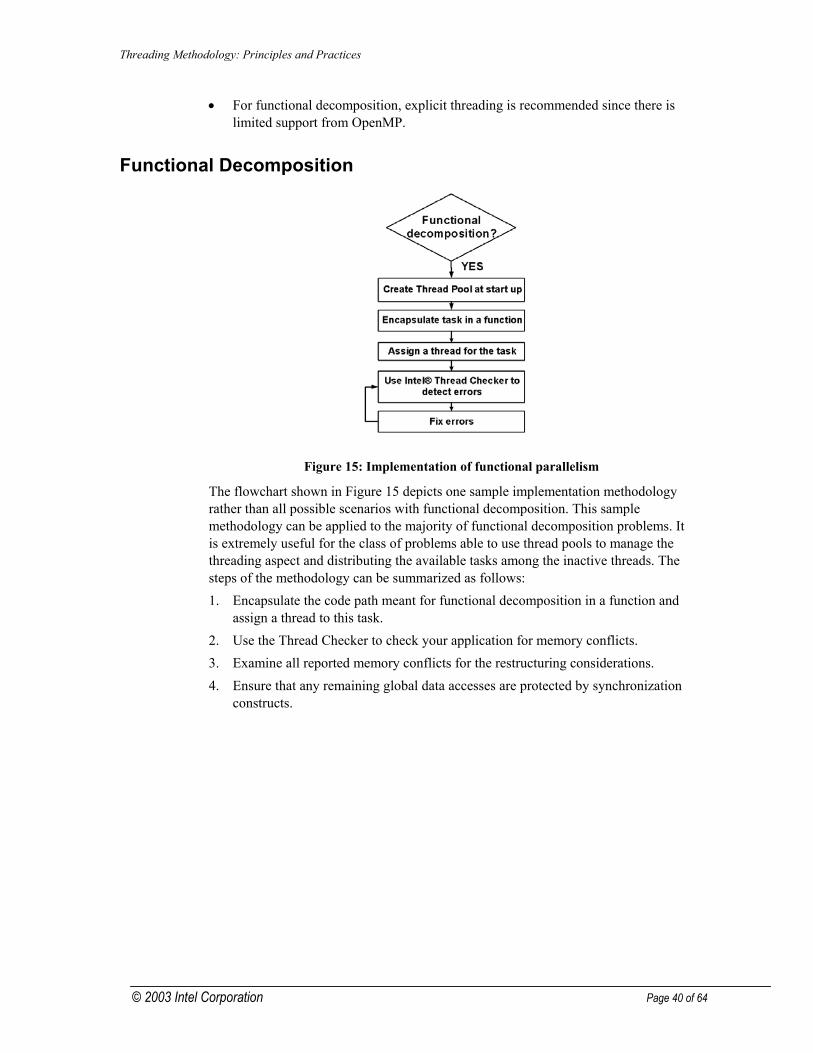
Figure 15: Implementation of functional parallelism
The flowchart shown in Figure 15 depicts one sample implementation methodology rather than all possible scenarios with functional decomposition. This sample methodology can be applied to the majority of functional decomposition problems. It is extremely useful for the class of problems able to use thread pools to manage the threading aspect and distributing the available tasks among the inactive threads. The steps of the methodology can be summarized as follows: 1. Encapsulate the code path meant for functional decomposition in a function and
assign a thread to this task. 2. Use the Thread Checker to check your application for memory conflicts. 3. Examine all reported memory conflicts for the restructuring considerations. 4. Ensure that any remaining global data accesses are protected by synchronization
constructs.

Threading Methodology: Principles and Practices
© 2003 Intel Corporation Page 41 of 64
Data Decomposition
Figure 16: Flowchart depicting data decomposition methodology
The data decomposition methodology relies heavily on OpenMP for implementation. OpenMP can be used to express data parallelism quite effectively. Once the implementation of the application has commenced, different sections of the application can be easily threaded incrementally with the use of OpenMP. The following section takes a sample application and steps through this process of implementing with OpenMP. Consider the example of computing the value of pi. The serial code is shown in Code Sample 11.
Code Sample 11: Calculation of pi
Computation of pi is an example of numerical integration and the accuracy of the computed value increases with the number of iterations. This example is an extremely
Threading Methodology: Principles and Practices
© 2003 Intel Corporation Page 42 of 64
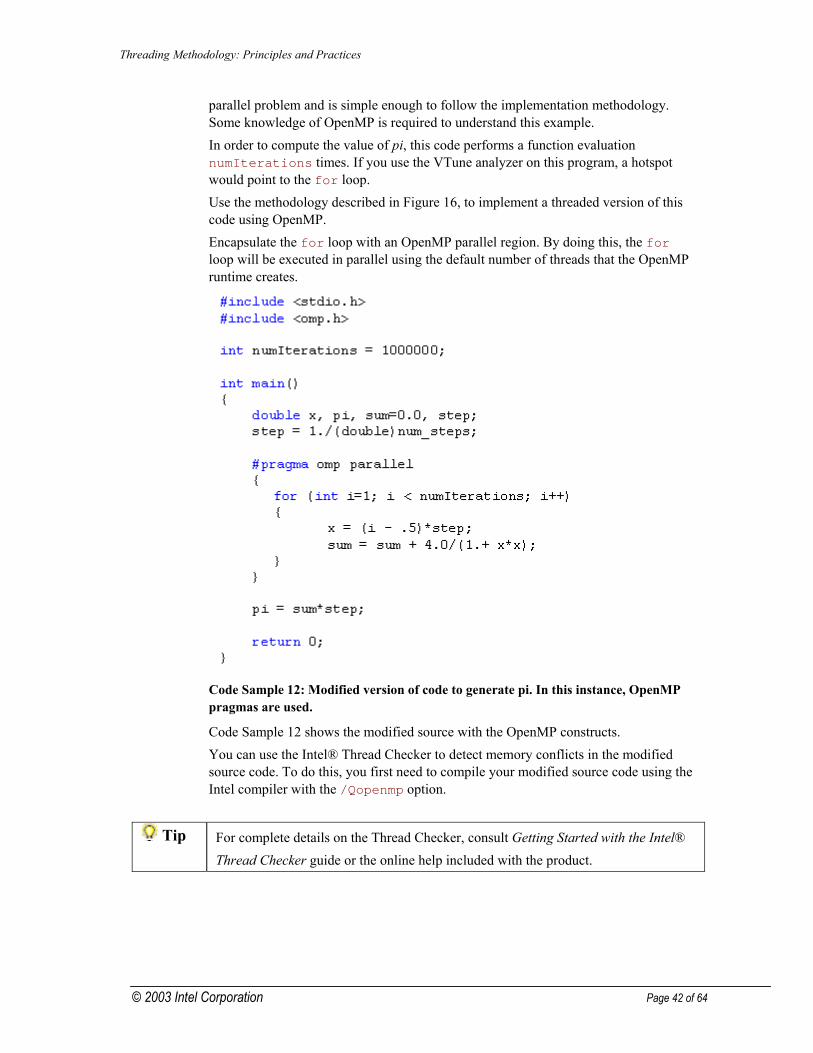
parallel problem and is simple enough to follow the implementation methodology. Some knowledge of OpenMP is required to understand this example. In order to compute the value of pi, this code performs a function evaluation numIterations times. If you use the VTune analyzer on this program, a hotspot would point to the for loop. Use the methodology described in Figure 16, to implement a threaded version of this code using OpenMP. Encapsulate the for loop with an OpenMP parallel region. By doing this, the for loop will be executed in parallel using the default number of threads that the OpenMP runtime creates.
Code Sample 12: Modified version of code to generate pi. In this instance, OpenMP pragmas are used.
Code Sample 12 shows the modified source with the OpenMP constructs. You can use the Intel® Thread Checker to detect memory conflicts in the modified source code. To do this, you first need to compile your modified source code using the Intel compiler with the /Qopenmp option.
Tip For complete details on the Thread Checker, consult Getting Started with the Intel® Thread Checker guide or the online help included with the product.
Threading Methodology: Principles and Practices
© 2003 Intel Corporation Page 43 of 64
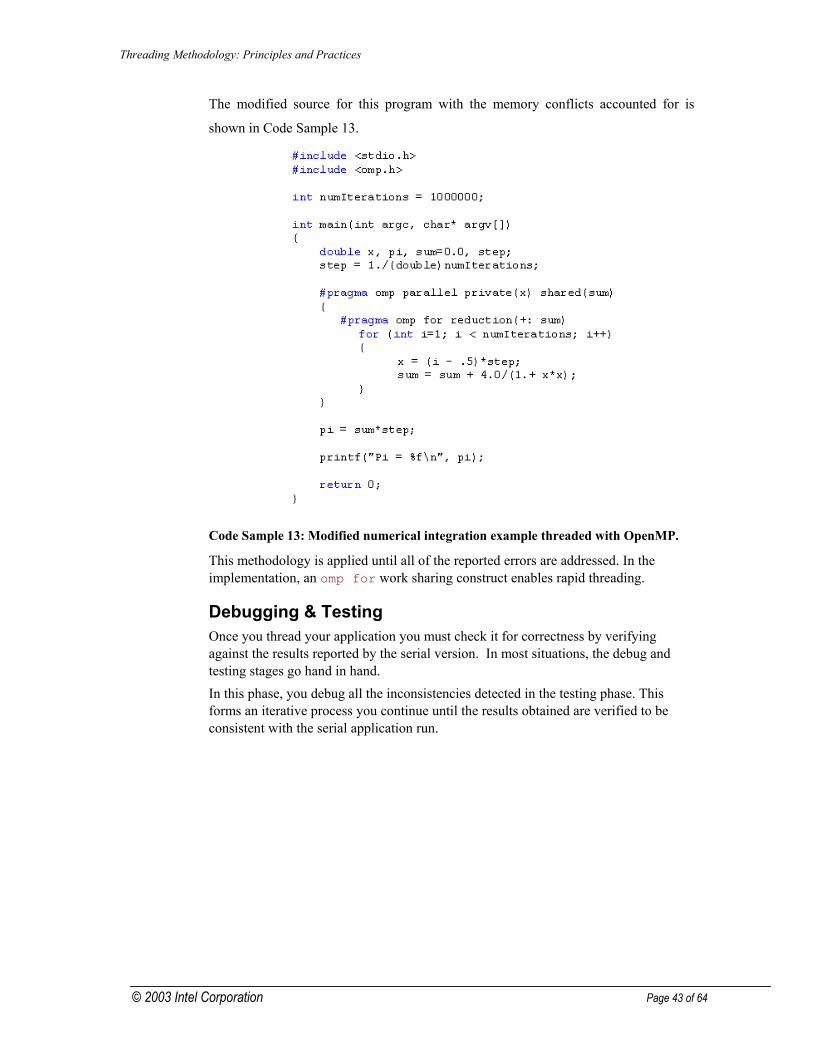
The modified source for this program with the memory conflicts accounted for is
shown in Code Sample 13.
Code Sample 13: Modified numerical integration example threaded with OpenMP.
This methodology is applied until all of the reported errors are addressed. In the implementation, an omp for work sharing construct enables rapid threading.
Debugging & Testing Once you thread your application you must check it for correctness by verifying against the results reported by the serial version. In most situations, the debug and testing stages go hand in hand. In this phase, you debug all the inconsistencies detected in the testing phase. This forms an iterative process you continue until the results obtained are verified to be consistent with the serial application run.

Threading Methodology: Principles and Practices
© 2003 Intel Corporation Page 44 of 64
Debugging Large Applications
Figure 17: Debug methodology
Figure 17 shows the proposed methodology to follow while debugging a large application. A release build with debug symbols has a shorter run time and the additional benefit of not having to compile the application with source instrumentation. Using a release build is particularly useful for applications that take many hours to build. Once the memory conflicts have been identified, the methodology proposes source instrumentation of only the affected modules that are reported by Intel Thread Checker to contain errors. Using the /Qtcheck option, source instrumentation enables the extraction of information about the variables that cause these conflicts. This drill down methodology saves considerable time in the debug process. Figure 18 shows a sample screen shot of Thread Checker that shows memory conflicts occurring in an application. Double-clicking each error gives you the ability to identify the source lines that caused the error.
Figure 18: Sample display of a race condition error found by the Intel® Thread Checker.
The errors indicate the two variables x and sum. These variables are global to the threads and cause conflicts when the parallel version is run. The variable is declared as
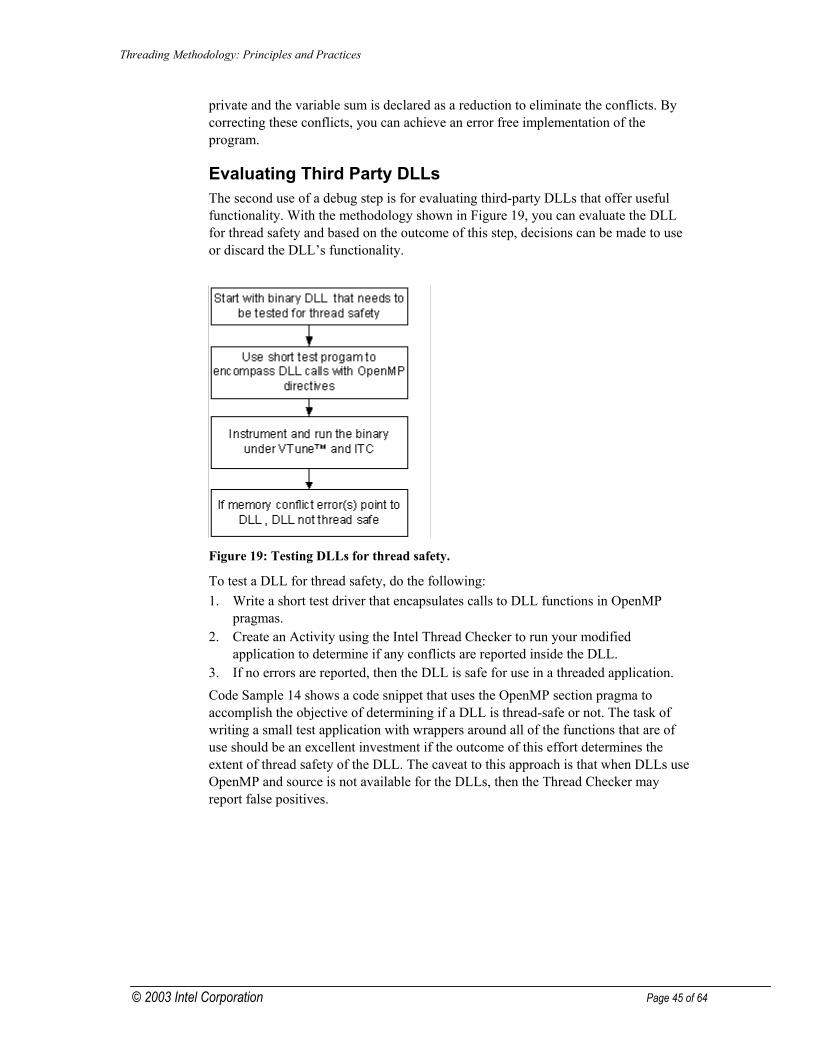
Threading Methodology: Principles and Practices
© 2003 Intel Corporation Page 45 of 64
private and the variable sum is declared as a reduction to eliminate the conflicts. By correcting these conflicts, you can achieve an error free implementation of the program.
Evaluating Third Party DLLs The second use of a debug step is for evaluating third-party DLLs that offer useful functionality. With the methodology shown in Figure 19, you can evaluate the DLL for thread safety and based on the outcome of this step, decisions can be made to use or discard the DLL’s functionality.
Figure 19: Testing DLLs for thread safety.
To test a DLL for thread safety, do the following: 1. Write a short test driver that encapsulates calls to DLL functions in OpenMP
pragmas. 2. Create an Activity using the Intel Thread Checker to run your modified
application to determine if any conflicts are reported inside the DLL. 3. If no errors are reported, then the DLL is safe for use in a threaded application. Code Sample 14 shows a code snippet that uses the OpenMP section pragma to accomplish the objective of determining if a DLL is thread-safe or not. The task of writing a small test application with wrappers around all of the functions that are of use should be an excellent investment if the outcome of this effort determines the extent of thread safety of the DLL. The caveat to this approach is that when DLLs use OpenMP and source is not available for the DLLs, then the Thread Checker may report false positives.

Threading Methodology: Principles and Practices
© 2003 Intel Corporation Page 46 of 64
Buffer data[2];. . . . . . .#pragma omp parallel sections{
#pragma omp section DllFunc( &data[0] );
#pragma omp section DllFunc( &data[1] );}
Code Sample 14: Use of OpenMP SECTIONS to determine DLL thread safety
Testing an application involves verifying the correctness of the result of the threaded application with that of the serial run. If no errors are reported by the Thread Checker at this stage, you can safely assume that most of the runtime race conditions have been identified and fixed. If the threaded run’s results match that of the serial run, then the application is consistent.
Tuning for Performance Once your threaded application is correct and bug-free, you can focus on tuning your application for optimal performance. By this stage in the development process, most of the time consuming optimizations have been addressed in the data restructuring section. This section attempts to apply the heuristics or rules outlined in Efficient Threading Practices to prepare the threaded application for optimal performance. Use the following tools to identify potential performance problems: • Thread profiler • VTune™ Performance Analyzer The following sections examine the methodology to be used with both tools.
Using OpenMP Thread Profiler Use the thread profiler within the VTune analyzer to analyze OpenMP applications for performance. In order to view performance statistics collected for an OpenMP application, build your application with the /Qopenmp_profile option to link in the instrumented runtime libraries. Alternatively, you can build your application with the /Qopenmp option, but run your application from within the VTune environment for runtime replacement of the OpenMP library with the instrumented version. If you build your application with the /Qopenmp_profile, it can be run from the command line. Upon completion a .gvs file is generated that can be viewed from within the VTune environment. Thread profiler enables you to view data from multiple runs and to compare them at the same time. It supports many views that show a performance summary of the application or thread-specific breakdown.

Threading Methodology: Principles and Practices
© 2003 Intel Corporation Page 47 of 64
Since OpenMP is structured, the application can also be viewed by region, for example, parallel, serial, etc. Figure 20 (a) shows a sample screen shots of Activity results in the thread profiler’s Summary view for an application with thread imbalance. Figure 20 (b) shows results for the corrected application.
a)
1 Thread1 Thread1 Thread1 Thread
2 Threads2 Threads2 Threads2 Threads
4 Threads4 Threads4 Threads4 Threads
b)
1 Thread1 Thread1 Thread1 Thread
2 Threads2 Threads2 Threads2 Threads
4 Threads4 Threads4 Threads4 Threads
Figure 20: (a) Screenshot of Thread profiler showing load imbalance (b) Corrected example without the imbalance.
In this example, the scaling obtained by the imbalanced case in Figure 20 (a) for two and four threads respectively are ~1.4X and ~2.1X, respectively. The Summary view displays color-coded time categories including: sequential, sequential overhead, synchronized, locks, barriers, imbalance, parallel overheads, and parallel. The manual Developing Multithreaded Applications: A Platform Consistent Approach, available on the Threading Tools website, provides specific advice for avoiding threading pitfalls such as load imbalance.

Threading Methodology: Principles and Practices
© 2003 Intel Corporation Page 48 of 64
High load imbalance?
Done
STATIC scheduling?
PARALLELSECTIONS?
Use DYNAMICor GUIDED
ReplaceSECTIONS
with loop-levelparallelism
.
.
YesYes
Yes
No
No
Figure 21: Sample flowchart of advice for dealing with load imbalance. Useful advice related to avoiding threading pitfalls is available in the manual Developing Multithreaded Applications: A Platform Consistent Approach.
By applying the advice for load imbalance in the manual, the problem with imbalance shown in Figure 20 (a) showed dramatic improvement in performance. Figure 20 (b) shows the same application’s performance after applying the advice given for the problem encountered. The scaling obtained after the fix, for two and four threads were ~1.8X and ~2.9X, respectively. Figure 21 shows a typical flowchart for dealing with load imbalance.
Using Win32 Thread Profiler This section presents information on the type of information that is presented by Thread Profiler for Windows API and how it will help you identify and locate bottlenecks that are limiting the parallel performance of your multi-threaded application. Thread Profiler instruments the application inserting calls to statistics gathering functions in the Thread Profiler library. Thread Profiler performs program execution flow and critical path analysis to determine whether any threading delay in a multithreaded application will affect the overall execution time. The critical path is the longest execution flow in the application. For more detail about the critical path and critical path analysis, please refer to the online documentation for Thread Profiler. For your application to be able to be instrumented under VTune, it has to be linked with the /fixed:no option. Upon successfully instrumenting and running your application within VTune using Thread Profiler, you should see Activity results in the Thread Profiler viewer. You are now ready to identify and locate bottlenecks that are limiting the parallel performance of your application Figure 22 shows a sample screen shot of Thread Profiler’s Critical Path view for an application with a main thread and 4 worker threads. This particular profile shows some serial impact time (orange), where only one thread is executing while preventing other threads from running as it holds a resource other threads need, some parallel impact time (green) and certain amount of overhead (yellow).
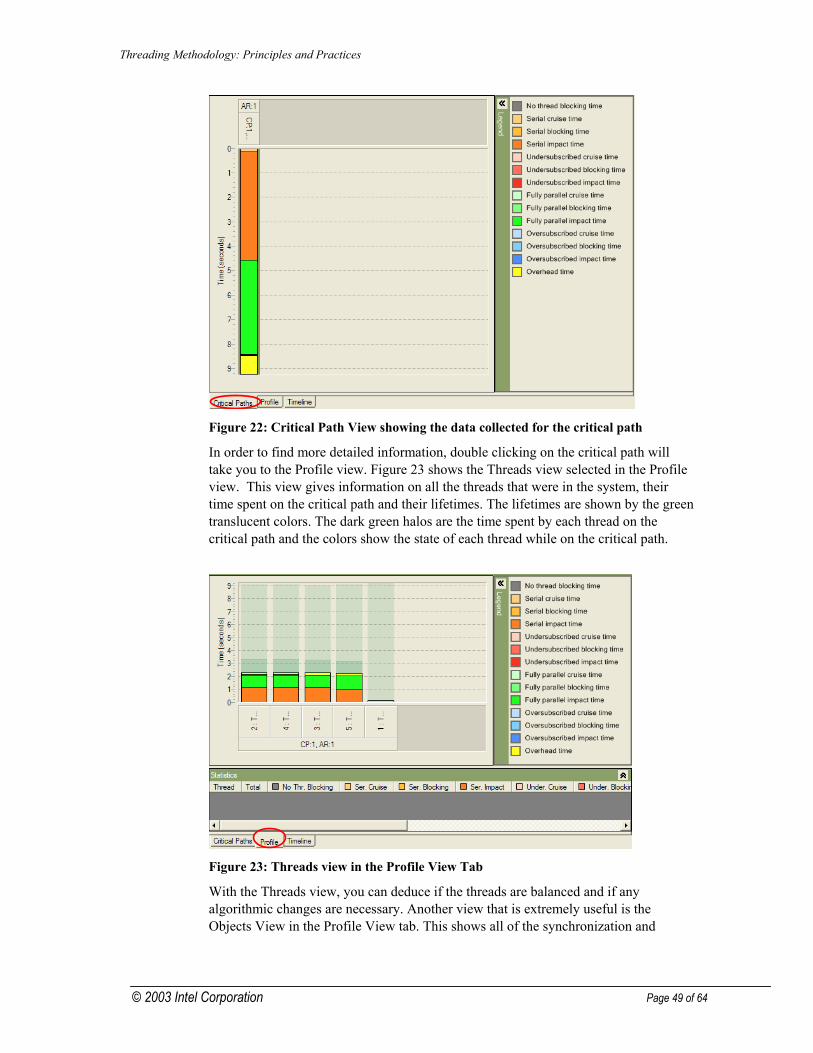
Threading Methodology: Principles and Practices
© 2003 Intel Corporation Page 49 of 64
Figure 22: Critical Path View showing the data collected for the critical path
In order to find more detailed information, double clicking on the critical path will take you to the Profile view. Figure 23 shows the Threads view selected in the Profile view. This view gives information on all the threads that were in the system, their time spent on the critical path and their lifetimes. The lifetimes are shown by the green translucent colors. The dark green halos are the time spent by each thread on the critical path and the colors show the state of each thread while on the critical path.
Figure 23: Threads view in the Profile View Tab
With the Threads view, you can deduce if the threads are balanced and if any algorithmic changes are necessary. Another view that is extremely useful is the Objects View in the Profile View tab. This shows all of the synchronization and

Threading Methodology: Principles and Practices
© 2003 Intel Corporation Page 50 of 64
threading objects used by the application and the impact of any of these objects on the execution time. A sample screenshot of the Objects View is shown in Figure 24.
Figure 24: Objects view in the Profile view tab showing all of the objects used by the application
In this sample application, there are two major objects in use that affect the execution time. A critical section object that has the most impact time and a Fork-Join object ( WaitForMultipleObjects) that has minimal impact time. You can now group objects with threads to determine which of the threads in the application are impacted by these synchronization objects. This view grouping Objects with Threads is shown in Figure 25.
Figure 25: Grouping View using Objects for first level grouping and Threads for second level grouping. This view shows which threads were impacted by which synchronization object

Threading Methodology: Principles and Practices
© 2003 Intel Corporation Page 51 of 64
It is clear from Figure 25 that the Critical section object 11 impacts the execution of threads 2, 3, 4 and 5. It is possible to view the source line for this instance by right clicking on the screen and accessing the pop-up menu. In addition to viewing performance bottlenecks, Thread Profiler also gives a high level view of thread activity in the application. This requires certain advanced features, namely Thread activity and Transitions to be turned on. However, by enabling these advanced features, the application can slow down due to the overhead encountered to collect this information. Figure 26 shows a sample screen shot of such a view.
Figure 26: Timeline view showing Thread activity and critical path transitions
The timeline view shown in Figure 26 clearly shows when threads are blocked (light green) and when they are active (dark green). Hovering the mouse over the “yellow” lines gives you information on the synchronization objects that cause a thread to run and other threads to block. This shows the power of the tool and how it helps analyze explicitly threaded applications using Win32 API.
Using the VTune™ Performance Analyzer The VTune Analyzer is a very powerful tool that analyzes your application using a combination of technologies. You can use sampling to collect runtime information about your system based on special-purpose event counters built into the microprocessor. Information about all the software running during the collection period, is recorded and can be analyzed for various data such as hotspots, instructions retired, mispredicted branches, cache misses, memory aliasing conflicts, stalls, and much more. You can use call graph analysis to collect information about the call tree, number of functions calls, function execution time, function wait time, and to identify the most time consuming path, also called the critical path. To do call graph analysis, the VTune analyzer instruments the software in memory so that it can collect function

Threading Methodology: Principles and Practices
© 2003 Intel Corporation Page 52 of 64
information. A combination of sampling and Call Graph can be used to analyze parallel applications. The VTune analyzer is complimentary to the Intel® Thread Checker and thread profiler. Table 2 highlights some of the key differences among the tools. See the VTune analyzer’s product documentation for complete usage instructions and details.
Tool or VTune™ Performance Analyzer feature
Sampling Call Graph Thread Checker Thread Profiler
Typical runtime performance overhead
1-2%. Depends upon the sampling frequency. Can be much lower.
5-25%. Depends upon the number of function calls
50-500% or more. Depends upon the amount of memory accessed.
5-25%. Depends upon the number of OpenMP* pragmas.
What software can be analyzed?
All running software.
The software associated with the one process under examination.
The software associated with the one process under examination.
The software that contains OpenMP pragmas.
Setup required
None. Symbols and source required to drill-down
Link option /fixed:no
Link option /fixed:no. Compiler option /Qtcheck required for detailed analysis.
Compiler option /Qopenmp_profile for stand-alone profiling. /Qopenmp for analysis within the VTune™ Performance Environment
What data is collected?
Processor-focused data such as instruction pointer and event counters. Hundreds of events are possible.
Function timing and call tree data.
Threading-focused data such as synchronization, parallel constructs, and memory accesses.
Timings for parallel and serial transitions and locks, barriers, and other synchronization occurring at OpenMP pragmas.
Table 2: Tools comparison.
Using Call Graph Analysis to Analyze Load Balancing Load balancing threads is one of the most basic parallel performance optimizations. The best case is when all processors are kept busy making active progress on the workload; the worst case is when one or many processors are sitting idle waiting for other threads to finish. The detection of load balancing requires that you know which threads, by design, are supposed to consume the same amount of time. The VTune analyzer presents the information to evaluate load balancing in both call graph and sampling views. When using call graph, the call tree’s self-time should be

Threading Methodology: Principles and Practices
© 2003 Intel Corporation Page 53 of 64
reasonably similar to that of other threads for proper load balancing. Not all threads in the system need to be balanced; only the ones that your design specified. In Figure 27, the two threads identified should consume the same amount of time but do not. Therefore, these two threads are not balanced.
Thread ImbalanceThread
Imbalance
Figure 27: A screen shot of the call graph view of the VTune™ Performance Analyzer screenshot showing thread imbalance.
Using Sampling Analysis to Analyze Load Balancing Sampling is another method that can be used to evaluate thread balancing. Balanced threads should contain approximately the same number of clocktick event samples and the samples should be evenly distributed among the processors. In general, use the following steps to analyze load balancing using the sampling data collector of the VTune analyzer. For more detailed usage instructions, see the analyzer’s online help. 1. Before performing the thread analysis, be sure to select only the threads contained
in your process by clicking the Process button on the toolbar. The VTune analyzer now displays all the processes that ran on your system when the sampling data collection took place.
2. Select one process on the graph, and click the Thread button to display the threads for the selected processes.
3. Click the Click Show/Hide CPU Information button to see the samples collected on each processor.
Figure 28 is a screenshot of a sampling session that shows four threads. Assume that the four threads should consume equal amounts of time because that is how the software was designed. But as you can see, the top horizontal bars are far shorter than the bottom two. More samples were collected in the bottom two threads meaning that they took longer to execute. These four threads are not load balanced.

Threading Methodology: Principles and Practices
© 2003 Intel Corporation Page 54 of 64
Figure 28 Screenshot of the sampling view showing thread imbalance
An interesting fact to note in Figure 28 is that the samples are somewhat evenly distributed among the processors. This means that even though the threads take different amounts of time to execute, the execution is evenly distributed among the available processors. When the threads contain a different number of samples or when the coloring of the CPUs indicates that at least one processor was more active than others, a load imbalance has occurred and should be investigated. Unfortunately, it is possible to be tricked into thinking that the threads are balanced when they really are running in serial. When multiple threads run for similar amounts of time on different processors, but in serial, the graph shows what appears to be a balanced situation. To avoid this confusion, you must know that the threads actually ran in parallel at the same time. If this situation did occur, it would very likely happen only if processors are sitting idle however the VTune analyzer can quickly and easily detect idle time.
Using the VTune™ Performance Analyzer to Detect Idle Time Time-based sampling (TBS) shows idle time by placing samples in the operating system’s idle loop and by collecting more samples per second than expected. Figure 29 shows samples collected in module processr.sys, which is the module that contains the operating system’s idle loop. When samples are collected in processr.sys, you can be certain that idle time exists. You can also see in Figure 29 that many samples were located in Ring 0, the privilege level reserved for the operating system, again indicating the idle loop.

Threading Methodology: Principles and Practices
© 2003 Intel Corporation Page 55 of 64
Privilege level
Figure 29: VTune Performance Analyzer screenshot showing idle time
Tracking Overhead Overhead is a nightmare for performance whether or not you are using threads. Overhead can be caused by other processes running in the system, other modules running in your process, or by inefficient code running in your module. The VTune analyzer displays the potential overhead caused by other processes running in the system on the Process View. In Figure 30, samples collected in other processes are overhead.
Figure 30: VTune Performance Analyzer screenshot showing overhead
Overhead can also be detected in the Module View as shown in Figure 31 where a bunch of samples were collected in a driver. Without knowledge about what is expected to occur, you can’t be 100% certain that these samples are overhead.

Threading Methodology: Principles and Practices
© 2003 Intel Corporation Page 56 of 64
However, anytime samples occur outside your application, further investigation is warranted.
Figure 31: Hotspots by module
Overhead can also be contained within the application. Again, it is very important to have a good understanding of what the application is supposed to be executing or you may overlook a significant performance problem. In Figure 32, the hotspots located in the application are shown.
Figure 32: Hotspots by function.
Overhead can be seen as samples collected in the _ftol(), which converts a floating-point number to an integer. The _ftol() can always be treated as overhead, and just by using the Intel C++ Compiler and compiling for the Pentium® 4 processor

Threading Methodology: Principles and Practices
© 2003 Intel Corporation Page 57 of 64
or newer, you can completely remove this overhead. In other cases, you must redesign pieces of your application to remove or reduce the overhead.
Synchronization, Overhead, Idle Time, and Context Switches Synchronization, overhead, idle time, and context switches are related. When you suspect that the overhead of synchronization may be a performance issue due to the detection of overhead and idle time in conjunction with the information that you already know about your application and its use of synchronization objects, using other features of the VTune analyzer, beyond simple sampling and call graph tracing, may help to sort things out. Using the counter monitor data collector, context switches can be tracked as shown in Figure 33. Locations of high context switches may indicate synchronization overhead.
Figure 33: Counter monitor data help you understand the cause-and-effect relationship between the computer's subsystems and your application.
In summary, the VTune analyzer and the thread profiler plug-in provide many powerful features that can be used to determine if threading performance is as expected. The analyzer is the only tool that helps you understand certain upper limits for any threaded application, especially data-parallel applications. For example, by keeping track of the bus utilization of a two-threaded application when run on a four-way system and comparing against the utilization for a four-threaded run, you can map utilization trends and project the number of threads with which the bus saturates. This information can give you insight on an upper limit for the number of threads applications can effectively use on the four-way system.

Threading Methodology: Principles and Practices
© 2003 Intel Corporation Page 58 of 64
7. Architecture-Specific Tuning for Hyper-Threading technology
Hyper-Threading technology enabled processors contain multiple logical processors per physical processor package. The state information necessary to support each logical processor is replicated while sharing and/or partitioning the underlying physical processor resources. Given that processor resources are generally underutilized by most applications, processors with Hyper-Threading technology enabled can improve overall application performance. Multiple threads running in parallel can achieve higher processor utilization and increased throughput. The first step in multithreading an application for systems with Hyper-Threading technology is to follow the threading methodology for designing, implementing, debugging, tuning and validating performance on Symmetric Multiprocessor (SMP) systems. With a few exceptions, the general approach is the same. Multithreaded applications that perform well on SMP systems will generally perform well on systems with Hyper-Threading technology. But do not confuse Hyper-Threading technology enabled processors with SMP systems. Each processor in an SMP system has all its physical processor resources available and will not experience any resource contention at this level. Well-designed multithreaded applications perform better on SMP systems and should be the upper bar on your performance expectations when running on Hyper-Threading technology enabled processors. The second step is to review the Intel® Pentium 4 and Intel® Xeon™ Processor Optimization Manual and the white papers on Hyper-Threading technology available on Intel® Developer Services web site. The best way to design, implement and tune for Hyper-Threading technology enabled processors is to avoid known pitfalls.
Designing Design applications with flexibility for effective use of processor and system resources. For example, multithreaded applications may detect the number of physical processors available in a system and then create a number of threads equivalent to that value. Intel® Pentium 4 and Intel Xeon™ processors provide information on the different levels and sizes of cache available for the particular processor. Since the cache configuration is not specified by the Intel® Netburst™ microarchitecture, this processor resource can vary among Intel processor products. By designing in flexibility for cache levels and size, applications can dynamically optimize data distributions and computations in order to maximize usage of cache. When designing for Hyper-Threading technology enabled processors, be aware that architectural state is the only resource that is replicated. All other resources are either shared or partitioned between logical processors. A shared resource is a resource that any logical processor can fully utilize but access is shared with all other logical processors. This can result in resource contention.
Threading Methodology: Principles and Practices
© 2003 Intel Corporation Page 59 of 64
Although a resource may be shared, individual use of such resources may be tagged for a specific logical processor. Resource contention can result in stalling a logical processor waiting on the availability of a tagged resource. For resources that are partitioned, a logical processor can only utilize its allocated portion of the resource. If one logical processor is not using its portion of a resource, that share of the resource is still not available for another logical processor to use. The cache hierarchies for both instructions and data are shared. Write-combining store buffers are shared. All of the execution unit resources are shared. But the load/store buffers, the table lookup buffers, instruction queue to the execution units, and the instruction reorder buffer are partitioned. Instruction decoding and delivery are shared equally in a round-robin fashion as long as no logical processor instruction queue stalls. If any logical processor stalls due to a full instruction queue to the execution units, other logical processors can take advantage of the available resource to continue decoding/delivering additional instructions. A Hyper-Threading technology enabled processor does not increase the data cache size but supports additional logical processors. If an application has been optimized for a specific cache size and number of physical processors, then the performance is likely to degrade on a Hyper-Threading technology enabled processor system. This is because each logical processor would be trying to fully utilize the cache resulting in a cache resource contention. However by designing in the flexibility to detect the number of logical processors as well as physical processors, cache levels, and cache size, you can optimize your application for peak performance on SMP systems as well as Hyper-Threading technology enabled processor systems.
Implementing The best way to design, implement, and tune for Hyper-Threading technology enabled processors is to avoid known coding pitfalls. Implementing an application for Hyper-Threading technology generally extends beyond just the application to include components or libraries provided by third-party vendors. Any implementation should use components or libraries that are thread-safe and designed specifically for Hyper-Threading enabled processors. Use operating system (OS) and/or threading synchronization libraries instead of implementing application-specific mechanisms such as spin-waits. The OS and threading libraries are likely to already be optimized for various processors. Applications can automatically take advantage of the enhancements either through re-linking and/or through the use of dynamic link libraries.
Debugging There are no unique debugging techniques for multithreaded applications running on Hyper-Threading enabled processors. The same debugging techniques and tools available for SMP systems should be used when debugging a multithreaded application on Hyper-Threading technology enabled processors.

Threading Methodology: Principles and Practices
© 2003 Intel Corporation Page 60 of 64
Tuning For best performance, applications should first be tuned for the Intel Pentium® 4 processor before tuning for Hyper-Threading technology enabled processors. If performance is not as good as expected on systems with Hyper-Threading technology, the next step is to review the latest Intel® Pentium® 4 and Intel Xeon™ Processor Optimization Manual as well as whitepapers on Hyper-Threading technology available from the Intel Developer Services web site. Look for known Hyper-Threading technology optimization opportunities and coding pitfalls that may still be part of your application. If performance is still not as expected, the next step is to narrow the scope of interest to a Hyper-Threading technology enabled processor performance issue. Gather performance results for each of the following configurations: • a single-processor system with the uni-processor kernel • a single-processor system with a multiprocessor kernel • a single processor system with Hyper-Threading technology enabled and a
multiprocessor kernel • a dual processor system with an multiprocessor kernel Comparing these performance results, verify that the performance degradation is not a multiprocessor issue. Verify that the dual Pentium 4 processor system performance is as expected and exceeds single Pentium 4 processor without Hyper-Threading enabled. If not, or if the performance gain is very low, then focus tuning effort on the standard SMP tuning methodology. Next, verify that the single Pentium 4 processor with multiprocessor kernel degrades less than 5% versus a single Pentium 4 processor uni-processor kernel. Note that single threaded (or effectively single-threaded) applications may actually degrade due to multiprocessor kernel overhead not required for uni-processor kernels. Finally, verify that the performance on Hyper-Threading enabled processors degrades versus single Pentium 4 processor with uni-processor kernel. Assuming reasonable SMP performance but degraded performance on Hyper-Threading enabled processors, the next step is to root-cause the performance degradation using the Intel VTune Performance Analyzer. Use the Intel® Tuning Assistant of the VTune analyzer to identify issues and obtain tuning advice. The Tuning Assistant uses an architecture-specific tuning methodology to guide you to useful processor event data collection and interpretation. In addition to the data collected for Hyper-Threading technology enabled processors, collect the same data on single Pentium 4 processor systems without Hyper-Threading technology enabled and dual Pentium 4 processor systems. Comparing the time in clockticks between systems can narrow the scope of where processor time is being spent. Then it is a matter of understanding what is causing the difference in clock ticks between the various platforms using the other recommended processor events.
Validation There are no unique performance validation techniques for multithreaded applications running on Hyper-Threading technology enabled processors. The same validation techniques, tools, and workloads available for SMP systems should be used when

Threading Methodology: Principles and Practices
© 2003 Intel Corporation Page 61 of 64
validating performance of a multithreaded application on Hyper-Threading technology enabled processors.
Known Pitfalls There are several known pitfalls that you can encounter when tuning an application for Hyper-Threading technology enabled processors. These pitfalls are covered in detail in the Intel® Pentium 4 and Intel Xeon™ Processor Optimization Manual and the whitepapers on Hyper-Threading technology available from the Intel Developer Services web site. Short descriptions of each of the known issues are discussed in the following sections:
Spin-waits A spin-wait loop is a technique used in multithreaded applications whereby one thread waits for other threads. The wait can be required for protection of a critical section, for barriers or for other necessary synchronizations. Typically the structure of a spin-wait loop consists of a loop that compares a synchronization variable with a predefined value as shown in Code Sample 15.
Code Sample 15: Structure of a fast spin-wait loop.
On a processor with a super-scalar speculative execution engine, a fast spin-wait loop results in the issue of multiple read requests by the waiting thread as it rapidly goes through the loop. These requests potentially execute out-of-order. When the processor detects a write by one thread to any read of the same data that is in progress from another thread, the processor must guarantee that no violations of memory order occur. To ensure the proper order of outstanding memory operations, the processor incurs a severe penalty. You can significantly reduce the penalty from the memory order violation by inserting a PAUSE instruction in the loop. If the spin-wait begins before a thread updates the variable, then the spinning loop consumes execution resources without accomplishing any useful work. To prevent the resulting waste of processor cycles that a waiting thread may use, insert a call to Sleep(0). This enables the thread to yield if another thread is waiting. But if there is no waiting thread, the spin-wait loop continues to execute. On a multiprocessor system, the spin-wait loop consumes execution resources but does not affect the application performance. On a system with Hyper-Threading technology enabled, the consumption of execution resources without contribution to any useful work can negatively impact the overall application performance. Therefore, the preferred solution for avoiding application specific spin-wait loops is to replace the loop with an operating system thread-blocking API, such as the Microsoft*

Threading Methodology: Principles and Practices
© 2003 Intel Corporation Page 62 of 64
Windows* threading API WaitForMultipleObjects. This call causes the operating system to block the waiting thread from consuming processor resources.
Write-Combining Store Buffers Data is read from the first-level cache, that is, the fastest cache, if possible. If the data is not in that level, the processor attempts to read it from the next level out, and so on. When data is written, it is written to the first-level cache only if that cache already contains the specific cache line being written, and "writes-through" to the second-level cache in either case. If the data cache line is not in the second level cache, it must be fetched from further out in the memory hierarchy before the write can complete. Data store operations place data into "store buffers", which stay allocated until the store completes. There are also a number of "write-combining"(WC) store buffers, each holding a 64-byte cache line. If a store is to an address within one of the cache lines of a store buffer, the data can often be quickly transferred to and combined with the data in the WC store buffer, essentially completing the store operation much faster than writing to the second-level cache. This leaves the store buffer free to be re-used sooner, minimizing the likelihood of entering a state where all the store buffers are full forcing the processor to stop processing and wait for a store buffer to become available. The Intel NetBurst™ architecture, as implemented in the Intel Pentium 4 and Intel Xeon processors, has six WC store buffers. If an application is writing to more than four cache lines at about the same time, the WC store buffers begin to be flushed to the second-level cache. This is done to help insure that a WC store buffer is ready to combine data for writes to a new cache line. For best performance, the Intel® Pentium® 4 Processor and Intel Xeon™ Processor Optimization guide recommends writing to no more than four distinct addresses or arrays in an inner loop, so that you do not use more than four cache lines at a time. With Hyper-Threading technology enabled processors, the WC store buffers are shared between two logical processors on a single physical processor. Therefore, the total number of simultaneous writes by both threads running on the two logical processors must be counted in deciding whether the WC store buffers can handle all the writes. In order to be reasonably certain of getting the best performance by taking fullest advantage of the WC store buffers, it is best to split inner loop code into multiple inner loops, each of which writes to no more than two regions of memory. Generally you should look for data being written to arrays with an incrementing index, or stores via pointers that move sequentially through memory. Writes to elements of a modest-sized structure or several sequential data locations can usually be counted as a single write, since they often fall into the same cache line and can be write combined on a single WC store buffer.
64K Alias Conflicts The Intel Xeon™ processor with Hyper-Threading technology shares the first-level data cache among logical processors. If two data virtual addresses reside on cache lines that are modulo 64 KB apart, they cause a conflict for the same cache line in the first-level data cache. This alias conflict can affect both the first-level data cache performance as well as impact the branch prediction unit. It is particularly
Threading Methodology: Principles and Practices
© 2003 Intel Corporation Page 63 of 64
troublesome for applications that create multiple threads to perform the same operation but on different data. Subdividing work into smaller tasks performing the identical operation is often referred to as data domain decomposition. On Microsoft Windows* operating systems, threads are created on megabyte boundaries. Threads that perform similar tasks and access local variables on their respective stacks encounter an alias conflict condition, resulting in significant overall application performance degradation. To avoid this performance degradation, use the __alloca() function to adjust an individual thread’s starting stack address by a variable amount. Using the __alloca() function improves overall application performance on Intel Xeon processors with Hyper-Threading technology.
Effective Cache Locality Effective use of data cache locality is one of the many factors that impact cache performance. A well-known data cache blocking technique can take advantage of data cache locality. To use this technique, restructure loops with frequent iterations over large data arrays by sub-dividing the large array into smaller blocks, or tiles, such that the block of data fits within the data cache. Each data element in the array is reused within the data block before operating on the next block or tile. Depending on the application, a cache data blocking technique can be very effective. It is widely used in numerical linear algebra and is a common transformation applied by compilers and application programmers. Since the second-level unified cache contains instructions as well as data, compilers often try to take advantage of instruction locality by grouping related blocks of instructions close together as well. Typical applications benefiting from cache data blocking include image or video applications where the image can be processed on smaller portions of the total image or video frame. However, the effectiveness of the technique is highly dependent on the data block size, the processor cache size and the number of times the data is reused. With Hyper-Threading technology, the cache is shared between logical processors so the relationship between block size and cache size also holds. Cache blocking algorithms need to take this into account. If a physical package has two logical processors, then while cache blocking, you must assume that only half of the cache is available to teach logical processor for use. You should detect the data cache size using Intel’s CPUID instruction and then dynamically adjust cache blocking tile sizes to maximize performance across processor implementations. Be aware that a minimum block size should be established such that the overhead of threading and synchronization does not exceed the benefit from threading. As a general rule, cache block sizes should target approximately one-half to three-quarters the size of the physical cache for processors without Hyper-Threading technology and one-quarter to one-half the physical cache size for a Hyper-Threading technology enabled processor supporting two logical processors. However, you should tune your block size based on your applications performance.

Threading Methodology: Principles and Practices
© 2003 Intel Corporation Page 64 of 64
8. Using the VTune™ Performance Analyzer to detect Hyper-Threading technology Issues
You can use the Intel® Tuning Assistant of the VTune analyzer to detect many processor-specific issues that can affect performance. This section discusses how to use the Tuning Assistant to identify various performance issues relating to Hyper-Threading technology. To create a new project, an Activity, and to configure the sampling data collector to collect processor event data, follow the instructions in the “Configuring for EBS Data Collection” topic in the VTune analyzer help. Focus on events that are particularly important for Hyper-Threading technology performance issues. After you run your Activity using event-based sampling, the Tuning Assistant examines the collected event data and provides insights and hints about performance tuning opportunities and other events to collect. An example insight is shown in Figure 34. The Tuning Assistant takes the guesswork out of the determining which counters may or may not be indicating a performance issue. Use this information as a starting point to get an idea as to what optimizations and source code changes will make the biggest difference.
Figure 34: Sample screenshot showing suggestions given by the Intel Tuning Assistant.