thorough understanding three phases, multiple sub · pdf filesource: commonwealth fund...
TRANSCRIPT

Agenda
1. The impetus behind volume to value
2. The critical importance of quality theory & practice
3. Planning as the foundation for successful change
– Thorough understanding
– Three phases, multiple sub-phases
– A budget for every phase
4. Getting data and turning it into information
5. Change management
6. Questions and discussion

About MediSync
• Manage (don’t own) multiple medical groups
– Assist them to achieve “breakthrough”
performance financially and clinically
• Use Six Sigma and Lean to innovate
medical group performance and operations
• Innovated management processes to 120+
medical groups nationwide

About PriMed Physicians
• Community based, physician owned and
governed
• Greater Dayton, OH
• PCP Based Multi-specialty Medical Group
– Family Practice, Internal Medicine, Pediatrics
+ Cardiology, Electrophysiology, Neurology &
Endo
• 55 physicians; ~100,000 patients
• Started prepping for value agreements in 2004
• Nov 1, 2012 almost all value contracts

PriMed’s Situation
• Independent group = no subsidy or deep
– MediSync did help to bear some costs
• Our doctors expect to earn top 10%
regionally, above average nationally
• Physician buy-in essential
– Physician owned medical group
– There is no “boss” who could mandate
changes

Disclaimer:
We are speaking about “average”
Seattle vs Miami

The World We Grew Up In
• Most patients have health benefits (until recently)
• Explosion of new technologies since 1965 – Pharmaceutical
– Diagnostic
– Interventional (i.e. surgical, etc.)
• More money every year for healthcare – Increased our revenue opportunities
• 75+ years of compensation “by the piece”

In Today’s Fee Based World:
• Volume is essential to financial success
• Perverse incentives:
– Improving quality decreases profit
– “Why spend money measuring outcomes
or improving outcomes?”
• Result: Most systems/groups didn’t invest
(much) in improvement
– Dollars “saved” go to the doctors
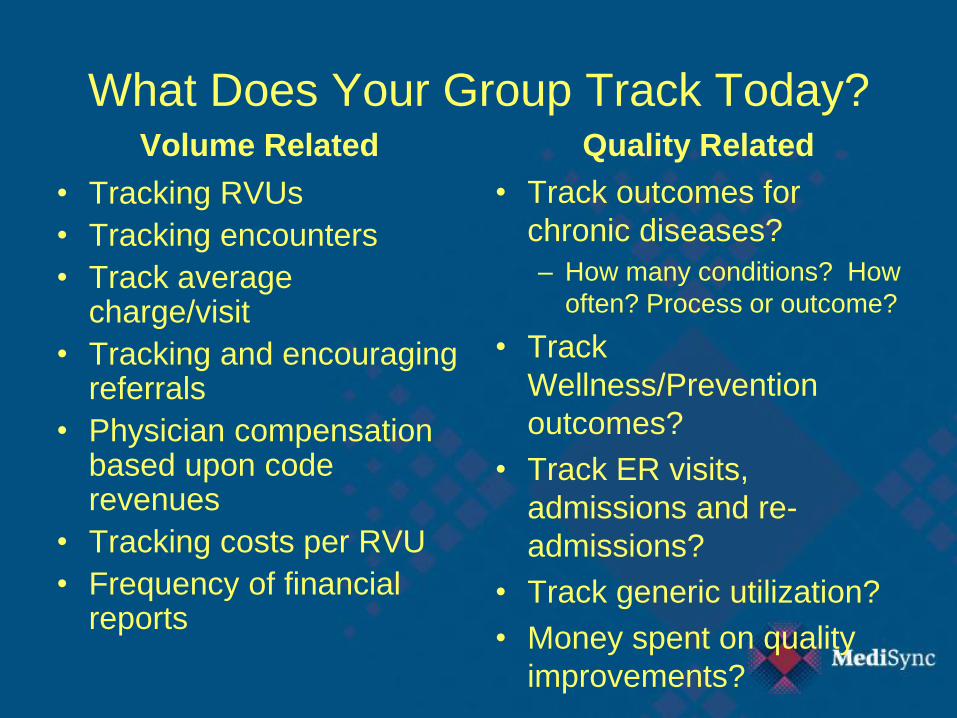
What Does Your Group Track Today? Volume Related
• Tracking RVUs
• Tracking encounters
• Track average charge/visit
• Tracking and encouraging referrals
• Physician compensation based upon code revenues
• Tracking costs per RVU
• Frequency of financial reports
Quality Related
• Track outcomes for
chronic diseases?
– How many conditions? How
often? Process or outcome?
• Track
Wellness/Prevention
outcomes?
• Track ER visits,
admissions and re-
admissions?
• Track generic utilization?
• Money spent on quality
improvements?

Is There A Spear Point
In Our Back?
Snapshot: US Healthcare
10

Average Family Premium as a Percentage of
Median Family Income, 1999–2020
11%12%
13%
14%
16%
17%18%18%18% 18%19%19%19%20%20%
21%21%
22%22%
23%24%
18%
0%
5%
10%
15%
20%
25%
1999
2000
2001
2002
2003
2004
2005
2006
2007
2008
2009
2010
2011
2012
2013
2014
2015
2016
2017
2018
2019
2020
Source: Commonwealth Fund calculations based on Kaiser/HRET, 1999–2008; 2008 MEPS-IC;
U.S. Census Bureau, Current Population Survey; Congressional Budget Office.
Projected

12


Japan
Italy Sweden
Korea Australia
Mexico
United States
Greece
France Switzerland
Austria
Netherlands United Kingdom
Poland
Iceland
Portugal
Canada
Germany Finland
Ireland
Slovak Republic
Turkey Hungary
Czech Republic Belgium
Denmark
New Zealand
Norway
Spain

Cribbing Economists
What Mayo & Kaiser Permanente’s
Experts Are Saying

Economics 101
VALUE = QUALITY
COST

The Shift to Pay For Value
• A radical departure from speed and volume to performance:
Quality matters
Cost matters Total cost of care
Cost of providing care
• This changes everything

Agenda
1. The impetus behind volume to value
2. The critical importance of quality theory & practice

One Important Chapter From
PriMed’s Story
Using Quality Theory,
Especially Process
19
Cost of Chronic Disease
“Seventy-five percent of the (monies)
spent on health care in the U.S. is for
treatment of the chronically ill.”
- The Commonwealth Fund

“Big” Chronic Diseases
HTN
Diabetes
Lipids (CAD & Vascular Diseases)
Asthma
Heart Failure
COPD
Depression
Osteoporosis

Volume 348(26) 26 June 2003 pp 2635-2645
The Quality of Health Care Delivered To Adults In the United States
McGlynn, Elizabeth A.: Asch, Steven M.: Adams, John: Jeesey, Joan: Hicks, Jennifer:
DeCristofaro, Alison: Kerr, Eve A.
BACKGROUND
We have little systematic information about the extent to which standard processes involved in healthcare—a
key element of quality—are delivered in the United States.
METHODS
We telephoned a random sample of adults living in 12 metropolitan areas in the United States and…received
written consent to copy their medical records…to evaluate performance on 439 indicators of quality of care
for 30 acute and chronic conditions as well as preventative care…
RESULTS
Participants received 54.9 percent of recommended care.
CONCLUSIONS
The deficits we have identified in adherence to recommended processes for basic care pose serious threats
to the health of the American public. Strategies to reduce these deficits are warranted.
The Costs of Poor Quality

McGlynn et al’s Findings
Disease State Practices* % Best
Arial Fibrillation 25%
Diabetes 45%
Congestive Heart Failure 63%
Hypertension 65%
Coronary Artery Disease 68%
Average 55%
* These are PROCESS not OUTCOME measures

Average Outcomes Weak: • HTN: <40% at JNC-7 BP goal
• Diabetes ~ 12% meet “Triple Outcome Goal”
• BP of ≤129/79;
• Lipids of 70 or 100;
• A1c of <7 or <8
• Osteo Screening: 1:8 women per EBS
• Asthma: 1:14 on correct drugs per EBS
• Difference between outcome versus process goals is critical

“Normal” Quality/Cost Improvement
In Virtually All Medical Groups
1. Remind physicians about evidence based
standards, goals, pathways, etc.
–Put quality “pop ups” in EHR
–Generate a registry with lists of patients
2. Generate metrics and publish – (un)blinded
3. Hire additional staff to support the effort, remind
the patients, remind the doctors (i.e. PCMH)
4. Link outcomes to pay

WHAT DO THE NORMAL METHODS
GAIN IN IMPROVEMENT?

Medical Quality Goal:
Move One Variable (i.e. BP) G
roup M
ean P
erc
ent
to G
oal
10
70
60
50
40
30
20
80
90
100
Time in Months
1st 3rd 2nd 5th 4th 6th 8th 7th 9th 10th 11th 12th 13th 14th 15th 16th

The IHI and “All or None” Goals
Wisconsin Diabetes
1. BP ≤129/79
2. A1c <7
3. LDL <100
Minnesota D5
1. BP ≤139/89
2. A1c <7
3. LDL <100
4. On Aspirin or Anti-thrombotic Tx
5. Non-smoker

Three Goals @ 60% Each
»1st Goal 60%
»2nd Goal 36%
»3rd Goal 21.6%

2010 Diabetes Outcomes (Using Wisconsin Measures)
0 5 10 15 20 25 30 35
Aurora Advanced
Aurora Medical Group
Aurora UW Medical
Bellin Medical
Columbia St. Mary's
Dean Clinic
Froedtert/West Bend
Gundersen Clinic
Marshfield Clinic
Mayo/Franciscan
Mayo/Eau Claire
Medical College
Mercy Health
Monroe Clinic
Prevea Health
ProHealth Care
ThedaCare
UW Health
Wheaton Franciscan
Percentage

The “All or None” Hurdle
1 goal @ 90% / 60% each 90% 60%
2 goals @ 90% / 60% each 81% 36%
3 goals @ 90% / 60% each 72.9% 21%
4 goals @ 90% / 60% each 65.6% 12%
5 goals @ 90% / 60% each 59% 7.5%

“Normal” Quality/Cost Improvement
In Virtually All Medical Groups
1. Remind physicians about evidence based
standards, goals, pathways, etc.
–Put quality “pop ups” in EHR
–Generate a registry with lists of patients
2. Generate metrics and publish – (un)blinded
3. Hire additional staff to support the effort,
remind the patients, remind the doctors (i.e.
PCMH, care coordinators, etc.
4. Link outcomes to pay

About Quality Theory & Tools
• Used in virtually all other economic sectors
• Sophisticated ways to help make quality
improvements and cut costs
• Examples from every day life
• Examples: Six Sigma, Lean, TQI, etc.

What Six Sigma & Lean Taught Us
1. Process, process, process
2. If you can’t measure it, you can’t improve it
3. Process, process, process
NB -- A process is a defined set of steps
designed to achieve a very specific goal

First Medical Quality Project:
Create HTN Process
1. Use Six Sigma
2. Establish baseline performance – 42%
3. Start with an “Ishikawa” or “Fishbone”

HTN %
TO GOAL
STAFF (POLICIES/PROCEDURES)
PROCESSES
INTERNAL ENVIRONMENT –SYSTEMS -OFFICE, EQUIPMENT, MATERIALS,
SUPPLIES, HARDWARE/SOFTWARE,
ETC.
HEALTHCARE ENVIRONMENT
(EXTERNAL) – INSUR. CO., GOV’T.
AGENCIES, SPEC., HOSPITAL, PHARM., ETC.
PATIENTS PHYSICIANS
Compliance
B.P. Tech.
√ Knowledge of HTN
Access. of Office for Pt.
Measurements Reported
No Shows
Policy/Comm. between Cardio., Spec.-
Renal (Role Clarity) Phys., & PCP’s
√ Algorithm
Following “visits” not “Pts.”
Home Monitor
Paying bills (invoice) Process
“Little Old Lady”
Resistance to SBP
Pt. provide full disclosure of meds.
Pt. Population (defining)
Process to f/u with Pt. √
Coverage – ICG Test
ICG
Delay of data
results (over a month)
BP Cuff
Efficiency of
Office
Role Clarification – PCP, Cardio, Renal
Review of Meds.
(med. list)
Algorithm
White Coat Synd.
√ Inter-phys. variation
√ Knowledge of HTN
Compliance
√ Time
Reluctance to treat
No shows
Money
Dialysis of Pts.
√ Knowledge of HTN
Planning (med refill)
Socio. / Econ./ √
Demographics / Ethnicity
√ Compliance
Motivation
(lack of)
Definition of Pt.
White Coat Synd.
√ Cost
“Little Old Lady”
Full disclosure of meds.
Employer (perception)
Pharmacy
Ambul. BP monitoring
Insurance
Media

Creating the HTN Process - 1
1. Use Six Sigma
2. Establish baseline performance
3. Start with an “Ishikawa” or “Fishbone”
4. Create a true process that
• Addresses every HTN patient, every visit
• Includes Impedance Cardiography
• Guides drug selection and dosing


Creating the HTN Process
1. Use Six Sigma
2. Establish baseline performance
3. Start with an “Ishikawa” or “Fishbone”
4. Create a true process that
• Addresses every HTN patient, every visit
• Includes Impedance Cardiography
• Guides drug selection and dosing
5. Solve controversy with statistics


Inside Expert’s DOE Analysis
Usefulness of ICG
Y-hat Model
BP@Goal Factor Name Low High Exper
Factor Name Coeff P(2 Tail) Tol Activ
e
Const 0.47645 0.0000 A StatusCoded -1 1 0
C A StatusCoded -0.00136 0.7305 0.8938 X B AlgFollow edCoded -1 1 0
C B AlgFollow edCoded -0.00487 0.1671 0.9781 X C ICG_RightCoded -1 1 0
C C ICG_RightCoded 0.47597 0.0000 0.8767 X
R20.8710 Multiple Response Prediction
Adj R2 0.8709
Std Error 0.1742 99% Confidence Interval
F 6205.1690 Y-hat S-hat Lower Bound Upper Bound
Sig F 0.0000 BP@Goal 0.4765 0.1742 -0.046 0.999
FLOF 2.5130
Sig FLOF 0.0398
Source SS df MS
Regression 564.8 3 188.3
Error 83.7 2757 0.0
ErrorPure 83.4 2753 0.0
ErrorLOF 0.3 4 0.1
Total 648.5 2760
Effect Actual Coded
Constant 0.47645172 0.4765
A 0 0 -0.0013569 0
B 0 0 -0.0048689 0
C 0 0 0.4759703 0
0.4765

Inside Expert’s DOE Analysis
Usefulness of ICG PriMed
Y bar Marginal Means
SBP &DBP Combined at BP Goal
Dec 05
0
0.1
0.2
0.3
0.4
0.5
0.6
0.7
0.8
0.9
1
-1 1 -1 1 -1 1
Effect Levels
StatusCoded
AlgFollowedCoded
ICG_RightCoded

Creating the HTN Process
5. Measure use of HTN Process and outcomes
6. Unblinded publication of data
• What do you do with docs who do not use
HTN Process?

0%
10%
20%
30%
40%
50%
60%
70%
80%
90%
100%
Dr. A Dr. B Dr. C Dr. D Dr. E Dr. F Dr. G Dr. H Dr. I Dr. J
PriMed % HTN to Goal vs. % Copy of Algorithm vs. % Algorithm Followed
August 2005
% BP at Goal
% Copy of Algorithm
% Algorithm Followed
Average:
% HTN to Goal = 83%
% Algorithm Followed = 66%

0%
10%
20%
30%
40%
50%
60%
70%
80%
90%
100%
Dr. K Dr. L Dr. M Dr. N Dr. O Dr. P Dr. Q Dr. R Dr. S Dr. T
PriMed % HTN to Goal vs. % Copy of Algorithm vs. % Algorithm Followed
August 2005
% BP at Goal
% Copy of Algorithm
% Algorithm Followed
Average:
% HTN to Goal = 70%
% Algorithm Followed = 49%

0%
10%
20%
30%
40%
50%
60%
70%
80%
90%
100%
PriMed % HTN to Goal vs. % Copy of Algorithm vs. % Algorithm Followed
August 2005
% BP at Goal
% Copy of Algorithm
% Algorithm Followed
Average:
% HTN to Goal = 61%
% Algorithm Followed = 66%

0%
10%
20%
30%
40%
50%
60%
70%
80%
90%
100%
PriMed % HTN to Goal vs. % Copy of Algorithm vs. % Algorithm Followed
August 2005
% BP at Goal
% Copy of Algorithm
% Algorithm Followed
Average:
% HTN to Goal=49%
% Algorithm Followed=37%

Creating the HTN Process
5. Measure: HTN Process use and outcomes
6. Publish results
• What do you do with docs who do not use HTN Process?
7. Link HTN Process compliance to physician compensation
• NOT based upon outcomes, based upon participation in the process
9. Constant work on “group culture”

100% 100% 100% 100% 100% 100% 100%98% 98% 98% 98% 98%
0%
10%
20%
30%
40%
50%
60%
70%
80%
90%
100%
% BP@Goal PriMed
Quartile 1September 2009
% BP @ Goal
%Protocol Followed
Averages:% BP@Goal = 99%% Protocol Followed = 100%
Dr. A Dr. B Dr. C Dr. D Dr. E Dr. F Dr. G Dr. H Dr. I Dr. J Dr. L Dr. K

96% 96% 96% 96%94%
92% 92% 92% 92% 92% 92% 92% 92% 92%
0%
10%
20%
30%
40%
50%
60%
70%
80%
90%
100%
% BP@Goal PriMed
Quartile 2 September 2009
% BP @ Goal
%Protocol Followed
Averages:% BP@Goal = 93%% Protocol Followed = 100%
Dr. M Dr. N Dr. O Dr. P Dr. Q Dr. R Dr. S Dr. T Dr. U Dr. V Dr. X Dr. W Dr. Z Dr. Y

91%
90% 90% 90%
88%
82%
84%
86%
88%
90%
92%
94%
96%
98%
100%
AHMAD SHAH WELLER ADIB PORTER
% BP@Goal PriMed
Quartile 3 September 2009
% BP @ Goal
%Protocol Followed
Averages:% BP@Goal = 90%% Protocol Followed = 99%
Dr. AB Dr. AA Dr. AD Dr. AC Dr. AE

88% 88% 88%86% 86%
84% 83% 82%
75% 74% 73% 73%
0%
10%
20%
30%
40%
50%
60%
70%
80%
90%
100%
% BP@Goal PriMed
Quartile 4 September 2009
% BP @ Goal
%Protocol Followed
Averages:%BP@Goal = 82%% Protocol Followed = 96%
Dr. AG Dr. AF Dr. AI Dr. AH Dr. AJ Dr. AL Dr. AK Dr. AN Dr. AM Dr. AO Dr. AP Dr. AQ

0%
10%
20%
30%
40%
50%
60%
70%
80%
90%
100%
Elite Medical Groups Post Intervention
Average US Performance
Percent of Patients Reaching JNC-7 BP Goal HTN Outcomes With or Without Co-Morbidities
MediSync Groups

2010 Diabetes Outcomes (Using Wisconsin Measures)
0 5 10 15 20 25 30 35
Aurora Advanced
Aurora Medical Group
Aurora UW Medical
Bellin Medical
Columbia St. Mary's
Dean Clinic
Froedtert/West Bend
Gundersen Clinic
Marshfield Clinic
Mayo/Franciscan
Mayo/Eau Claire
Medical College
Mercy Health
Monroe Clinic
Prevea Health
ProHealth Care
ThedaCare
UW Health
Wheaton Franciscan
Percentage

2010 Diabetes Outcomes (Using Wisconsin Measures)
0 5 10 15 20 25 30 35 40
PriMed Physicians
Aurora Advanced
Aurora Medical Group
Aurora UW Medical
Bellin Medical
Columbia St. Mary's
Dean Clinic
Froedtert/West Bend
Gundersen Clinic
Marshfield Clinic
Mayo/Franciscan
Mayo/Eau Claire
Medical College
Mercy Health
Monroe Clinic
Prevea Health
ProHealth Care
ThedaCare
UW Health
Wheaton Franciscan
Percentage

What Makes PriMed Different?
• It is NOT that:
– Dayton patients are
more eager to make
lifestyle change or
adhere to Rx
therapies
– PriMed doctors are
better educated

Six Sigma and Lean
• Better problem solving methods
• Emphasis on process for everyone
• Statistics better than opinion
–What is / is not working?

Agenda
1. The impetus behind volume to value
2. The critical importance of quality theory & practice
3. Planning as the foundation for successful change
– Thorough understanding
– Three phases, multiple sub-phases
– A budget for every phase

• Disease registries
• WRAP registries
• Care management (>100 flavors)
• Case management (>100 flavors)
• Treatment protocols
• Pharmacists
• Health coaches
• IT Analytics
• Risk Stratification
• Publish data about success
• Physician engagement
• Patient education
• Clinical teams
• Patient outreach
• Patient Centered Medical Home
• Prior authorization
• Chronic disease processes
• Care coordinators
• Team huddles
• Need meaningful informed consent
• Increase appropriate palliative care options
• Complete wellness/ prevention (WRAP) for all patients
• Successful chronic disease management outcomes
• Higher patient engagement
• Eliminate unnecessary care
• Eliminate duplicative care
• Reduce admissions
• Reduce re-admissions
• Use only appropriate diagnostics
• Reduce “per unit” costs when possible
• Coordinate care
• Engage families
• Leverage community resources
• Use generics when appropriate
• Create a working system of care
Challenges
Need meaningful informed consent Increase appropriate palliative care options Complete wellness/prevention (WRAP) for all patients Successful chronic disease management outcomes Higher patient engagement Eliminate unnecessary care Eliminate duplicative care Reduce admissions Reduce re-admissions Use only appropriate diagnostics Reduce “per unit” costs when possible Coordinate care Engage families Leverage community resources Use generics when appropriate
Solutions
Disease registries WRAP registries Care management (>100 flavors) Case management (>100 flavors) Treatment protocols Pharmacists
Create a working system of care
Health coaches IT Analytics Risk Stratification Publish data about success Physician engagement Patient education Clinical teams Patient outreach Patient Centered Medical Home Prior authorization Chronic disease processes Care coordinators Team huddles

What Groups Need to Change
(A Partial List) 1. Information systems
(i.e. for population
management)
2. Vastly improved
chronic disease
outcomes
3. Increased Wellness
and Prevention
outcomes
4. Case and care
management
5. Alternative methods
for providing care
6. More effective
options for patient
engagement
7. New payment
models and other
contractual changes
8. Internal quality
improvement
abilities

What We See Often:
• Very little planning
• Confusion about strategic vs tactical plans
• Every problem requires extra staff
– Who is going to pay for that?
• Ineffective engagement of docs
– Inadequate and/or poor physician leadership
61

Hail Mary Passes
How to prepare for value based agreements:
1. Get data analytics and publish the results
– Iffy docs will feel the competitive
pressure to improve
– Problem patients will be assigned to:
2. (Lots of) case/care managers
62
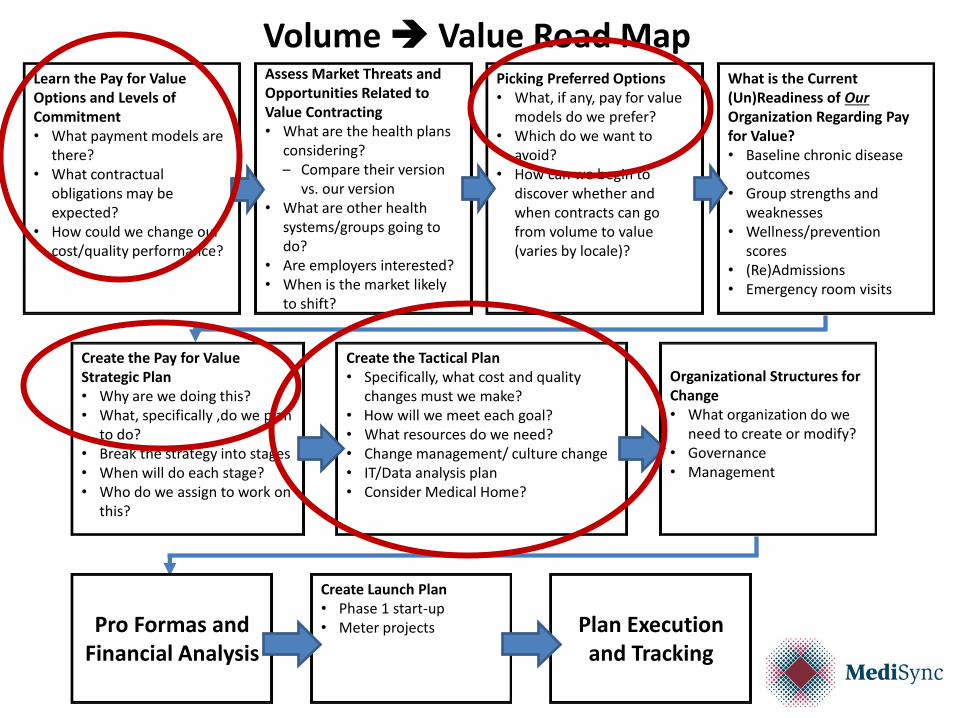
Learn the Pay for Value Options and Levels of Commitment • What payment models are
there? • What contractual
obligations may be expected?
• How could we change our cost/quality performance?
Assess Market Threats and Opportunities Related to Value Contracting • What are the health plans
considering? – Compare their version
vs. our version • What are other health
systems/groups going to do?
• Are employers interested? • When is the market likely
to shift?
Picking Preferred Options • What, if any, pay for value
models do we prefer? • Which do we want to
avoid? • How can we begin to
discover whether and when contracts can go from volume to value (varies by locale)?
What is the Current (Un)Readiness of Our Organization Regarding Pay for Value? • Baseline chronic disease
outcomes • Group strengths and
weaknesses • Wellness/prevention
scores • (Re)Admissions • Emergency room visits
Create the Pay for Value Strategic Plan • Why are we doing this? • What, specifically ,do we plan
to do? • Break the strategy into stages • When will do each stage? • Who do we assign to work on
this?
Create the Tactical Plan • Specifically, what cost and quality
changes must we make? • How will we meet each goal? • What resources do we need? • Change management/ culture change • IT/Data analysis plan • Consider Medical Home?
Create Launch Plan • Phase 1 start-up • Meter projects
Volume Value Road Map
Organizational Structures for Change • What organization do we
need to create or modify? • Governance • Management
Pro Formas and Financial Analysis
Plan Execution and Tracking

Strategy vs. Tactics
Strategy
• What are the forces of
change?
– Which are for us?
Against us?
• What options are there?
• Which options can we pull
off? Which not?
• Which give us the best
shot at winning success?
• Where do we get the
resources we need?
Tactics
• What is our specific plan to
make our strategy happen?
• Who must work on what?
• In what order? When?
• How will all this fit together?
– Timelines
– End product
• How do we keep track of all
this?

Learn the Pay for Value Options and Levels of Commitment • What payment models are
there? • What contractual
obligations may be expected?
• How could we change our cost/quality performance?
Assess Market Threats and Opportunities Related to Value Contracting • What are the health plans
considering? – Compare their version
vs. our version • What are other health
systems/groups going to do?
• Are employers interested? • When is the market likely
to shift?
Picking Preferred Options • What, if any, pay for value
models do we prefer? • Which do we want to
avoid? • How can we begin to
discover whether and when contracts can go from volume to value (varies by locale)?
What is the Current (Un)Readiness of Our Organization Regarding Pay for Value? • Baseline chronic disease
outcomes • Group strengths and
weaknesses • Wellness/prevention
scores • (Re)Admissions • Emergency room visits
Create the Pay for Value Strategic Plan • Why are we doing this? • What, specifically ,do we plan
to do? • Break the strategy into stages • When will do each stage? • Who do we assign to work on
this?
Create the Tactical Plan • Specifically, what cost and quality
changes must we make? • How will we meet each goal? • What resources do we need? • Change management/ culture change • IT/Data analysis plan • Consider Medical Home?
Create Launch Plan • Phase 1 start-up • Meter projects
Volume Value Road Map
Organizational Structures for Change • What organization do we
need to create or modify? • Governance • Management
Pro Formas and Financial Analysis
Plan Execution and Tracking

Phases and sub-phases

Traditional Medical Group
Operations
Pay for Value Volume Value
Transition
Perf
orm
ance
High
Low

Traditional Medical Group
Operations Pay for Value
Volume Value Transition
Perf
orm
ance
High
Low

Traditional Medical Group
Operations Pay for Value
Volume Value Transition
Perf
orm
ance
High
Low

Learn the Pay for Value Options and Levels of Commitment • What payment models are
there? • What contractual
obligations may be expected?
• How could we change our cost/quality performance?
Assess Market Threats and Opportunities Related to Value Contracting • What are the health plans
considering? – Compare their version
vs. our version • What are other health
systems/groups going to do?
• Are employers interested? • When is the market likely
to shift?
Picking Preferred Options • What, if any, pay for value
models do we prefer? • Which do we want to
avoid? • How can we begin to
discover whether and when contracts can go from volume to value (varies by locale)?
What is the Current (Un)Readiness of Our Organization Regarding Pay for Value? • Baseline chronic disease
outcomes • Group strengths and
weaknesses • Wellness/prevention
scores • (Re)Admissions • Emergency room visits
Create the Pay for Value Strategic Plan • Why are we doing this? • What, specifically ,do we plan
to do? • Break the strategy into stages • When will do each stage? • Who do we assign to work on
this?
Create the Tactical Plan • Specifically, what cost and quality
changes must we make? • How will we meet each goal? • What resources do we need? • Change management/ culture change • IT/Data analysis plan • Consider Medical Home?
Create Launch Plan • Phase 1 start-up • Meter projects
Volume Value Road Map
Organizational Structures for Change • What organization do we
need to create or modify? • Governance • Management
Pro Formas and Financial Analysis
Plan Execution and Tracking

Planning Conclusion
Planning & plan execution
disciplines are critical
71

Agenda
1. The impetus behind volume to value
2. The critical importance of quality theory & practice
3. Planning as the foundation for successful change
– Thorough understanding
– Three phases, multiple sub-phases
– A budget for every phase
4. Getting data and turning it into information

IT Analytics
• Obviously important
• Look at each patient, look at population
– Who is sick (or well)?
– What are problems?
– Where is money going?
– How to identify and address highest priorities
• Very important to select vendors carefully
– Possible to spend lots and get little 73

Data Aggregation
Hospital EHRs
Outpatient EHRs
Payer Claims Systems
Labs PACs PBM/
Pharmacies Home Health
Case Management
SNFs
Analytics
Action

Examples of Bad IT
Aggregation/Analytic Solutions
1. Analytics that answer a few questions only
(at high cost)
2. Cannot include all data (i.e. claims data)
3. Bad data aggregation
– Patients misidentified 10+%
– Bad data uncleansed
– New data stored in bad formats
4. Data not truly searchable
5. Any of the above, analytics suffer
75

Features & Functions
• Private HIE capabilities?
• Ability to see individual patient and the
population?
• Ability to configure presentation views?
• What method for cleaning up?
• New representation in relational database or
in “new data” structures?
• What analytic power?
76

Agenda
1. The impetus behind volume to value
2. The critical importance of quality theory & practice
3. Planning as the foundation for successful change
– Thorough understanding
– Three phases, multiple sub-phases
– A budget for every phase
4. Getting data and turning it into information
5. Change management

Traditional Physician Culture
• I do it my way
• Team flexes around me and my way
• Clinical training based on personal
responsibility, not process
• Ralph Waldo Emerson:
– “Foolish consistency is the hobgoblin of little
minds”

Medical Group Culture and
Change Management
• Definitions: – Culture:
The way we actually do things in this organization
Not the way we say that we do them - the way that we actually do them
– Change management
Process by which change is introduced and supported
Deals with both intellectual and, especially, the emotional sides of change

Anger

Changing Group Culture
Tradition vs. Quality
• Key: doctor knowledge
• Doctor judges what to do case-by-case
• Improve try harder
• Good process outperforms individual ability even if you are smart
• Follow the process steps every time
• Improve process improve results
Developing Physician Leaders
• Leadership skill is learned, not genetically endowed
• Let the leadership team compensate for individual leader weaknesses
• Recognize the greatest fear of physician leaders:
– “What will I/we do if they won’t follow?”

PriMed’s Top Leadership
Learnings • OK if there is no one, highly gifted leader
• A team of leaders with various strengths works
fine (maybe better)
• Learn leadership together
– PriMed’s leadership learning process
• Build the bench at all times
– Informal leaders can be just as important

Change Management &
Physician Leadership
Learnings from EHR implementation:
1. Doctor emotion is extremely important in
change
• You need to acknowledge and address
doc’s emotions
2. Lay out a detailed plan that works
• AKA “processes” 84

What We Learned
• There cannot be enough communication
– Copy the drug reps: 7 times, 7 ways
• Remember Kubler Ross:
– Denial, Anger, Bargaining, Depression,
Acceptance
• Predict the hard spots and the emotions
• Acknowledge the emotions
• New culture built out of new behaviors
– If you don’t change behavior, you don’t
change culture

Volume Value
Four Biggest Challenges
1. The cost
2. Not knowing when you can get
contracts that pay for value
3. Learning new skills
4. Changing physician habits and
group culture

Volume To Value Summary
• Current group infrastructure and attitudes shaped by fees
• Changing to value requires:
– New infrastructures
– New skills and competencies
– A ton of change (over a long time)

Questions & Discussion
Bob Matthews
513-533-6006
Charlie Hardtke
513-619-6801
www.medisync.com