this report transmits a balanced trial budget for fiscal ... trial budget...trial budget includes a...
TRANSCRIPT
City Council Policy Session
City Council Report
Agenda Date: 3/21/2017, Item No. 3
2017-18 City Manager's Trial Budget
This report transmits a balanced Trial Budget for fiscal year (FY) 2017-18.
THIS ITEM IS FOR INFORMATION AND DISCUSSION.
Throughout the year, the City Council and City Management made carefulpreparations for this year. As a result, the General Fund (GF) portion of the 2017-18Trial Budget includes a small surplus of approximately $1.9 million in ongoingsavings that can be used to address critical public safety needs, requests from thecommunity for new or expanded services, and/or be set aside to address futurebudget needs or revenue shortfalls. Highlights from GF resource recommendationsare:
1. Adding Police Assistants to help shift some administrative duties from swornofficers to civilians, freeing up officer time for more proactive community work
2. Additional homelessness outreach teams citywide3. Making safety, security and education staffing permanent at the Central Library4. Funds set aside as a head start on a projected 2018-19 budget deficit
Highlights from other funding sources include:
1. 22 new park ranger positions for flatland parks and mountain preserves2. Aviation safety and security, including an ambulance dedicated to Sky Harbor3. Planning and Development Services positions needed to accommodate growth4. Added frequency and extension of several bus routes from T2050 funds5. Growth in Solid Waste collections, diversion programs, safety and training
SummaryThe Trial Budget is an important step in the City's Zero-Based Budget developmentprocess. It provides the Mayor and City Council, the community and our employeegroups an opportunity to review a proposed balanced budget well in advance of thedeadlines for making final budget decisions. Between April 4 and April 20, the 2017-18 Trial Budget will be presented to Phoenix residents for input at 17 community
Page 1 of 6

Agenda Date: 3/21/2017, Item No. 3
budget hearings. A complete list of hearing dates, locations and times is included in Attachment C. During this time the City also will conduct additional hearings at neighborhood and business organization meetings, increasing transparency and involvement in the budget process. As a result of public input, changes could be made to the Trial Budget when a proposed budget is presented on May 9.
Latest General Fund Budget StatusOn Feb. 21, 2017, the Budget and Research Department presented a five-yearGeneral Fund forecast to the City Council. The multi-year forecast is a financialmanagement best practice providing the City Council with a tool for long-termplanning and strategic decision-making. The report explained economic, resourceand expenditure assumptions providing the basis for potential ending balanceranges over the next five fiscal years. At the time we reported a breakeven GeneralFund budget for 2017-18. That is, after accounting for the estimated GF revenuesand necessary cost increases plus the costs to open and operate new capitalfacilities, we estimated that no funds would be available to expand or add newcommunity services.
Since that time, we have continued to revise resource and expenditure assumptions based on our detailed technical reviews. As a result of these detailed reviews, we have now determined that our budget status for next fiscal year has improved slightly. Based on current revenue collections and revised expenditure projections we now project a modest surplus of approximately $1.9 million for next fiscal year. Further, due to higher than anticipated assessed property values and successful refinancing using the City's high credit rating, the overall property tax rate of $2.17 can be reduced to $2.16 next fiscal year. Additional detailed information on GF revenue and economic assumptions used to develop the Trial Budget can be found in Attachment D.
As presented, the Trial Budget preserves existing city services and provides for modest investments in public safety and homelessness from the General Fund. Additions also are proposed from Enterprise or Restricted Funds for parks, public transit, aviation, solid waste and planning and development services as well as a head start on the 2018-19 budget. A detailed listing of the general fund and non-general fund budget additions can be found in Attachments A and B.
Page 2 of 6

Agenda Date: 3/21/2017, Item No. 3
Proposed General Fund AdditionsPolice Department - $1,300,000The proposed Trial Budget includes the addition of 16 new police assistantpositions, in an effort to relieve police officers from performing administrative tasksand allowing them to focus on higher priority calls for service. The police assistantswill be responsible for responding to civil traffic collisions, traffic control, and othermisdemeanor crimes. Utilizing the police assistants on these types of calls isexpected to improve the Police Department's ability to respond to emergency callsfor service. It is also believed that this addition will have a positive impact onresponse times and provide an enhanced level of customer service to thecommunity. The cost of this addition including vehicles and equipment isapproximately $1.3 million next fiscal year, assuming a Sept. 1, 2017 start date.
Human Services Department - No Cost AdditionThe Trial Budget proposes the elimination of six vacant positions in the HumanServices Department to provide additional contractual services for homelessoutreach and engagement. This proposal will reallocate $500,000 of savings toimprove the City's ability to effectively respond to street homelessness.
GF Set-Aside - $641,000As was discussed earlier in this report, there is approximately $1.9 million in fundingavailable for service enhancements, $1.3 million of which is being proposed toprovide additional civilian support to the Police Department to free up sworn officertime and improve response times. Staff proposes that the remaining $641,000 beplaced into a GF set-aside to address any unforseen GF revenue shortfalls, as anoffset against the potential GF deficit projected for FY 2018-19.
Proposed Non-General Fund AdditionsThe City budget is made up of three separate pieces: the General Fund, EnterpriseFunds and Other Restricted Funds. Recommendations for the General Fund werediscussed above. Enterprise Funds include Aviation, Water, Wastewater, SolidWaste and the Convention Center. These funds, with the exception of theConvention Center, are funded with user fees. The Convention Center includesfees paid by those who use the facility and Convention Center parking garages andcertain earmarked sales tax categories. Enterprise funds can only be used forcosts directly associated with delivering enterprise fund services. This Trial Budgetproposes several items for the Aviation and Solid Waste Funds.
Page 3 of 6

Agenda Date: 3/21/2017, Item No. 3
The Restricted Funds category includes federal and state grants, gas taxes(AHUR), debt service, the Development Services fund, the Phoenix Parks andPreserve Initiative (PPPI) and the voter-approved Transit 2050 Fund. These fundscan only be used in accordance with grant and other statutory rules. Thisrecommended Trial Budget includes several items for the Transit 2050,Development Services, and Phoenix Parks and Preserve Initiative Funds.
Aviation FundsAviation proposes adding staff and equipment for a new Airport Command Centerwhich will serve as a multi-purpose facility consisting of an OperationsCommunication Center, an Emergency Operations Center and a combinedmaintenance and technology center. Aviation also proposes to add funding for adedicated ambulance to improve response times at Sky Harbor InternationalAirport.
Development Services FundPlanning and Development proposes adding several new positions in order to meetthe needs of current workload demands and expected increases in developmentactivity. The proposed additions will enhance customer service and ensure a morestreamlined experience for the development process. The department had 669total staff at the height of the last economic cycle (2006-07) and decreased to astaff of 253 in 2010-11. Today the department has a staff of 329 employees. In2006-07 the department served almost 120,000 customers. That dropped to a littleover 70,000 customers in 2010-11. In 2016-17 the department is projected to serveapproximately 112,000 customers. In addition, increased complexity of infilldevelopment and the need to work with surrounding property owners and residentson a much more frequent basis than in 2006-07, places a greater demand on stafftime.
Phoenix Parks and Preserve Initiative (PPPI) FundThe Trial Budget includes 22 new Park Rangers and three other positions intended to address a number of key Parks priorities. These priorities include expanding trailhead hours and additional enforcement and customer service at flatland parks. Thirteen of the new park ranger positions will be assigned to North Mountain, Piestewa Peak, South Mountain and other major trailheads including Echo Canyon, Cholla, and Lookout Mountain. The proposed budget also includes nine new park ranger positions to assist with monitoring and enforcing park rules at flatland parks. Overall, park rangers will increase from 55 to 77. Currently there are no park rangers assigned to flatland parks. The Trial Budget also includes the new facility
Page 4 of 6

Agenda Date: 3/21/2017, Item No. 3
operating costs associated with two new dog parks located at Reach 11 and DeerValley Park.
Solid Waste FundsThe Trial Budget proposes to add eight positions and equipment needed to supportthe Reimagine Phoenix Campaign, (40% diversion by 2020 initiative), a SolidWaste Apprenticeship Program to build the future work force, and Safety Programs.
Transit 2050 FundsAs a result of funding from the Phoenix Transportation 2050 Plan and strongridership demand, the Transit Department proposes adding funding to expandservices for Routes serving 19th Avenue, 32nd Street, 51st Avenue, BethanyHome, Van Buren, McDowell, Thomas, and Indian School (19, 32, 51, 60, 3, 17, 29,and 41). The budget also reflects a proposal to increase mid-day frequency onRoutes serving Thomas and Camelback (29 and 50) during weekdays.
Next StepsStaff will publish a tabloid in English and Spanish summarizing the City Manager'sTrial Budget and make it available to the public. The tabloid will be availableelectronically on the City's website, and copies will be available at all senior centers,community centers, libraries, and as always, at all community budget hearings.Electronic document locations will be publicized in the Arizona Republic, theArizona Informant, La Voz, Prensa Hispana and the Asian American Times.
Next, a series of community budget hearings will be held between April 4 and April20. A schedule of those hearings is included in the attached document. As is ourpractice, we will take careful notes of the comments made at each hearing and willtransmit them each week in the Council packet. Following the community budgethearing process, the City Manager's Proposed Budget reflecting community inputwill be presented to City Council on May 9, 2017 and Council action on the budgetis scheduled for May 23, 2017. The remaining key dates in this year's budgetprocess are as follows:
Date EventMay 9, 2017 City Manager's Proposed BudgetMay 23, 2017 Council Budget DecisionJune 7, 2017 2017-18 Tentative Budget Ordinance AdoptionJune 21, 2017 2017-18 Funding Plan and Final Budget Ordinance AdoptionJuly 6, 2017 2017-18 Property Tax Levy Ordinance Adoption
Page 5 of 6
Agenda Date: 3/21/2017, Item No. 3
Responsible DepartmentThis item is submitted by City Manager Ed Zuercher and the Budget and ResearchDepartment.
Page 6 of 6

ATTACHMENT A SCHEDULE 1
2017-18
PROPOSED SUPPLEMENTALS GENERAL FUND
Department 2017-18
Police
Program: Respond to Calls for Service 1. Add funding for 16 civilian Police Assistants and required
personal equipment and vehicles to the Patrol Division of the Phoenix Police Department. Two Police Assistants will be assigned to each of the seven precincts to respond to non-emergency calls for service and to complete other administrative duties allowing sworn staff to focus on higher priority calls with two others available on a demand-basis determined by the Police Chief. It is anticipated that this addition will have a positive impact on response times.
$1,300,000 16.0
Total Police $1,300,000 16.0
Human Services
Program: Emergency Shelter for Women and Families 1. Eliminate six vacant positions to provide additional contractual
services for homeless outreach and engagement. This will improve the program’s ability to efficiently and effectively respond to concerns regarding street homelessness.
$- (6.0)
Total Human Services $- (6.0)
Library
Program: Security 1. Convert one full-time and 1.2 FTE of part-time temporary
Municipal Security Guard positions to regular status to improve safety and customer service at Burton Barr Central Library.
$--
Program: Children and Teen Services 2. Eliminate funding for contractual services to add 0.6 FTE of a
part-time Library Assistant position to implement and manage programs to engage youth in computer coding and other Science, Technology, Engineering, Arts and Math (STEAM) educational activities and job-readiness training.
$- 0.6

Total Library $-
Total Proposed General Fund Additions
0.6
$1,300,000 10.6
General Fund Administrative No-Cost Conversions
Department 2017-18
Budget and Research
Program: Budget Development and Monitoring 1. Convert one full-time temporary Senior Business Systems
Analyst to regular status to continue support of the city’s internal financial SAP environment.
$--
Total Budget and Research $--
Information Technology
Program: Enterprise Business Applications & Shared Common Technology Infrastructure
1. Convert one full-time temporary Lead IT Systems Specialist andone full-time temporary Senior IT Systems Specialist to regular status to continue support of the city’s internal financial SAP environment.
$- -
Total Information Technology $--
Neighborhood Services
Program: Standard Service Area Code Enforcement 1. Convert a temporary Project Manager and temporary
Neighborhood Preservation Inspector I position to regular status in support of the Abatement Lien Program.
$--
Total Neighborhood Services $--

Retirement Systems Program: City of Phoenix Employees Retirement System
(COPERS) Board and Committee Support; COPERS’ Investment Management
1. Convert one full-time temporary Accountant II position to regular status to support financial operations associated with the growth of membership, benefit programs, and complexity of a diversified investment portfolio.
$- -
Program: COPERS’ Member Services 2. Convert one full-time temporary Retirement Assistant to regular
status to assist with retirement counseling, calculation of General City and Public Safety employee pensions, and presenting retirement information and education.
$- -
Total Retirement Systems
$-
- Total Proposed General Fund Administrative Conversions $-
-

ATTACHMENT B SCHEDULE 2
2017-18
PROPOSED SUPPLEMENTALS NON-GENERAL FUND
Department 2017-18
Parks and Recreation
Program: Mountain Parks and Preserves 1. Add Park Ranger positions and materials to extend trailhead
hours from 7:00 p.m. to 9:00 p.m. during the months of Junethrough September at North Mountain Park, Piestewa Peak, andSouth Mountain Park; manage the patrol, security, andmaintenance of existing trailheads; and provide increasedvisibility and improved coverage at all major trailheads includingEcho Canyon, Cholla, and Lookout Mountain. This uses PhoenixParks and Preserves Initiatives (PPPI) funds.
$965,000 13.0
New Program: Rangers for Community and Neighborhood Parks 2. Add Park Ranger positions and materials to monitor and enforce
park rules, regulations and ordinances related to city flatland parkuse, and provide customer service and information to daily users.Currently there are no Park Rangers assigned to flatland parks.This would provide one Park Ranger per 522 acres of flatlandparks. This uses PPPI funds.
898,000 9.0
Administration 3. Add a Management Assistant I position to provide support to
Parks Development section staff responsible for managing allpark projects throughout the City. There are 71 budgetedprojects in the current year and 32 new projects slated for fiscalyear 2017-18. The cost of this position will be charged to theCapital Improvement Program Budget.
- 1.0
Administration 4. Add a Planner I position to provide research regarding land use
including zoning, acquisition, property restrictions, easements,and legal limitations in support of the development of new parksand redevelopment of existing parks. There are 71 budgetedprojects in the current year and 32 new projects slated for fiscalyear 2017-18. The cost of this position will be charged to theCapital Improvement Program Budget.
- 1.0
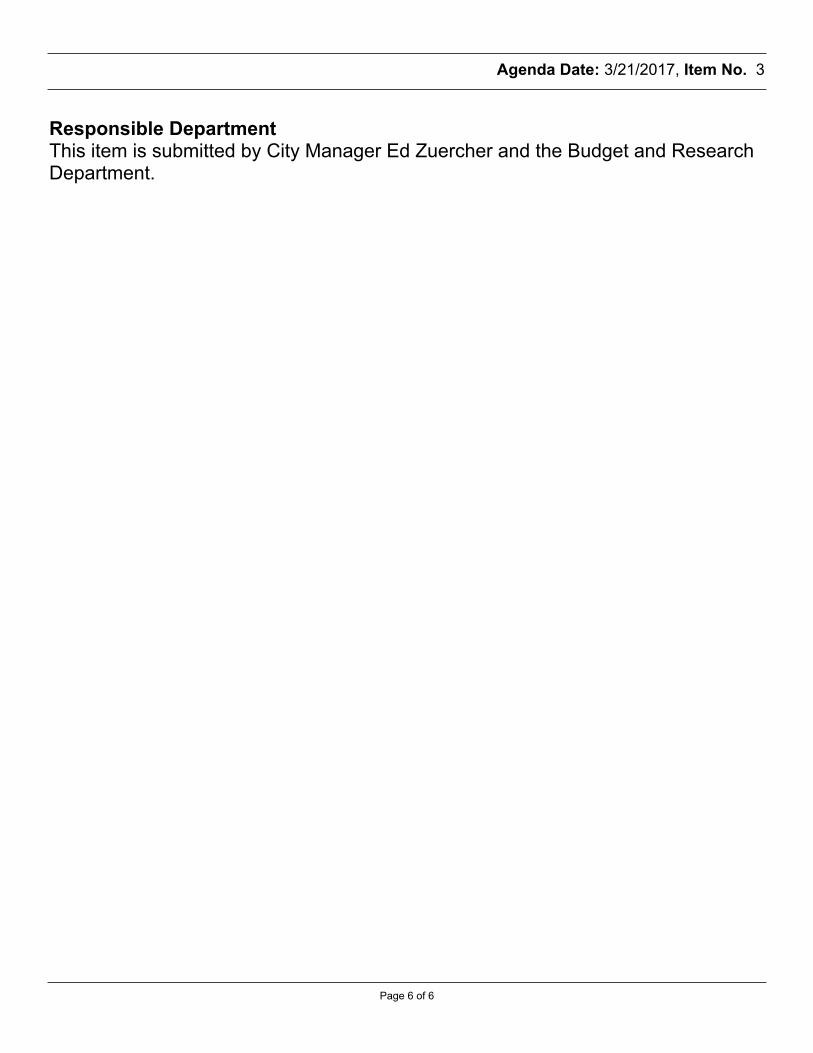
Program: Parks Maintenance 5. Add staff and materials to operate and maintain the new dog park 49,000
0.5 located at the Reach 11 facility scheduled to open in the Fall of
2017 (PPPI funds).
Program: Parks Maintenance 6. Add staff and materials to operate and maintain the new dog park
located at Deer Valley Park scheduled to open in the Fall of 2017 (PPPI funds).
40,000 0.5
Total Parks and Recreation $1,952,000 25.0
Department 2017-18
Aviation
Program: Terminal Safety, Security & Communications Center 1. Add staff, one vehicle and materials for a new Airport Command
Center which will be a multi-purpose facility consisting of an Operations Communication Center, the Emergency Operations Center, and a combined maintenance and technology work order center. The purpose of this addition is to ensure the safe, efficient and secure operation of the entire Phoenix airport complex.
$316,000 2.0
Program: Airfield Safety & Security 2. Add funding for an ambulance at Fire Station 19 to provide
dedicated services to Sky Harbor International Airport to reduce response time and provide priority services to incidents occurring at the airport. The Fire Department will dedicate staffing 12 hours per day from the current rover pool. The ambulance will remain available for Fire Station 19 utilization and response outside of those hours.
788,000 -
Program: Airfield Safety & Security 3. Add staff, one vehicle and materials to establish a new Public
Safety & Security Division to implement and oversee the Safety Management System (SMS) protocol -- an FAA mandated formal, top-down approach to managing safety and risk. The new division supports the progression of large scale airport risk management by merging the aspects of safety management, security management, risk management, and emergency preparedness.
653,000 2.0
Total Aviation $1,757,000 4.0

Planning and Development Administration
1. Convert a temporary Account Clerk III position to regular status to address increased responsibility for receivable and collection activities associated with the Annual Facilities Program and Elevator Inspection Program as recommended through a cash handling audit.
$61,000 -
Program: Impact Fees Program Support
2. Add a Planning and Development Team Leader position to support development planning through growth forecasting, infrastructure planning, and administration of the Impact Fee Program. This will allow for better infrastructure coordination between the city, new projects and existing residents.
116,000 1.0
Administration 3. Add a Principal Engineering Technician position to assist with
increased responsibilities of regulatory, staffing and financial tasks in the Payments and Submittals section as recommended through a cash handling audit.
93,000 1.0
Administration 4. Add a GIS Coordinator position for overseeing the day to day
functions of the GIS section and the quality control of maps and spatial data, and to enhance the accuracy of geographical information and data for customers. This will allow for increased stakeholder access to mapping and GIS data to better serve the public.
98,000 1.0
Administration
5. Add a Lead Business Systems Analyst and a Senior Business Systems Analyst position to support numerous department applications including the replacement of the department’s business application, support Business Intelligence efforts and provide training and support to end users.
206,000 2.0
Program: Site Planning
6. Convert a temporary Secretary III position to regular status. This position provides critical administrative support and customer service to address the increased public interest and workloads in site development, landscape, hillside, abandonments, and signage areas. This will allow for better current project records management and service to the public.
63,000 -
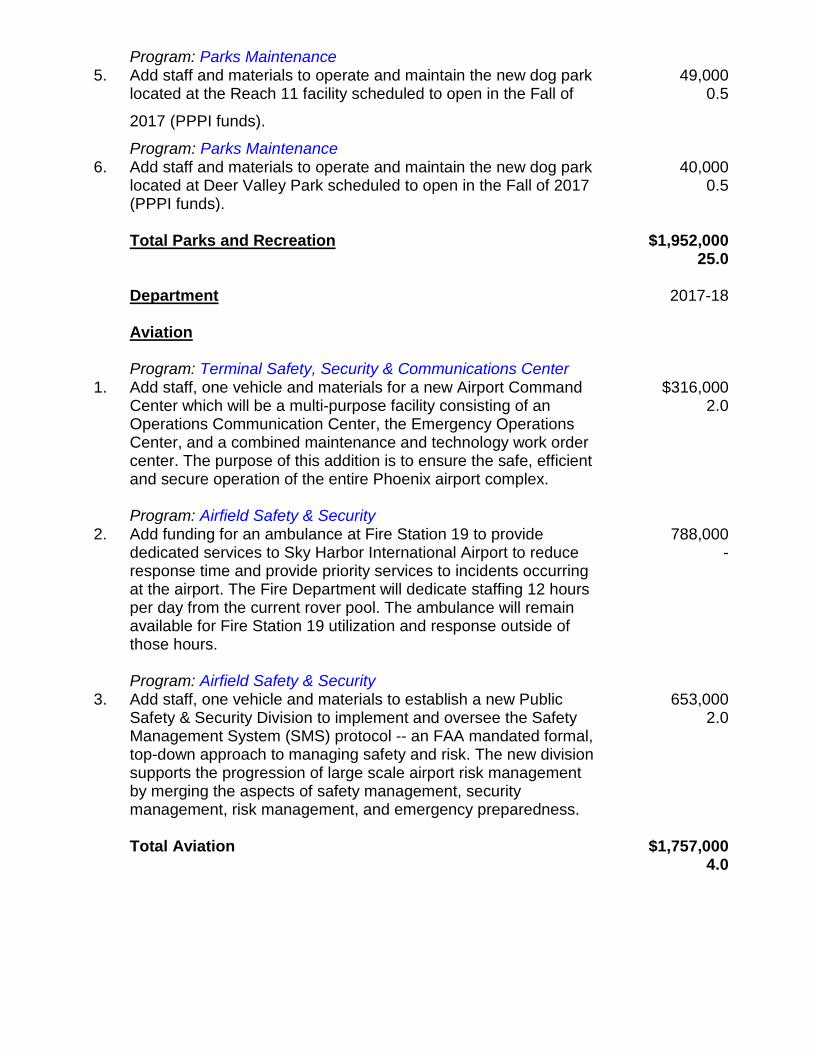
Program: Site Planning 7. Add a Planner II position to manage and draft text amendments,
provide training and outreach to development organizations, andensure development submittals have the most up to date ZoningOrdinance and City Code information and requirements for amore efficient and streamlined permit process. This position alsoallows for enhanced stakeholder input into the drafting andprocessing of text amendments.
94,000 1.0
Administration 8. Convert a temporary Management Assistant II position to regular
status. This position is responsible for writing, reviewing andprocessing a high volume of city council reports generated as aresult of increased development activity. This position will alsohandle an increased volume of constituent requests forinformation.
101,000 -
Program: Site Planning 9. Add three positions (Planning and Development Team Leader,
Planner I and an Engineering Technician) to assist the SitePlanning Section with meeting department timeframes for planreviews within five days or less. These new positions will allowthe department to reorganize the section into major and minorsite planning areas to enhance customer service and betteraddress workloads. It will also allow for enhancedcommunication with the public on complex infill projects.
262,000 3.0
Administration 10. Convert 1.8 FTE of temporary part-time Administrative Intern
positions to regular part-time status. These positions areassigned to various divisions and conduct project research, drafttext amendments, review processes, provide information atcounters and assist with general administrative functions.
63,000 -
Program: Commercial Plan Review and Inspections 11. Add four positions (Civil Engineer II, Mechanical Plans Examiner
II, Electrical Plans Examiner II and Structural Plans Engineer) tomaintain service levels as workloads are increasing with morecomplex commercial and civil development projects.
379,000 4.0
Program: Commercial Plan Review and Inspections 12. Add four positions (Structural Inspector II*Ind/PR, Electrical
Inspector II*Ind/PR, Plumbing and Mechanical Field Supervisorand a Fire Prevention Specialist II) and convert a newly addedPlumbing and Mechanical Inspector II temporary position toregular status to maintain inspection service levels as workloadsare increasing with more commercial development projects.
588,000 4.0

Program: Residential Plan Review and Inspections 13. Add five positions (Chief Engineering Technician, Senior
Engineering Technician, two Principal Engineering Technician and Engineering Technician) to maintain service levels given increased residential and related civil construction projects.
394,000 5.0
Program: Residential Plan Review and Inspections
14. Add five positions (General Inspector Field Supervisor, Civil Inspector Field Supervisor, Civil Inspector III, and two Civil Inspector II), and convert newly added temporary General Inspector II and Principal Engineering Technician positions to regular status, along with vehicles, to maintain inspection service levels given increased residential and related civil construction projects.
830,000 5.0
Total Planning and Development $3,348,000
27.0
Public Transit Program: Local Fixed Route Bus Service
1. Add funding to increase bus service in the City of Phoenix as a result of funding from the Phoenix Transportation 2050 Plan. Effective October 2017, potential service increases include extensions for Routes 19 and 60, and increased mid-day frequency during weekdays on Routes 29 and 50. Effective April 2018, potential service increases include extensions for Routes 32, 51, 3, 17, 29, and 41.
$1,876,000 -
Program: Regional Fixed Route Support
2. Add funding for the following positions: Senior Information Technology Systems Specialist, Information Technology Application Programmer II, and User Technology Specialist. These positions will support the upcoming technology improvements under the Phoenix Transportation 2050 Plan.
305,000 3.0
Total Public Transit $2,181,000
3.0

Solid Waste
Program: Contained Residential Collection 1. Add funding for three positions (two Solid Waste Supervisors and
a Project Manager) to establish the Solid Waste Apprenticeship Program as required in the 2016-2019 Memorandum of Understanding between LIUNA Local 777 (Unit 1) and the City of Phoenix. This will help build a pipeline of skilled labor for our future workforce. The funding includes two light duty trucks, three refurbished automated side loaders, two refurbished rear loaders, two trailers and two articulated loaders.
$1,744,000 3.0
Program: All Solid Waste Divisions 2. Add funding for four positions (two Solid Waste Supervisors and
two Foreman) to expand the Solid Waste Safety Program. The funding includes one refurbished automated side loader, one refurbished rear loader, one trailer, one articulated loader, three standard bed trucks and one light-duty vehicle. Adding the dedicated resources will support effective and consistent training without impacting daily operations.
1,060,000 4.0
Program: Institutional Collection and Special Services 56,000 3. Add funding for one Solid Waste Worker to support the
anticipated increase in collection services as well as provide support for diversion programs associated with the Reimagine Phoenix Campaign and the 40% diversion by 2020 initiative.
1.0
Total Solid Waste $2,860,000 8.0
Total Proposed Non-General Fund Additions $12,098,000 67.0

Non-General Fund Administrative Conversions
Department 2017-18 Aviation
Program: Airfield Management & Maintenance; Capital Management & Support
1. Convert eleven temporary full-time positions to regular status to provide airport response for emergencies and incidents, monitor existing airside facilities, perform runway and taxiway inspections, perform required inspections on FAA grant funded construction projects, and provide administrative support for transportation network companies at Sky Harbor Airport.
- -
Total Aviation $-
-
Information Technology Program: Enterprise Business Applications 1. Convert one full-time temporary Senior IT Systems Specialist to
regular status. This position is funded by the Solid Waste Management Program to support business intelligence and data management functions.
$- -
Total Information Technology $-
- Total Proposed Non-General Fund Administrative
Conversions $-
-

ATTACHMENT C
Locations for 2017-18 Community Budget Hearings
Date/Time Council District(s)
Location Information
Tuesday, April 4, 2017 8:30 am
D1/D5 Helen Drake Senior Center 7600 N. 27th Avenue
Tuesday, April 4, 2017 8:30 am
D6 Pecos Community Center Multi Purpose Room 17010 S. 48th St.
Tuesday, April 4, 2017 6:00 pm
D4 Steele Indian School Park Memorial Hall 300 E. Indian School Road
Tuesday, April 4, 2017 6:00 pm
D5 Pendergast Community Center 10550 W. Mariposa Street
Tuesday, April 4, 2017 6:00 pm
D6 Devonshire Community Center Auditorium 2802 E Devonshire St.
Wednesday, April 5, 2017 6:00 pm
D4/D8 Phoenix Children’s Hospital Melvin L. Cohen Conference Center 1919 E. Thomas Road
Thursday, April 6, 2017 8:00 am
D3 Shadow Mountain Senior Center 3546 E. Sweetwater Avenue
Thursday, April 6, 2017 8:30 am
D8 Senior Opportunities West Senior Center 1220 S. 7th Avenue
Thursday, April 6, 2017 6:00 pm
D1/D2 Goelet A. C. Beuf Community Center Multi Purpose Room 3435 W. Pinnacle Peak Rd
Tuesday, April 11, 2017 6:00 pm
D4/D7 Encanto Park Clubhouse Ballroom 2605 N. 15th Ave.
Tuesday, April 11, 2017 6:00 pm
Citywide First Institutional Baptist Church 1141 E. Jefferson St
Wednesday, April 12, 2017 6:00 pm
D3 North Mountain Visitor Center 12950 N. 7th Street
Wednesday, April 12, 2017 6:00 pm
D7/D8 Cesar Chavez High School Cafeteria 3921 W. Baseline Road
Tuesday, April 18, 2017 6:00 pm
Citywide Spanish/English
Maryvale Community Center Auditorium 4420 N. 51st Avenue
Wednesday, April 19, 2017 6:00 pm
D2/D3 Paradise Valley Community Center Multi Purpose Room 17402 N. 40th St.
Wednesday, April 19, 2017 6:00 pm
Citywide Youth
Metro Tech High School Banquet Hall 1900 W. Thomas Road
Thursday, April 20, 2017 6:00 pm
D3 Sunnyslope Community Center Multi Purpose Room 802 E. Vogel

1
BUDGET AND RESEARCH DEPARTMENT REPORT B.R.D. NUMBER
2017-08 SUBJECT General Fund Revenue Estimates
DATE ISSUED March 21, 2017
This report provides additional detail on General Fund (GF) revenue estimates to explain recommended revenue projections. The City is committed to providing a transparent and open budget process. Providing this information enhances the review and understanding of how revenue projections are developed to better facilitate discussions during the annual budget development process.
Careful examination of revenue estimates is required to ensure projections are as accurate as possible in order to maintain fiscal stability and long term budget management. Predicting future revenue growth is challenging and requires consistent and diligent analysis based on sound forecasting principles and methods. Revenues are monitored closely and an updated revenue report is prepared and distributed to the City Manager’s Office, the City Council and the community for review monthly. General Fund revenues are comprised of several categories all of which are unique and require separate analysis. The primary revenue categories include: local taxes and related fees, primary property taxes, state shared sales, income and vehicle license taxes, and user fees and non-tax revenues.
Included in this letter is an explanation of how GF revenue is projected, the sources relied upon to assist in developing estimates, economic assumptions and the methods used to analyze revenues. Also included are historical revenue actuals and growth rates, the recommended revenue estimates for 2016-17 and 2017-18 and an explanation of the influencing factors used by staff in conducting analysis for each major revenue category. The below table summarizes the 2016-17 and 2017-18 estimated GF revenues and the primary reason for the variance:
GF Revenue Category (millions)
2016-17 Estimate
2017-18 Estimate
Amount Change
Percent Change
Primary Reason for Difference
Local Taxes $445.8 $458.4 $12.6 2.8% Continued moderate improvement in sales tax collections expected.
Primary Property Tax 145.1 153.5 8.4 5.8% Increase in assessed property valuation.
State Shared Sales Tax
143.5 149.0 5.5 3.8% Continued growth expected through FY 17/18.
State Shared Income Tax
191.4 196.3 4.9 2.6% Already known collections (based on FY 15/16 collections).
State Shared Vehicle License Tax
61.2 62.7 1.5 2.5% Continued increases in vehicle sales expected through FY 17/18.
User Fees & Non-Taxes
120.8 120.4 (0.4) (0.3%) Accounts for one-time revenues for criminal offense fines and recovery of damage claims in FY16/17.
Total $1,107.8 $1,140.3 $32.5 2.9%
ATTACHMENT D
2
Revenue Projections & Trusted Sources
Projecting revenues involves complex analysis and continuous monitoring to identify variances and recommend adjustments so that expenditures do not exceed available resources and a balanced budget can be maintained. As part of the overall forecasting process, assumptions about the direction and strength of the national, state and local economy are considered along with indicators such as population, job growth and personal income. Information on program and service activity levels, rates, and fees that influence certain revenues are evaluated and proposed legislation is monitored to determine potential impacts to revenue categories such as sales taxes, state shared revenues, emergency transportation service revenues and property taxes. In addition, information from city departments on user fees and non-tax revenue is requested and analyzed each year as part of the technical budget review process. Finally, trusted economic and financial sources are relied on to provide certain revenue projections and insight into the overall direction and strength of the economy and include experts from the State’s Finance Advisory Committee (FAC), Joint Legislative Budget Committee (JLBC), Arizona State University, University of Arizona (UofA) Economic and Business Research Center (EBRC), Arizona Department of Revenue, National Blue Chip, Western Blue Chip, and the US Bureau of Labor Statistics.
The city is also a member of the Forecasting Project through the EBRC at the UofA. This project is a community-sponsored research program providing project members with economic forecasts for Arizona and the Phoenix-Mesa metro area. Budget & Research (B&R) staff attends quarterly meetings, participates in discussions with other local government and private enterprise members, and receives quarterly economic reports. In the fall of 2014, B&R consulted with the UofA to enhance the City’s sales tax revenue forecasting process. Dr. George Hammond, EBRC Director, and Dr. Alberta Charney, Senior Research Economist, spent several months working with staff to develop an enhanced econometric forecasting model for sales tax and it is planned to re-visit the econometric forecasting model this summer. The additional consulting with Drs. Hammond and Charney provided the City with solid, independent economic and statistical expertise used to develop a statistically valid forecasting model specifically for the City of Phoenix. The FY 2017-18 projected growth rates for city and state sales tax are based on estimates developed using the enhanced econometric forecasting model. Economic Assumptions Several of the primary revenue categories are influenced by the economy and the sources mentioned above provide valuable information about the expected growth of the economy. These sources are used in developing projected revenue growth rates. B&R staff continuously monitors economic variables and what these experts are predicting when developing revenue estimations. The overall consensus from these trusted sources is economic growth in Arizona and the Phoenix Metro area is anticipated to continue, and outpace the U.S economy, however at a pace that is slower than previous recoveries. They do predict economic expansion will continue but at a moderate pace with no recession on the forecast horizon. The greater Phoenix area has regained the jobs lost during the Great Recession. Through December 2016, employment is 106.7% recovered (U.S. Bureau of Labor Statistics). However, the mix of employment is different from the composition of the economy in past expansion years, and the per capita personal income is below national average, ranked 42nd among all states (Economic Forecasting Luncheon, December 2016). While the economy still faces challenges, the outlook is positive. They predict the metro Phoenix economy will continue to strengthen over the next few years with job growth reaching 3.4% by 2018, personal income growth of 7.0% and population growth of 2.1% (Economic Outlook, 2016 4th Qtr report).

3
Revenue Forecasting Methods Several forecasting methods and practices are used to estimate city revenues and will vary depending on the type of revenue being analyzed. Evaluating historical growth patterns and current actuals is an important component to analysis and provides insight into the direction of the various revenue categories and the growth needed to achieve estimated revenues. Information is also collected from the economic sources mentioned earlier to ensure current and subsequent year estimates are reasonable and in-line with what these experts are predicting. The State FAC provides valuable information from a panel of respected economists and financial professionals. Included in their materials are projections of state sales tax and income tax collections. These projections are considered when developing city sales tax and state shared sales and income tax revenues for both the current and subsequent fiscal years. Additionally, information is collected from city departments during the annual technical review process which is needed to analyze the user fee and non-tax revenue category. The department’s knowledge of the revenues generated by various city programs and services is essential to developing accurate projections. Staff also considers one-time revenues, adjustments and contractual agreements impacting growth when developing estimates. In conjunction with considering historical growth, current trends, and information from trusted sources and departments, B&R staff uses several forecasting methods when preparing recommended estimates. The most common methods of revenue estimation used are: averages of actual revenue experience by varying time periods, annualization of year-to-date actuals, and most often a percent of prior year method. This last method involves analyzing the amount of revenue collected at a point in time during prior fiscal years, for example seven months, represented as a percentage of the total collections for the entire fiscal year and then applying that percentage to current year-to-date actuals. This method accounts for the seasonal nature of many city revenues and is often a more effective method than using an averages or annualizing approach. Additionally, the growth rate needed to reach the budgeted or estimated revenue is considered. If the percentage growth needed for the remaining months of the fiscal year is substantially higher or lower than the current growth rate, adjustments are made to arrive at a new estimated revenue amount for the fiscal year.
Once the current fiscal year estimate is developed, assumed growth rates are then applied to this amount to arrive at a projected revenue amount for the following fiscal year. These assumed growth rates take into account historical and recent trends in revenue data, one-time revenue adjustments, and information from city departments and our trusted sources to ensure projections are not overly conservative or aggressive. Finally, as part of the annual budget development process each year, revenue estimates are presented to the City Manager’s Office, the City Council and the community as part of the Trial and recommended budgets for consideration and approval prior to final budget adoption in June.

4
General Fund Revenue To assist in explaining the basis for how GF revenue is estimated for each of the major categories, historical revenue growth and estimated revenues for the 2016-17 and 2017-18 fiscal years are provided graphically, along with a description of the revenue category and the methodology used to develop recommended revenue estimates beginning with total GF revenue. Total General Fund Revenue
$1,037$993
$947 $958 $948 $981$1,026
$1,053 $1,075 $1,108 $1,140
3%-4% -5%
1% -1%3% 5% 3% 2% 3% 3%
-70%
-60%
-50%
-40%
-30%
-20%
-10%
0%
10%
20%
200
400
600
800
100 0
120 0
140 0
Actual & Estimated General Fund Revenue $ % Change
$Millions
*2017-18 estimate accounts for a transfer of jet fuel sales and use tax revenues from General Fund to Aviation Fund effective in December 2017 due to a Federal Aviation Administration (FAA) policy requirement. Projections for 2016-17 and 2017-18 also assume no fee increases, changes to state shared revenue formulas or legislative actions to reduce General Fund revenues. As mentioned, GF revenue consists of local taxes and related fees, primary property taxes, state shared sales, income and vehicle license taxes, user fees and non-tax revenues. Estimating revenues for each of these categories is conducted separately to more accurately predict the amount of revenues for the current and following fiscal year. Each category is unique with respect to the variables that comprise the revenue and influence growth. Variables that impact revenue growth include economic factors such as consumer sentiment, discretionary income, population, unemployment, job growth and construction activity. Other influencing factors may include: legislative action, City Council policy directives, legal restrictions and mandates, state statutory formulas, program enhancements or reductions, and changes in rates and fees. For these reasons, evaluating each major category separately is preferred and generates more accurate revenue projections.

5
Local Taxes and Related Fees, 40% of Total General Fund Revenue
$419
$375$355
$390$409 $413 $421 $427 $437 $446 $458
-3%
-11%-5%
10%5%
1% 2% 1% 2% 2% 3%
-70%
-60%
-50%
-40%
-30%
-20%
-10%
0%
10%
20%
200
250
300
350
400
450
500
550
600
Actual & Estimated Revenue $ % Change
$Millions
*2017-18 estimate accounts for a transfer of jet fuel sales and use tax revenues from General Fund to Aviation Fund effective in December 2017 due to a Federal Aviation Administration (FAA) policy requirement. Local taxes and related fees consist of city sales taxes, privilege license fees and other excise taxes. The majority of revenue is derived from city sales taxes which is comprised of 15 general categories collected based on a percentage of business income accruing in each category. The chart on page 7 provides the current local sales tax rates by category and the percentage allocated to each fund. Privilege license fees are assessed to recover the costs associated with administering the local tax system. Other excise taxes include the jail tax and the excise tax collected on water service accounts, which provide resources to help offset jail costs paid to Maricopa County and other GF services.
Sales tax can be volatile and typically correlates to the local economy. Increases in sales tax collections are expected when the local economy expands due to underlying fundamentals such as increases in population, discretionary income, business expansion, jobs and real estate growth. The opposite holds true during times of economic contraction or recession as evidenced in 2008-09 and 2009-10. Staff analyzes historical and recent trends in sales tax data by category, evaluates cumulative growth and uses an econometric forecasting model constructed by the UofA to develop projections. Estimates provided by the FAC and JLBC are also considered to ensure projections are reasonable and not overly aggressive or conservative in nature. The growth estimated in 2017-18 of 3% assumes continuous growth over 2016-17 and accounts for current trends in actual collections and is based on projections provided by the UofA for city sales taxes. Privilege license fees and other excise tax projections are developed using the existing fee structures, assumptions about the growth in business license applications, historical trends, averages, recent collection experience and use of the percent of prior year method to account for seasonal influences in revenue activity. Privilege license fees in 2017-18 are estimated to decrease

6
slightly due to the loss of annual license fee penalties associated with the Arizona Department of Revenue (ADOR) taking over collection of all city sales tax and related fees in January 2017. The growth estimated in 2017-18 for other excise taxes assumes conservative growth and continuation of current year-to-date experience.
Current Local Sales Tax Rates by Category
General Fund
N’hood Protection
2007 Public Safety
Expansion
Public Safety
Enhance.
Parks
& Pres.
Transp. 2050***
Conv. Center
Sports Fac.
Capital Const.
Total
Advertising – – – – – – 0.5% – – 0.5%
Contracting 0.7% 0.1% 0.2% – 0.1% 0.7% 0.5% – – 2.3%
Job Printing 0.7% 0.1% 0.2% – 0.1% 0.7% 0.5% – – 2.3%
Publishing 0.7% 0.1% 0.2% – 0.1% 0.7% 0.5% – – 2.3%
Transportation/Towing 0.7% 0.1% 0.2% – 0.1% 0.7% 0.5% – – 2.3%
Restaurants/Bars 0.7% 0.1% 0.2% – 0.1% 0.7% 0.5% – – 2.3%
Leases/Rentals/ Personal Property
1.2% 0.1% 0.2% – 0.1% 0.7% – – – 2.3%
Short-Term Motor Vehicle Rental
1.2% 0.1% 0.2% – 0.1% 0.7% – 2.0% – 4.3%
Commercial Rentals 1.3% 0.1% 0.2% – 0.1% 0.7% – – – 2.4%
Lodging Rentals Under 30 Days
1.2% 0.1% 0.2% – 0.1% 0.7% 2.0% 1.0% – 5.3%
Lodging Rentals 30 Days and Over
1.2% 0.1% 0.2% – 0.1% 0.7% – – – 2.3%
Retail (Level 1 – amounts = < $10,000 for a single item)
1.2% 0.1% 0.2% – 0.1% 0.7% – – – 2.3%
Retail (Level 2 – amounts > $10,000 for a single item)
1.2% 0.1% 0.2% – 0.1% 0.4% – – – 2.0%
Amusements 1.2% 0.1% 0.2% – 0.1% 0.7% – – – 2.3%
Utilities 2.7%* – – 2.0%** – – – – – 4.7%
Telecommunications 2.7% – – – – – – – 2.0% 4.7%
*The General Fund portion of the utilities category includes the 2.0 percent franchise fee paid by utilities with a franchise agreement. **The Public Safety Enhancement designated 2.0 percent sales tax applies only to those utilities with a franchise agreement. ***The Transportation 2050 Fund (Proposition 104) was established by the voters effective January 1, 2016 and replaced the Transit 2000 Fund (Proposition 2000) to fund a comprehensive transportation plan with a 35-year sunset date. The Proposition increased the transaction privilege (sales) tax rates by 0.3% for various business activities.

7
Primary Property Tax, 13% of Total General Fund Revenue
$103$110
$121$131 $128 $132
$144 $138 $141 $145$154
8% 7%10%
8%
-2%3%
9%
-4%2% 3%
6%
-70%
-60%
-50%
-40%
-30%
-20%
-10%
0%
10%
20%
50
70
90
110
130
150
170
190
Actual & Estimated Revenue $ % Change
$Millions
Arizona property tax law provides for two separate tax systems. A primary property tax is levied to pay current operations and maintenance expenses. Therefore, primary property tax revenue is budgeted and accounted for in the GF (and is illustrated in the above graph). A secondary property tax levy is restricted to the payment of debt service on voter approved long-term general obligation debt. Therefore, the secondary property tax revenue is budgeted and accounted for as a special revenue fund. The primary property tax levy forecast is based on an amount stated in the annual “Levy Limit Worksheet” for the City of Phoenix, issued by the Maricopa County Assessor in February, prior to the applicable fiscal year. The levy amount established by the Assessor is calculated per Arizona Revised Statute §42-17051. Subsequent fiscal year’s annual primary levy amounts are forecast by staff applying the same statutory calculation against successive prior year’s primary levy amounts. The annual amount of the primary property tax levy is limited by the Arizona Constitution to a two percent increase over the prior year levy plus an estimated levy for previously unassessed property (primarily new construction). Provisions in Chapter XVIII of the City Charter limit the City’s primary property tax rate to $1.00 per $100 of assessed valuation with the exception of costs to operate library services. The proposed 2017-18 primary property tax rate, not including the portion of the rate allocated to cover the Library Department operating costs, is $1.00 per $100 of assessed valuation.

8
State Shared Sales Tax, 13% of Total General Fund Revenue
$135
$116$107 $112 $114 $119
$127$132 $138 $144 $149
-5%
-14%-8%
5%2% 4%
7%4% 4% 4% 4%
-70%
-60%
-50%
-40%
-30%
-20%
-10%
0%
10%
20%
50
70
90
110
130
150
170
190
210
230
250
Actual & Estimated Revenue $ % Change
$Millions
State sales tax revenues received by the city are governed by Arizona State Statute §42-5029. State sales tax revenues are split between a “distribution base”, of which Phoenix receives a share, and a “combined non-shared” category, which is allocated entirely to the state. With the exception of some tax categories, the distribution base consists of either 20 or 40 percent of collections depending on the tax category. State statute §42-5029 stipulates of the monies designated in the distribution base the Arizona Department of Revenue shall pay 25 percent to incorporated cities on the basis of relative population percentages. The population share changes annually based on Census Bureau Population Estimates. The 2017-18 City of Phoenix population share is estimated to remain flat at 28.8 percent, and is based on the 2015 Census Bureau Population Estimate. State sales tax is estimated similar to how city sales tax is forecasted (described on page 6). Staff analyzes historical and recent trends in sales tax data by category and evaluates cumulative growth when developing revised estimates. Projections provided by the UofA EBRC, using an econometric sales tax model, were used to develop 2017-18 estimates; and information from the FAC and JLBC were considered to ensure current fiscal year estimates are reasonable and in-line with what these experts are projecting.

9
State Shared Income Tax, 17% of Total General Fund Revenue
$208
$221
$191
$144
$122
$148
$162
$175 $174
$191 $196
24%
6%
-14%
-25% -15%
21%
9% 8%
-1% 10%3%
-80%
-60%
-40%
-20%
0%
20%
100
120
140
160
180
200
220
240
260
280
300
Actual & Estimated Revenue $ % Change
$Millions
State shared income tax revenue, also known as the Urban Revenue Sharing Fund, was established by voter initiative in 1972 and is governed by Arizona Revised Statute §43-206. The statute stipulates that 15 percent of the net proceeds of state individual and corporate income tax collected two years prior be distributed to incorporated cities and towns. Individual cities receive their portion based on the cities’ share of the state population. The 2017-18 City of Phoenix population share is estimated to remain flat at 28.8 percent, and is based on the 2015 Census Bureau Population Estimate. This rate will change annually based on Census Bureau Population Estimates. As a result of the initiative, Arizona Revised Statute §43-201 stipulates the area of income taxation is preempted by the state and a county, city, town or other political subdivision shall not levy an income tax as long as the Urban Revenue Sharing Fund is maintained as provided in §43-206. Since state shared income tax revenue is based on actual collections from two years prior, the 2016-17 and 2017-18 projected revenue is known and is based on actual collections received in 2014-15 and 2015-16 respectively.

10
State Shared Vehicle License Tax, 6% of Total General Fund Revenue
$59$53
$50 $48 $46 $48$52
$55$60 $61 $63
-3%-10% -7%
-2% -4%
4% 7% 7% 8%2% 2%
-80%
-60%
-40%
-20%
0%
20%
20
30
40
50
60
70
80
90
100
110
120
Actual & Estimated Revenue $ % Change
$Millions
State shared vehicle license taxes have been shared with cities and towns since 1941. The tax is assessed on the basis of an ad valorem rate on each $100 in value. The value is equal to a percent of the manufacturer’s retail price at the time of initial registration. During each succeeding year, this value is decreased until the established minimum amount is reached. The Arizona Department of Transportation collects and distributes the tax according to Arizona Revised Statute §28-5808. The distribution to individual cities is based on their relative population within the county. The 2017-18 City of Phoenix population share is estimated at 40.4 percent, and is based on the 2015 Census Bureau Population Estimate. This rate will change annually based on Census Bureau Population Estimates. Vehicle License Tax revenues are often correlated to the overall strength of the economy. Similar to sales tax revenues when the economy is growing this revenue category will also exhibit growth, as illustrated in the above graph. Revenues are estimated by evaluating historical growth patterns, year-to-date cumulative growth and applying the percent of prior year method to year-to-date actuals, which accounts for the seasonality in collections. Staff will also consider projections provided by the Arizona Department of Transportation, which are published annually for this revenue source, and any available recent economic information pertaining to projections on the local economy and vehicle sales when formulating recommended current and subsequent year estimates. The growth estimated in 2017-18 of 2% assumes this category will continue to grow but at a low pace.

11
User Fees and Non-Tax Revenues, 11% of Total General Fund Revenue
$113$118
$122
$133$129
$121 $121 $125 $125 $121 $120
1% 4% 4%9%
-4% -6%1% 3% 0%
-3% 0%
-80%
-60%
-40%
-20%
0%
20%
80
100
120
140
160
180
200
Actual & Estimated Revenue $ % Change
$Millions
User Fees and Non-Tax Revenues include collections from licenses and permits, fines and forfeitures, cable television fees, user fees from several city departments designed to recover the costs of providing specific city services including Parks and Recreation, Library, Planning, Police, Fire, and Streets, other service charges including interest income, parking meter revenue, in lieu property taxes, sales of surplus property, various rental, parking and concession categories and miscellaneous service charges in Finance, Housing, Human Services and Neighborhood Services. B&R staff relies on departments to provide essential information concerning activity levels, fee increases or decreases and program changes which impact the variety of revenue sources in this category. Technical revenue reviews are conducted twice each fiscal year as part of the annual budget development process. Departments are asked to provide revenue estimates and reasons for changes from prior year actuals. Staff conducts a line-item analysis of all revenues and uses various methods including annualization and percent of prior year, as well as consideration of one-time and contractual revenues, program enhancements or reductions and other adjustments when developing estimates. The growth estimated in 2017-18 of -0.3% accounts for one-time revenues for criminal offense fines and recovery of damage claims in 2016-17. In addition to the technical reviews that are conducted twice each fiscal year, B&R staff monitors revenues monthly to determine if adjustments to projections are necessary. The proposed estimates are then reviewed by B&R management and finally incorporated into the GF proposed revenue projections for consideration by the City Manager, the City Council and the community.

12
This report is for informational purposes only and is intended to provide the City Council and the community with explanations on how GF revenues are analyzed and developed to better facilitate discussions during the annual budget development process.
Dan Wang Budget Analyst III