this report contains assessments of ... gain publications...sesame seed production post expects that...
TRANSCRIPT

THIS REPORT CONTAINS ASSESSMENTS OF COMMODITY AND TRADE ISSUES MADE BY
USDA STAFF AND NOT NECESSARILY STATEMENTS OF OFFICIAL U.S. GOVERNMENT
POLICY
-
Date:
GAIN Report Number:
Post:
Report Categories:
Approved By:
Prepared By:
Report Highlights:
In contrast to the huge drought-related losses in grain production, Ethiopia’s production of major
oilseeds – sesame, Niger seed and soybeans – is expected to increase to nearly 790,000 metric tons in
MY15/16 (Oct-Sep). Sesame exports – one of the Ethiopia’s biggest sources of foreign exchange – are
forecast at 318,000 metric tons, just shy of the current record. Oilseed production and consumption,
especially for soybeans, is expected to keep growing as demand increases for cooking oil and livestock
feed ingredients.
FAS/Addis Staff
Michael G. Francom
Oilseeds and Products
Ethiopia’s Oilseed Production Forecast to Increase Despite
Drought
Addis Ababa
Ethiopia
ET1611
4/22/2016
Public Voluntary

Background on Ethiopia’s Oilseed Production Situation
Ethiopia’s oilseed sector, which is rapidly growing to meet both local and foreign demand, plays a
vitally important economic role in generating foreign exchange earnings and income for the country. In
fact, approximately one-fifth of Ethiopia’s total export earnings are generated from oilseed exports, with
sesame being the second largest export-revenue generator after coffee. Last year, sesame exports were
valued at little more than $480 million, while Niger seed added just 14 million. In addition, the oilseed
sector provides income to millions of growers and others involved in processing and trading.
In contrast to grain production, the impact of the drought on oilseed production was minimal. In fact,
the production of major oilseeds – sesame, Niger seed and soybeans – is forecast to increase by 28,000
metric tons to 788,000 metric tons in MY15/16 (Oct-Sep). This increase is attributed to anticipated
production gains of sesame and Niger seed, which require relatively less moisture compared to other
crops. As for soybeans, production fell slightly because of insufficient moisture. Looking further
ahead, production of oilseeds is likely to increase to meet the growing demand for cooking oil and
livestock ingredients, most notably soybean meal for poultry production.
Table 1: Annual Production Volume of Major Oilseed Crops
Crop/Year 2014/15 2015/16 Year-to-Year Variation
%
Change
Sesame 464,000 487,000 23,000 5%
Niger seed 224,000 235,000 11,000 5%
Soybean 72,000 66,000 (6,000) -8%
Total 760,000 788,000 28,000 4%

Sesame Seed
Production
Post expects that sesame production will reach approximately 487,000 metric tons in MY15/16, up by 5
percent or 23,000 metric tons compared to previous year’s production volume. This anticipated increase
is based on favorable weather conditions and an expansion in area planted. The limited amount of
rainfall resulting from the drought did not adversely impact national sesame production since sesame
requires relatively less moisture compared to other crops. Having said this, there were pockets where
sesame production was damaged or completely destroyed because the rains started too late and were
followed by unexpected heavy rains during the harvest. These losses, though, were more than offset by
production gains in other growing areas.
MY16/17 production is likely to contract slightly to somewhere around 450,000 metric tons since
farmers are likely to switch to other crops, such as sorghum, cotton, and soybeans, in response to the
weakening of domestic and international sesame prices with China cutting back on consumption. See
table 2 for production numbers and figure 3 for price trends.
Looking further into the future, production is likely to expand as more land is cultivated in sesame. In
fact, according to National Sesame Sector Development Strategy, the climate and geographies in some
locations in the eastern half and southern parts of the country in Afar, Somali, and SNNP regions are
conducive to growing sesame. See figures 1 and 2 for sesame growing areas. Commercial and small-
scale production in these areas has already started. The question of how much production will increase
as these new areas come on line will depend on a large extent on international sesame prices and the
trade-off with other crops. In addition to more acreage opening up in the future, the utilization of new
technologies, modern farming practices, and improved inputs, like seeds, would also have a tremendous
boost to annual sesame production. According to industry sources, these modifications could increase
yields by more than double their current level of 0.76 metric tons per hectare.
Sesame is one of the high-value, export crops that is of paramount importance to the wellbeing of
Ethiopia’s national economy. It is the single most widely produced oilseed crop in the country,
representing more than one-third of Ethiopia’s total oilseed production. Ethiopia is fourth largest
producer of sesame seed in the world behind India, China and Sudan.
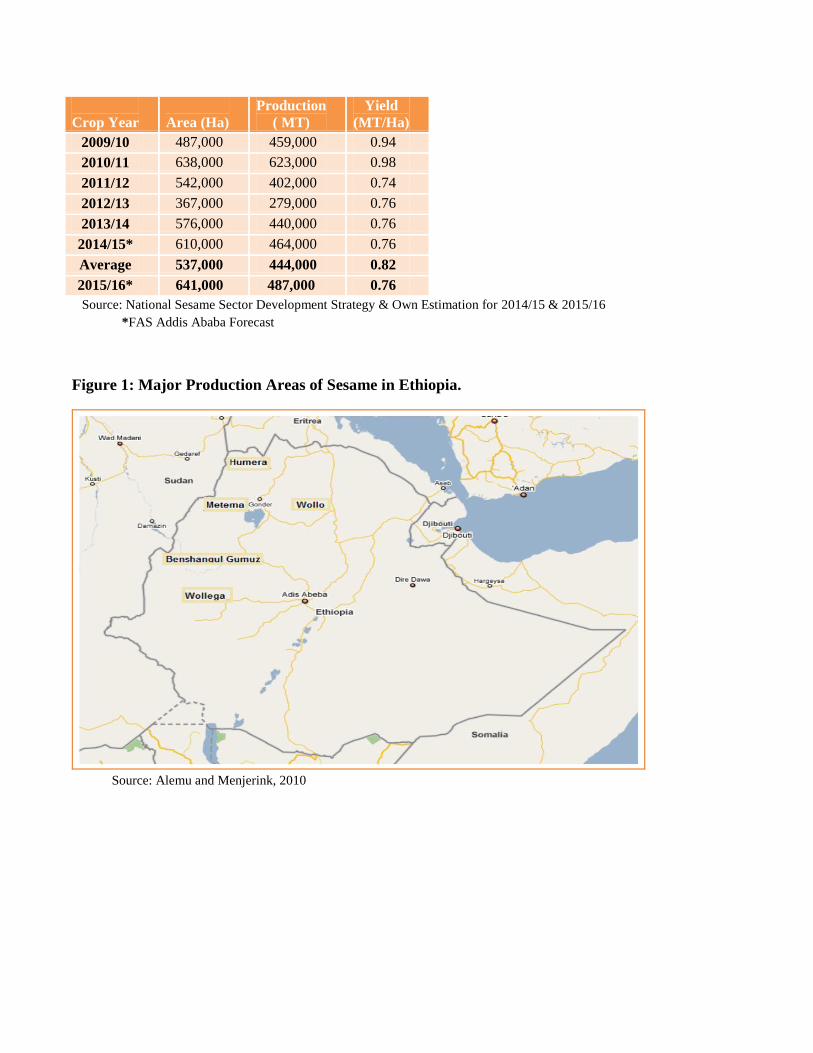
Sesame is produced mainly in the northern and northwestern lowlands of Ethiopia adjacent to the
borders with Sudan and Eritrea. Some of the major producing areas are found in and around the
locations of Humera, Metema, Benshungul Gumuz, Wollo and Wellega. The two most widely known
sesame varieties – Humera and Wollega – derive their names from the areas where they are planted.
Planting is done in late June and early July and harvesting is done from early October to mid-November.
About two-thirds of production comes from smallholder farmers on holdings less than five hectares with
the remainder coming from medium to large-scale commercial farms.
Table 2: Trend of Ethiopia’s Sesame Production, Acreage, & Yield
Crop Year
Area (Ha)
Production
( MT)
Yield
(MT/Ha)
2009/10 487,000 459,000 0.94
2010/11 638,000 623,000 0.98
2011/12 542,000 402,000 0.74
2012/13 367,000 279,000 0.76
2013/14 576,000 440,000 0.76
2014/15* 610,000 464,000 0.76
Average 537,000 444,000 0.82
2015/16* 641,000 487,000 0.76
Source: National Sesame Sector Development Strategy & Own Estimation for 2014/15 & 2015/16
*FAS Addis Ababa Forecast
Figure 1: Major Production Areas of Sesame in Ethiopia.
Source: Alemu and Menjerink, 2010

Figure 2: Suitable Areas for Sesame Cultivation in Ethiopia
Source: National Sesame Sector Development Strategy (2015-2019)
Consumption
MY15/16 consumption is forecast to remain relatively unchanged from last year at 184,000 metric tons.
This figure is expected to show modest gains in the future as food processors use more sesame in value-
added products such as locally-produced tehani and halva.1 Some of these value-added products will
likely also go for export.
Unlike other international sesame producers, Ethiopia’s sesame is mainly produced for the international
market, with close to 75 percent going for export. The sesame that is not exported is mostly used for
seed, oil crushing, and baked products.
Ethiopian sesame, specifically the Humera/Gonder variety, is well known for its uniformity, white color,
large size, aroma and sweet taste. These characteristics make it suitable for use in local and
international baked products, such as hamburger and sandwich buns. The major competitive advantage
of the Wellega type is its high oil content.
Trade
1 Tahini is a paste made of roasted hulled sesame seeds that is used in dressing, hummus, sauces and traditional foods of
Middle East.

Sesame exports are forecast to reach 318,000 metric tons in MY15/16, just shy of the current record and
up nearly 25,000 metric tons from the preceding year. This increase is attributed to larger production
volumes. MY14/15 exports hit slightly more than 270,000 metric tons, valued at $483 million. China
alone accounted for nearly 58 percent of Ethiopia’s sesame exports, with Israel and Turkey – the second
and third largest destinations – taking 18 and 4 percent, respectively. The heavy reliance on China
suggests a greater need for export market diversification in order to better weather downturns in Chinese
demand.
Sesame is Ethiopia’s single largest exported oilseed and, as was previously mentioned, is an important
generator of foreign exchange. About 95 percent of exports are in the form of unprocessed seeds,
leaving opportunity for value-addition prior to export. Ethiopia is the second largest sesame exporter
after India.
Local and international sesame prices, which are closely linked to one another, are trending downward
because of increased global production levels and softening demand in China. The price of
Humera/Gondar sesame – the reference price for international markets – being traded on the Ethiopia
Commodity Exchange (ECX) has dropped from about $1,360 per metric ton in January 2015 to nearly
$860 per metric in January 2016. See figure 3 for price trends. Local traders are complaining that
prices have dropped below “acceptable levels”. Meanwhile, the drop in prices is pinching farmers who
are facing difficulties paying off loans. Lower prices are also expected to push farmers to plant
alternative cash crops until sesame prices rebound. (Note: Since this report was prepared, the price of
sesame has slightly rebounded, but is still below previous year’s levels.)
While prices are down, the volume of sesame traded at the ECX trading floor is at record levels as
traders scramble to sell before prices drop further. The total traded volume for the month of January
2016 hit a record high of nearly 72,000 metric tons, surpassing the same period last year by 47 percent
or 23,000 metric tons. See figure 5 for ECX monthly trade volumes.
With the creation of ECX in 2009, sesame trading was required to be conducted through this exchange.
Farmers’ cooperative unions and commercial farmers are exempt from this requirement and can sell
directly to international buyers. For sesame exported to China, the National Bank of Ethiopia (NBE)
requires the Letter of Credit to be done by the Commercial Bank of Ethiopia (CBE). Other Ethiopian
private banks see this as a discriminatory practice. Meantime, local processors using sesame for value-
added activities, such as crushing or roasting, can buy directly from designated primary market centers
without going through ECX.
Table 2: Annual Trend of Ethiopia’s Sesame Exports
Year
Volume
(MT)
FOB Value
(‘000 USD)
% Growth
Volume Value

2007/08 124,291 185,058 - -
2008/09 238,804 314,997 92% 70%
2009/10 238,832 320,983 0% 2%
2010/11 218,105 300,656 -9% -6%
2011/12 331,187 436,754 52% 45%
2012/13 222,705 390,625 -33% -11%
2013/14 270,234 619,033 21% 58%
2014/15 292,298 482,812 8% -22%
Average 242,057 381,365 19% 19%
2015/16* 318,000
Source: MoT and EPOSPEA
*FAS Addis Ababa Forecast
Source: Own graph, data from ECX. (Price is converted to US $ based on established exchange rate.)

Source: Own graph, data from ECX
Production, Supply, and Demand, PSD (1000 HA, 1000 MT)
Oilseed, Sesame seed 2014/15 2015/16
Market Year Begins Oct 2014 Oct 2015
Ethiopia New Post New Post
Area Harvested 611 641
Beginning Stocks 58 52
Production 464 487
MY Imports 0 0
MY Imports from US 0 0
Total Supply 522 539
MY Exports 292 318
Crush 0 0
Food Use Dom. Cons. 47 49
Feed Waste Dom. Cons. 131 134
Total Dom. Cons. 177 184
Ending Stocks 52 38
Total Distribution 522 539

Niger Seed
Production
The late rains and uneven rainfall in the Niger seed-producing areas reportedly did not impact MY15/16
production. In fact, production for this period is projected to increase to 235,000 metric tons, an
increase of 5 percent, or 11,000 metric tons, compared to the previous year. Yields are estimated at
0.98MT/HA, while total area harvested is projected at 240,000 hectares.
Over the last several years, Niger seed production has shown steady growth, most of which is attributed
to increased yields. Production has increased about 50 percent since MY09/10 when production figures
stood at nearly 158,000 metric tons. See table 3 for historical production data. Most of this recent
growth in production was spurred by increased demand for locally-produced cooking oil.
Niger seed, which is also known as noug, is the second most widely-produced oilseed crop in Ethiopia,
accounting for a little more than a quarter of total oilseed production and accounting for 28 percent of
area planted to oilseeds. More than 95 percent of production is concentrated in the highlands of Oromia
and Amhara regions. Horogudru, East Wellega and West Wellega zones are the main surplus-producing
areas in the Oromia region, while East Gojjam, West Gojam, North Gondar, and South Gondar zones are
the top surplus-producing areas in the Amhara region. Figure 5 shows the major Niger seed producing
areas in the country.
Table 3: Niger Seed Production, Acreage, & Yield
Crop Year Area (Ha) Production (MT) Yield (MT/Ha)
2009/10 256,794 157,847 0.61
2010/11 247,329 144,847 0.59
2011/12 308,286 186,321 0.60
2012/13 301,488 212,416 0.70
2013/14 285,303 220,211 0.77
2014/15 252,584 224,463 0.89
Average 275,297 191,018 0.69
2015/16* 240,000 235,000 0.95
Source: CSA and Own Estimation for 2015/16.
*FAS Addis Ababa Forecast
Figure 5: Niger Seed Production Distribution in Ethiopia

Source: Analysis of Genetic Diversity of Guizotia, Yohannes Petros.
Consumption
Consumption is projected to climb to 160,000 metric tons in MY15/16, up roughly 12,000 metric tons
from the preceding year due to increased demand for cooking oil. Consumption is expected to keep
growing in the coming years as demand for oil and livestock feed continue to expand.
The oil from Niger seeds makes up about 44 percent total edible oil consumption in the country. The
noug cake, which is the by-product from Niger seed oil extraction process, is used for livestock feed,
especially in animal fattening and dairy rations. In a recent ILRI study, Noug cake was cited as the
primary source of aflatoxin detections in samples taken from the commercial milk supply of Addis
Ababa.
Trade
With growing local demand for edible oil, MY15/16 Niger seed exports are forecast to continue their
recent downward slide, falling to 14,000 metric tons. In MY14/15, Ethiopia exported about 15,400
metric tons of Niger seed, valued at $14.4 million. Historically, Ethiopia has exported about 10 percent
of production.
The United States is the top destination for Ethiopian Niger seed, accounting for about 80 percent of
total exports, while the second largest market, the European Union, accounts for roughly 15 percent of
exports. Niger seed exports to the United States require heat treatment in accordance with USDA

requirements. At present, there is only one eligible company, which USDA inspects annually, which
treats the seeds prior to shipment, while shipments from all other suppliers are required to undergo heat
treatment upon arrival in the United States.
Table 4: Annual Trend of Ethiopia’s Niger seed Export
Year Volume
(MT) FOB Value (‘000 USD)
% Growth
Volume Value
2007/08 26,642 33,173
2008/09 44,654 37,921 68% 14%
2009/10 49,614 31,656 11% -17%
2010/11 25,552 16,773 -48% -47%
2011/12 15,183 11,716 -41% -30%
2012/13 29,782 23,640 96% 102%
2013/14 16,630 12,510 -44% -47%
2014/15 15,402 14,352 -7% 15%
Average 27,932 22,718 5% -1%
2015/16* 14,400
Source: EPOSPEA and Own estimation for MY 2015/16
*FAS Addis Ababa Forecast
Table 5: Volume and Value of Niger seed Exports in MY 2014/15
S/N
Destination Country
MY 2014/15
Volume Value Market Share
( Value)
1 USA 12,206 11,411 79.5%
2 UK 1,591 1,403 9.8%
3 Germany 229 213 4.3%
4 Italy 172 154 1.5%
5 Belgium 658 611 1.1%
6 Singapore 117 132 0.9%
7 Netherlands 95 82 0.6%
8 Israel 46 42 0.3%
9 Turkey 39 30 0.2%
Others 250 274 1.9%
Grand Total 15,402 14,352 100.0%
Source: Ministry of Trade (MoT)
Production, Supply, and Demand, PSD (1000 HA, 1000 MT)
Oilseed, Niger seed 2014/15 2015/16

Market Year Begins Oct 2014 Oct 2015
Ethiopia New Post New Post
Area Harvested 253 240
Beginning Stocks 10 16
Production 224 235
MY Imports 0 0
MY Imports from US 0 0
Total Supply 234 251
MY Exports 15 14
Crush 55 60
Food Use Dom. Cons. 85 93
Feed Waste Dom. Cons. 63 67
Total Dom. Cons. 148 160
Ending Stocks 16 17
Total Distribution 234 251

Soybeans
Production
Owing to the late rains and uneven rainfall distribution in some of the main soybean-producing areas,
production for MY 2015/16 is forecast downward to 66,000 metric tons, a drop of 6,000 metric tons
from previous year. Going forward, production is expected to rebound and continue its upward climb in
order to meet some of the increasing local demand for edible oil and soybean meal for livestock feed,
most notably soybean meal for poultry production. The government plans to ramp up poultry
production as part of its Livestock Master Plan (See ET1524 for details.) These anticipated increases in
production will come with improved yields and expanded acreage planted in soybeans, some of which
will be done on commercial farms.
Over the last several years, soybean production has doubled from 35,000 metric tons in MY11/12 to
72,000 metric tons in MY14/15. Most of this growth in production was due to an increase in the area
planted and to a lesser extent improved yields. The expansion in are planted was largely attributed to
the increasing, but still small number of large-scale commercial farms producing soybeans, which
account for about half of total production. For example, in one of the leading-production areas, the
Metekel zone in Benshangul Gumuz region, there are more than 150 commercial farms, with an average
size of 50 hectares that are producing soybeans. In addition, there are several large scale soybean
farming operations, run by Saudi Star Plc, Ethio Agri-CEFT Plc, and Ruchi Agro-Industry. Soybeans are
also being used as a rotational crop on some of the government-owned sugarcane plantations.
Soybeans contribute nearly 9 percent to the country’s total oilseed production and account for only 4
percent of area planted to oilseeds. The main soybean-producing areas are in the western part of the
country in the Oromia and Benishangul Gumuz, and to a lesser extent the Amhara region. In these
regions, the top-producing zones are Illubabor, Horogudru Wellega, East and West Wellega, Metekel,
Assosa, Kemashi, Awi and West Gojjam. See figure 6.

Table 6: Trend of Soybean Production, Acreage, & Yield in Ethiopia
Crop Year Area
(Ha)
Production
( MT) Yield (MT/Ha)
2009/10 5,679 7,205 1.27
2010/11 11,261 15,824 1.41
2011/12 19,397 35,880 1.85
2012/13 31,855 63,653 2.00
2013/14 30,517 61,025 2.00
2014/15 35,260 72,184 2.05
Average 22,328 42,629 1.76
2015/16* 38,000 66,000 1.74
Source: CSA and Own Estimate for 2015/16
*FAS Addis Ababa Forecast
Figure 6: Distribution of Soybean Production in Ethiopia
Source: Sopov, M. et al., 2015

Consumption
Soybean consumption, which continues to grow, is forecast to reach 41,000 metric tons in MY15/16.
Consumption is expected to continue its upward climb as consumers demand more soy-based edible oil
and as the poultry sector demands more soybean meal. In addition to oil, soybeans are used to make a
variety of local foods, such as bread, chappati, porridge, soy milk, yoghurt as well as the traditional
Ethiopian stew, shero wot. Soybeans are also used to make corn-soy blend (CSB) for emergency food
assistance programs run by international organizations and the Ethiopian government.
Trade
With growing local demand and lower production this year, soybean exports are expected to contract to
21,000 metric tons. Main export destinations include Sudan, Indonesia, Kenya, Netherlands and
Vietnam. Considering the growing demand for soybeans, post expects that exports will fall to near zero
in the near future. Furthermore, Ethiopia may begin to import soybeans since local demand will likely
outstrip production capacity.
In MY 2014/15, exports reached nearly 28,000 metric tons, valued at $13.3 million. Nearly one-third of
production was exported during this period.
Table 7: Soybean Export Data
Volume
(MT)
FOB Value Weighted Avg. Price /MT
% Growth
MY (‘000 USD) Volume Value Price
2007/08 4,838 2,203 455 - - -
2008/09 214 119 556 -96% -95% 22%
2009/10 148 73 493 -31% -39% -11%
2010/11 1,380 656 475 832% 799% -4%
2011/12 40 34 850 -97% -95% 79%
2012/13 34,211 19,183 561 85428% 56321% -34%
2013/14 35,606 19,988 561 4% 4% 0%
2014/15 27,475 13,296 484 -23% -33% -14%
Average 12,989 6,944 555 123 81 5%
2015/16* 21,000
Source: EPOSPEA Annual Bulletin, November 2015
*FAS Addis Ababa Forecast

Production, Supply, and Demand, PSD (1000 HA, 1000 MT)
Oilseed, Soybean 2014/15 2015/16
Market Year Begins Oct 2014 Oct 2015
Ethiopia New Post New Post
Area Harvested 35 38
Beginning Stocks 4 4
Production 72 66
MY Imports 0 0
MY Imports from US 0 0
Total Supply 76 71
MY Exports 27 21
Crush 4 5
Food Use Dom. Cons. 27 28
Feed Waste Dom. Cons. 12 13
Total Dom. Cons. 40 41
Ending Stocks 4 4
Total Distribution 76 71

Oils
Production
Local production of edible oil in calendar year (CY) 2016 is projected to reach 137,500 metric tons, up
by 10 percent from the previous year. Three oils - Niger, cotton, and linseed - account for approximately
44, 23, and 22 percent, respectively, of oil production. The remaining 11 percent is made up of
sunflower, soybean and ground nuts.
The local production of edible oil has tremendous growth potential and is expected to rapidly expand in
the coming years as the population grows and as consumer income rises. In fact, there are a number of
local companies investing in setting up soybean crushing operations. At the same time, there is interest
in large-scale sesame oil production, mainly for export. However, investment in the sesame processing
sector has largely been hampered because of difficulties tracing the origin of the sesame, quality
consistency, and the volatility in international prices.
Consumption
Total vegetable oil consumption in CY16 is projected at 687,500 metric tons, of which 80 percent is
imported. Most of the oil consumed is imported palm oil, followed by locally-produced Niger seed oil.
Small amounts of linseed, ground nut, cotton, and soy oils are also consumed. With increasing demand,
limited domestic production and the country’s heavy reliance on imported oil, there are frequent supply
shortages especially in urban areas. In addition, as some consumers become increasingly diet conscious,
they are looking for healthier alternatives to palm oil. Local consumers consider Niger seed and
soybean oil to be healthier.
Trade
Imports of edible oil have been rapidly increasing over the last five years, with annual growth during
this period almost reaching 20 percent. Post expects this upward trajectory to continue with imports
reaching 550,000 metric tons in CY16. Most of this imported oil will be palm because of its price
competitiveness.
In CY15, Ethiopia imported 479,000 metric tons of cooking oil, valued at nearly $474 million dollars.
Of this imported oil, more than 90 percent by volume was palm oil, most of which comes from
Indonesia and Malaysia. The remainder of imported oil is made up of sunflower, soybean and olive oils.
The leading supplier of soybean oil is Egypt, while Turkey is the largest supplier of sunflower oil. See
tables 8, 9 and 10 below for breakdown of oil imports value/volume and origin.
Policy
In response to chronic cooking oil shortages and inflation in 2011, the government started intervening in
the marketplace to regulate the supply, distribution, and price of palm oil. The government also
restricted the private sector from importing and distributing palm oil, and capped wholesale and retail

prices. In August 2015, these restrictions on private sector involvement were lifted, but the price cap
remains in effect. At present, six companies and three government-affiliated enterprises are eligible to
import and distribute palm in the local marketplace. The wholesale and retail prices of palm oil are
currently set at Birr 22.23 per liter and Birr 23.75 per liter, which is about $1 USD per liter at the current
exchange rate.
Table 8: Edible Oil Import Volume (MT)
Imports 2010 2011 2012 2013 2014 2015
Palm Oil 212,686 228,209 292,797 139,899 373,763 442,536
Sunflower Oil 1,135 2,228 1,453 2,198 2,450 9,704
Soy Oil 713 6,755 654 2,001 656 6,746
Vegetable Fats & Oils 11,912 11,263 17,041 13,487 11,316 16,954
Olive Oil 86 166 174 253 308 758
Sesame Oil 5 390 14 5 16 13
Other Edible Oils 780 3,548 85 194 577 1,877
Total 227,316 252,559 312,217 158,038 389,086 478,588
Source: ERCA
Table 9: Edible Oil Import Value (‘000 USD)
Imports 2010 2011 2012 2013 2014 2015
Palm Oil 216,763 322,786 382,278 145,832 403,198 419,636
Sunflower Oil 1,458 3,909 2,438 4,055 4,309 15,692
Soy Oil 1,009 11,956 1,203 3,109 1,083 8,787
Vegetable Fats & Oils 18,099 19,564 28,453 16,935 18,355 25,220
Olive Oil 209 529 510 660 1,066 1,840
Sesame Oil 7 430 30 26 47 71
Other Edible Oils 1,013 5,779 196 312 973 2,582
Total 238,557 364,952 415,109 170,929 429,031 473,806 Source: ERCA
Table 10: Edible Oil Imports by Country of Origin in 2015 (Jan-Dec)

1. Palm Oil
Exporting Country Volume
( MT)
Value
( USD)
Market Share
Volume Value
Indonesia 296,505 269,130,850 67% 64%
Malaysia 124,675 123,044,353 28% 29%
UAE 20,211 25,872,769 5% 6%
Others 1,145 1,589,010 0% 0%
Total 442,536 419,636,982 100% 100%
2. Sunflower Oil
Turkey 5,591 9,290,707 58% 59%
Egypt 2,372 3,700,407 24% 24%
Spain 637 853,657 7% 5%
Others 1,104 1,822,377 11% 12%
Total 9,704 15,667,148 100% 100%
3. Soy Oil
Egypt 6,207.82 8,024,812 92% 91%
India 176 282,620 3% 3%
Belgium 117 132,948 2% 2%
Others 245 347,326 4% 4%
Total 6,746 8,787,706 100% 100%
Source: ERCA