this report contains assessments of … gain publications/citrus annual... · regarding local...
TRANSCRIPT

THIS REPORT CONTAINS ASSESSMENTS OF COMMODITY AND TRADE ISSUES MADE BY
USDA STAFF AND NOT NECESSARILY STATEMENTS OF OFFICIAL U.S. GOVERNMENT
POLICY
Date:
GAIN Report Number:
Approved By:
Prepared By:
Report Highlights:
In MY 2015/16, yields were favorable in Turkey and the total production of citrus was 3.9 MMT. The
sector expects that the yield in MY 2016/17 will follow the same upward trend as last year. Turkey
exported 1.5 MMT of citrus worth $830 million in 2015, just barely lower than in 2014. Russia’s ban
on most Turkish citrus affected the export trend in 2016, however, Turkish exporters found new markets
such as Romania, Ukraine, and Saudi Arabia which largely compensated for the loss. Oranges and
mandarins were the products most affected by the Russia ban. Turkish citrus producers complain about
the difference between the price received by the farmer and the high price charged at the retail outlet.
Producers are not seeing profits, which is leading them to consider getting out of the citrus production
business. Prices are so low that some citrus is not even worth picking and farmers occasionally leave
the produce to rot on the trees.
Sinem Duyum, Agricultural Specialist
Kimberly S. Sawatzki, Agricultural Counselor
Citrus Annual 2016
Citrus Annual
Turkey
TR6056
12/15/2016
Required Report - public distribution

Executive Summary:
As in MY 2014/15, overall citrus production was good due to favorable weather conditions. However,
this resulted in low prices, which has been difficult for producers. They sell their products at low prices
to wholesale markets, and consumer price is very high in contrast. The total production of citrus was
3.9 MMT in MY 2015/16, which is 3 percent higher than MY 2014/15. The sector expects that the yield
in MY 2016/17 will also be high.
Figure 1: Citrus Production by Province
Source: TurkSTAT, 2016
According to the Aegean Agricultural Research Institute, the Aegean citrus yield forecast will be 15
percent higher than the previous year. They expect 512,000 MT in MY 2016/2017. However, they
expect a decrease in orange and grapefruit production since producers are converting these orchards into
lemon orchards because of low prices for oranges and grapefruit. The situation is the same with
Mediterranean producers. They are having trouble selling their products at even 0.5 TRY/kg
($0.15/kg). For this reason, some producers do not harvest the oranges and they leave them to rot on the
trees, as harvesting them would cost more than they are worth. Due to a lack of packaging houses and
cold storage facilities, it is estimated that 30 percent of the total harvested product in Turkey is not sent
to market as fresh and is either used for processed products, or more likely, is wasted.
Turkey exported 1.5 MMT of citrus worth $830 million in MY 2015/16, which is 4 percent lower than
2014. Russia implemented an import ban on many of Turkish fruits and vegetables, including oranges
and mandarins, on January 1, 2016 following the late November 2015 Turkish shoot down of a Russian
fighter jet along the Turkish-Syrian border. Grapefruit and lemon were not affected by the ban. Total
citrus exports to Russia declined 43 percent in volume in 2016 compared to the previous year.

Regarding grapefruit and lemon exports to Russia in 2016, there has been a 13-percent decline to
139,725 MT (valued at $89 million), compared with the previous year. According to Turkish exporters,
the reason for the citrus export downward trend to Russia is not only related to Russia-Turkey
relationship following the downing of a Russian jet by Turkey, but also decreasing Russian purchasing
power due to low oil prices and the ruble’s currency depreciation.
Lemons were the most exported citrus since the beginning of 2016 with $290 million, as they are one of
the few fruits exempt from the Russia ban. Mandarins followed with $280 million and orange exports
were $168 million.
Figure 2: Turkish Citrus Export in MT, Jan- Nov 2015 and 2016
Source: TurkSTAT, 2016. Data shows the period of January to November, 2015-2016.
Figure 3: Comparison of Turkish Citrus Export Markets in MT, Jan-Nov 2015 and 2016

Source: Mediterranean Exporters Association, 2016. Data shows the period of January to November,
2015-2016.
The main markets in MY 2015/16 were Iraq, Ukraine, Poland, and Saudi Arabia. Turkey’s citrus
exports totaled 900,000 MT from January to October 2016, and as shown with the chart below, are not
significantly different this year compared to last year. Although exporters have not been happy with
Russia’s ban on some citrus products from Turkey, statistics show that total citrus export amounts have
not been majorly impacted. Oranges and mandarins were the most affected products for Turkish citrus
exportation.
Figure 4: Comparison of Turkish Total Citrus Export in MT, 2015 and 2016

Source: Source: Mediterranean Exporters Association, 2016
The Turkish Citrus Promotion Group (http://www.turkishcitrus.com/) has been working to promote
foreign and local demand of citrus products. In order to promote and facilitate Turkish citrus exports,
the group has established a website (http://www.turkishcitrus.com/s/b/) that brings exporters and
importers together. Also, the Aegean Fresh Fruits and Vegetables Exporter’s Association has
established a database to facilitate finding trade partners for foreign importers:
http://aegeanfreshness.com/#findyourtradepartner.
In order to prevent consumer confusion resulting from mislabeling of different citrus in the market, the
associations and MinFAL have created a marking tag system that allows citrus products to be labeled at
the farm and sent to market with a tracking system. This system has been carried out for a year, and
producers have to label their products before selling to markets. Although it was thought that this
system would have prevented incorrect labelling of orange varieties in the domestic market, there are
still problems regarding mislabeling.
Regarding local citrus consumption, market prices have not decreased as a result of Russian’s ban on
Turkish citrus products. They have actually even tended to increase since many stakeholders are in the
marketing chain. Orange market prices have actually increased despite the fact that Russia has not
imported oranges this year, which was a surprise to consumers. Producer associations believe that
domestic consumption should be higher when compared with consumption in the biggest citrus
producing countries. For this reason, some municipalities in the Mediterranean region have started to
carry out a project in primary schools to promote citrus consumption habits.
Harmonized System (HS) Codes:

Oranges 080510
Tangerines/Mandarins 080520
Lemons 080550
Grapefruits 080540
Orange Juice 200911, 200912, 200919
Abbreviations used in this report:
FAS USDA Foreign Agricultural Service
GTA Global Trade Atlas
MT Metric ton (1,000 kg)
MMT Million Metric Tons
MinFAL Turkish Ministry of Food, Agriculture and Livestock
MY Marketing year
PS&D Production, Supply and Demand
FSVPS Russian Federal Service for Veterinary and Phytosanitary Surveillance
TRY or TL Turkish Lira
TurkSTAT Turkish Statistical Institute
USD U.S. Dollar
Commodities:
Production:
In MY 2016/17, orange production is forecast to increase 3 percent from the previous year due to
favorable weather conditions. MY 2016/17 Production is estimated at 1.854 million MT. The yield in
MY 2015/16 was higher than Post estimated because the weather conditions were good for both
blooming and harvest. Eighty-four percent of oranges are produced in Adana and Mersin provinces in
the Mediterranean region. While there are not orange crop problems in the regions, producer profit
margins have been decreasing because of high input costs and low producer prices. Orange production
in the Mediterranean region is threatened by pests, while production in the Aegean is struggling with
fungal diseases. These diseases have not harmed production quantity, but they have caused quality
problems in oranges.
According to the Aegean Agricultural Research Institute, orange production will be 221,302 MT in MY
2016/17 in the region, which is 10 percent lower than the previous year. The Aegean orange crop is
getting smaller as farmers exit the business due to low profits. Recently, orange producers have been
starting to change over to strawberry production in Aydin province, and producers in Mugla province
(which has 80 percent of total Aegean orange production) are switching to lemon production.
Table 1: Turkish Orange Production in Turkey by Variety and Planted Area in 2015
Orange by Orange Production Average Yield Number of Total Number
Oranges, Fresh

variety Orchard
(ha)
(MT) per tree (kg) Bearing Trees of Trees
Washington 39,009 1,350,600 132 10,238,698 10,636,268
Navel 1,962 70,638 115 613,670 620,994
Orange
(Other) 13,325 395,560 123 3,203,016 3,600,403
Source: MinFAL, 2016
Consumption:
Orange consumption in Turkey was 1.4 MMT in MY 2015/16. Per capita annual consumption is
estimated at 18-19 kg for oranges in MY 2016/17. There is a wide margin between farm and final
prices. Producers are having a hard time selling their products at even 0.5 TRY/kg ($0.15/kg, with
exchange rate 3.4TL to $1 USD as of December 2016). However, orange prices in the market have
increased, despite the fact that Russia has not imported oranges this year. With the last announced
inflation report though, orange prices in November have now finally started to decrease, reportedly by
as much as 32 percent. Post estimates that domestic orange consumption for MY 2016/17 will be
slightly higher.
Trade:
Orange exports in MY 2016/2017 are expected to be slightly higher than the previous year if the current
situation with Russia remains stable and they allow Turkish orange imports. In MY 2015/16, Turkey
exported 361,000 MT of oranges, which is 22 percent higher than the previous marketing year, despite
the fact that the Russian market was closed and there were no shipments to Russia after January 1, 2016.
Figure 5: Turkey Orange Exports to All Countries (Jan to Sept, Comparison 2014-15-16)

Source: TurkSTAT, 2016
Most of the oranges were exported to Iraq. As it is shown with the below tables, orange exports did not
have good start at the beginning of 2016 as exporters scrambled to find new markets, but they picked up
in February and passed 2015 export numbers.
Figure 6: Turkey Orange Export in MY 2014/15-2015/16 in MT
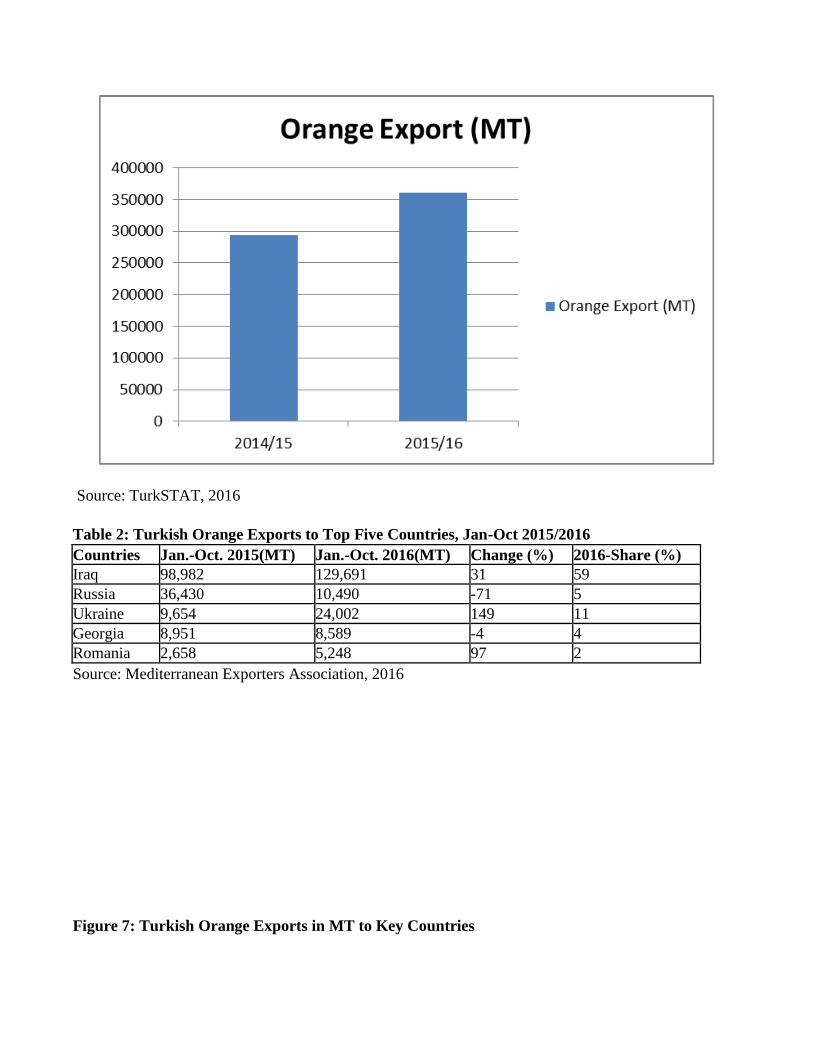
Source: TurkSTAT, 2016
Table 2: Turkish Orange Exports to Top Five Countries, Jan-Oct 2015/2016
Countries Jan.-Oct. 2015(MT) Jan.-Oct. 2016(MT) Change (%) 2016-Share (%)
Iraq 98,982 129,691 31 59
Russia 36,430 10,490 -71 5
Ukraine 9,654 24,002 149 11
Georgia 8,951 8,589 -4 4
Romania 2,658 5,248 97 2
Source: Mediterranean Exporters Association, 2016
Figure 7: Turkish Orange Exports in MT to Key Countries

Source: TurkSTAT, 2016.
Production, Supply and Demand Data Statistics:

Table 3: PSD Oranges, Fresh
Oranges, Fresh 2014/2015 2015/2016 2016/2017
Market Begin Year Oct 2014 Oct 2015 Oct 2016
Turkey USDA
Official
New
Post
USDA
Official
New
Post
USDA
Official
New
Post
Area Planted 51700 51700 54600 54500 0 54550
Area Harvested 50000 50000 53000 53200 0 53300
Bearing Trees 13000 13000 13500 14055 0 13900
Non-Bearing Trees 1000 1000 1000 802 0 900
Total No. Of Trees 14000 14000 14500 14857 0 14800
Production 1650 1650 1700 1800 0 1854
Imports 45 45 40 45 0 45
Total Supply 1695 1695 1740 1845 0 1899
Exports 302 305 360 361 0 371
Fresh Dom.
Consumption
1313 1310 1280 1404 0 1438
For Processing 80 80 100 80 0 90
Total Distribution 1695 1695 1740 1845 0 1899
HECTARES, 1000 TREES, 1000 MT
Commodities:
Production:
In MY 2016/17, tangerine/mandarin production is forecast to increase two percent compared to the
previous year because of favorable weather conditions. In MY 2015/16, production increased 8 percent
to 1,040,200 MT, however, producers noted there were low prices and low local demand. Since
producers believe local consumption will not increase, producers have difficulties with surplus
production. For this reason, they are willing to utilize surplus production for manufactured products
(such as dried sliced mandarin) using drying techniques.
Despite the gains in overall production, there was some yield damage in the Adana region due to the
freezing weather conditions in January 2016, when temperatures dropped to minus six degrees
centigrade. The Adana region produces 85 percent of total Turkish citrus production. The damage was
mostly in W.Murcott and Freemont varieties as these are both late season mandarin varieties and are on
the trees throughout the winter. According to producers, freezing weather conditions in January and
early February 2016 affected not only blooming but also the quality of trees which means yield in MY
2016/17 would also be lower.
Producers would like the government to subsidize some measures during the winter such as running
irrigation systems to increase field temperature, funding fans to break ice, and other measures so that
freezing conditions do not hurt their yields.
Tangerines/Mandarins, Fresh

Table 4: Mandarin Production by Variety and Planted Area in 2015
Region Variety Mandarin
Orchard
(ha)
Production
(MT)
Average
Yield per
tree(kg)
Number of
Bearing
Trees
Total
Number of
Trees
Western
Marmara
Satsuma 0,8755 10,484 42 252 267,885
Aegean
Satsuma 6,587 150,505 64 2,340,738 2,554,363
Clementine 0,5408 9,794 49 201,634 224,609
King 13,5 280 42 6,735 6,808
Other 0,4589 4,859 24 203 214
Mediterranean
Satsuma 15,237 560,710 142 3,944,109 4,638,752
Clementine 2,275 73,756 119 617,805 650,523
King 0,166 6,085 123 49,437 54,492
Other 17,311 335,375 85 3,952,240 5,157,285
Western Black
Sea
Satsuma 1.5 14 18 760 825
Other 0 1 11 90 110
Eastern Black
Sea
Satsuma 0,2 4,167 22 192,572 217,973
Other 1.1 335 13 25 27
Total 41,745 1,156,365 754 11,306,600 13,773,866
Source: TurkSTAT, 2016
Consumption:
In MY 2016/17, Turkey’s domestic consumption of mandarins is forecast at 499,000 MT, while it was
491,000 MT in MY 2015/16. The consumption has not increased despite the closure of the Russian
market. Retail prices never dropped enough to significantly boost consumption. However, mandarin
prices for farmers are so low that producers are reducing their production costs by reducing input use.
Retail market prices do not reflect low farmer prices. Per capita annual consumption of
tangerines/mandarins is estimated at 5.5 kg in MY 2016/17.
Trade:
Mandarins are the number one exported citrus product from Turkey. Turkey exported 569,000 MT of
mandarins worth $291 million in MY 2015/16, while it was 610,000 MT worth $350 million in MY
2014/15. According to Turkish Statistical Institute (TurkSTAT), Turkey exported 129,000 MT worth
$60 million from January to September 2016, while it was 114,000 MT of mandarin worth $62 million
in the same period of 2015.
As seen from Figure eight, at the start of 2016, mandarin exports have been going up compared to last
year with the opening of new foreign markets. Mandarin exports in MY 2016/2017 are expected to be
slightly higher than the previous year due to the opening of new markets like Saudi Arabia, Ukraine,
and Belarus. Satsuma variety exports declined 25 percent in MY 2015/16 because of the closure of
Russian market. According to Aegean Fresh Fruit and Vegetables Exporters Association, satsuma yield
will be 25 percent higher than the previous year and, satsuma exports from the Aegean are expected to
go up after the removal of the Russian ban.
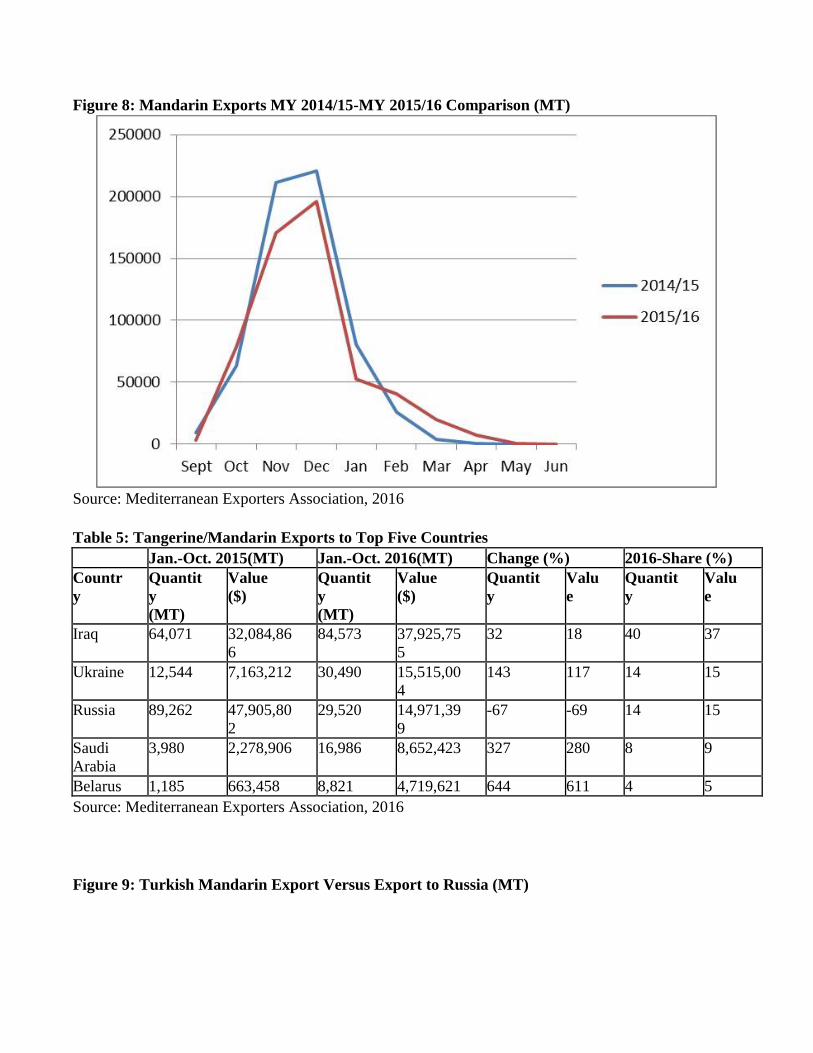
Figure 8: Mandarin Exports MY 2014/15-MY 2015/16 Comparison (MT)
Source: Mediterranean Exporters Association, 2016
Table 5: Tangerine/Mandarin Exports to Top Five Countries
Jan.-Oct. 2015(MT) Jan.-Oct. 2016(MT) Change (%) 2016-Share (%)
Countr
y
Quantit
y
(MT)
Value
($)
Quantit
y
(MT)
Value
($)
Quantit
y
Valu
e
Quantit
y
Valu
e
Iraq 64,071 32,084,86
6
84,573 37,925,75
5
32 18 40 37
Ukraine 12,544 7,163,212 30,490 15,515,00
4
143 117 14 15
Russia 89,262 47,905,80
2
29,520 14,971,39
9
-67 -69 14 15
Saudi
Arabia
3,980 2,278,906 16,986 8,652,423 327 280 8 9
Belarus 1,185 663,458 8,821 4,719,621 644 611 4 5
Source: Mediterranean Exporters Association, 2016
Figure 9: Turkish Mandarin Export Versus Export to Russia (MT)

Source: TurkSTAT, 2016.
Production, Supply and Demand Data Statistics:
Table 6: PSD Tangerines/Mandarins
Tangerines/Mandarins,
Fresh
2014/2015 2015/2016 2016/2017
Market Begin Year Oct 2014 Oct 2015 Oct 2016
Turkey USDA
Official
New
Post
USDA
Official
New
Post
USDA
Official
New
Post
Area Planted 31300 31,300 47795 41745 0 41740
Area Harvested 27450 27,450 37795 37795 0 39450
Bearing Trees 9150 9,150 9600 11306 0 10900
Non-Bearing Trees 1250 1,250 2250 2250 0 2500
Total No. Of Trees 10400 10,400 11850 13556 0 13400
Production 960 960 1040 1040 0 1060
Imports 19 19 22 22 0 20
Total Supply 979 979 1062 1062 0 1080
Exports 610 610 570 570 0 580
Fresh Dom. Consumption 368 368 491 491 0 499
For Processing 1 1 1 1 0 1
Total Distribution 979 976 1062 1062 0 1080
HECTARES, 1000 TREES, 1000 MT
Commodities:
Lemons, Fresh
Production:
According to lemon producers, production in MY 2016/17 will be 4 percent lower than the previous
season as freezing weather conditions affected lemon production. In 2015/16, the winter season was
generally mild, however, there was up to 7 percent yield damage in the Adana region due to the freezing
weather conditions in January 2016, when temperatures dropped to minus six degrees centigrade.
According to producers, freezing weather conditions in January and early February 2016 affected not
only blooming but also the quality of trees which means yield in MY 2016/17 would also be lower.
Lemon producers are concerned that freezing weather conditions will return in January and February
2017. Also, Citrus thrips pest affected lemon production last year, especially in Mersin, causing up to
60 percent loss in yields. Lamas, Enterdonat and Meyer lemon varieties are the most produced varieties
in Turkey.
Table 7: Lemon Production by Region and Planted Area in 2015
Region
Lemon
Orchard
(ha)
Production
(MT)
Average Yield
per tree(kg)
Number of
Bearing Trees
Total
Number of
Trees
Western
Marmara 0 70 35 2,000 2,000
Aegean 2,689 56,271 75 746,133 811,748
Mediterranean 25,875 693,805 111 6,256,971 7,628,741
Western Black
Sea 0
0 22 32
Eastern Black
Sea 5 404 16 25,117 31,746
TOTAL 28,570 750,550 237 7,030,243 8,444,267
Source: TurkSTAT, 2016
Consumption:
In MY 2016/17, post forecasts domestic lemon consumption will be up compared with MY 2015/16 due
to the return of Russian tourists to Turkey, which will increase lemon consumption in resort areas. In
MY 2015/16, lemon domestic use decreased to 212,000 MT because of low demand from the tourism
sector. Turkey’s tourism was significantly affected by the events in Turkey and neighboring countries
in the past year. Annual per capita consumption in Turkey is estimated at 3.3 kg in MY 2016/17.
The price of lemons is expected to increase in MY 2016/17 due to the low yields and decline in
production.
Trade:
In MY 2016/2017, exports are expected to be the same as MY 2015/2016 if the current situation with
Russia remains stable. Turkey exported 420,000 MT of lemons in MY 2015/16 worth $290 million.
Lemons account for 31 percent of Turkey’s total citrus exports. Two-thirds of the total lemon
production in 2015 went to export.
Turkey exported 302,000 MT worth $221 million of lemons from January to October 2016, which is 12
percent lower than the same period of the previous year.

Russia remained the biggest export market for Turkish lemons in MY 2015/16. Lemons were not on the
Russian banned agricultural list after Turkey’s dispute with Russia over the downed jet. In January-
October 2016, Turkey has sent 68,000 MT worth $53 million, which is 23 percent lower than the
previous year. Turkey’s market share in Russia for lemons is over 25 percent. Although lemons were
not in the Russian banned list, lemon exports are down in 2016 because of low demand from Russian
importers.
Figure 10: Turkey’s Main Markets for Lemons, 2015-2016 (MT)
Source: Mediterranean Exporters Association, 2016 (Data shows only January-October of 2015 and
2016)

Production, Supply and Demand Data Statistics:
Table 8: PSD Lemons/Limes
Lemons/Limes, Fresh 2014/2015 2015/2016 2016/2017
Market Begin Year Oct 2014 Oct 2015 Oct 2016
Turkey USDA
Official
New
Post
USDA
Official
New
Post
USDA
Official
New
Post
Area Planted 25200 25200 27000 27000 0 28500
Area Harvested 22900 22900 24000 24000 0 25000
Bearing Trees 6265 6265 6613 6613 0 7000
Non-Bearing Trees 590 590 1000 1000 0 1000
Total No. Of Trees 6855 6855 7613 7613 0 8000
Production 725 725 670 670 0 638
Imports 2 2 2 2 0 2
Total Supply 727 727 672 672 0 640
Exports 433 433 420 420 0 425
Fresh Dom.
Consumption
237 237 212 212 0 215
For Processing 57 57 40 40 0 0
Total Distribution 727 727 672 672 0 640
HECTARES, 1000 TREES, 1000 MT
Commodities:
Production:
Grapefruit production has a 7-percent share of total citrus production in Turkey. In MY 2016/2017,
production is forecast to increase slightly, by roughly one percent. The production of MY 2015/2016
was 250,000 MT.
Table 9: Grapefruit Production by Regions and Planted Area in 2014-2015
Year Regions
Orchards
(ha)
Production
(MT)
Average
Yield per
tree(kg)
Number of
Bearing
Trees
Total
Number of
Trees
2014
Aegean 202 4,213 80 52,781 59,347
Mediterranean 6,185 225,332 179 1.260,451 1,481,445
Eastern Black
Sea 0 10 22 450 555
TOTAL 6,387 229,545 581 1,313,682 1,541,347
2015
Aegean 0,175 4,076 88 46,26 52,955
Mediterranean 6,172 245,939 177 1,388,023 1,478,546
Eastern Black
Sea 0 10 22 450 555
TOTAL 6,347 250,025 287 1,388,520 1,479,154
Grapefruit, Fresh
Source: TurkSTAT, 2016
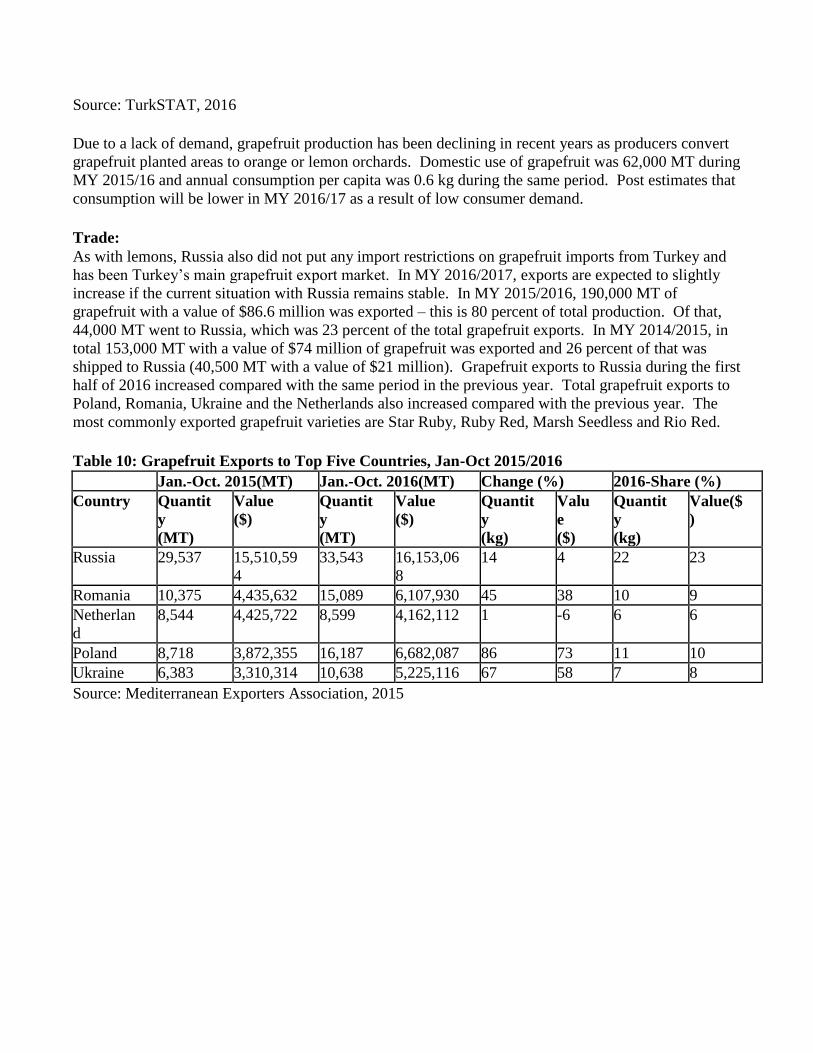
Due to a lack of demand, grapefruit production has been declining in recent years as producers convert
grapefruit planted areas to orange or lemon orchards. Domestic use of grapefruit was 62,000 MT during
MY 2015/16 and annual consumption per capita was 0.6 kg during the same period. Post estimates that
consumption will be lower in MY 2016/17 as a result of low consumer demand.
Trade:
As with lemons, Russia also did not put any import restrictions on grapefruit imports from Turkey and
has been Turkey’s main grapefruit export market. In MY 2016/2017, exports are expected to slightly
increase if the current situation with Russia remains stable. In MY 2015/2016, 190,000 MT of
grapefruit with a value of $86.6 million was exported – this is 80 percent of total production. Of that,
44,000 MT went to Russia, which was 23 percent of the total grapefruit exports. In MY 2014/2015, in
total 153,000 MT with a value of $74 million of grapefruit was exported and 26 percent of that was
shipped to Russia (40,500 MT with a value of $21 million). Grapefruit exports to Russia during the first
half of 2016 increased compared with the same period in the previous year. Total grapefruit exports to
Poland, Romania, Ukraine and the Netherlands also increased compared with the previous year. The
most commonly exported grapefruit varieties are Star Ruby, Ruby Red, Marsh Seedless and Rio Red.
Table 10: Grapefruit Exports to Top Five Countries, Jan-Oct 2015/2016
Jan.-Oct. 2015(MT) Jan.-Oct. 2016(MT) Change (%) 2016-Share (%)
Country Quantit
y
(MT)
Value
($)
Quantit
y
(MT)
Value
($)
Quantit
y
(kg)
Valu
e
($)
Quantit
y
(kg)
Value($
)
Russia 29,537 15,510,59
4
33,543 16,153,06
8
14 4 22 23
Romania 10,375 4,435,632 15,089 6,107,930 45 38 10 9
Netherlan
d
8,544 4,425,722 8,599 4,162,112 1 -6 6 6
Poland 8,718 3,872,355 16,187 6,682,087 86 73 11 10
Ukraine 6,383 3,310,314 10,638 5,225,116 67 58 7 8
Source: Mediterranean Exporters Association, 2015

Figure 11: Turkey’s Total Grapefruit Export (including Russia) vs only Russia, 2012- 2015
Source: TurkSTAT, 2016.
Table 11: PSD Grapefruit
Grapefruit, Fresh 2014/2015 2015/2016 2016/2017
Market Begin Year Oct 2014 Oct 2015 Oct 2016
Turkey USDA
Official
New
Post
USDA
Official
New
Post
USDA
Official
New
Post
Area Planted 6400 6400 6300 6300 0 6347
Area Harvested 5000 5000 5300 5300 0 0
Bearing Trees 1040 1040 1300 1300 0 0
Non-Bearing Trees 65 65 200 200 0 0
Total No. Of Trees 1105 1105 1500 1500 0 0
Production 238 238 200 250 0 253
Imports 3 3 2 2 0 2
Total Supply 241 241 202 252 0 255
Exports 145 145 170 190 0 200
Fresh Dom.
Consumption
96 96 32 62 0 55
For Processing 0 0 0 0 0 0
Total Distribution 241 241 202 252 0 255
HECTARES, 1000 TREES, 1000 MT

Commodities:
Production:
The citrus processing sector in Turkey is facing rigid competition from the fresh citrus market for
sourcing raw materials. There are 130 processing establishments with high technology, but they have
trouble finding available varieties of oranges for processing. Local varieties are the most suitable
oranges for juice sector; however production areas of these varieties have been decreasing year by year.
The sector says that they are processing 1 million MT of fruit annually, and their goal is to increase
production by using more of their current capacity.
Consumption:
Citrus consumed as juice is still quite low compared to some other citrus growing countries, as there are
many competing non-citrus juices. Orange is the still the least preferred juice by Turkish consumers
compared with the most preferred fruit juices of peach, cherry and apricot juice in nectar form.
Juice/nectar consumption per capita is 9 liters annually in 2015. Nectars are highly consumed but there
is a growing trend to prefer 100 percent fruit juices.
Trade:
Orange juice exports are forecast at 8,000 MT for MY 2016/17, 6 percent higher than MY 2015/16.
Thirty percent of total fruit juice production was exported in 2015. Exports have been growing because
of using new technologies, which juice producers say in Turkey are more advanced than processing
establishments in the EU. Turkey has increased orange juice exports by finding new markets, including
to the United States. According to the Ministry of Economy, with the decline in Brazilian and
Netherlands orange juice exports, Turkish exporters found opportunities to export orange juice to new
markets. Turkey’s total orange juice exports are mainly to Iraq, Syria and some eastern Asian countries
and imports are mainly from Germany, Spain, and Brazil.
In MY 2015/16, Turkey’s orange juice exports grew to 7,500 MT worth $7.5 million. Three times more
orange juice was exported in in 2015 than in the previous year, mainly to Iraq and Syria. The sector has
sufficient processing capacity. Post estimates that imports of orange juice will remain the same.
Table 12: PSD Orange Juice
Orange Juice

Orange Juice 2014/2015 2015/2016 2016/2017
Market Begin Year Oct 2014 Oct 2015 Oct 2016
Turkey USDA
Official
New
Post
USDA
Official
New
Post
USDA
Official
New
Post
Deliv. To
Processors
80000 80000 100000 80000 0 90000
Beginning Stocks 150 150 100 100 0 150
Production 8000 8000 8500 8500 0 8550
Imports 7600 6493 7600 3616 0 3700
Total Supply 15750 14643 16200 12216 0 12400
Exports 2600 6968 3000 7500 0 8000
Domestic
Consumption
13050 7575 13050 4566 0 4250
Ending Stocks 100 100 150 150 0 150
Total Distribution 15750 14643 16200 12216 0 12400
MT
Policy:
The Turkish government supports citrus farmers who are registered in the “Farmers Registration
System”. Additionally, the Minister of Economy announced that citrus exporters will be subsidized by
a ‘Government Price Stabilization Fund’ and it will be 50 percent higher than the previous year.
However producer associations believe that the government should not be supporting the standard
price, but the support calculation should be based on the final destination of export.
Turkey will start to implement a new subsidy program for agricultural products in 2017, the National
Agriculture Project, which has an anticipated annual budget of nearly US$4 billion. According to
announcements thus far, the country of Turkey will be divided into agricultural basins based on climate
and soil to subsidize 19 strategic crops with a specific set of crops for each basin. No citrus crops are on
the list of subsidized strategic crops. For detailed information, please see GAIN report TR6053. Citrus
producers are upset with this announcement and the exclusion of citrus from the new program. For
example, in the Mediterranean region, citrus is one of the most important products for the region and
producers believe it should be subsidized.
Russian Sanctions Assessment on Turkish Citrus Exports
The Russian government (FSVPS) removed the import ban on October 11, 2016 which had been put in
place since January 1, 2016 on Turkish fresh/dried oranges, mandarins, tangerines, apricots, nectarines,
peaches and plums. According to the press, exports may be slowing resuming. There were 18.5 MTs of
oranges and mandarins exported to Russia in November 2016.
According to the Aegean Fresh Fruit and Vegetables Exporters Association, satsuma mandarin exports
to Russia from the Aegean region went down by 25 percent to $136 million from $181 million in 2016.
Their aim is to reach up to $200 million in 2017. In 2015, 34 percent of total citrus exports were
exported to Russia, and Iraq followed with 24 percent.

Turkish citrus exports for the first ten months of 2016 were 899,660 MT worth with $496 million, and
the figures are almost the same as the previous year. However, citrus exports to Russia have declined
43 percent (based on quantity) in 2016 when compared with 2015. The loss of the Russian market has
been compensated for with new export markets.
Regarding grapefruit and lemon exports to Russia in 2016, there was a 13-percent decline when
compared with previous year to 139,725 MT worth $89 million.
Figure 12: Comparison of Total Turkish Exports and Turkish Exports to Russia (MT, Jan – Nov
2015 and 2016)
Source: TurkSTAT, 2016. The data is shown for the period of January to November for 2015 and 2016.
Figure 13: Turkish Citrus Exports to Russia from 2012 to 2016

Source: TurkSTAT, 2016.
Post estimates that citrus exports to Russia will not reach previous year’s level since Russian authorities
are now more strictly enforcing export requirements, including carrying out on-the-spot investigations
of Turkish exporters’ establishments. According to Russian authorities, only large establishments
which could meet Russian requirements will be able to export to Russia.