this is an open access document downloaded from orca ...orca.cf.ac.uk/93974/3/d potoglou 2016...
TRANSCRIPT

This is an Open Access document downloaded from ORCA, Cardiff University's institutional
repository: http://orca.cf.ac.uk/93974/
This is the author’s version of a work that was submitted to / accepted for publication.
Citation for final published version:
Patil, Sunil, Patruni, Bhanu, Potoglou, Dimitris and Robinson, Neil 2016. Public preference for data
privacy - A pan-European study on metro/train surveillance. Transportation Research Part A: Policy
and Practice 92 , pp. 145-161. 10.1016/j.tra.2016.08.004 file
Publishers page: http://dx.doi.org/10.1016/j.tra.2016.08.004
<http://dx.doi.org/10.1016/j.tra.2016.08.004>
Please note:
Changes made as a result of publishing processes such as copy-editing, formatting and page
numbers may not be reflected in this version. For the definitive version of this publication, please
refer to the published source. You are advised to consult the publisher’s version if you wish to cite
this paper.
This version is being made available in accordance with publisher policies. See
http://orca.cf.ac.uk/policies.html for usage policies. Copyright and moral rights for publications
made available in ORCA are retained by the copyright holders.

Public Preference for Data Privacy– A Pan-European Study on Metro/Train Surveillance 1 2 3 4 Sunil Patil, Corresponding Author 5 RAND Europe 6 Westbrook Centre, Milton Road, Cambridge, CB4 1YG, United Kingdom 7 Tel: +44 1223 353 329 Fax: +44 1223 358 845; Email: [email protected] 8 9 Bhanu Patruni 10 RAND Europe 11 12 Dimitris Potoglou 13 School of Geography and Planning, Cardiff University, United Kingdom 14 15 Neil Robinson 16 RAND Europe 17 18

Patil, Patruni, Potoglou, Robinson 2 ABSTRACT 1 This paper presents a pan-European application of a stated preference dicrete choice experiment 2 for eliciting respondents’ preferences for various data-privacy settings in the context of security 3 and surveillance of train/metro facilities in Europe. Results show that respondents across the 27 4 European Union Member States (EU27) prefer some Closed Circuit Television Cameras (CCTV) 5 surveillance across in all countries, except Sweden where the most advanced type of CCTV with 6 face recognition capabilities is preferred. Most respondents prefer that CCTV data is stored for 7 future use rather than just being used for real-time monitoring, with the exception of respondents 8 in Greece. However, an intermediate period of storage (15 days) is preferred over a shorter or 9 longer duration (45 days). Respondents across the EU27 are averse to police force outside their 10 home country having access to CCTV data. Respondents prefer the presence of unarmed security 11 personnel over absence of security personnel. The majority of respondents are averse to any kind 12 of security checks. However, in Belgium, France, Italy, Spain and the UK there is a preference 13 for randomly selected people to go through a metal detector or full body scanner. Further this 14 study shows that preferences also vary by age and gender. Overall, analysis of the data illustrates 15 the complexity of the privacy over security debate as it pertains to transportation infrastructures. 16 In particular, the increased use of transportation user data for various reasons (efficiency, safety 17 and security) can pose complex social and ethical challenges to users, especially around 18 perceptions of consent, accountability and transparency. 19 20 Keywords: Data privacy, Surveillance, CCTV, Security, Train, Metro 21 22

Patil, Patruni, Potoglou, Robinson 3 INTRODUCTION 1 Railway and metro infrastructure are subject to a variety of types of criminal behahviour such as 2 robbery, abuse and anti-social behaviour. In the last decade, these infrastructures have also 3 become popular targets for terrorist attacks with deadly consequences. In the case of the latter, 4 these have taken place at stations or on-board buses and trains at major capitals including 5 Brussels (22/03/2016), London (7/7/2005), Madrid (11/03/2004), Moscow (29/03/2010), Paris 6 (25/06, 17/08, 26/08 1995), and many other cities across the globe (Global Terrorism Database, 7 2016). These incidents have shown that public transport systems are vulnerable and given the 8 volume of travellers using them do remain a likely target for future terrorist attacks. 9 10 As a consequence, there has been a shift in European security-policy towards – as stated by the 11 European Commission President Jean-Claude Juncker, a 'common European Responsibility' 12 (Friesen, 2007; European Commission, 2016). For example, the Internal Security Strategy 2010-13 2014, the European Agenda on Security and the Treaty of Lisbon provide the policy and legal 14 frameworks 'aiming at achieving liberty and security' in the European Union (European 15 Commission, 2015). 16 17 Practically, responses to the aforementioned terrorist attacks have also brought forward the 18 deployment of a wide range of security measures and surveillance technologies in an attempt to 19 mitigate the risk of incidents re-occurring and address the consequences should they occur. In 20 many European countries and beyond, surveillance involving video or camera technology – what 21 is widely known as Closed Circuit Television Cameras – is now a standard feature at stations and 22 on board buses and carriages. For example, the London Underground has now more than 15,000 23 CCTVs with a default footage-retention period of 14 days (TfL, 2016). Development of 24 advanced CCTV-based surveillance technologies also means these systems are now capable of 25 incorporating automated algorithms for the detection of dangerous conditions; for example, 26 whether an individual carries a knife or firearms (Grega et al., 2016). New surveillance 27 technologies are also capable of tracking behaviour and detect suspicious movements or certain 28 patterns of clothing or baggage (Sahm, 2006). 29 30 Other measures include deployment of additional number and of varying specialism security 31 personnel including armed police and the military. Following the Brussels attacks in spring 2016, 32 armed police were deployed to airports, train stations and other urban infrastructure where large 33 numbers of people congregate in Europe. For example, France deployed an extra 1,600 police 34 officers to transport hubs across the country with the majority of them based at Paris (The Local, 35 2016). In many cases, security personnel were accompanied with sniffer dogs and extensive 36 checks were also implemented. 37 38 While such measures are aimed at providing increased levels of reassurance to the general 39 public, they may compete with citizens' privacy, civil liberties and dignity (e.g. because of the 40 need to physically check passengers and their bags) and protection of personal information (e.g. 41 by recording CCTV footage). Thus a key aim for policy- making when confronted with the 42 security challenge should be to strike the appropriate balance across security, privacy and dignity, 43 whilst maintaining efficiency and convienence (since although extensive checks would achieve 44 security objectives they would also bring the infrastructure to a halt, thus contributing to the 45 achievement of the goals of the terrorist acts).. In this context, it is important to capture and 46 understand the citizens' perspectives. Capturing public preferences is the only way to ensure 47

Patil, Patruni, Potoglou, Robinson 4 public views are represented in the decision- and policy-making process. Moreover, eliciting 1 citizens' preferences provides guidance on best practices for communicating potential threats 2 from loss of privacy and offer reasons on how potential threats to privacy may be mitigated. 3 Thus one of the key aims of this study is to contribute to this debate and provide robust evidence 4 based on citizens' preferences for security and privacy in the context of rail/metro travel. 5 6 Using data from a pan-European survey, we investigate public preferences relating to data 7 collected on train/metro facilities mainly for security and surveillance through the use of CCTV. 8 The specific research questions include the following: 9
1. Do respondents prefer facilities where less data is collected? 10
2. Does the duration of data storage (retention) matter? 11
3. Do respondents prefer certain geographic level of access (sharing) to data by authorities 12
and government agencies (i.e., home country, EU, internationally)? 13
4. Do these preferences vary across individuals and countries? 14
The pan-European survey was conducted as part of PACT – "Public perception of security and 15 privacy: Assessing knowledge, Collecting evidence, Translating research into action", a three-16 year research project funded by the European Commission's 7th Framework Programme. The 17 overall aim of PACT has been to understand public perceptions of security, privacy and 18 surveillance across the 27 European Union Member States (EU271). Among other research 19 activities, PACT involved a survey questionnaire with three stated preference experiments each 20 corresponding to the following choice contexts: 21
1. Travel on metro or train, 22
2. Choice of an Internet Service Provider, and 23
3. Purchasing a device or service for storing health-related personal data. 24
For the purposes of this paper, we only focus on travel on metro/train. Findings from this paper 25 can inform on how planned security and surveillance measures on transport infrastructure 26 facilities are perceived by users, providing the evidence base for informing regulations and best 27 practices related to security and surveillance measures. This study also adds to the evidence on 28 the applicability of stated preference methods for measuring perceptions related to security and 29 privacy, which are frequently described as abstract and complex concepts. 30 31 LITERATURE REVIEW 32 Previous studies aimed at better understanding travellers' acceptance for travel-security and 33 surveillance measures, have been limited in both their numbers and geographical context. 34 Robinson (2010) and Potoglou et al. (2010) was one of the first quantitative studies to investigate 35 preferences of travellers for privacy and security was reported in Robinson (2010 and Potoglou 36 et al (2010). Their findings came from the analysis of a survey-based stated preference discrete 37 choice experiment involving a little over 2,000 participants in the UK. The experiment involved 38 varying surveillance and security settings that a traveller may encounter prior to a rail journey; 39 the experiment presented respondents with potential benefits from the implementation of those 40 measures (e.g. disruption of an incident and effective response of the authorities upon an incident 41 taking place) as well as financial costs to cover security improvements and delays to go through 42
1 At the time of inception of this project (in 2012) there were only 27 Member States of the EU. Croatia joined the EU in 2013 and was not included in the scope of this project.

Patil, Patruni, Potoglou, Robinson 5 security. Findings showed that UK respondents would accept standard and advanced CCTV 1 surveillance and opted-in for non-physical security checks (X-ray imaging). On the other hand, 2 they were less likely to select a scenario that involved physical security checks (pat-down and 3 bag search). Finally, respondents were more likely to choose travel settings with more 4 specialised security personnel at rail stations, except from non-white, non-conservative 5 individuals who were less likely to opt-in for settings where uniformed military were present. 6 7 Following the 7/7 London bombings, the UK Department for Transport commissioned a number 8 of trials in London underground and rail stations in England to capture passengers' acceptance 9 levels and response to transport security measures involving full-body scanners and luggage X-10 ray and sniffer dogs (Turley and Stone, 2006a; 2006b cited in Carter et al., 2015). Follow up 11 qualitative interviews and discussion groups with study participants revealed that full-body 12 scanners were an issue particularly for younger and Muslim women, but less of an issue for men 13 and older women. All study participants felt that all travellers should be subject to checks 14 through a body scanner rather than a random sample of travellers. Participants also felt that 15 conventional ways of scanning would cause delays and suggested that technologies should 16 enable scanning whilst walking (Turley and Stone, 2006a; 2006b cited in Carter et al., 2015). 17 London trials also involved traveller random stop-and-search where dogs sniffed closed luggage 18 followed by physical checks by British Transport Police. Individuals expressed concerns about 19 their dignity and also felt that physical search was embarrassing for them (Turley and Stone, 20 2006a; 2006b cited in Carter et al., 2015). 21 22 While the abovementioned studies provide detailed evidence from the UK, it is not entirely clear 23 whether citizens of other European countries would similarly respond. This is quite important 24 given that European policy is directed to citizens representing a wide array of cultures, languages 25 and worldviews thus not necessary conventional with evidence coming from a single country. 26 Therefore, this study is also aimed at addressing this gap in the literature by reporting on findings 27 at the pan-European level. 28 29 Other studies of similar nature to the above report findings in the context of air travel. Viensten 30 et al. (2011) elicit preferences for different security measures for mitigating the risk of aviation 31 terrorism. Security screening type, travel time, cost and the impact expressed as number of 32 fatalities because of a terrorist attack were the attributes employed to describe hypothetical air 33 travel situations. The study was based on a discrete choice experiment which was administered 34 via the Internet and involved 472 Norwegians. Each participant was presented with a scenario 35 under which they had to be identified via a biometric identity card and if disqualified as 'low-risk 36 passengers' they had to undergo through a body scanner. Respondents opted-in for protection of 37 their privacy rather than going through a body scanner; even after circumstances where the 38 perceived level of terrorist risk and subsequently the likelihood of preventing fatalities could be 39 reduced. The study also aimed at computing the value of statistical life (VSL) respondents' 40 placed upon an air terrorist attack, but the authors do highlight VSL values of €177 mil., an order 41 of magnitude higher than those adopted by Scandinavian governments. 42 43 Also in the context of air-travel security, Dillon and Thomas (2015) examined the US general 44 public's privacy concerns caused by body scanning and pat-down-body searches during 45 passenger airport screening. The sample involved 860 adults who lived in the Mid-Atlantic 46 States of New Jersey, Maryland, Pennsylvania and Virginia. Their study reported high levels of 47

Patil, Patruni, Potoglou, Robinson 6 trust on the security authorities by lower education-attainment participants. Security checks using 1 full-body scanning was broadly acceptable by air travellers, however, there were differences 2 across ethic groups; for example, Black, Hispanic and Asian and minority-religions individuals 3 were less likely to accept full-body scanning. In addition, women were less likely to accept pat-4 down full body searching. Finally, Beck et al. (2015) examined the choice between two security 5 processes when respondents were about to join an international flight from Australia. The survey 6 was conducted following the MH370 and MH17 Malaysia Airlines disasters and involved 304 7 participants. The data collection involved astated preference experiment and incorporated 8 attributes and levels developed by Potoglou et al. (2010) and Patil et al. (2014). Findings pointed 9 towards three classes of travellers: (a) those who were 'trusting' the authorities and were willing 10 to accept a range of security measures including privacy-intrusive measures; (b) those who were 11 'nervous' and would be willing to fly only with presence of security personnel (uniformed or not) 12 on board the aircraft; and (c) 'status quo' travellers who felt that the current level of security 13 provided sufficient protection. 14 15 To our knowledge, the only study on privacy and security conducted at multi-country level is by 16 Carter et al. (2015) who conducted an online survey to elicit travellers' opinions, acceptability 17 and perceived effectiveness of counter-terrorism measures at rail stations across England, Spain, 18 Romania and Italy in 2013. Findings showed that security staff and security measures would 19 reassure travellers. On the other hand, airport-style security checks were less popular and there 20 were mixed responses about sniffer dogs and the storage of personal data. The authors did point 21 out significant variation in preferences variationsacross British, Italian, Spanish and Romanian 22 respondents; for example, Italians were more open to airport-style screening than British 23 participants. Shortcomings of the study included the relatively small sample size, which also 24 limited the opportunity to generalise the results given limited representation of countries. Finally, 25 questions were purely opinion based with very little room to capture responses to varying 26 settings of security and surveillance. This study addresses these shortcomings by collecting data 27 across the EU27 with sample sizes varying from 750 to 1,000 participants per country. 28 29 The work reported in this study builds upon some of those previous efforts and is follow on work 30 from the pilot of the project reported by Patil et al. (2014) and a previous study Robinson et al. 31 (2010). It further makes an attempt to provide robust evidence based on the whether citizens 32 would forgo some civil liberties in the name of security and convience, especially in the context 33 of mass public-transport travel across EU27. 34 35 36 SURVEY INSTRUMENT AND DATA 37 The survey questionnaire was developed using contributions from the project consortium 38 consisting of experts in security and privacy along with stakeholder consultation, expert 39 interviews and focus groups. The scenarios in the stated preference experiments were extensively 40 tested through cognitive interviews and pilot surveys. The pilot surveys were conducted in 41 Denmark, Italy and Romania in May 2013 by surveying about 50 respondents in each of these 42 countries (PACT D2.3 2014). Using the feedback from the pilot surveys and cognitive interviews 43 the questionnaire was simplified and modified significantly. An additional small pilot was 44 deemed necessary to test the modified questionnaire. Accordingly, a second smaller pilot survey 45 (with 50 respondents) was undertaken in Romania in July 2013 before starting the main stage of 46 data collection. The fieldwork for the main stage of data collection in each of the EU27 countries 47
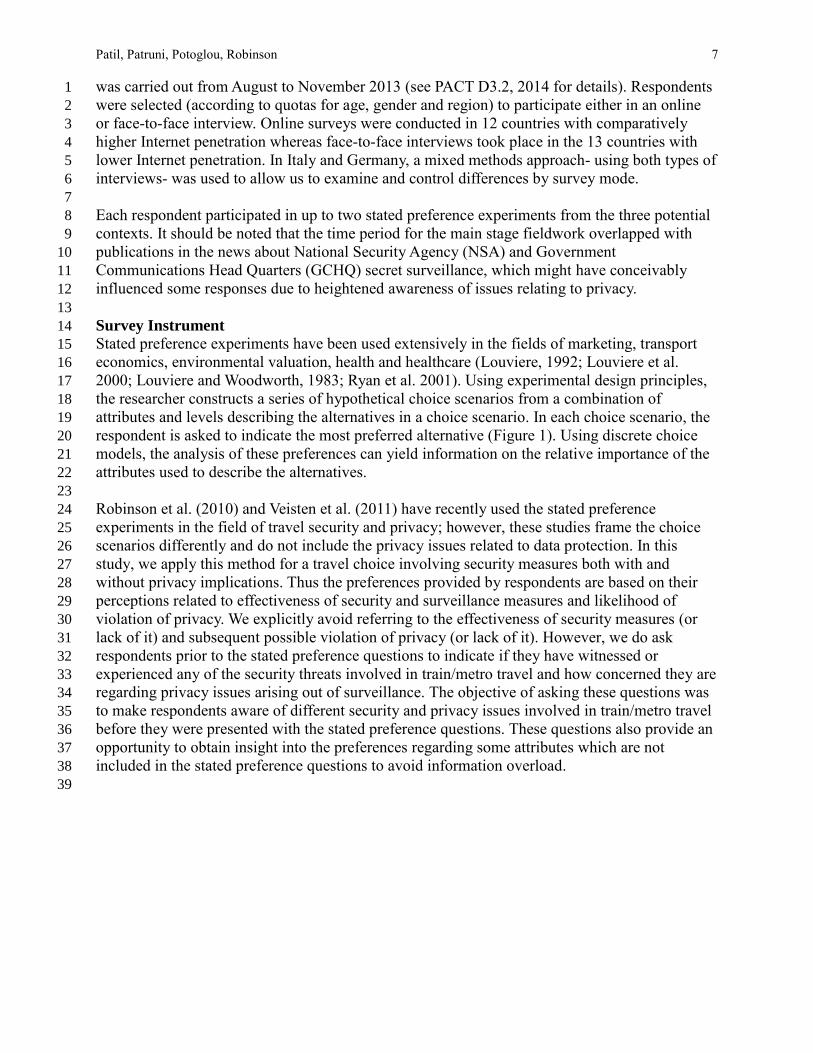
Patil, Patruni, Potoglou, Robinson 7 was carried out from August to November 2013 (see PACT D3.2, 2014 for details). Respondents 1 were selected (according to quotas for age, gender and region) to participate either in an online 2 or face-to-face interview. Online surveys were conducted in 12 countries with comparatively 3 higher Internet penetration whereas face-to-face interviews took place in the 13 countries with 4 lower Internet penetration. In Italy and Germany, a mixed methods approach- using both types of 5 interviews- was used to allow us to examine and control differences by survey mode. 6 7 Each respondent participated in up to two stated preference experiments from the three potential 8 contexts. It should be noted that the time period for the main stage fieldwork overlapped with 9 publications in the news about National Security Agency (NSA) and Government 10 Communications Head Quarters (GCHQ) secret surveillance, which might have conceivably 11 influenced some responses due to heightened awareness of issues relating to privacy. 12 13 Survey Instrument 14 Stated preference experiments have been used extensively in the fields of marketing, transport 15 economics, environmental valuation, health and healthcare (Louviere, 1992; Louviere et al. 16 2000; Louviere and Woodworth, 1983; Ryan et al. 2001). Using experimental design principles, 17 the researcher constructs a series of hypothetical choice scenarios from a combination of 18 attributes and levels describing the alternatives in a choice scenario. In each choice scenario, the 19 respondent is asked to indicate the most preferred alternative (Figure 1). Using discrete choice 20 models, the analysis of these preferences can yield information on the relative importance of the 21 attributes used to describe the alternatives. 22 23 Robinson et al. (2010) and Veisten et al. (2011) have recently used the stated preference 24 experiments in the field of travel security and privacy; however, these studies frame the choice 25 scenarios differently and do not include the privacy issues related to data protection. In this 26 study, we apply this method for a travel choice involving security measures both with and 27 without privacy implications. Thus the preferences provided by respondents are based on their 28 perceptions related to effectiveness of security and surveillance measures and likelihood of 29 violation of privacy. We explicitly avoid referring to the effectiveness of security measures (or 30 lack of it) and subsequent possible violation of privacy (or lack of it). However, we do ask 31 respondents prior to the stated preference questions to indicate if they have witnessed or 32 experienced any of the security threats involved in train/metro travel and how concerned they are 33 regarding privacy issues arising out of surveillance. The objective of asking these questions was 34 to make respondents aware of different security and privacy issues involved in train/metro travel 35 before they were presented with the stated preference questions. These questions also provide an 36 opportunity to obtain insight into the preferences regarding some attributes which are not 37 included in the stated preference questions to avoid information overload. 38 39

Patil, Patruni, Potoglou, Robinson 8
1 FIGURE 1 Example of the stated preference experiment in PACT. 2 3 The stated preference experiment in this study involved asking respondents to indicate their 4 preferred setting when travelling by metro or train. Only respondents who indicated that they 5 previously travelled by train/metro were presented the stated preference questions. Each 6 alternative was described using different attributes and levels (Table 1). Different configurations 7 of levels across all the attributes differentiated one alternative from another in a given choice 8 scenario. The choice scenarios were generated using an experimental design. Full questionnaire 9 including the details on experimental design are described in PACT’s project deliverable (PACT 10 D2.3, 2014). 11 12 Data 13 Approximately 1,000 respondents aged 18 and older were interviewed in all the countries except 14 for Luxembourg, Malta, and Cyprus where about 750 responses were collected due to smaller 15 population sizes. About half of all the respondents answered questions on travel context which is 16 relevant for this paper. Each respondent answered five stated preference exercises resulting into a 17 total of 64,785 choices from 12,957 respondents. About 6.7% of the observations are excluded 18 because they could be possibly unreliable (based on reported understanding of the experiment 19 and unrealistically less time taken to complete the exercise). Further, excluding the missing 20 responses leaves 60,472 observations (choices) for the stated preference modelling exercise. 21 Further details on sample sizes by country and survey mode are provided in PACT D4.1 (2014). 22 23 24

Patil, Patruni, Potoglou, Robinson 9 TABLE 1 Attributes and Levels in the Metro/Travel Choice Scenarios 1
Attribute Details Levels
Type of CCTV cameras
This attribute describes if a CCTV camera is used and its features.
Standard CCTV – working like a television
Advanced CCTV that can detect abandoned bags Advanced CCTV that can recognise suspicious movements of people
Advanced CCTV that can recognise faces
No CCTV cameras
How long CCTV Camera information is stored?
Time period CCTV data may be stored (conditional on presence of CCTV )
CCTV information not stored for future use-only used in real time monitoring CCTV information stored for 3 days CCTV information stored for 7 days CCTV information stored for 15 days CCTV information stored for 45 days
Who can access CCTV Camera information?
Type of authorities who may access the CCTV data (conditional on presence of CCTV), Level 1 corresponds to the respondent's country of residence [e.g. UK, FR]
Only police departments in the [UK] have access to the camera information All European police departments have access to the camera information All police departments worldwide have access to the camera information
Security personnel at the station
Type of security personnel, if present
No security personnel Unarmed security personnel employed by a private company Armed security personnel employed by a private company Unarmed police
Armed police
Type of security checks at the station
Type of security measures when deployed
People randomly selected for physical search and bag check People randomly selected to go through metal detector or full body scanner No physical security checks
Time to go through security checks
Delay incurred due to security checks (No delay if no security measure deployed)
10 seconds 30 seconds 1 minute
2 minutes 5 minutes No delay
Security surcharge on top of ticket cost (per trip)
Levels are adjusted to display cost in Euro or local currency (e.g. £)
No security surcharge
Security surcharge of 0.05 Euro
Security surcharge of 0.10 Euro Security surcharge of 0.30 Euro
Security surcharge of 0.50 Euro

Patil, Patruni, Potoglou, Robinson 10
Security surcharge of 1.00 Euro
MODELING APPROACH 1 The responses obtained through the choice experiments are analysed using a multinomial logit 2 model. The model is based on the principle of Random Utility Maximisation (RUM) (Ben-3 Akiva and Lerman, 1985; Marschak, 1974; McFadden, 1978). According to RUM, a respondent 4 choses an alternative which provides maximum utility. Utility is a latent construct divided in two 5 components; a deterministic and a random (error) component. The deterministic component of 6 the utility can be specified using observable variables which are likely to affect the respondent’s 7 choice as follows: 8 � = ��� + ∑ (� � )�=1 (1) 9
10 where: 11 Vij is deterministic component of utility for individual i and alternative j 12 ASCj is the alternative specific constant of the alternative j 13 Xjk is kth variable which describes the alternative j, k=1,.., K 14 βjk is the coefficient to be estimated 15 16 The multinomial logit model assumes that the error components are extreme value (or Gumbel) 17 distributed, and the choice probability Pij of an alternative j for individual i is given by Equation 18 2. 19 20 � = ��� �∑ ��� ��=1 (2) 21
22 The multinomial logit model used in this study has been developed using the data from all the 23 respondents in the EU27 countries. Hence, a single weight is estimated for each of the attribute 24 levels, which could be interpreted as the EU average value. However, even in this case, when 25 pooling data from different country samples it is necessary to consider the possible variation in 26 the unobserved factors or error-variation in the models between countries. These can include 27 different measurement errors across samples and other unobserved cultural and contextual 28 factors. Furthermore, surveys in some countries were carried out online, while others were 29 undertaken ‘face to face’. These two types of survey modes may also give rise to variations in 30 unobserved factors or error-variation in the models, which need to be controlled for. Accordingly, 31 the variation in quality of responses across the following two dimensions is taken into account: 32 Country scales to control for country-specific unobserved factors such as difference in 33
quality of data and survey implementation across the EU27. 34
Scales by survey methodology to control for variation in response quality between the 35
online and face-to-face survey methodologies. 36
Further, to account for correlations between multiple stated preference responses from one 37 respondent, a panel specification can be specified. A panel specification however increases the 38 model estimation time considerably for the large dataset we are using. Hence in order to correct 39 for model mis-specification and to take into account the repeated nature of the SP data we use 40 bootstrap resampling procedure on the final model (Efron and Tibshirani, 1994). 41
42

Patil, Patruni, Potoglou, Robinson 11 RESULTS AND DISCUSSION 1 In this section we present the results of the discrete choice models of stated preferences related to 2 CCTV data privacy and other security measures. The summary of experiences related to security 3 threats and privacy concerns as captured by questions before the stated preference questions is 4 also presented in this section. 5 6 Security threats in train/metro travel 7 Figure 2 shows the various security threats that respondents across EU27 have either experienced 8 or witnessed during a metro/train journey. The following observations can be drawn from Figure 9 2: 10
1. Pick-pocketing has been experienced by 9% of the respondents while travelling on a 11
metro/train and 13% of the respondents witnessed an act of pick-pocketing. 12
2. More than 50% of the respondents have witnessed anti-social behaviour and fare evasion. 13
3. More than 20% of the respondents have witnessed vandalism and violence during their 14
journeys. 15
4. 3% of respondents stated that they have experienced terrorism. 16
These experiences are likely to affect preferences related to security and surveillance measures. 17
18 FIGURE 2 Proportion of respondents who have experienced or witnessed security threats. 19 20 Privacy Concern across EU27 21 Respondents' concern for privacy while travelling are collected on a Likert-type scale ranging 22 from ‘Not concerned at all’ to ‘Very concerned’ based on their responses to the following 23 question: 24 How concerned are you about the following when travelling by train or metro? 25 Misuse of CCTV camera images by the authorities 26
Misuse of travel data (travel origin, destination, frequency) for tracking a 27
person’s whereabouts 28
Misuse of security measures for sexual or racial harassment 29
Sharing travel data and CCTV images across and outside the EU. 30

Patil, Patruni, Potoglou, Robinson 12 1 Table 2 presents a summary of responses capturing privacy concern across the EU27. While each 2 of these four statements reflects a different type of privacy threat, it can be observed that the 3 percentage of respondents with each level of concern is broadly similar across all four 4 statements. 5 6 TABLE 2 Privacy concerns across EU27 7
1 (not
concerned at all)
2 3 4
5 (very
concerned)
Total Number of Responses
Misuse of CCTV camera images by the authorities 32.4% 22.0% 22.2% 13.8% 9.6% 12,720
Misuse of travel data (travel origin, destination, frequency) for tracking a person’s whereabouts
28.3% 22.2% 23.4% 15.7% 10.4% 12,742
Misuse of security measures for sexual or racial harassment 29.0% 20.5% 23.3% 15.5% 11.7% 12,693
Sharing travel data and CCTV images across and outside the EU
27.3% 20.5% 24.5% 16.1% 11.6% 12,670
8 Accordingly, an overall index which represents the respondents’ concern for privacy while 9 travelling is derived based on the number of ‘concerned’ responses to the above statements. 10 Respondents are classified into four categories: High Concern (3 or more ‘concerned’ responses); 11 Medium Concern (2 ‘concerned’ responses); Low Concern (1 ‘concerned’ response) and No 12 Concern. 13 14 Figure 3 shows the variation in proportion of respondents with ‘High Concern’ for privacy in 15 Travel context across the EU27. The following observations can be drawn: 16
1. The highest proportions of respondents with ‘No Concern’ for privacy in the Travel 17
context are observed in the Nordic countries (Denmark, Sweden and Finland), and in 18
Slovakia and Netherlands. 19
2. The highest proportion of respondents with ‘High Concern’ for privacy in the Travel 20
context are observed in southern European countries ( Spain, Greece and Portugal) and 21
central eastern European countries (Latvia, Lithuania and Bulgaria). 22
23

Patil, Patruni, Potoglou, Robinson 13
1 FIGURE 3 Proportion of respondents with high travel-privacy-concern index. 2 3

Patil, Patruni, Potoglou, Robinson 14 Results of the discrete choice model 1 Table 3 presents estimated parameters of the multinomial logit model. Since the choice scenario 2 involves three unlabelled alternatives only one alternative specific constant is estimated, placed 3 on the utility of the “None of these” alternative (labelled ‘none’ in Table 3). This constant is 4 specified to be country specific including a separate constant for methodology in Italy and 5 Germany where both online and face-to-face surveys were used. 6 7 The effects of socio-economic variables such as age, gender, income, education level and 8 working status on the preferences relating to security and surveillance are also included in the 9 discrete choice models. Only the statistically significant coefficients at a 95 per cent level of 10 confidence are retained in the final model specification. 11 12 Preferences across EU27 countries 13 We observe broadly similar preferences across countries. Where the preferences differ 14 significantly in a given country these are specifically identified and the effects are presented in 15 Figures 4 to 6 (the definition of country acronyms can be found in the Appendix). The values 16 shown in these charts are expressed in units of utility in order to highlight differences in relative 17 preference across countries. Furthermore, bars to the right of the vertical axis represent positive 18 preferences and those to the left represent disinclination. The length of a bar is indicative of the 19 strength of a preference relative to the baseline of each attribute. In each figure, the series 20 marked by ‘all other’ refers to the EU27 countries, excluding the countries identified in the chart. 21 The ‘all other’ group is therefore, in most cases, representative of respondents in most EU 22 countries. It should be noted that the ‘all other’ group also includes the reference level of 23 significant socio-economic effects. However, confounding of these effects should not affect the 24 relative comparison of utilities between countries (note that the socio-economic effects are not 25 specified to be country specific). 26 27 Type of CCTV camera 28 In most EU27 countries, respondents prefer CCTV cameras when compared to the reference 29 level, ‘No CCTV’. As shown in Figure 4, respondents’ preferences for the types of CCTV are in 30 the following order: (1) advanced CCTV that can detect faces, (2) CCTV that can detect 31 abandoned bags, (3) CCTV that can recognise suspicious movements of people, and finally, (4) 32 standard CCTV (which works like a television). 33 34 However, the strength of preference for the different CCTV camera types differs across eleven 35 countries. While all types of CCTV cameras are still preferred over ‘No CCTV’ in these 36 countries, the magnitude of preference varies. We observe stronger preference for all types of 37 cameras in France, and stronger preference for standard CCTV cameras over other camera types 38 in Sweden, whereas in Bulgaria, the Czech Republic, Denmark, Greece, Hungary, Latvia, 39 Poland, Portugal and Slovakia the preference for CCTV cameras is weaker compared to other 40 countries in the EU27. 41 42

Patil, Patruni, Potoglou, Robinson 15 TABLE 3a Model Results- Main effects 1
Summary statistics Observations 60,472 Final Log Likelihood -61,319.3 D.O.F 137 Rho²(0) 0.077 Rho²(c) 0.054 Description Label Coefficient t-ratio Type of CCTV cameras Standard CCTV – working like a television cam_std 0.8358 12.64 Advanced CCTV that can detect abandoned bags cam_bag 0.9429 13.15 Advanced CCTV that can recognise suspicious movements of people cam_sus 0.8718 12.69 Advanced CCTV that can recognise faces cam_face 0.9785 13.24 No CCTV cameras cam_none 0 n/a
How long CCTV camera information is stored CCTV information not stored for future use – only real-time monitoring dur_rt 0.0000 n/a CCTV information stored for 3 days dur_3d 0.1801 6.82 CCTV information stored for 7 days dur_7d 0.3156 9.80 CCTV information stored for 15 days dur_15d 0.3225 10.09 CCTV information stored for 45 days dur_45d 0.1666 6.23 Who can access CCTV camera information Only police departments in the [UK] have access to the camera information acc_op 0.0000 n/a All European police departments have access to the camera information acc_eu -0.1261 -6.83 All police departments worldwide have access to the camera information acc_int -0.2327 -9.72 Security personnel at the station No security personnel per_none 0 n/a Unarmed security personnel employed by a private company pers_pvt 0.3115 10.24 Armed security personnel employed by a private company pers_ta 0.2336 8.32 Unarmed police pers_pol 0.4450 11.78 Armed police pers_arm 0.2205 7.83 Type of security checks at the station People randomly selected for physical search and bag check sec_pd -0.2449 -9.50 People randomly selected to go through metal detector or full body scanner sec_md -0.0318 -1.65 No physical security checks sec_none 0 n/a Time to go through security checks
time -0.0003 -8.55
10 seconds 30 seconds 1 minute 2 minutes 5 minutes Security surcharge on top of ticket cost HH Income less than €500 cost_1t4 -0.0074 -10.05 HH Income from €500 to €1,250 cost_5t6 -0.0059 -10.28 HH Income from €1,250 to €5,000 cost_7t14 -0.0040 -11.40 HH Income greater than €5,000 cost_gt14 -0.0033 -5.17 Missing Income (Low-income countries) cost_NA_L -0.0134 -10.16 Missing Income (Medium-income countries) cost_NA_M -0.0066 -7.02 Missing Income (High-income counties) cost_NA_H -0.0071 -3.11
2

Patil, Patruni, Potoglou, Robinson 16 TABLE 3b Model Results- Country and socio-economic interaction effects 1
Description Label Description Coefficients t-ratio Type of CCTV cameras Standard CCTV – working like a television cam_std_SE Sweden 0.2534 3.76 Advanced CCTV that can recognise faces Camface_HU Hungary -0.2254 -3.39
No CCTV cameras
Nocam_BG Bulgaria 0.5875 6.12 Nocam_CZ Czech Republic 0.7531 9.31 Nocam DK Denmark 0.4228 5.52 Nocam_EL Greece 0.6566 7.69 Nocam_FR France -0.3605 -1.86 Nocam_HU Hungary 0.5636 7.07 Nocam_LV Latvia 0.5504 4.92 Nocam_MT Malta 0.0000 n/a Nocam_PL Poland 0.4607 4.24 Nocam_PT Portugal 0.7008 6.45 Nocam_SK Slovakia 0.6238 6.44 Nocam_male Male 0.1715 5.20 Nocam_1824 Age group 18–24 0.0954 1.91 Nocam_5564 Age group 55–64 -0.1268 -2.98
How long CCTV camera information is stored?
CCTV information not stored for future use –only real-time monitoring
dur_rt_AT Austria 0.1858 2.27 dur_rt_EL Greece 0.3542 4.65 dur_rt_EE Estonia -0.3248 -3.68 dur_rt_IE Ireland -0.2105 -2.84
CCTV information stored for 45 days dur_45d_MT Malta 0.0000 n/a dur_45d_ES Spain 0.2400 3.33 dur_45d_CZ Czech Republic -0.2153 -2.89
Who can access CCTV camera information All European police departments have access to the camera information acc_eu_LV Latvia -0.2672 -2.78 All police departments worldwide have access to the camera information acc_int_DE Germany -0.3473 -3.74 Security personnel at the station
No security personnel
nospers_BE Belgium -0.2234 -2.87 nospers_CY Cyprus -0.6167 -2.83 nospers_CZ Czech Republic 0.2399 3.94 nospers_DE Germany 0.2673 4.89 nospers_ES Spain -0.4031 -4.99 nospers_FR France -0.5466 -3.33 nospers_HU Hungary 0.2722 4.29 nospers_IT Italy -0.2368 -2.66
Unarmed security personnel employed by a private company perspvt_FR France -0.4115 -3.60
Armed security personnel employed by a private company
persta_DE Germany -0.4010 -5.58 persta_EE Estonia 0.1403 2.04 persta_FR France -0.3465 -2.95 persta_IE Ireland -0.2299 -3.60 persta_UK UK -0.2682 -3.95
Armed police persarm_BE Belgium 0.2361 3.51 persarm_FR France 0.3735 3.67 persarm_PL Poland -0.3400 -3.28

Patil, Patruni, Potoglou, Robinson 17
Type of security checks at the station
No physical security checks
nosec_AT Austria 0.2671 4.57 nosec_CZ Czech Republic 0.2064 3.62 nosec_DE Germany 0.4974 5.51 nosec_DK Denmark 0.1342 2.83 nosec_ES Spain -0.1416 -2.88 nosec_FR France -0.1850 -2.83 nosec_IT Italy -0.2843 -4.26 nosec_LV Latvia 0.3802 4.23 nosec_PL Poland 0.3058 3.50 nosec_SE Sweden 0.2332 3.99 nosec_SI Slovenia 1.1783 2.76 nosec_SK Slovakia 0.2648 3.47 nosec_UK UK -0.1284 -2.46
People randomly selected to go through metal detector or full body scanner
sec_md_BG Bulgaria 0.1959 3.00 sec_md_LU Luxembourg -0.2542 -3.50 secmd_1824 Age group 18–24 0.0602 1.73
1 TABLE 3c Model Results- Country and socio-economic effects on scales and the constant 2
Scales None constant Country Label Coef. t-ratio Country Label Coef. t-ratio Austria Scale_AT 1.0000 n/a Italy (Face) None_IT_F -0.0944 -0.7 Belgium Scale_BE 1.1690 10.8 Italy (Online) None_IT_O 0.1007 1.0 Bulgaria Scale_BG 1.0387 6.6 UK None_UK 0.2613 4.0 Cyprus Scale_CY 0.8774 5.3 Sweden None_SE 0.9846 11.5 Czech Republic Scale_CZ 1.4830 6.7 Spain None_ES 0.2735 4.0 Denmark Scale_DK 1.5837 9.2 Slovenia None_SI 0.9659 4.4 Estonia Scale_EE 1.0703 10.7 Slovakia None_SK 0.5923 7.2 Finland Scale_FI 1.0903 11.0 Romania None_RO -0.4055 -2.5 France Scale_FR 0.9150 6.7 Portugal None_PT 0.5911 6.9 Germany Scale_DE 0.9054 8.9 Poland None_PL 0.8790 9.9 Greece Scale_EL 1.3550 6.6 Netherlands None_NL 0.3597 4.8 Hungary Scale_HU 1.6390 6.9 Malta None_MT -0.2613 -1.7 Ireland Scale_IE 1.1664 11.3 Luxembourg None_LU 0.3513 4.2 Italy Scale_IT 1.0825 9.6 Lithuania None_LT 0.1498 0.6 Latvia Scale_LV 1.0086 6.3 Latvia None_LV -0.6409 -3.4 Lithuania Scale_LT 0.6654 3.4 Ireland None_IE 0.3804 6.0 Luxembourg Scale_LU 0.9271 9.5 Hungary None_HU 1.0252 12.0 Malta Scale_MT 1.0878 6.3 Greece None_EL 0.3892 4.5 Netherlands Scale_NL 0.9444 9.9 Germany (Face) None_DE_F 0.4230 3.8 Poland Scale_PL 1.1924 6.4 Germany (Online) None_DE_O 0.7058 7.5 Portugal Scale_PT 1.0543 6.3 France None_FR -0.0833 -0.5 Romania Scale_RO 0.6846 6.2 Finland None_FI 0.7701 10.8 Slovakia Scale_SK 1.1285 6.4 Estonia None_EE 0.0811 1.0 Slovenia Scale_SI 0.4128 3.6 Denmark None_DK 1.1011 12.4 Spain Scale_ES 1.2204 11.1 Czech Republic None_CZ 0.9664 11.4 Sweden Scale_SE 1.1708 11.0 Cyprus None_CY 0.2371 1.6 UK Scale_UK 1.1836 11.1 Bulgaria None_BG -0.6235 -3.7
Survey method effects Belgium None_BE 0.5128 7.2 Online Scale_O 1.0000 n/a Austria None_AT 0.7045 8.5 Face to Face Scale_F 0.8298 10.3
3

Patil, Patruni, Potoglou, Robinson 18
1 FIGURE 4 Relative preferences for different types of CCTV across the EU27. 2 3 Duration of storage 4 In most EU27 countries, given that CCTV cameras are used, respondents prefer that CCTV 5 information is stored for future use, relative to the reference level that CCTV information is only 6 used for real-time monitoring. The magnitude of the coefficients for the duration of storage 7 indicates the respondents’ order of preference for storing CCTV information. We observe a U-8 shaped pattern: 15 days’ storage time is the most preferred, followed by 7 days and 3 days 9 whereas 45 days is the least preferred (see, Figure 5). 10 11 Contrary to the above preferences in most EU27 countries, respondents in Greece indicate a 12 strong aversion to storage of CCTV data and prefer only real-time monitoring. This outlying 13 dispreference for storage of surveillance data in Greece could be due to a history of authorative 14 surveillance in the country (see, Samatas (2002, 2008) for details). Furthermore, respondents in 15

Patil, Patruni, Potoglou, Robinson 19 the Czech Republic show disinclination towards storage of CCTV data for 45 days and those in 1 Spain prefer storage for longer durations over shorter ones. Respondents in Estonia and Ireland 2 indicate stronger preferences for data storage over real-time use compared to other countries in 3 the EU27. Respondents in Austria prefer real-time use and medium-term storage (7 to 15 days). 4 5
6 FIGURE 5 Relative preferences for duration of storage of CCTV data 7 8 Access to CCTV data 9 Across the EU27, respondents show a disinclination towards the option of CCTV information 10 being accessed by police departments outside their home country (across Europe and 11 worldwide), although they are more averse to CCTV information being shared among all police 12 departments worldwide than across only European police departments. Respondents in Germany 13 indicate a stronger disinclination towards the option of providing access to all police departments 14 worldwide compared to other countries in the EU27. Respondents in Latvia are more averse to 15 CCTV information being shared across Europe than other countries in the EU27. These effects 16 are shown in Figure 6. 17

Patil, Patruni, Potoglou, Robinson 20
1 FIGURE 6 Relative preferences for geographic level of access to CCTV data 2 3 Security Personnel 4 In most EU27 countries, respondents prefer having security personnel at train/metro stations 5 relative to the reference level of ‘No security personnel’. Unarmed police is the most preferred 6 option, followed by unarmed security personnel employed by a private company and armed 7 police; armed security personnel employed by a private company are least preferred. 8 9 Preferences in favour of security personnel are stronger in Belgium, Cyprus, France, Spain and 10 Italy compared to other countries in the EU27, whereas they are lower in the Czech Republic, 11 Germany and Hungary. Contrary to the pattern in other countries, respondents in Germany, 12 Hungary and the UK indicate disinclination towards armed security personnel employed by a 13 private company when compared with settings involving no security personnel. Respondents in 14 Germany and Hungary also indicate disinclination towards armed police, along with those in 15 Czech Republic and Poland. Armed security personnel employed by a private company are also 16 less preferred than other security personnel in France and Ireland (however, they are still 17 preferred over having no security personnel), whereas in Estonia they are preferred over unarmed 18 personnel employed by a private company. In Belgium and France, armed police are the most 19 preferred type of security personnel, with respondents in France indicating stronger preference 20 for police (armed/unarmed) over private security personnel. 21 22 Security Checks 23 Respondents across Europe are averse to having to go through physical security checks, and are 24 more averse to physical searches that include a bag search than going through a full body scanner 25 or metal detector. However, the disinclination towards a physical check involving a metal 26 detector/full body scanner compared to no physical checks becomes statistically insignificant 27 after controlling for the country and socio-economic variables. 28 29 In more than half of the EU27 countries, respondents exhibit significantly different preferences 30 for security checks. In Austria, the Czech Republic, Germany, Denmark, Latvia, Poland, Sweden, 31 Slovenia and Slovakia the disinclination is stronger and significant for both types of physical 32 checks. However, respondents in Spain, France and the UK indicate a weaker disinclination 33 towards physical searches that include a bag search and indicate a preference for having a 34 physical check involving a metal detector/full body scanner over no physical security check. 35 These three countries have experienced terrorist attacks on public transport facilities in recent 36 years – which could explain these preferences. Respondents in Italy prefer both types of 37

Patil, Patruni, Potoglou, Robinson 21 physical security checks over no physical security checks, whereas those in Bulgaria prefer a 1 physical check involving a metal detector/full body scanner. Respondents in Luxembourg exhibit 2 a stronger disinclination towards metal detectors/full body scanners compared to physical 3 searches and bag checks. 4 5 Delays due to security checks 6 All respondents prefer travel options that take less time to avoid any additional delay due to 7 security checks. No country-specific or socio-economic effects were identified in this attribute. 8 9 Security surcharge on top of the ticket (cost) 10 Respondents also dislike paying additional security surcharges. Individuals with households with 11 higher monthly incomes are less sensitive to increases of security surcharge on top of the ticket 12 (decreasing cost sensitivity with increasing income). In the model, we have merged the 17 13 income bands into four aggregate bands (monthly income of less than €500, €500 to 1,250, 14 €1,250 to 5,000, and greater than €5,000) – grouping the adjacent bands when the coefficients 15 are not statistically different for individual income bands. A significant proportion (13.7 per cent) 16 of respondents refused to report their income, as they answered ‘prefer not to say’ or ‘don’t 17 know’. A separate coefficient for surcharge on top of the ticket cost is estimated for this group of 18 respondents. Furthermore, the respondents in this group are split by country of residence using 19 low-, medium- and high-income country groups to account for the wide range of average income 20 across the EU27. Thus the final model contains cost coefficients for seven different groups based 21 on their answers to the income question. 22 23 Differences by socio-economic status 24 We also tested differences in respondents' preferences based on age (18 to 24, 25 to 34, 35 to 44, 25 45 to 54, 55 to 64 and 65 plus), gender, working status (full time, part time, looking after family, 26 unemployed, student, retired, not in work due to disability, seeking work, and other), education 27 level, income, and location of residence (big city, suburb, town, village, countryside/farm). These 28 effects are tested on all attribute levels (except on attributes delay and cost) and on the constant 29 for the ‘none of these’ alternative. We observe the following significant effects: 30 Respondents of all age groups and across the EU27 prefer CCTV cameras than 'No 31
CCTV'. However, the preference is weaker for young people (aged 18 to 24) and stronger 32 for those aged between 55 and 64. In addition, we observe that while both males and 33 females prefer CCTV cameras, females have stronger preference for CCTV cameras 34 compared to males. 35 Young respondents (aged 18 to 24) across the EU27 have a stronger disinclination 36 towards physical checks involving metal detectors/full body scanners compared to other 37 age groups. Also, young people (aged 18 to 24) show a stronger disinclination towards 38 choosing the ‘none of these’ alternative – indicating that they are more likely to choose 39 alternatives A and B, which present a combination of security, surveillance and privacy 40 levels. 41
42

Patil, Patruni, Potoglou, Robinson 22 CONCLUSION 1 This paper presents empirical evidence from a EU27-wide survey aimed to examine individuals' 2 preferences for different aspects of data privacy in the context of train/metro travel in Europe. 3 The preferences are collected across seven dimensions each forming an attribute taking different 4 levels in a stated preference experiment. These dimensions include type of surveillance 5 technology (CCTV spanning basic to advanced features), the storage time for surveillance data, 6 geographic level of data access by police authorities (i.e., country of residence, EU, worldwide), 7 level of specialisation of security personnel, type of security checks, delays to go through these 8 security checks, and potential surcharge to cover security costs. 9 10 Overall, Europeans were in favour of surveillance using CCTV with most popular preference 11 being for CCTV technology that can detect faces. We did, however, observe cross-country 12 variations; respondents in Bulgaria, the Czech Republic, Denmark, Greece, Hungary, Latvia, 13 Poland, Portugal, and Slovakia expressed lower strength of preference than other counties. 14 Respondents across all countries were in favour of a 15-day storage period of footage recorded 15 via CCTV, except in Greece. Czech's were averse to options that involved storage of footage for 16 45 days and the Spanish were in favour of longer than shorter periods of storing CCTV footage. 17 Respondents prefered that the disclosure of CCTV data should be limited to police within the 18 home country rather than shared with police authorities across Europe or Worldwide. With regard 19 to security personnel at train/metro stations, Europeans would prefer unarmed police officers at 20 stations over unarmed police and private security personnel. Again preferences for security 21 personnel exhibited cross country variations; for example, respondents in Belgium and France 22 preferred armed police over the unarmed police. Respondents were in favour of passive security 23 checks such as body scanners and metal detectors and were averse to physical checks, but again 24 with significant differences in strength of preference across countries. Finally, respondents were 25 less likely to choose travel settings that involved increased delays and security surcharges against 26 security. There could be a number of reasons for the variation in prefrences in some of the 27 countries, including – culture, history of surveillance, history of terrorist attacks on public 28 transport facilities, etc. 29 30 There were three particular cases which shed light on the role that past context and history plays 31 in peoples preferences. Our research revealed a marked divergence in how Greek respondents 32 viewed the storage of CCTV data, compared to other countries. This may be due to a number of 33 reasons, notably the storage of records associated with Communist sympathizers during the civil 34 war (1945-49) or the time of the military dictatorship in Greece (1967-1974). This historical legacy 35 could have resulted in a general distrust of any collection of records (Mitrou, et al 2014). 36 Nonetheless, the observation is interesting since one would expect, given the strong legacy of a 37 surveillance state in East Germany during the Cold War (1951-1991) that Germany would be the 38 divergent country in regard to this attribute. The fact that they, nor any of the other Eastern 39 European countries where state surveillance was endemic (Hungary, Romania; Czech Republic 40 etc.) were divergent is also perhaps revealing about the familiarity to such surveillance measures 41 (or that these countries have more CCTV relative to the others). 42 43 There is a second interesting divergence in regard to the identified prferences of German 44 respondents, who are shown by our analysis to dislike armed security at train/metro stations 45 relative to other countries. Whilst at first glance Germany, especially in the 1930-1940s may 46 present an obvious answer the reality may be more complex. In Germany, law enforcement is soley 47

Patil, Patruni, Potoglou, Robinson 23 the responsibility of the State, in particular police and municipalities departments of public order 1 (Frevel, 2013). Private security is restricted and private secrurity firms, as elsewhere, cannot use 2 force or arrest individuals. Since Germany is a federal state, there are specific federal-level police 3 departments rather than a general national police force. The federal nature of the country with its 4 16 lander (states) may also play a role, if only to demonstrate that reluctance for public/private 5 personnel to carry firearms transcends state borders. 6 7 Finally, the third inter-country difference concerns respondents in Bulgaria, UK, Spain, France and 8 Italy displaying dislike of metal detectors / full body scanners compared to respondents from other 9 countries. For Bulgaria, the answer may lie in the absence of such technologies of this kind of 10 infrastructure; Sofia’s metro is small consistiting of two lines. For the other countries, this may be 11 due to the effect of the country has been subject to terrorist attacks, especially the UK and Spain 12 where prior to the fieldwork there have been terrorist attacks launched against metro/rail 13 infrastructures. 14 15 Overall, analysis of the data illustrates the complexity of the privacy / security debate as it 16 pertains to transportation infrastructures. In particular, the increased use of transportation user 17 data for various reasons outlined above (efficiency, safety and security) can pose complex social 18 and ethical challenges to users, especially around perceptions of consent, accountability and 19 transparency. 20 21 Privacy as a term is regarded as highly malleable (Solove, 2011) and the results presented here 22 illustrate that in the context of transportation infrastructure, challenges to privacy are seen as 23 stemming from invasions into the person space of users (through pat downs or other forms of 24 searching), in addition to more complex concepts regarding consent, control and accountability 25 of personal data about travellers collected through these infrastructures. Privacy issues in the 26 transportation domain are thus different because they conflate privacy as it relates to personal 27 space (physicality) and privacy as it relates to control of personal data about oneself. 28 29 30

Patil, Patruni, Potoglou, Robinson 24 POLICY RECOMMENDATIONS 1 The empirical evidence from this study contributes to some interesting insights which can inform 2 policy. 3 The study highlights that acceptability of surveillance and security measures depends on 4
the level of access to personal information. Thus the regulations/infrastructure designed 5
around security and privacy need to address the concerns relating to certain forms of 6
surveillance and measures. 7
While the level of similarity of preferences observed across the EU27 is noteworthy, 8
there are interesting differences. For example, in countries that have experienced 9
terrorism on transport facilities in recent past, respondents indicate stronger preferences 10
for metal detectors, unlike other countries in EU27. Further, certain groups of 11
respondents have different preferences than others. The security and surveillance 12
infrastructure needs to take into account the needs of various segments of society. 13
From a regulatory perspective, the issues most at stake concern creating a culture of 14
accountability, particularly where public and private organisations are involved in the 15
collection and use of these data. Whilst private sector organisations may collect such data 16
in order to deliver efficiencies in network management, the same data might be useful 17
and could be disclosed to government bodies in the interests of law enforcement or 18
national security. Further challenges exist in communicating these terms and conditions 19
of data to the users of transportation facilities. 20
21 STRENGTHS AND LIMITATIONS 22 This study is first ever to provide an evidence on citizen’s security and privacy preferences 23 across the EU27 using a stated preference survey. The strength of this study lies in the rich 24 insights it provides on public preferences towards type of surveillance, data privacy settings, 25 security personnel, and security checks. Limitations of this study include possible sources of 26 error due to survey nonresponse, question wording and question order. While this research 27 presents an aggregate picture for EU27, it does not estimate country specific models which could 28 provide even greater insight into variations across the 27 Member States. Further, this study is 29 subject to the limitations of a stated preference survey. Actual real-life preferences may be 30 different and the concerns could change with time. Nevertheless, the findings presented here are 31 useful to understand the relative preferences and contribute to the scarce evidence base on trends 32 in preferences related to privacy and security. 33 34 ACKNOWLEDGEMENTS 35 This research was funded by the European Commission through the 7th Framework Programme 36 (GA: 285635). The authors also wish to thank the PACT consortium for their contribution during 37 survey development. 38 39 40

Patil, Patruni, Potoglou, Robinson 25 APPENDIX 1 2 Country codes 3 BE Belgium 4 BG Bulgaria 5 CZ Czech Republic 6 DK Denmark 7 DE Germany 8 EE Estonia 9 IE Ireland 10 EL Greece 11 ES Spain 12 FR France 13 IT Italy 14 CY Cyprus 15 LV Latvia 16 LT Lithuania 17 LU Luxembourg 18 HU Hungary 19 MT Malta 20 NL Netherlands 21 AT Austria 22 PL Poland 23 PT Portugal 24 RO Romania 25 SI Slovenia 26 SK Slovakia 27 FI Finland 28 SE Sweden 29 UK United Kingdom 30

Patil, Patruni, Potoglou, Robinson 26 REFERENCES 1 Beck, M.J., Rose, J. and Merkert, R. (2015). Air safety & security: Traveller perceptions 2
post the Malaysian Air disasters. 14th International Association for Travel Behaviour 3 Research IATBR Conference, Windsor, United Kingdom, 23rd July 2015. 4
Ben-Akiva, M. and S. R. Lerman (1985), Discrete Choice Analysis: Theory and 5 Applications Travel Demand, Cambridge: The MIT Press. 6
Carter, E., Paragreen, J., Valfrè, G., & Fletcher, D. (2016). Passenger acceptance of 7 counter-terrorism security measures in stations. IET Intelligent Transport Systems, 8 10(1), 2-9. doi:10.1049/iet-its.2015.0031 9
Dilon, T.W. and Thomas, D.S. (2015) Exploring the acceptance of body searches, body 10 scans and TSA trust, Journal of Transportation Security, 8, 51-67. doi:10.1007/s12198-11 015-0157-7 12
Efron, Bradley, and Robert J. Tibshirani, An introduction to the bootstrap, CRC Press, 13 Boca Raton FL, 1994 14
European Commission (2015). The European Agenda on Security, COM (2015) 185 15 Final, http://ec.europa.eu/dgs/home-affairs/e-library/documents/basic-16 documents/docs/eu_agenda_on_security_en.pdf [Access date: 16 May, 2016] 17
European Commission, (2016). Communications from the Commission from the 18 Commission to the European Parliament, The European Council and the Council: 19 Delivering on the European Agenda on Security to fight against terrorism and pave the 20 way towards an effective and genuine Security Union, COM(2016) 230 Final, 21 http://ec.europa.eu/dgs/home-affairs/what-we-do/policies/european-agenda-22 security/legislative-23 documents/docs/20160420/communication_eas_progress_since_april_2015_en.pdf 24 [Access date: 16 May, 2016] 25
Frevel (2013) Managing urban safety and security in Germany: Institutional responsibility and 26 individual competence, European Journal of Criminology, 10(3), 354-367. 27 (http://euc.sagepub.com/content/10/3/354.full.pdf+html), Accessed 10/06/2016 28
Friesen, K., (2007). The Effects of the Madrid and London Subway Bombings On 29 Europe’s View of Terrorism, Review Digest: Human Rights and the War on Terror, 30 Supplement: S10-S17; 31 http://www.du.edu/korbel/hrhw/researchdigest/terror/europe_2007.pdf [Access date: 16 32 May, 2016] 33
Global Terrorism Database (2016). https://www.start.umd.edu/gtd/ [Access date: 16 May, 34 2016] 35
Grega, M., Matiolański, A., Guzik, P., & Leszczuk, M. (2016). Automated detection of 36 firearms and knives in a CCTV image. Sensors (Switzerland), 16(1). 37 doi:10.3390/s16010047 38
Louviere, J. Experimental choice analysis: introduction and overview. Journal of Business 39 Research Vol 24, 1992, pp 89–96. 40
Louviere, J., Woodworth, G. (1983). Design and analysis of simulated consumer choice or 41 allocation experiments: an approach based on aggregated data. Journal of Marketing 42 Research 20, 350–367. 43
Louviere, J.J., Hensher, D.A., Swait, J.D. (2000). Stated Choice Methods: Analysis and 44 Application. Cambridge Press, Cambridge. 45
Marschak, J. Binary choice constraints and random utility indicators. In Marschak, J. 46 (1974) Economic Information, Decision and Prediction: Selected Essays (Volume 1). D. 47

Patil, Patruni, Potoglou, Robinson 27
Reidel, Dordrecht. 1960. 1 McFadden, D. L. Modelling the choice of residential location. In: Karlqvist, A., 2
Lundqvist, L., Snickars, F., Weibull, J.W. (eds) Spatial interaction theory and planning 3 models. North-Holland, Amsterdam, 1978. pp. 75–96. 4
Mitrou, L., Drogkaris, P., & Leventakis, G. (2014). Legal and Social Aspects of Surveillance 5 Technologies: CCTV in Greece? Perspectives on Surveillance, 39. http://p-react.eu/wp-6 content/uploads/C1.pdf, Accessed on May 26, 2016. 7
Nordfjærn, T., Şimşekoǧlu, Ö., Lind, H. B., Jørgensen, S. H., & Rundmo, T. (2014). 8 Transport priorities, risk perception and worry associated with mode use and preferences 9 among Norwegian commuters. Accident Analysis and Prevention, 72, 391-400. 10 doi:10.1016/j.aap.2014.07.028 11
PACT D2.3 Report on the analysis of pilot data. PACT project –GA:285635 12 http://www.projectpact.eu/deliverables/wp2-survey-design. Accessed Jul 31, 2014 13
PACT D3.2 Sampling report. PACT project –GA:285635 14 http://www.projectpact.eu/deliverables/wp3-fieldwork. Accessed Jul 31, 2014 15
PACT D4.1 Headline Findings PACT project –GA:285635 16 www.projectpact.eu/deliverables/wp4-data-analysis. Accessed Jul 31, 2014 17
Patil, S., Potoglou, D., Lu, H., Robinson, N., & Burge, P. (2014). Trade-off Across 18 Privacy, Security and Surveillance in the Case of Metro Travel in Europe. Transportation 19 Research Procedia, 1(1), 121-132. doi:http://dx.doi.org/10.1016/j.trpro.2014.07.013 20
Potoglou, D., Robinson, N., Kim, C. W., Burge, P., & Warnes, R. (2010). Quantifying 21 individuals’ trade-offs between privacy, liberty and security: The case of rail travel in 22 UK. Transportation Research Part A: Policy and Practice, 44(3), 169-181. 23 doi:http://dx.doi.org/10.1016/j.tra.2009.12.006 24
Robinson, N. Potoglou, D. Kim, C. W. Burge, P. and Warnes, R. (2010) Security, At What Cost? 25 Quantifying people's trade-offs across liberty, privacy and security RAND; TR-664-RE (2010) 26 Santa Monica 27 Ryan, M., Bate, A., Eastmond, C.J., Ludbrook, A. (2001). Use of discrete choice 28
experiment to elicit preferences. Quality in Health Care 10, i55–i60. 29 Sahm, C. (2006). Hard won lessons: Transit security. Safe cities project, Manhattan 30
Institute, New York, http://www.policyarchive.org/handle/10207/bitstreams/14759.pdf 31 [Access date: 16/05/2016] 32
Samatas, M. (2002). Studying surveillance in Greece: Methodological and other problems related 33 to an authoritarian surveillance culture. Surveillance & Society, 3(2/3). 34 Samatas, M. (2008). From thought control to traffic control: CCTV politics of expansion and 35 resistance in post-Olympics Greece. Sociology of Crime Law and Deviance, 10, 345-369. 36 Solove, D., Nothing to hide. The False tradeoff between privacy and security, Yale 37
University Press, New Haven. 2011. 38 TfL (2016). Transport for London: CCTV, https://tfl.gov.uk/corporate/privacy-and-39
cookies/cctv [Access date: 16 May, 2016] 40 The Local (2016). How France will boost security after Brussels attacks, 22 March 2016: 41
http://www.thelocal.fr/20160322/france-tightens-security-at-airport-and-stations-after-42 brussels-blasts 43
Turley, C. and Stone, V., (2006a). Security screening trial at Heathrow Express, 44 Department for Transport, London. 45
Turley, C. and Stone, V., (2006b). Sniffer Dogs Trials (London and Brighton), 46 Department for Transport, London. 47

Patil, Patruni, Potoglou, Robinson 28 Veisten, K., Flügel, S., Bjørnskau, T. (2011). Public’s Trade-off between a New Risk-1
based Airport Screening and Asserted Terror Risk Impact: A Stated Choice Survey from 2 Norway, Journal of Transportation Technologies, 1(2), 11-20, 3 doi:10.4236/jtts.2011.12003 4